Long-Term Efficacy and Safety of Pemafibrate, a Novel Selective Peroxisome Proliferator-Activated Receptor-α Modulator (SPPARMα), in Dyslipidemic Patients with Renal Impairment

Abstract
:1. Introduction
2. Results
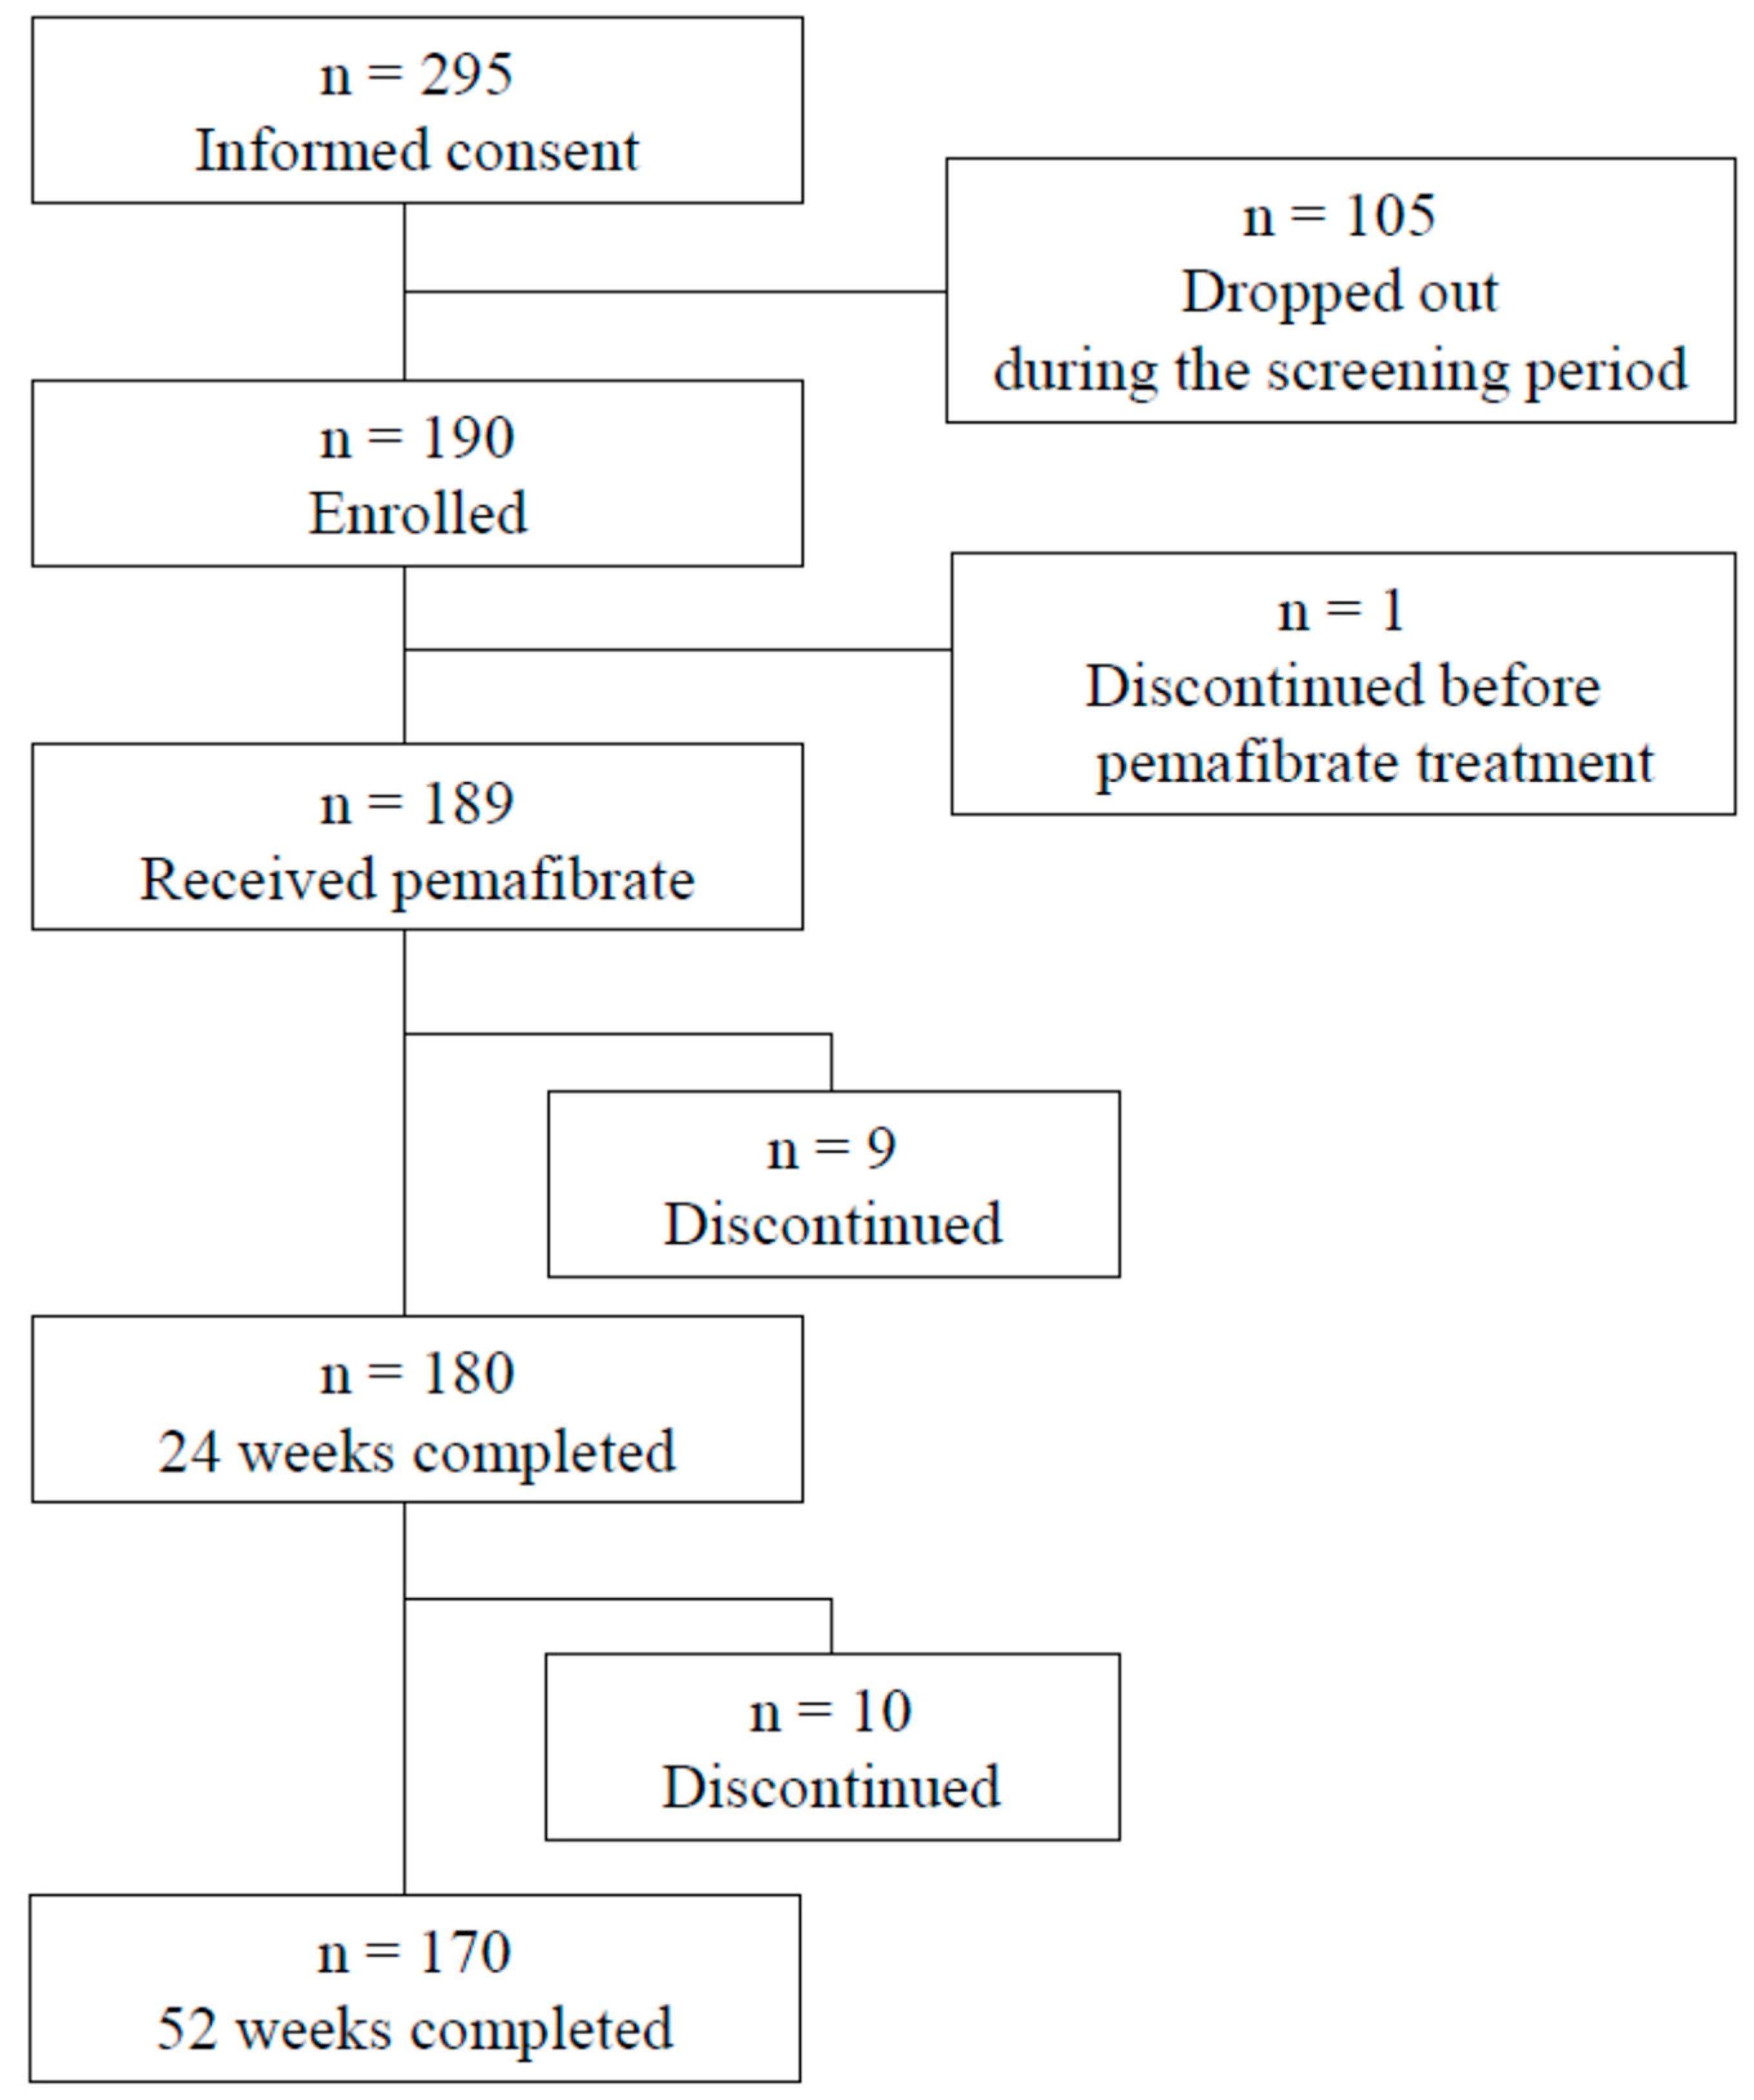
2.1. Patients
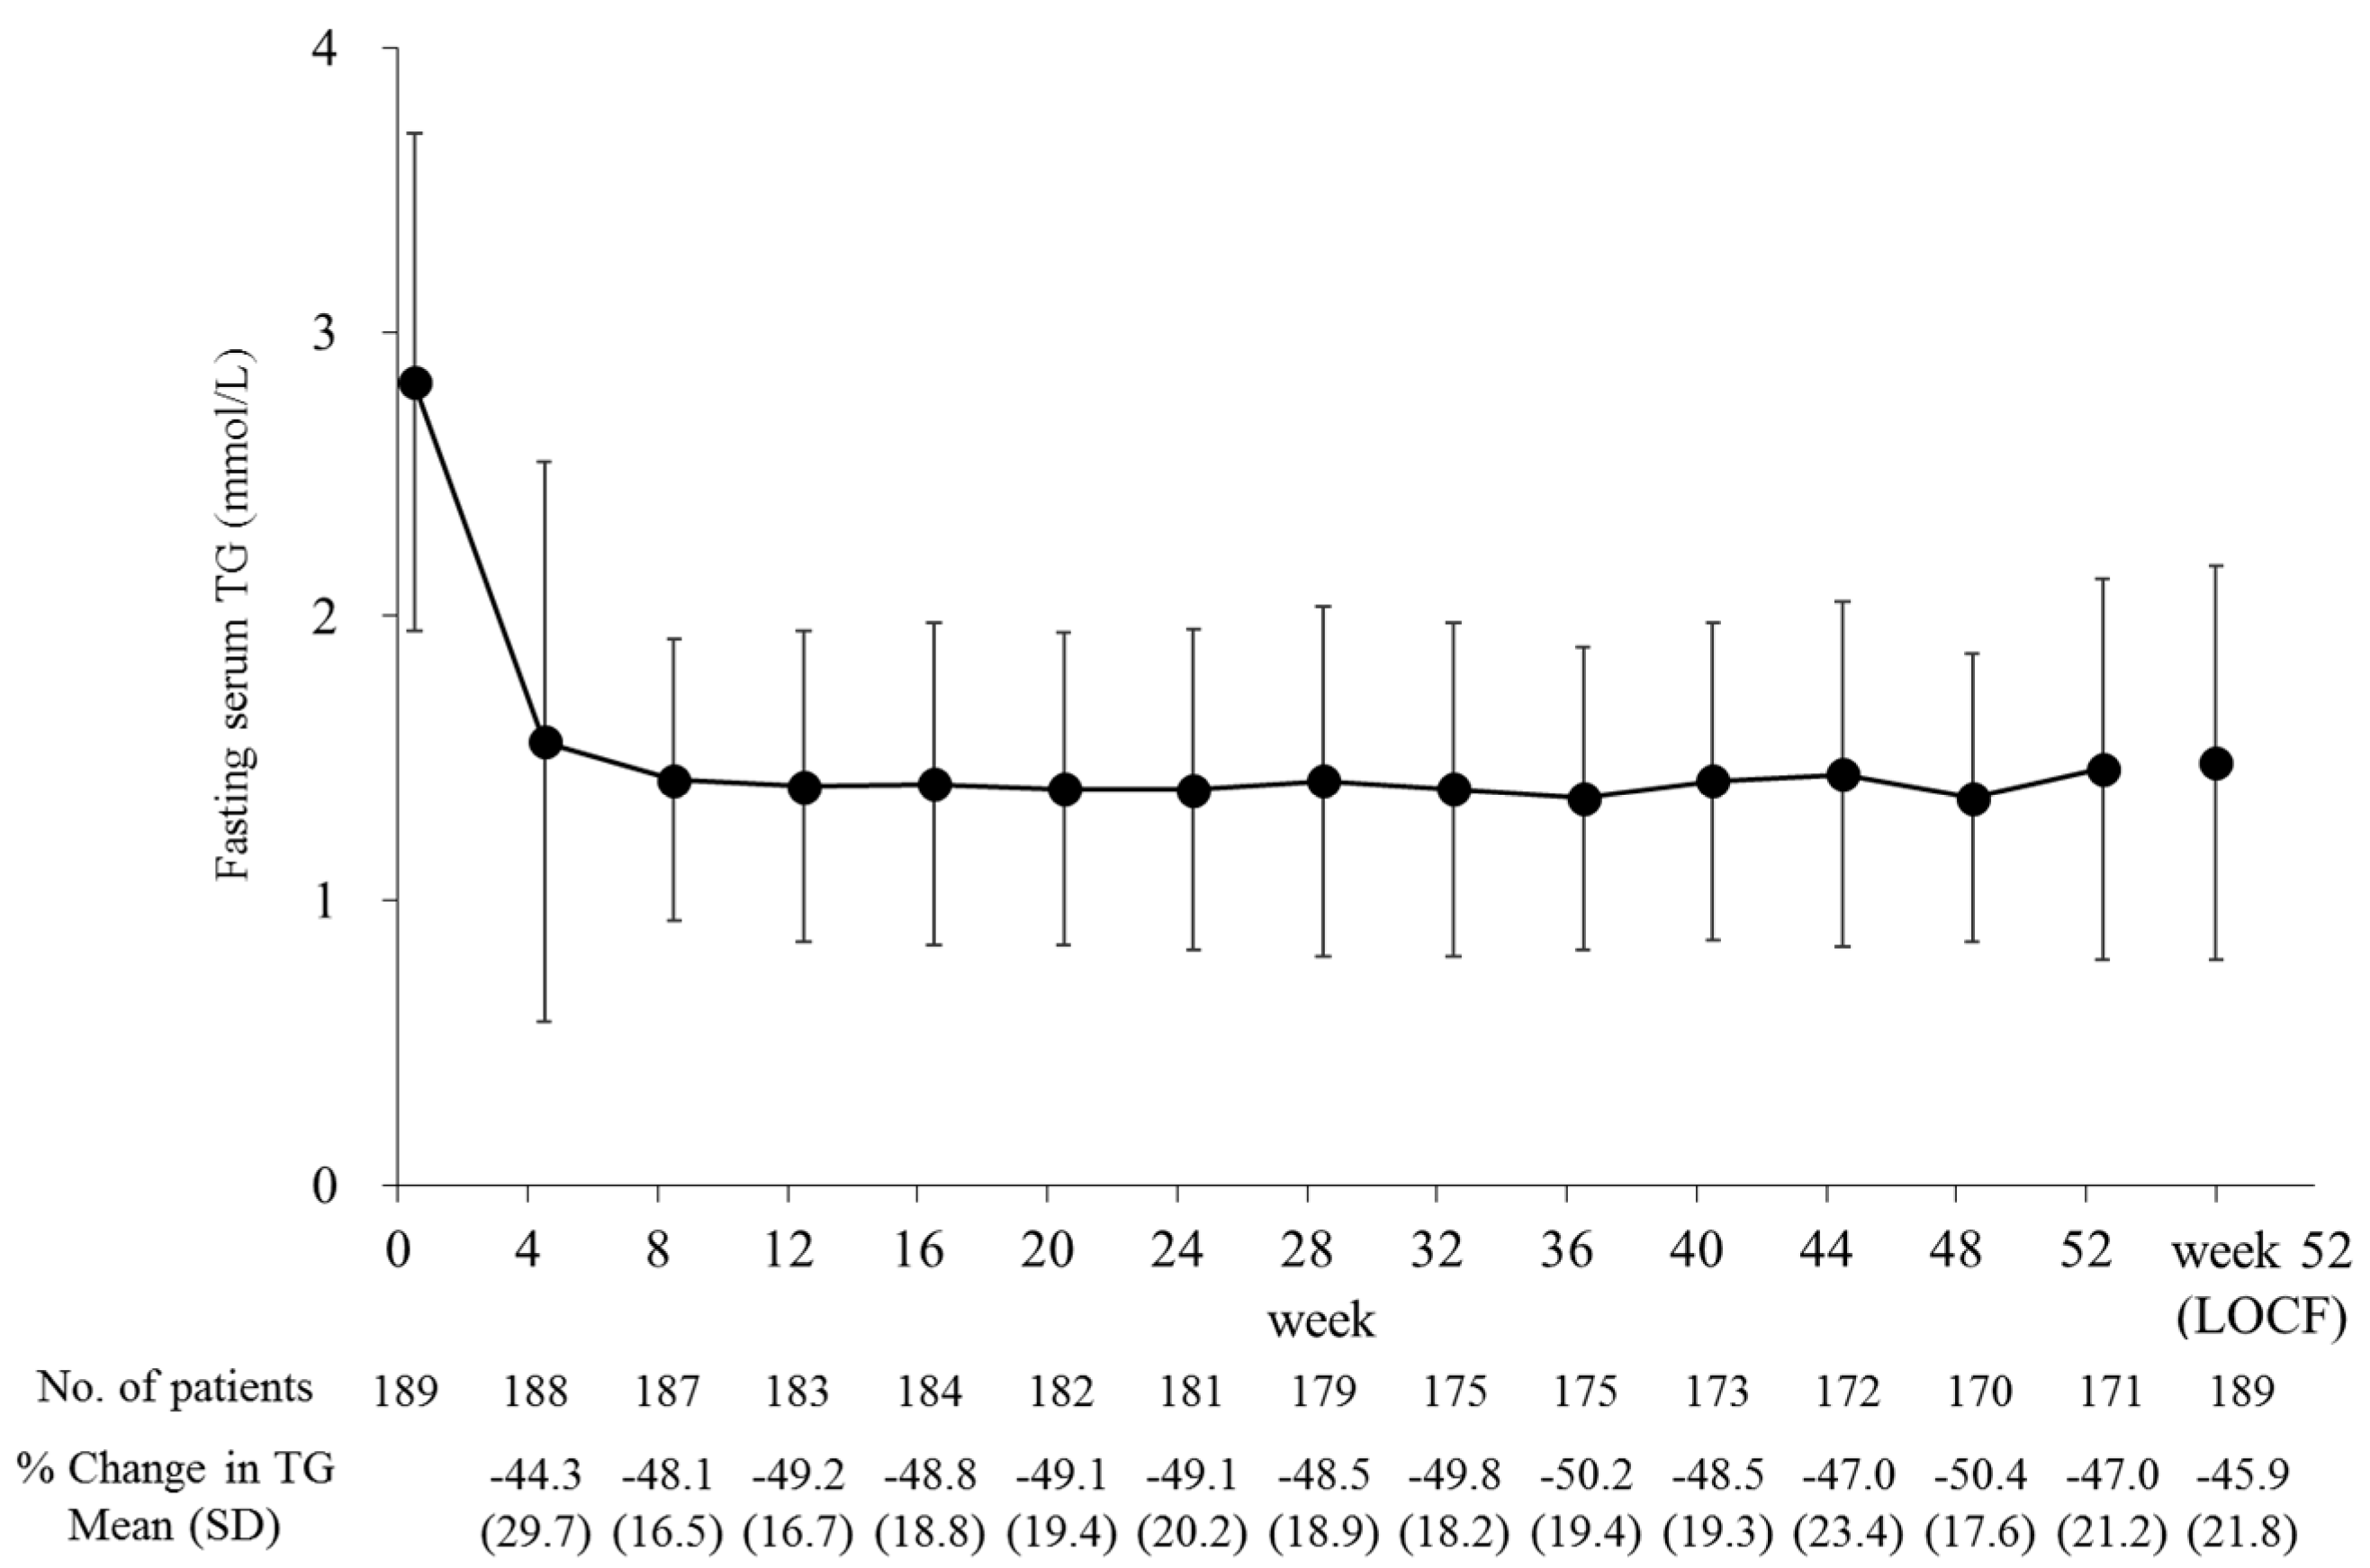
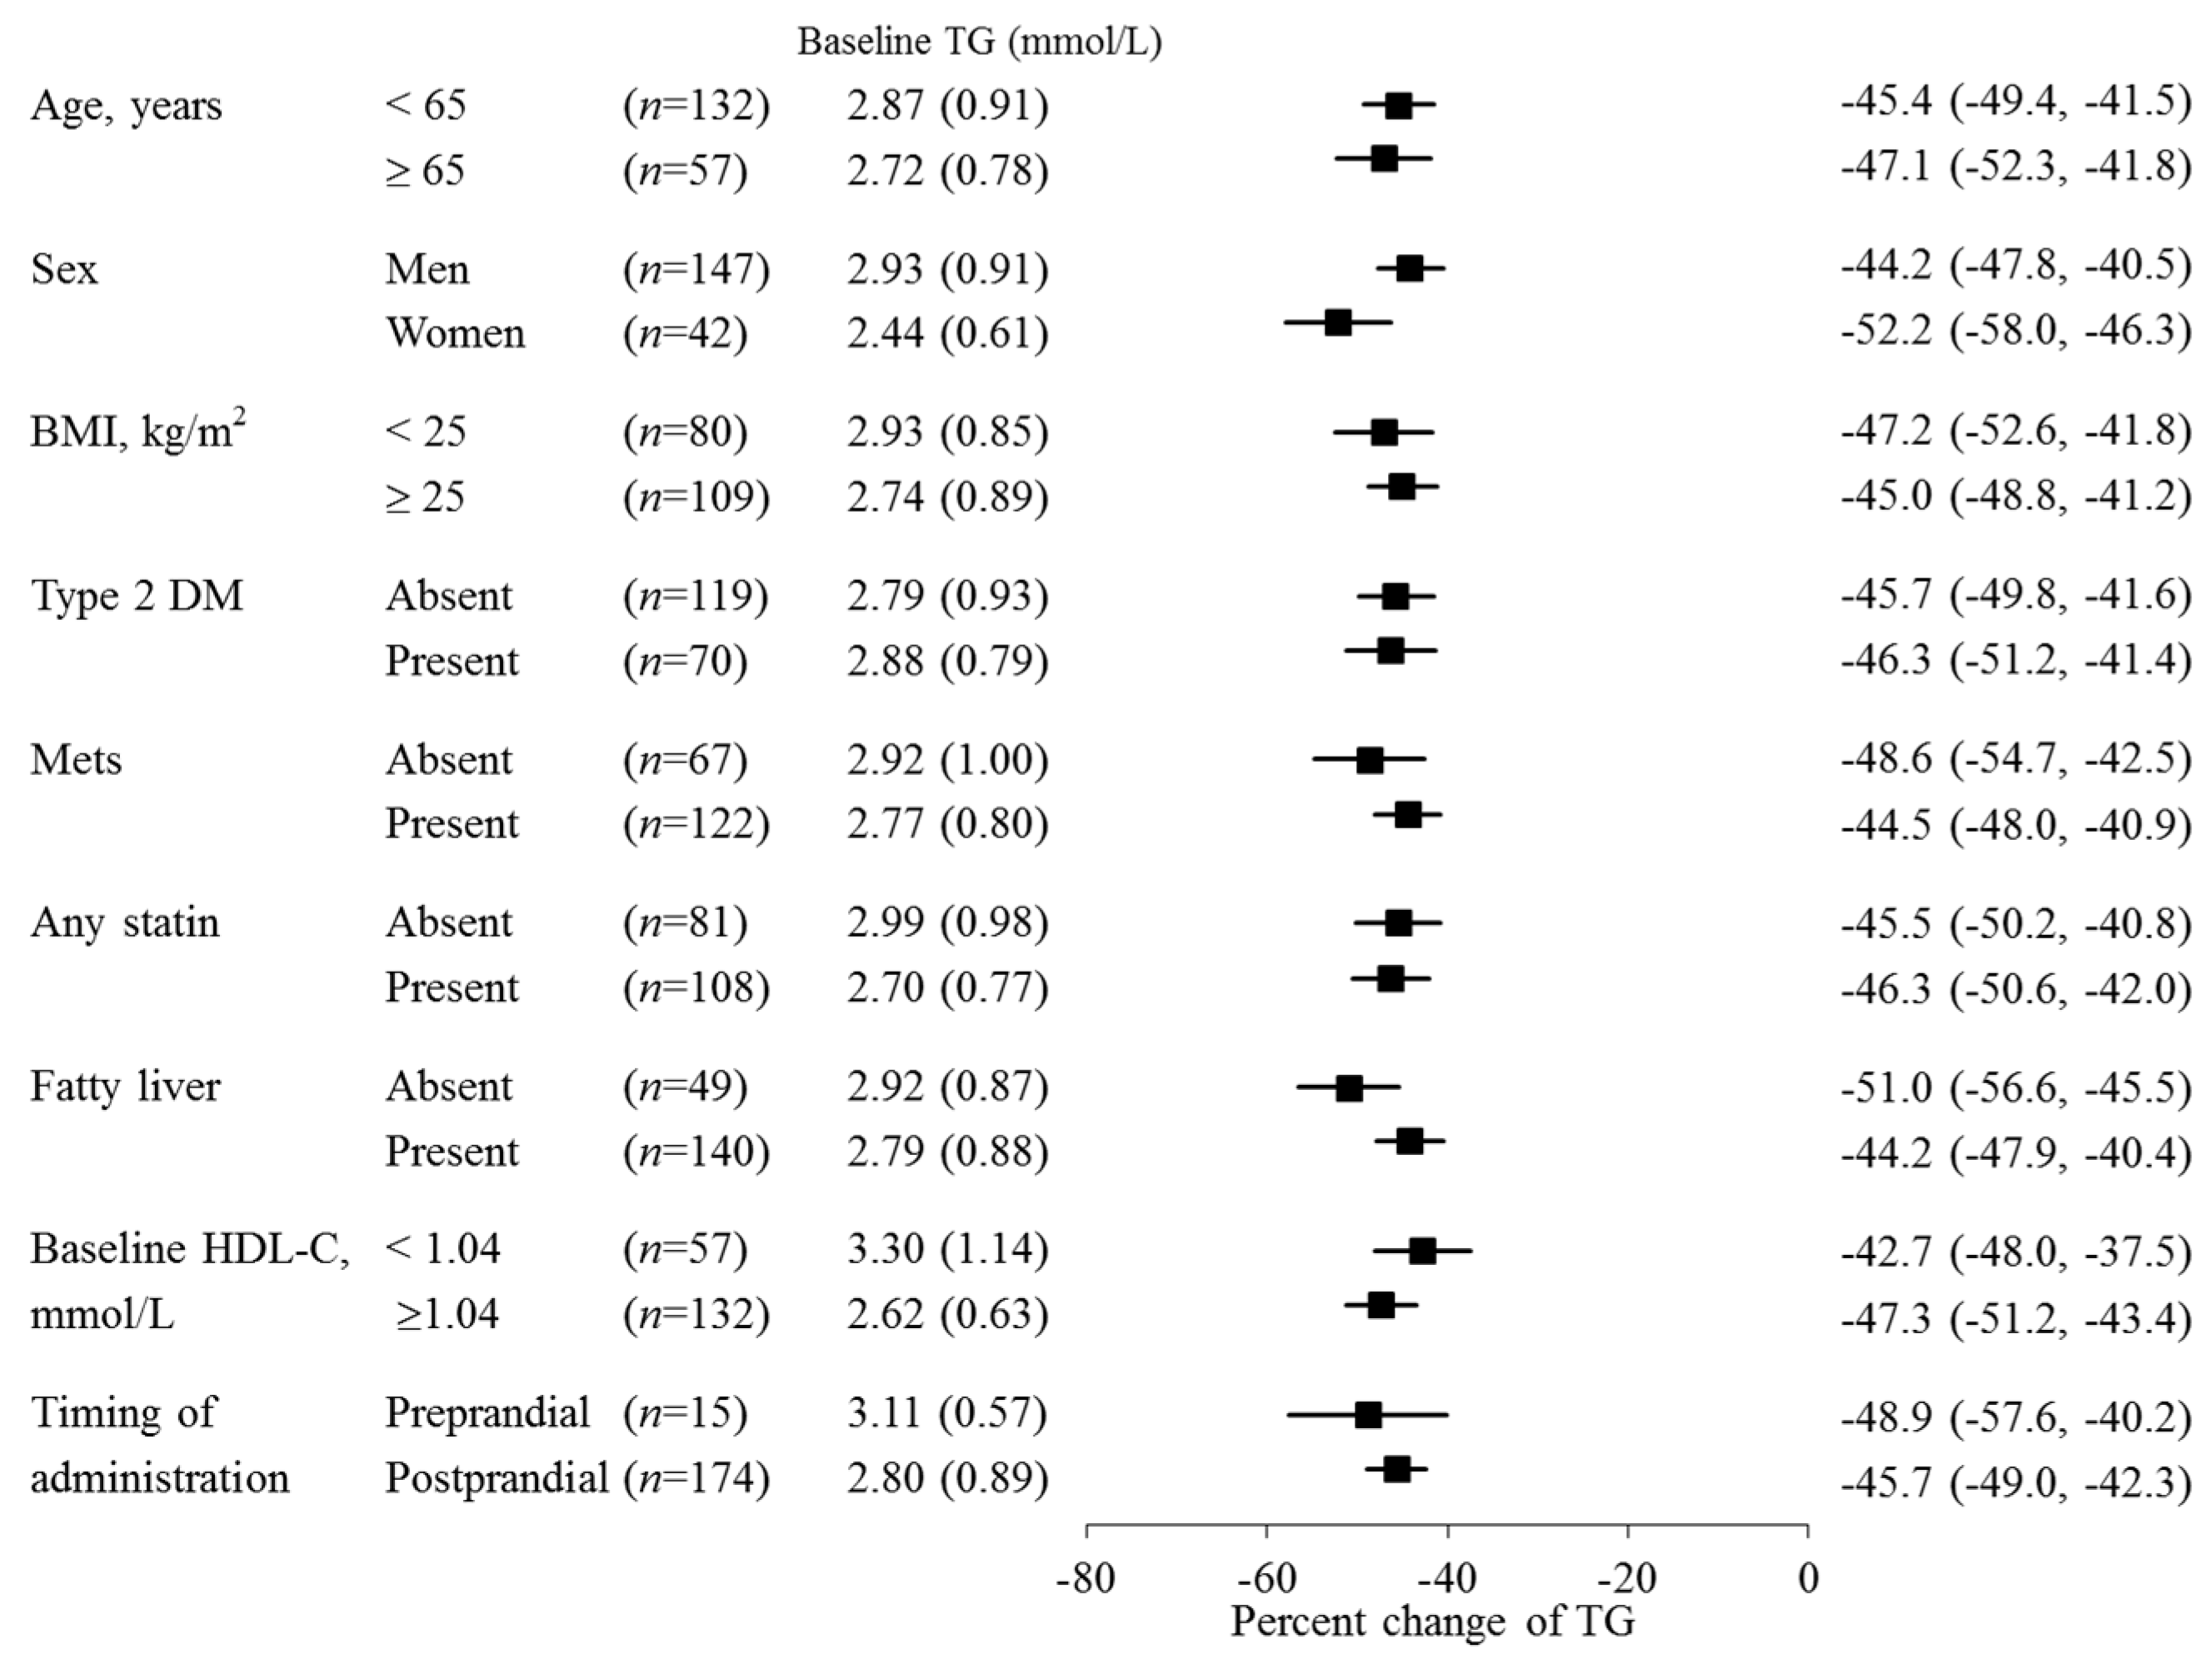
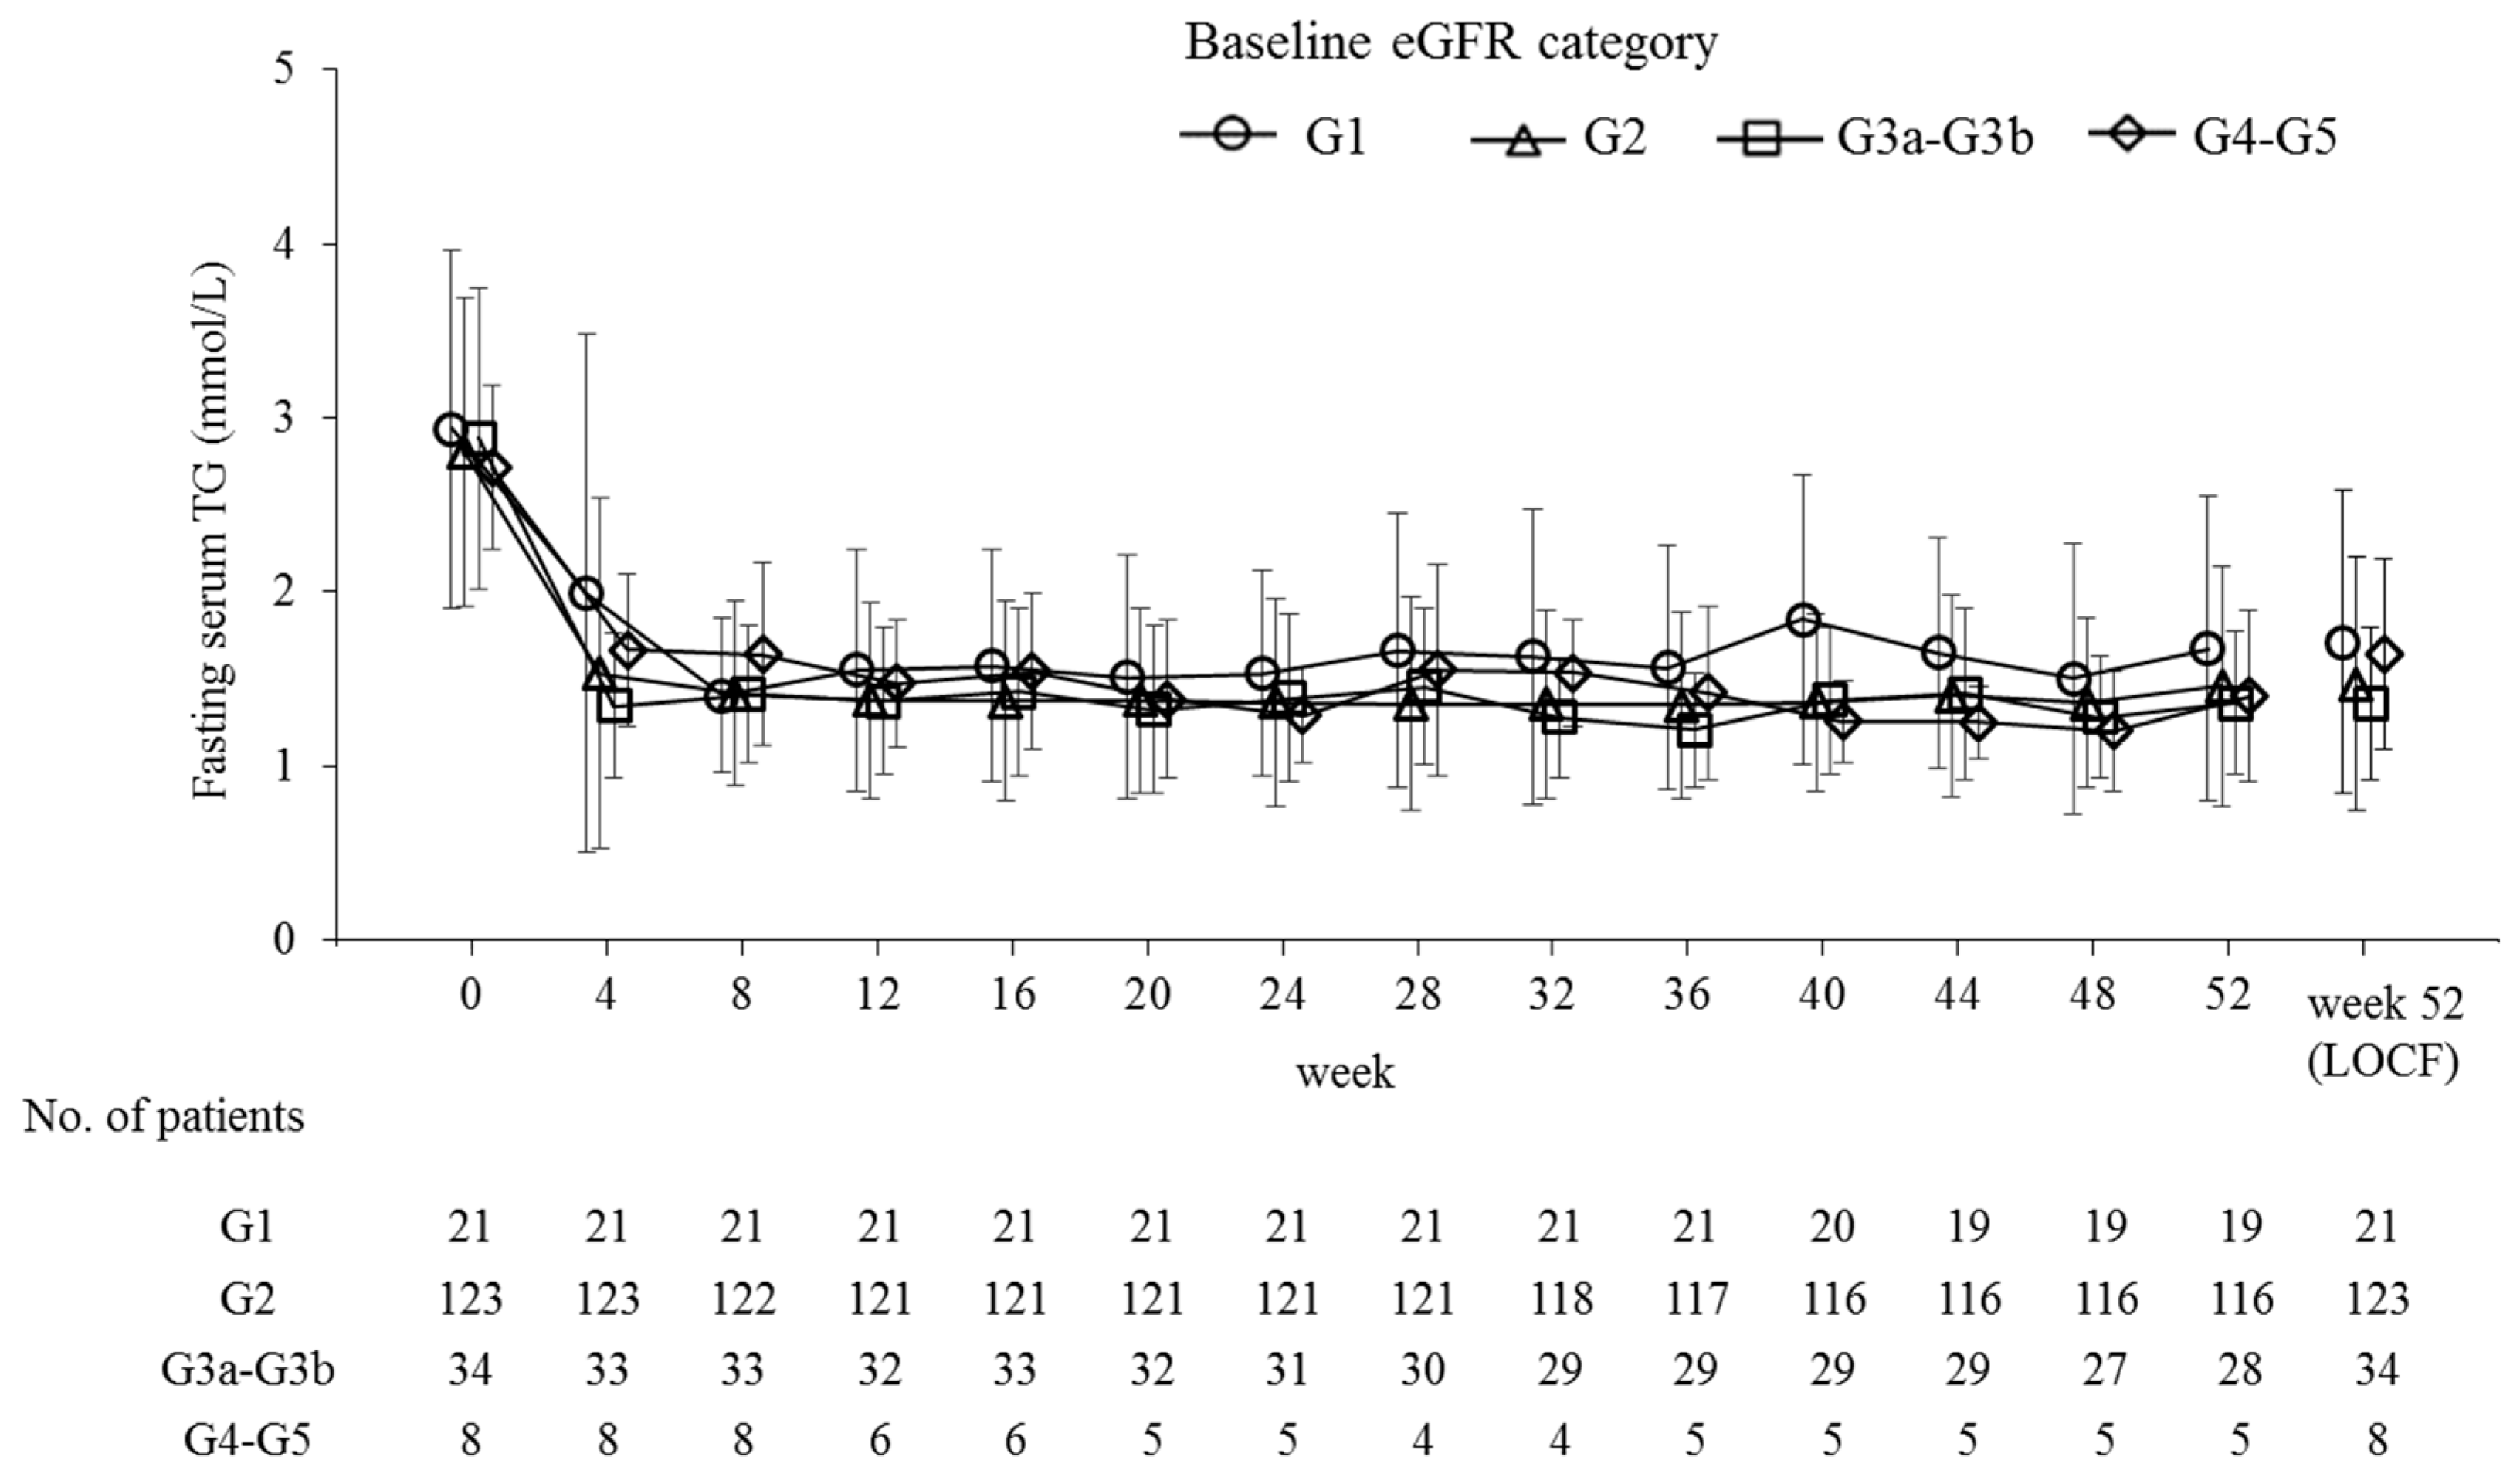
2.2. Efficacy
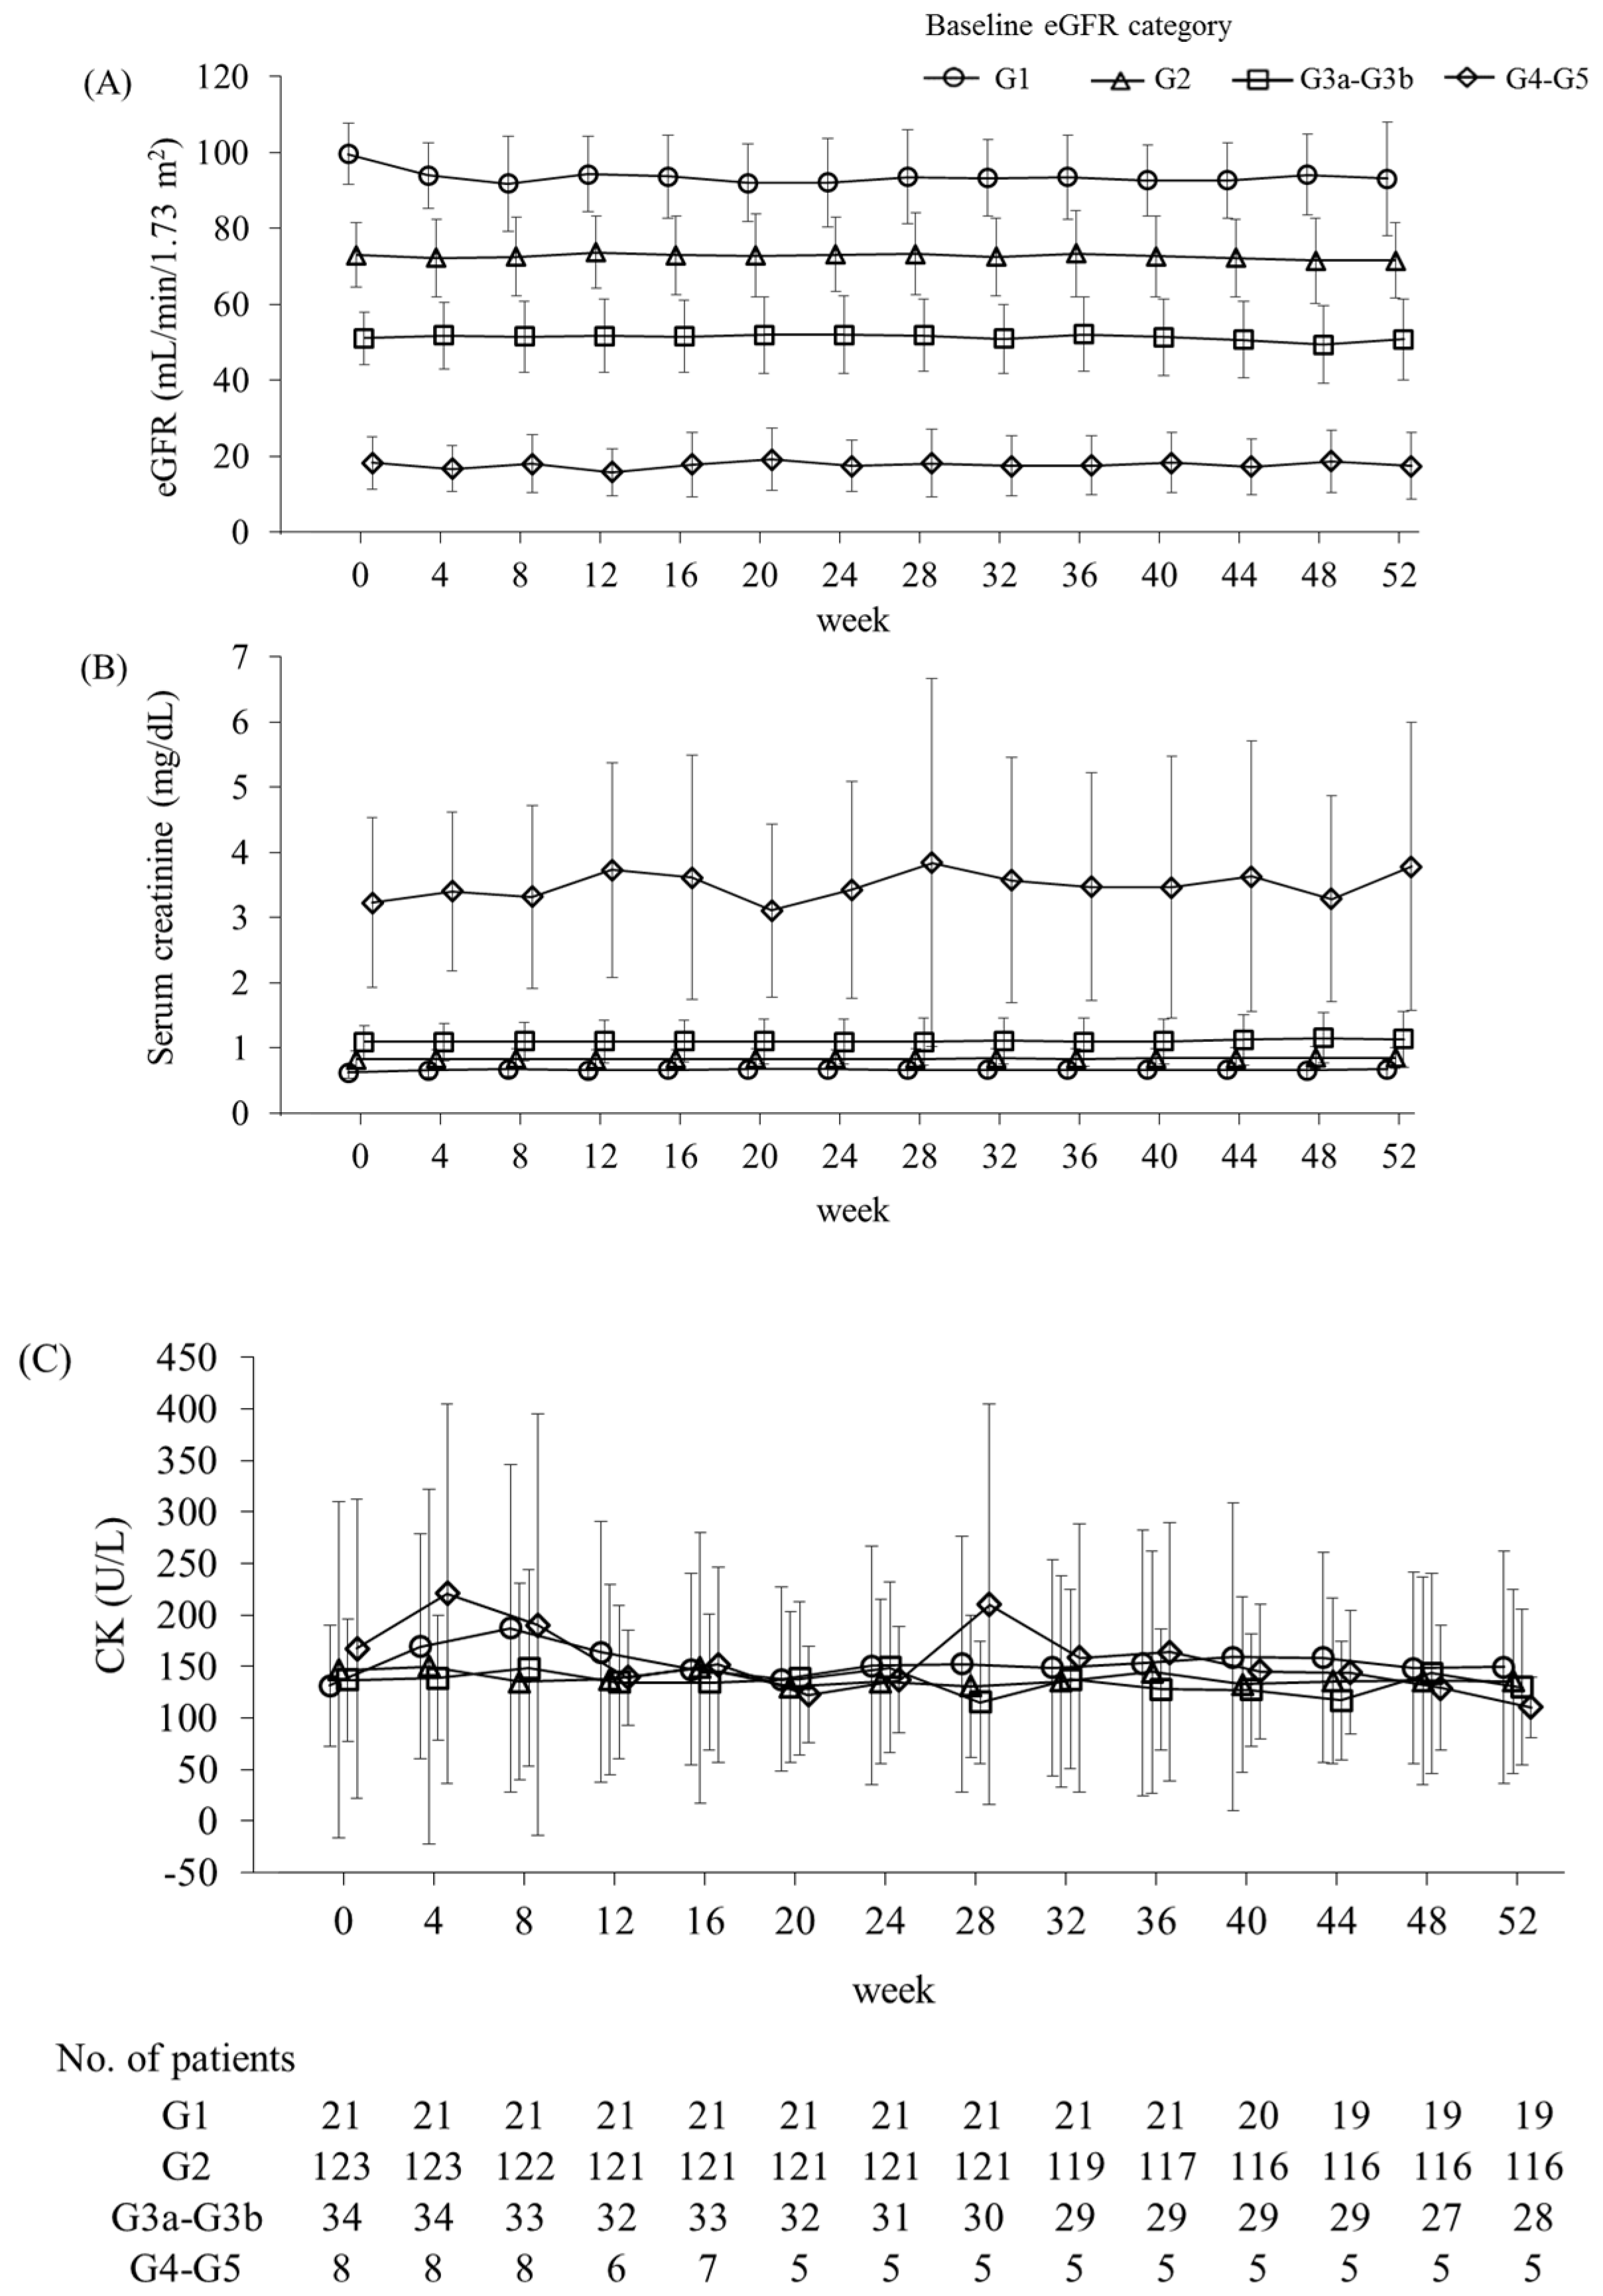
2.3. Safety
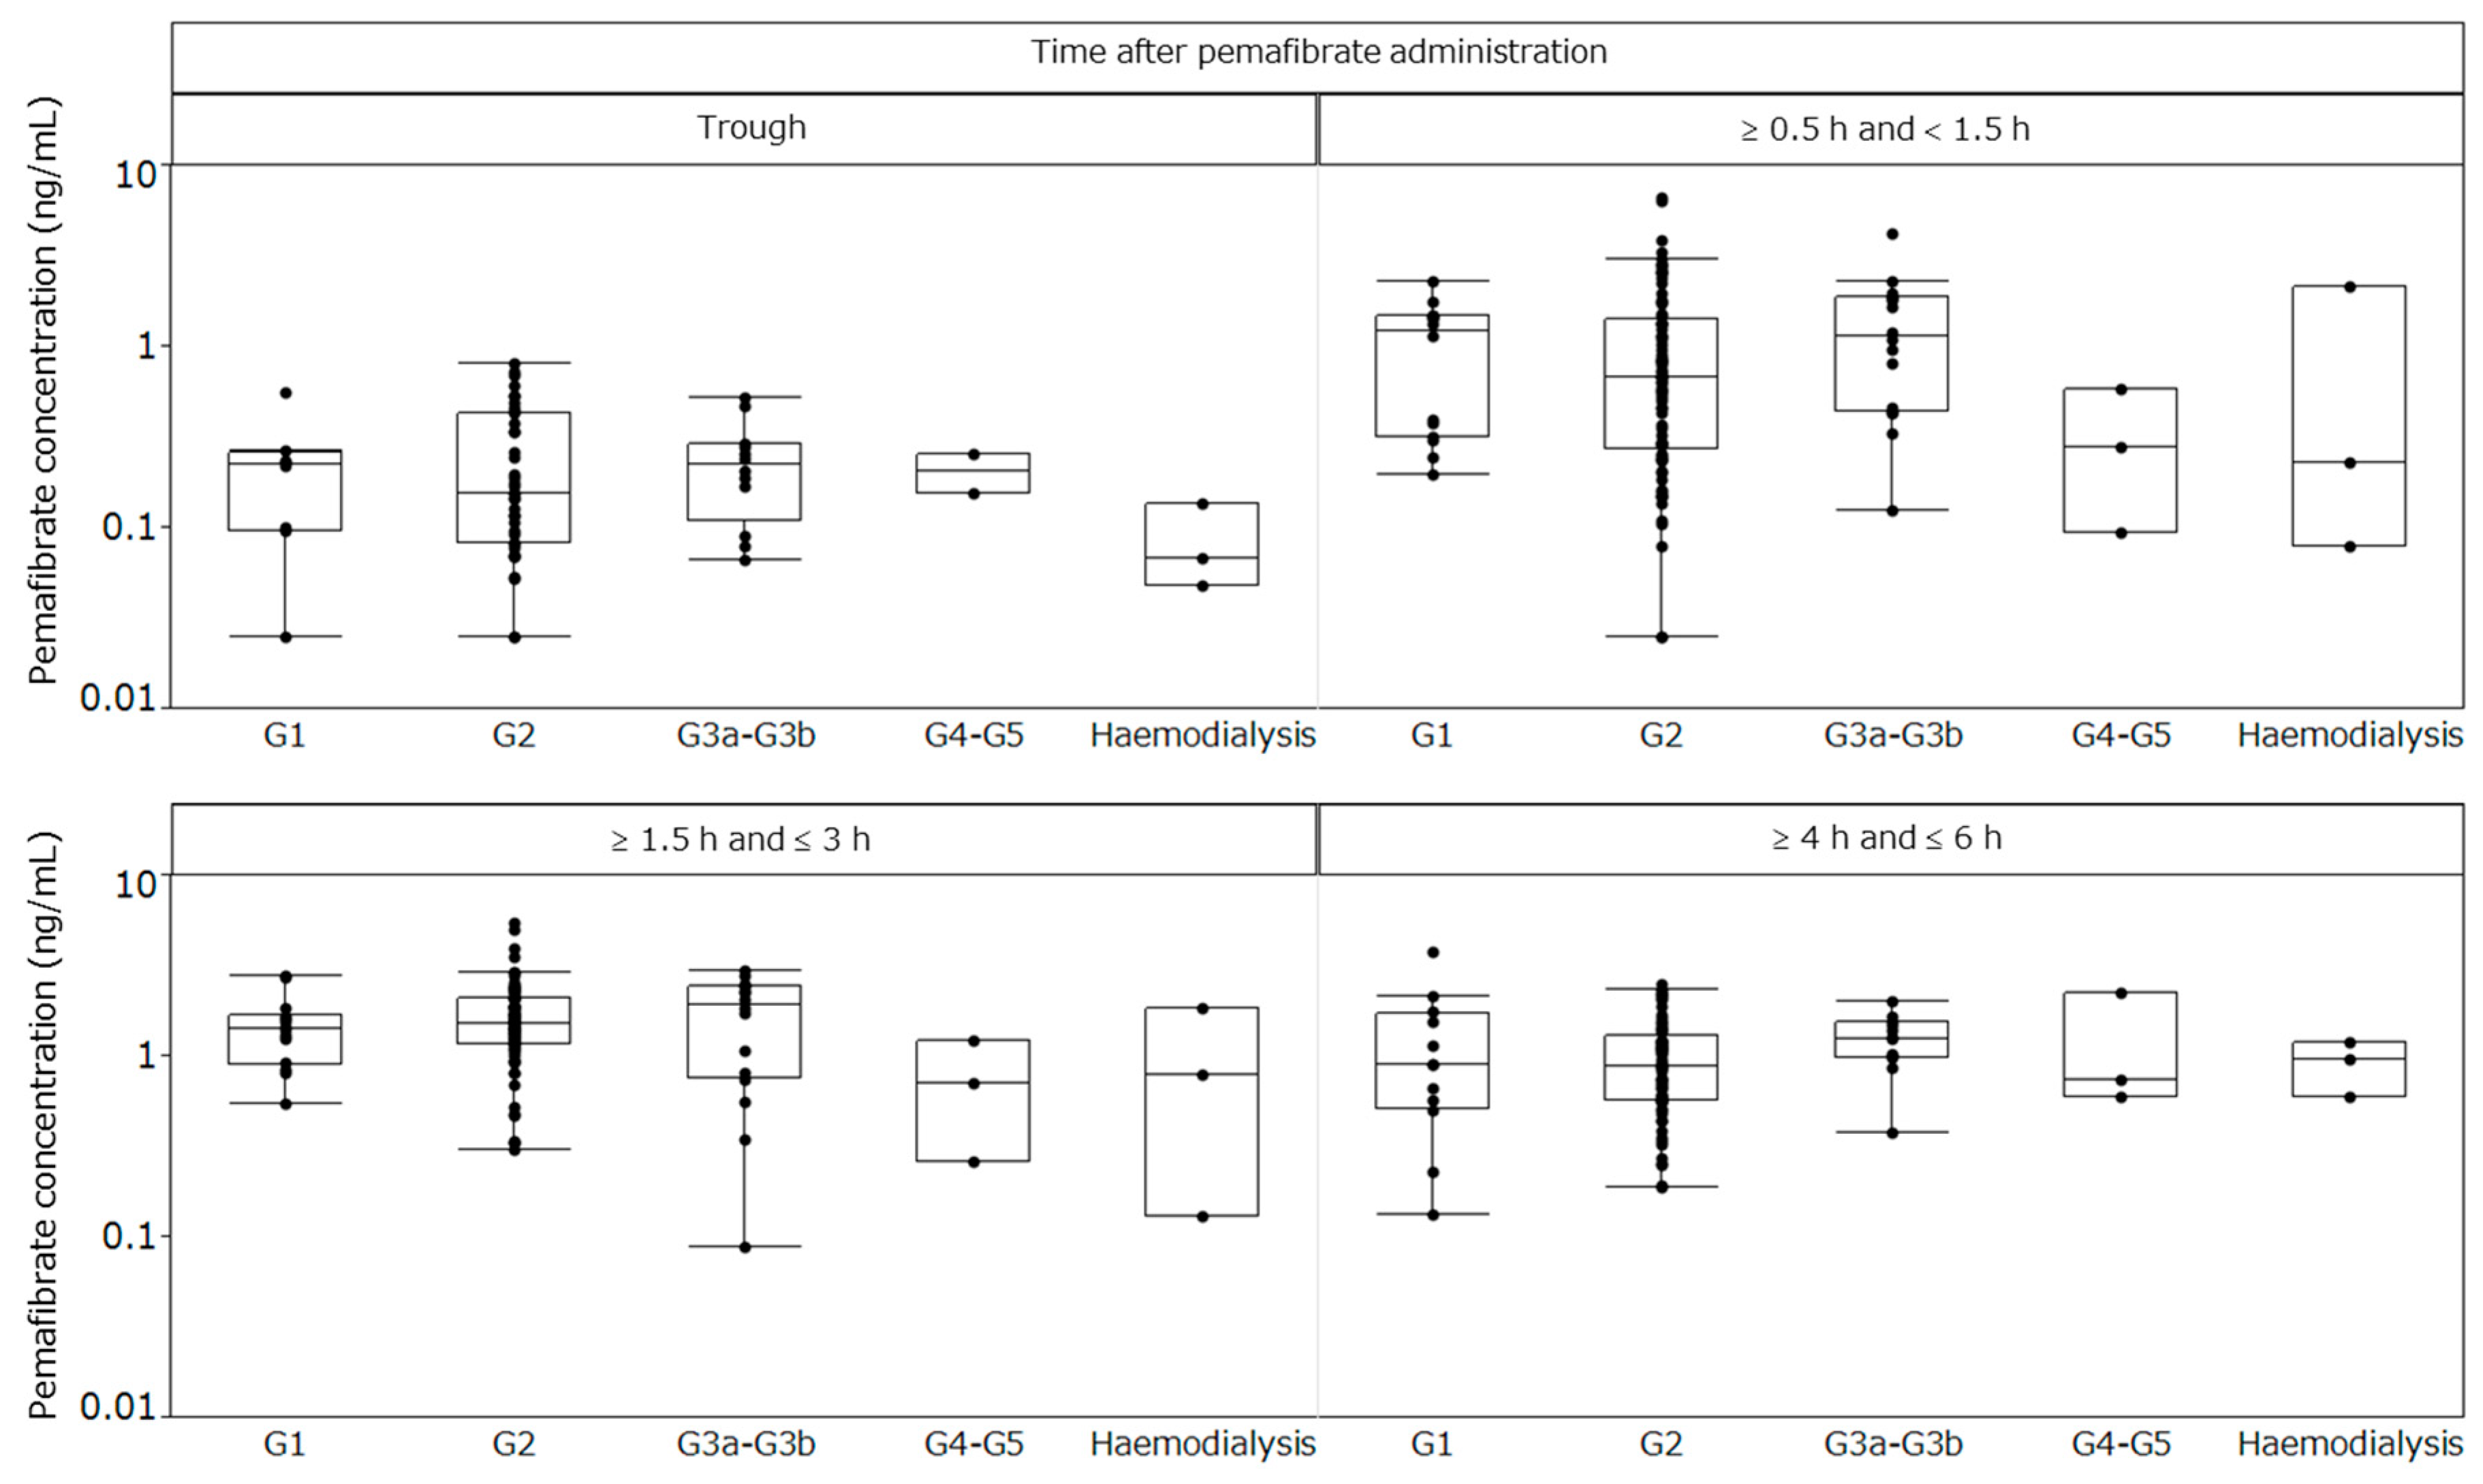
2.4. Plasma Concentrations
3. Discussion
4. Subjects and Methods
5. Conclusions
Author Contributions
Funding
Acknowledgments
Conflicts of Interest
Abbreviations
| ADR | Adverse drug reaction |
| AE | Adverse event |
| ALP | Akaline phosphatase |
| ALT | Alanine aminotransferase |
| Apo | Apolipoprotein |
| ASCVD | Atherosclerotic cardiovascular disease |
| AST | Aspartate aminotransferase |
| CK | Creatine kinase |
| CKD | Chronic kidney disease |
| CM | Chylomicron |
| CM-C | CM-cholesterol |
| CVD | Cardiovascular disease |
| eGFR | Estimated glomerular filtration rate |
| GCP | Good Clinical Practice |
| HbA1c | Hemoglobin A1c |
| HDL | High-density lipoprotein |
| HDL-C | HDL cholesterol |
| HPLC | High-performance liquid chromatography |
| hsCRP | High-sensitivity C-reactive protein |
| ICH | International Conference on Harmonisation |
| IL-1β | Interleukin-1β |
| JAPIC | Japan Pharmaceutical Information Center |
| KDIGO | Kidney Disease Improving Global Outcomes |
| LCAT | Lecithin-cholesterol acyltransferase |
| LC-MS-MS | Liquid chromatography-tandem mass spectrometry |
| LDL | Low-density lipoprotein |
| LDL-C | LDL cholesterol |
| LOCF | Last-observation-carried-forward |
| LPL | Lipoprotein lipase |
| PPARα | Peroxisome proliferator-activated receptor α |
| RemL-C | Remnant lipoprotein cholesterol |
| SAE | Serious adverse event |
| SD | Standard deviation |
| SPPARMα | Selective peroxisome proliferator-activated receptor-α modulator |
| TC | Total cholesterol |
| TG | Triglyceride |
| ULN | Upper limit of normal |
| VLDL | Very-low-density lipoprotein |
| VLDL-C | VLDL-cholesterol |
| γ-GT | γ-Glutamyltransferase |
References
- Knopp, R.H. Drug treatment of lipid disorders. N. Engl. J. Med. 1999, 341, 498–511. [Google Scholar] [CrossRef] [PubMed]
- Murray, C.J.; Lopez, A.D. Mortality by cause for eight regions of the world: Global Burden of Disease Study. Lancet 1997, 349, 1269–1276. [Google Scholar] [CrossRef]
- Fruchart, J.C.; Sacks, F.M.; Hermans, M.P.; Assmann, G.; Brown, W.V.; Ceska, R.; Chapman, M.J.; Dodson, P.M.; Fioretto, P.; Ginsberg, H.N.; et al. The Residual Risk Reduction Initiative: A call to action to reduce residual vascular risk in dyslipidaemic patient. Diabetes Vasc. Dis. Res. 2008, 5, 319–335. [Google Scholar] [CrossRef] [PubMed]
- Chapman, M.J.; Redfern, J.S.; McGovern, M.E.; Giral, P. Niacin and fibrates in atherogenic dyslipidemia: Pharmacotherapy to reduce cardiovascular risk. Pharmacol. Ther. 2010, 126, 314–345. [Google Scholar] [CrossRef] [PubMed]
- Matsushita, K.; van der Velde, M.; Astor, B.C.; Woodward, M.; Levey, A.S.; de Jong, P.E.; Coresh, J.; Gansevoort, R.T. Association of estimated glomerular filtration rate and albuminuria with all-cause and cardiovascular mortality in general population cohorts: A collaborative meta-analysis. Lancet 2010, 375, 2073–2081. [Google Scholar] [CrossRef] [PubMed]
- Levey, A.S.; de Jong, P.E.; Coresh, J.; El Nahas, M.; Astor, B.C.; Matsushita, K.; Gansevoort, R.T.; Kasiske, B.L.; Eckardt, K.U. The definition, classification, and prognosis of chronic kidney disease: A KDIGO Controversies Conference report. Kidney Int. 2011, 80, 17–28. [Google Scholar] [CrossRef] [PubMed]
- Vaziri, N.D. Dyslipidemia of chronic renal failure: The nature, mechanisms, and potential consequences. Am. J. Physiol. Ren. Physiol. 2006, 290, F262–F272. [Google Scholar] [CrossRef] [PubMed]
- Okopien, B.; Buldak, L.; Boldys, A. Fibrates in the management of atherogenic dyslipidemia. Expert Rev. Cardiovasc. Ther. 2017, 15, 913–921. [Google Scholar] [CrossRef] [PubMed]
- Williams, A.J.; Baker, F.; Walls, J. The short term effects of bezafibrate on the hypertriglyceridaemia of moderate to severe uraemia. Br. J. Clin. Pharmacol. 1984, 18, 361–367. [Google Scholar] [CrossRef] [PubMed]
- Lipscombe, J.; Lewis, G.F.; Cattran, D.; Bargman, J.M. Deterioration in renal function associated with fibrate therapy. Clin. Nephrol. 2001, 55, 39–44. [Google Scholar] [PubMed]
- Broeders, N.; Knoop, C.; Antoine, M.; Tielemans, C.; Abramowicz, D. Fibrate-induced increase in blood urea and creatinine: Is gemfibrozil the only innocuous agent? Nephrol. Dial. Transplant. 2000, 15, 1993–1999. [Google Scholar] [CrossRef] [PubMed]
- McQuade, C.R.; Griego, J.; Anderson, J.; Pai, A.B. Elevated serum creatinine levels associated with fenofibrate therapy. Am. J. Health Syst. Pharm. 2008, 65, 138–141. [Google Scholar] [CrossRef] [PubMed]
- Ritter, J.L.; Nabulsi, S. Fenofibrate-Induced elevation in serum creatinine. Pharmacotherapy 2001, 21, 1145–1149. [Google Scholar] [CrossRef] [PubMed]
- Mottl, A.K.; Buse, J.B.; Ismail-Beigi, F.; Sigal, R.J.; Pedley, C.F.; Papademetriou, V.; Simmons, D.L.; Katz, L.; Mychaleckyj, J.C.; Craven, T.E. Long-Term Effects of Intensive Glycemic and Blood Pressure Control and Fenofibrate Use on Kidney Outcomes. Clin. J. Am. Soc. Nephrol. 2018, 13, 1693–1702. [Google Scholar] [CrossRef] [PubMed]
- Davidson, M.H.; Armani, A.; McKenney, J.M.; Jacobson, T.A. Safety considerations with fibrate therapy. Am. J. Cardiol. 2007, 99, 3c–18c. [Google Scholar] [CrossRef] [PubMed]
- Kostapanos, M.S.; Florentin, M.; Elisaf, M.S. Fenofibrate and the kidney: An overview. Eur. J. Clin. Investig. 2013, 43, 522–531. [Google Scholar] [CrossRef] [PubMed]
- Attridge, R.L.; Frei, C.R.; Ryan, L.; Koeller, J.; Linn, W.D. Fenofibrate-associated nephrotoxicity: A review of current evidence. Am. J. Health Syst. Pharm. 2013, 70, 1219–1225. [Google Scholar] [CrossRef] [PubMed]
- Catapano, A.L.; Graham, I.; De Backer, G.; Wiklund, O.; Chapman, M.J.; Drexel, H.; Hoes, A.W.; Jennings, C.S.; Landmesser, U.; Pedersen, T.R.; et al. 2016 ESC/EAS Guidelines for the Management of Dyslipidaemias: The Task Force for the Management of Dyslipidaemias of the European Society of Cardiology (ESC) and European Atherosclerosis Society (EAS) Developed with the special contribution of the European Assocciation for Cardiovascular Prevention & Rehabilitation (EACPR). Atherosclerosis 2016, 253, 281–344. [Google Scholar] [CrossRef]
- Catapano, A.L.; Graham, I.; De Backer, G.; Wiklund, O.; Chapman, M.J.; Drexel, H.; Hoes, A.W.; Jennings, C.S.; Landmesser, U.; Pedersen, T.R.; et al. 2016 ESC/EAS Guidelines for the Management of Dyslipidaemias. Eur. Heart J. 2016, 37, 2999–3058. [Google Scholar] [CrossRef]
- Graham, D.J.; Staffa, J.A.; Shatin, D.; Andrade, S.E.; Schech, S.D.; La Grenade, L.; Gurwitz, J.H.; Chan, K.A.; Goodman, M.J.; Platt, R. Incidence of hospitalized rhabdomyolysis in patients treated with lipid-lowering drugs. JAMA 2004, 292, 2585–2590. [Google Scholar] [CrossRef]
- Yamazaki, Y.; Abe, K.; Toma, T.; Nishikawa, M.; Ozawa, H.; Okuda, A.; Araki, T.; Oda, S.; Inoue, K.; Shibuya, K.; et al. Design and synthesis of highly potent and selective human peroxisome proliferator-activated receptor alpha agonists. Bioorg. Med. Chem. Lett. 2007, 17, 4689–4693. [Google Scholar] [CrossRef] [PubMed]
- Ishibashi, S.; Yamashita, S.; Arai, H.; Araki, E.; Yokote, K.; Suganami, H.; Fruchart, J.C.; Kodama, T. Effects of K-877, a novel selective PPARalpha modulator (SPPARMalpha), in dyslipidaemic patients: A randomized, double blind, active- and placebo-controlled, phase 2 trial. Atherosclerosis 2016, 249, 36–43. [Google Scholar] [CrossRef]
- Arai, H.; Yamashita, S.; Yokote, K.; Araki, E.; Suganami, H.; Ishibashi, S. Efficacy and safety of K-877, a novel selective peroxisome proliferator-activated receptor alpha modulator (SPPARMalpha), in combination with statin treatment: Two randomised, double-blind, placebo-controlled clinical trials in patients with dyslipidaemia. Atherosclerosis 2017, 261, 144–152. [Google Scholar] [CrossRef] [PubMed]
- Ishibashi, S.; Arai, H.; Yokote, K.; Araki, E.; Suganami, H.; Yamashita, S. Efficacy and safety of pemafibrate (K-877), a selective peroxisome proliferator-activated receptor alpha modulator, in patients with dyslipidemia: Results from a 24-week, randomized, double blind, active-controlled, phase 3 trial. J. Clin. Lipidol. 2018, 12, 173–184. [Google Scholar] [CrossRef] [PubMed]
- Araki, E.; Yamashita, S.; Arai, H.; Yokote, K.; Satoh, J.; Inoguchi, T.; Nakamura, J.; Maegawa, H.; Yoshioka, N.; Tanizawa, Y.; et al. Effects of Pemafibrate, a Novel Selective PPARalpha Modulator, on Lipid and Glucose Metabolism in Patients With Type 2 Diabetes and Hypertriglyceridemia: A Randomized, Double-Blind, Placebo-Controlled, Phase 3 Trial. Diabetes Care 2018, 41, 538–546. [Google Scholar] [CrossRef] [PubMed]
- Arai, H.; Yamashita, S.; Yokote, K.; Araki, E.; Suganami, H.; Ishibashi, S. Efficacy and Safety of Pemafibrate Versus Fenofibrate in Patients with High Triglyceride and Low HDL Cholesterol Levels: A Multicenter, Placebo-Controlled, Double-Blind, Randomized Trial. J. Atheroscler. Thromb. 2018, 25, 521–538. [Google Scholar] [CrossRef] [PubMed]
- Blair, H.A. Pemafibrate: First Global Approval. Drugs 2017, 77, 1805–1810. [Google Scholar] [CrossRef] [PubMed]
- Fruchart, J.C. Selective peroxisome proliferator-activated receptor alpha modulators (SPPARMalpha): The next generation of peroxisome proliferator-activated receptor alpha-agonists. Cardiovasc. Diabetol. 2013, 12, 82. [Google Scholar] [CrossRef] [PubMed]
- Fruchart, J.C. Pemafibrate (K-877), a novel selective peroxisome proliferator-activated receptor alpha modulator for management of atherogenic dyslipidaemia. Cardiovasc. Diabetol. 2017, 16, 124. [Google Scholar] [CrossRef] [PubMed]
- Hounslow, N.; Mair, S.; Suganami, H.; Nakamura, M. Pemafibrate Has High Bioavailability and is Principally Excreted via the Liver. Atheroscler. Suppl. 2018, 32, 157. [Google Scholar] [CrossRef]
- Hosford, D.; Gordon, G.; Suganami, H.; Nakamura, M. The Plasma Concentration and Pharmacokinetic Parameters of Pemafibrate Did Not Increase in a Creatinine Clearance-Dependent Manner. Atheroscler. Suppl. 2018, 32, 150. [Google Scholar] [CrossRef]
- Reiss, A.B.; Voloshyna, I.; De Leon, J.; Miyawaki, N.; Mattana, J. Cholesterol Metabolism in CKD. Am. J. Kidney Dis. 2015, 66, 1071–1082. [Google Scholar] [CrossRef] [PubMed]
- Molitch, M.E. Management of dyslipidemias in patients with diabetes and chronic kidney disease. Clin. J. Am. Soc. Nephrol. 2006, 1, 1090–1099. [Google Scholar] [CrossRef] [PubMed]
- Tsimihodimos, V.; Mitrogianni, Z.; Elisaf, M. Dyslipidemia associated with chronic kidney disease. Open Cardiovasc. Med. J. 2011, 5, 41–48. [Google Scholar] [CrossRef] [PubMed]
- Kaysen, G.A. Lipid-Lowering Therapy in CKD: Should We Use It and in Which Patients. Blood Purif. 2017, 43, 196–199. [Google Scholar] [CrossRef] [PubMed]
- Honda, H.; Hirano, T.; Ueda, M.; Kojima, S.; Mashiba, S.; Hayase, Y.; Michihata, T.; Shibata, T. High-Density Lipoprotein Subfractions and Their Oxidized Subfraction Particles in Patients with Chronic Kidney Disease. J. Atheroscler. Thromb. 2016, 23, 81–94. [Google Scholar] [CrossRef] [PubMed]
- Remick, J.; Weintraub, H.; Setton, R.; Offenbacher, J.; Fisher, E.; Schwartzbard, A. Fibrate therapy: An update. Cardiol. Rev. 2008, 16, 129–141. [Google Scholar] [CrossRef]
- Liang, C.C.; Wang, I.K.; Kuo, H.L.; Yeh, H.C.; Lin, H.H.; Liu, Y.L.; Hsu, W.M.; Huang, C.C.; Chang, C.T. Long-term use of fenofibrate is associated with increased prevalence of gallstone disease among patients undergoing maintenance hemodialysis. Ren. Fail. 2011, 33, 489–493. [Google Scholar] [CrossRef]
- Makowka, A.; Dryja, P.; Chwatko, G.; Bald, E.; Nowicki, M. Treatment of chronic hemodialysis patients with low-dose fenofibrate effectively reduces plasma lipids and affects plasma redox status. Lipids Health Dis. 2012, 11, 47. [Google Scholar] [CrossRef]
- Abdel Magid, A.M.; Abbassi, M.M.; Iskander, E.E.M.; Mohamady, O.; Farid, S.F. Randomized comparative efficacy and safety study of intermittent simvastatin versus fenofibrate in hemodialysis. J. Comp. Eff. Res. 2017, 6, 413–424. [Google Scholar] [CrossRef]
- FDA Approved Drug Products, AbbVie Inc. TRILIPIX (Fenofibric Acid) Capsule [Package Insert]. North Chicago, IL. 2018. Available online: https://www.accessdata.fda.gov/scripts/cder/daf/index.cfm?event=overview.process&applno=022224 (accessed on 1 February 2019).
- Desager, J.P.; Costermans, J.; Verberckmoes, R.; Harvengt, C. Effect of hemodialysis on plasma kinetics of fenofibrate in chronic renal failure. Nephron 1982, 31, 51–54. [Google Scholar] [CrossRef] [PubMed]
- MHRA, Actavis Group PTC ehf. BEZALIP [Summary of Product Characteristics]. Iceland. September 2016. Available online: http://www.mhra.gov.uk/spc-pil/?prodName=BEZALIP&subsName=&pageID=ThirdLevel&searchTerm=Bezalip#retainDisplay (accessed on 1 February 2019).
- Abshagen, U.; Kosters, W.; Kaufmann, B.; Lang, P.D. Pharmacokinetics of bezafibrate after single and multiple doses in the presence of renal failure. Klin. Wochenschr. 1980, 58, 889–896. [Google Scholar] [CrossRef] [PubMed]
- Anderson, P.; Norbeck, H.E. Clinical pharmacokinetics of bezafibrate in patients with impaired renal function. Eur. J. Clin. Pharmacol. 1981, 21, 209–214. [Google Scholar] [CrossRef]
- FDA Approved Drug Products, Parke-Davis, Division of Pfizer Inc. LOPID (Gemfibrozil Tables, USP) [Package Insert]. April 2018. Available online: https://www.accessdata.fda.gov/scripts/cder/daf/index.cfm?event=overview.process&applno=018422 (accessed on 1 February 2019).
- Furusyo, N.; Ai, M.; Okazaki, M.; Ikezaki, H.; Ihara, T.; Hayashi, T.; Hiramine, S.; Ura, K.; Kohzuma, T.; Schaefer, E.J.; et al. Serum cholesterol and triglyceride reference ranges of twenty lipoprotein subclasses for healthy Japanese men and women. Atherosclerosis 2013, 231, 238–245. [Google Scholar] [CrossRef] [PubMed]
- KDIGO 2012 Clinical Practice Guideline for the Evaluation and Management of Chronic Kidney Disease. Kidney. Int. Suppl. 2013, 3, 5–14. [CrossRef]


| Parameter | All Participants | Baseline eGFR Category | Hemodialysis | |||
|---|---|---|---|---|---|---|
| G1 | G2 | G3a–G3b | G4–G5 | |||
| n | 189 | 21 | 123 | 34 | 8 | 3 |
| Age (years) | 57.8 (10.5) | 52.6 (9.8) | 55.9 (9.3) | 65.5 (9.7) | 64.6 (12.8) | 67.7 (12.5) |
| Sex, Men | 147 (77.8) | 16 (76.2) | 98 (79.7) | 25 (73.5) | 7 (87.5) | 1 (33.3) |
| BMI (kg/m2) | 26.0 (3.5) | 26.6 (4.6) | 26.1 (3.4) | 25.8 (2.5) | 26.0 (2.3) | 23.4 (7.3) |
| Type 2 diabetes | 70 (37.0) | 10 (47.6) | 39 (31.7) | 16 (47.1) | 4 (50.0) | 1 (33.3) |
| Hypertension | 101 (53.4) | 8 (38.1) | 57 (46.3) | 26 (76.5) | 7 (87.5) | 3 (100) |
| Fatty liver | 140 (74.1) | 19 (90.5) | 91 (74.0) | 26 (76.5) | 4 (50.0) | 0 |
| Use of a statin | 108 (57.1) | 11 (52.4) | 77 (62.6) | 18 (52.9) | 2 (25.0) | 0 |
| TG (mmol/L) | 2.82 (0.88) | 2.94 (1.03) | 2.80 (0.89) | 2.88 (0.86) | 2.72 (0.47) | 2.47 (0.53) |
| HDL-C (mmol/L) | 1.18 (0.27) | 1.24 (0.36) | 1.19 (0.24) | 1.19 (0.31) | 0.87 (0.22) | 1.12 (0.42) |
| LDL-C (mmol/L) | 3.09 (0.82) | 3.20 (0.88) | 3.08 (0.78) | 2.96 (0.72) | 3.42 (1.18) | 3.45 (2.09) |
| Serum creatinine (mg/dL) | 1.05 (1.00) | 0.62 (0.10) | 0.82 (0.12) | 1.09 (0.25) | 3.23 (1.30) | 7.35 (1.68) |
| eGFR (mL/min/1.73 m2) | 68.6 (20.3) | 99.6 (8.0) | 72.9 (8.5) | 51.1 (7.0) | 18.2 (6.9) | 5.6 (1.4) |
| HbA1c (%) | 6.3 (0.9) | 6.5 (1.1) | 6.2 (0.8) | 6.6 (1.0) | 6.1 (0.4) | 6.7 (1.9) |
| Parameter | All Participants | Baseline eGFR Category | ||||
|---|---|---|---|---|---|---|
| G1 | G2 | G3a–G3b | G4–G5 | |||
| TG (mmol/L) | n | 189 | 21 | 123 | 34 | 8 |
| Baseline | 2.82 (0.88) | 2.94 (1.03) | 2.80 (0.89) | 2.88 (0.86) | 2.72 (0.47) | |
| Week 52 (LOCF) | 1.48 (0.69) | 1.71 (0.87) | 1.47 (0.72) | 1.36 (0.44) | 1.64 (0.54) | |
| % Change | −45.9 (21.8) *** | −41.4 (23.0) *** | −45.8 (23.1) *** | −51.1 (15.4) *** | −37.7 (23.6) ** | |
| HDL-C (mmol/L) | n | 189 | 21 | 123 | 34 | 8 |
| Baseline | 1.18 (0.27) | 1.24 (0.36) | 1.19 (0.24) | 1.19 (0.31) | 0.87 (0.22) | |
| Week 52 (LOCF) | 1.33 (0.34) | 1.29 (0.44) | 1.34 (0.32) | 1.38 (0.35) | 1.18 (0.37) | |
| % Change | 13.1 (17.1) *** | 3.6 (16.9) | 11.9 (16.2) *** | 17.0 (13.0) *** | 34.1 (23.7) ** | |
| TG/HDL-C [(mmol/L)/(mmol/L)] | n | 189 | 21 | 123 | 34 | 8 |
| Baseline | 2.58 (1.22) | 2.69 (1.52) | 2.49 (1.13) | 2.69 (1.37) | 3.30 (0.95) | |
| Week 52 (LOCF) | 1.27 (0.85) | 1.58 (1.03) | 1.24 (0.87) | 1.09 (0.55) | 1.68 (1.12) | |
| % Change | −49.7 (25.7) *** | −40.5 (33.2) *** | −48.9 (26.5) *** | −57.0 (15.9) *** | −51.0 (22.4) *** | |
| LDL-C (mmol/L) | n | 189 | 21 | 123 | 34 | 8 |
| Baseline | 3.09 (0.82) | 3.20 (0.88) | 3.08 (0.78) | 2.96 (0.72) | 3.42 (1.18) | |
| Week 52 (LOCF) | 3.02 (0.75) | 3.12 (0.89) | 3.03 (0.76) | 2.97 (0.62) | 2.82 (0.85) | |
| % Change | 2.2 (30.4) | 2.7 (33.7) | 2.1 (29.2) | 5.1 (30.0) | −8.8 (41.2) | |
| non HDL-C (mmol/L) | n | 189 | 21 | 123 | 34 | 8 |
| Baseline | 4.03 (0.79) | 4.18 (0.87) | 4.00 (0.73) | 3.92 (0.61) | 4.54 (1.34) | |
| Week 52 (LOCF) | 3.63 (0.83) | 3.77 (1.01) | 3.64 (0.85) | 3.56 (0.66) | 3.49 (0.96) | |
| % Change | −8.7 (18.8) *** | −8.3 (21.1) | −8.4 (17.4) *** | −7.7 (18.0) * | −17.3 (33.5) | |
| RemL-C (mmol/L) | n | 187 | 21 | 122 | 34 | 7 |
| Baseline | 0.48 (0.26) | 0.54 (0.30) | 0.46 (0.26) | 0.48 (0.26) | 0.59 (0.15) | |
| Week 52 (LOCF) | 0.18 (0.13) | 0.21 (0.15) | 0.18 (0.14) | 0.17 (0.09) | 0.24 (0.17) | |
| % Change | −57.2 (28.7) *** | −59.9 (21.1) *** | −56.0 (31.8) *** | −59.3 (22.9) *** | −57.1 (25.8) ** | |
| apoA1 (mg/dL) | n | 187 | 21 | 122 | 34 | 7 |
| Baseline | 131.6 (19.8) | 134.2 (22.0) | 132.2 (18.2) | 133.5 (20.0) | 105.4 (19.7) | |
| Week 52 (LOCF) | 137.6 (22.4) | 133.8 (26.0) | 137.2 (20.0) | 144.0 (25.5) | 122.4 (20.8) | |
| % Change | 5.0 (11.2) *** | 0.0 (13.9) | 4.1 (10.5) *** | 8.0 (10.0) *** | 16.7 (10.6) ** | |
| apoA2 (mg/dL) | n | 187 | 21 | 122 | 34 | 7 |
| Baseline | 30.3 (4.5) | 31.4 (5.1) | 30.8 (4.2) | 29.5 (4.7) | 24.2 (3.3) | |
| Week 52 (LOCF) | 38.2 (6.9) | 37.9 (5.9) | 38.7 (6.8) | 37.8 (6.8) | 32.8 (7.1) | |
| % Change | 27.0 (19.5) *** | 22.2 (18.4) *** | 26.3 (17.6) *** | 29.4 (22.7) *** | 35.3 (21.7) ** | |
| apoB (mg/dL) | n | 187 | 21 | 122 | 34 | 7 |
| Baseline | 93.6 (16.8) | 95.6 (17.8) | 93.4 (16.5) | 91.9 (13.8) | 97.4 (23.5) | |
| Week 52 (LOCF) | 88.1 (18.6) | 93.0 (23.1) | 88.0 (18.5) | 87.9 (15.4) | 76.1 (21.6) | |
| % Change | −4.5 (19.9) ** | −1.9 (19.6) | −4.5 (19.6) * | −3.0 (17.7) | −18.1 (29.5) | |
| apoB48 (μg/mL) | n | 188 | 21 | 123 | 34 | 7 |
| Baseline | 9.1 (5.8) | 10.3 (6.7) | 8.5 (5.4) | 9.1 (5.6) | 12.8 (4.1) | |
| Week 52 (LOCF) | 3.8 (3.0) | 3.7 (2.1) | 3.3 (2.8) | 4.0 (2.1) | 7.8 (4.1) | |
| % Change | −53.0 (30.9) *** | −60.4 (21.5) *** | −54.4 (33.0) *** | −48.1 (26.6) *** | −34.9 (34.4) * | |
| apoC3 (mg/dL) | n | 187 | 21 | 122 | 34 | 7 |
| Baseline | 15.1 (4.5) | 15.9 (5.0) | 14.7 (4.3) | 15.9 (5.2) | 13.2 (1.1) | |
| Week 52 (LOCF) | 9.8 (3.2) | 10.6 (3.8) | 9.3 (3.1) | 10.5 (2.5) | 10.5 (2.9) | |
| % Change | −32.4 (19.6) *** | −32.4 (15.3) *** | −34.2 (20.1) *** | −30.0 (18.3) *** | −20.2 (22.6) | |
| hsCRP (mg/dL) | n | 186 | 21 | 123 | 33 | 6 |
| Baseline | 0.11 (0.20) | 0.18 (0.43) | 0.09 (0.11) | 0.13 (0.19) | 0.23 (0.39) | |
| Week 52 (LOCF) | 0.13 (0.26) | 0.23 (0.58) | 0.12 (0.19) | 0.13 (0.15) | 0.06 (0.03) | |
| Change | 0.02 (0.30) | 0.04 (0.71) | 0.03 (0.17) | −0.00 (0.22) | −0.17 (0.37) | |
| IL-1β (pg/mL) | n | 183 | 21 | 123 | 31 | 5 |
| Baseline | 0.16 (0.22) | 0.21 (0.28) | 0.15 (0.20) | 0.17 (0.28) | 0.13 (0.10) | |
| Week 52 (LOCF) | 0.09 (0.08) | 0.08 (0.08) | 0.08 (0.08) | 0.11 (0.10) | 0.13 (0.12) | |
| Change | −0.07 (0.24) *** | −0.13 (0.31) * | −0.06 (0.22) *** | −0.06 (0.30) | −0.00 (0.17) | |
| Parameter | All Participants | Baseline eGFR Category | ||||
|---|---|---|---|---|---|---|
| G1 | G2 | G3a–G3b | G4–G5 | |||
| (mmol/L) | n | 188 | 21 | 123 | 34 | 7 |
| CM-C | Baseline | 0.154 (0.135) | 0.158 (0.114) | 0.151 (0.146) | 0.156 (0.121) | 0.188 (0.082) |
| Week 52 (LOCF) | 0.039 (0.038) | 0.064 (0.055) | 0.035 (0.036) | 0.035 (0.025) | 0.039 (0.037) | |
| % Change | −64.3 (35.5) *** | −54.1 (46.0) *** | −63.9 (36.1) *** | −67.7 (29.1) *** | −79.4 (14.0) *** | |
| VLDL-C | Baseline | 1.196 (0.335) | 1.260 (0.390) | 1.164 (0.300) | 1.177 (0.319) | 1.559 (0.474) |
| Week 52 (LOCF) | 0.866 (0.264) | 0.932 (0.323) | 0.834 (0.234) | 0.892 (0.293) | 1.076 (0.372) | |
| % Change | −24.9 (22.5) *** | −24.6 (20.0) *** | −25.3 (22.9) *** | −22.9 (21.5) *** | −28.7 (25.5) * | |
| Large LDL-C | Baseline | 0.504 (0.185) | 0.529 (0.186) | 0.498 (0.175) | 0.489 (0.182) | 0.570 (0.279) |
| Week 52 (LOCF) | 0.748 (0.183) | 0.724 (0.130) | 0.765 (0.200) | 0.720 (0.150) | 0.689 (0.143) | |
| % Change | 63.1 (63.2) *** | 54.5 (62.1) *** | 67.7 (68.1) *** | 59.1(44.2) *** | 39.9 (61.3) | |
| Medium LDL-C | Baseline | 1.102 (0.330) | 1.134 (0.325) | 1.120 (0.337) | 1.030 (0.295) | 1.058 (0.382) |
| Week 52 (LOCF) | 1.194 (0.300) | 1.244 (0.349) | 1.226 (0.307) | 1.127 (0.208) | 0.920 (0.248) | |
| % Change | 17.3 (49.9) *** | 15.5 (37.9) | 18.7 (53.7) *** | 18.9 (45.1) * | −2.8 (44.2) | |
| Small LDL-C | Baseline | 0.682 (0.190) | 0.711 (0.236) | 0.690 (0.187) | 0.650 (0.160) | 0.643 (0.223) |
| Week 52 (LOCF) | 0.517 (0.165) | 0.576 (0.223) | 0.522 (0.158) | 0.501 (0.139) | 0.381 (0.154) | |
| % Change | −20.6 (28.6) *** | −18.0 (21.3) *** | −20.6 (29.3) *** | −18.9 (28.2) *** | −38.6 (23.9) ** | |
| Very small LDL-C | Baseline | 0.254 (0.080) | 0.262 (0.064) | 0.250 (0.080) | 0.264 (0.084) | 0.258 (0.113) |
| Week 52 (LOCF) | 0.210 (0.061) | 0.233 (0.080) | 0.211 (0.056) | 0.207 (0.063) | 0.158 (0.056) | |
| % Change | −11.6 (30.2) *** | −10.3 (23.2) | −9.7 (30.1) *** | −15.8 (29.0) ** | −33.4 (21.4) ** | |
| Very large HDL-C | Baseline | 0.046 (0.015) | 0.047 (0.016) | 0.046 (0.013) | 0.048 (0.016) | 0.038 (0.015) |
| Week 52 (LOCF) | 0.048 (0.016) | 0.047 (0.018) | 0.048 (0.016) | 0.051 (0.017) | 0.044 (0.020) | |
| % Change | 4.4 (21.5) ** | 0.8 (18.3) | 4.1 (21.0) * | 5.9 (20.4) | 17.1 (36.1) | |
| Large HDL-C | Baseline | 0.130 (0.083) | 0.123 (0.103) | 0.130 (0.080) | 0.139 (0.082) | 0.096 (0.085) |
| Week 52 (LOCF) | 0.115 (0.088) | 0.107 (0.100) | 0.115 (0.088) | 0.124 (0.082) | 0.096 (0.090) | |
| % Change | −9.2 (45.1) ** | −14.1 (43.2) | −10.9 (44.7) ** | −4.9 (42.6) | 8.2 (53.4) | |
| Medium HDL-C | Baseline | 0.374 (0.114) | 0.389 (0.131) | 0.382 (0.105) | 0.372 (0.118) | 0.216 (0.072) |
| Week 52 (LOCF) | 0.443 (0.155) | 0.441 (0.187) | 0.448 (0.146) | 0.447 (0.170) | 0.336 (0.141) | |
| % Change | 19.3 (24.4) *** | 11.4 (21.3) * | 17.7 (23.9) *** | 20.6 (22.3) *** | 53.2 (25.3) ** | |
| Small HDL-C | Baseline | 0.388 (0.076) | 0.414 (0.092) | 0.393 (0.070) | 0.382 (0.072) | 0.281 (0.057) |
| Week 52 (LOCF) | 0.473 (0.087) | 0.482 (0.097) | 0.477 (0.079) | 0.467 (0.082) | 0.395 (0.106) | |
| % Change | 24.2 (23.3) *** | 18.1 (16.8) *** | 23.6 (23.3) *** | 24.6 (22.4) *** | 39.1 (20.9) ** | |
| Very small HDL-C | Baseline | 0.148 (0.032) | 0.158 (0.032) | 0.146 (0.034) | 0.154 (0.023) | 0.128 (0.035) |
| Week 52 (LOCF) | 0.181 (0.033) | 0.186 (0.035) | 0.181 (0.031) | 0.180 (0.024) | 0.155 (0.042) | |
| % Change | 27.9 (36.6) *** | 20.6 (25.0) ** | 30.9 (39.7) *** | 19.7 (22.8) *** | 23.5 (25.9) | |
| Parameter | All Participants | Baseline eGFR Category | Hemodialysis | |||
|---|---|---|---|---|---|---|
| G1 | G2 | G3a–G3b | G4–G5 | |||
| n | 189 | 21 | 123 | 34 | 8 | 3 |
| AE | ||||||
| Total | 155 (82.0) | 17 (81.0) | 97 (78.9) | 31 (91.2) | 7 (87.5) | 3 (100) |
| Serious | 16 (8.5) | 2 (9.5) | 4 (3.3) | 5 (14.7) | 2 (25.0) | 3 (100) |
| Leading to withdrawal | 11 (5.8) | 2 (9.5) | 3 (2.4) | 3 (8.8) | 3 (37.5) | 0 |
| ADR | ||||||
| Total | 60 (31.7) | 9 (42.9) | 34 (27.6) | 15 (44.1) | 2 (25.0) | 0 |
| Serious | 1 (0.5) | 0 | 1 (0.8) | 0 | 0 | 0 |
| Leading to withdrawal | 7 (3.7) | 2 (9.5) | 2 (1.6) | 1 (2.9) | 2 (25.0) | 0 |
| CK > ULN × 2.5 | 11 (5.8) | 1 (4.8) | 8 (6.5) | 1 (2.9) | 1 (12.5) | 0 |
| CK > ULN × 5 | 1 (0.5) | 0 | 1 (0.8) | 0 | 0 | 0 |
| sCr > Baseline × 2.0 | 0 | 0 | 0 | 0 | 0 | 0 |
| AEs/ADRs | All | Baseline eGFR Category | Hemodialysis | ||||||||
|---|---|---|---|---|---|---|---|---|---|---|---|
| G1 | G2 | G3a–G3b | G4–G5 | ||||||||
| n | 189 | 21 | 123 | 34 | 8 | 3 | |||||
| Serious | 16 | 2 | 4 | 5 | 2 | 3 | |||||
| G1-1 | Diabetes mellitus | G2-1 | Inguinal hernia Cryptorchism | G3-1 | Aortic aneurysm | G45-1 | Gastric adenoma Adenocarcinoma gastric | H-1 | Shunt occlusion Shunt stenosis | ||
| G1-2 | Myocardial ischemia | G2-2 | Sepsis | G3-2 | Adenocarcinoma gastric | G45-2 | Spinal compression fracture Aortic aneurysm Aortic dissection Carotid artery dissection | H-2 | Malaise | ||
| G2-3 | Cerebral infarction | G3-3 | Pneumonia | H-3 | Shunt stenosis Cataract Upper respiratory tract inflammation | ||||||
| G2-4 | Acute myocardial infarction | G3-4 | Pneumonia | ||||||||
| G3-5 | Myocardial ischemia | ||||||||||
| Leading to withdrawal | 11 | 2 | 3 | 3 | 3 | 0 | |||||
| G1-3 | Cholelithiasis | G2-5 | AST increased ALT increased | G3-2 | Adenocarcinoma gastric | G45-2 | Aortic aneurysm Aortic dissection Carotid artery dissection | ||||
| G1-4 | Diabetes mellitus | G2-6 | Cholelithiasis | G3-3 | Pneumonia | ||||||
| G2-4 | Acute myocardial infarction | G3-6 | LDL increased Cholelithiasis | G45-3 | Chronic kidney disease | ||||||
| G45-4 | Drug eruption | ||||||||||
| Parameter | All Participants | Baseline eGFR Category | ||||
|---|---|---|---|---|---|---|
| G1 | G2 | G3a–G3b | G4–G5 | |||
| AST (U/L) | n | 166 | 18 | 113 | 27 | 5 |
| Baseline | 27.4 (11.3) | 26.2 (5.6) | 27.7 (11.1) | 29.5 (15.0) | 18.0 (3.7) | |
| Week 52 | 25.8 (12.0) | 28.7 (16.2) | 26.1 (12.4) | 24.7 (6.3) | 21.6 (5.9) | |
| Change | −1.5 (11.3) * | 2.5 (14.9) | −1.7 (10.5) * | −4.7 (12.6) * | 3.6 (3.0) | |
| ALT (U/L) | n | 171 | 19 | 116 | 28 | 5 |
| Baseline | 31.0 (17.7) | 29.3 (11.8) | 33.3 (19.4) | 26.8 (12.5) | 18.4 (12.1) | |
| Week 52 | 23.0 (16.1) | 26.0 (15.0) | 24.1 (17.6) | 18.5 (7.6) | 20.0 (17.6) | |
| Change | −8.0 (13.7) *** | −3.3 (13.1) | −9.2 (14.6) *** | −8.3 (10.8) *** | 1.6 (6.2) | |
| γ-GT (U/L) | n | 171 | 19 | 116 | 28 | 5 |
| Baseline | 55.0 (52.3) | 73.6 (96.6) | 55.2 (41.3) | 50.8 (56.3) | 22.2 (10.4) | |
| Week 52 | 32.2 (35.0) | 48.6 (66.2) | 32.3 (31.3) | 25.0 (16.3) | 18.0 (14.2) | |
| Change | −22.8 (31.7) *** | −24.9 (37.8) ** | −22.9 (28.4) *** | −25.8 (42.7) *** | −4.2 (8.2) | |
| ALP (U/L) | n | 171 | 19 | 116 | 28 | 5 |
| Baseline | 225.5 (57.0) | 227.6 (59.9) | 223.1 (58.1) | 229.8 (53.9) | 237.8 (56.9) | |
| Week 52 | 149.5 (44.7) | 154.1 (40.0) | 150.6 (47.4) | 143.3 (36.0) | 137.0 (59.5) | |
| Change | −76.0 (36.3) *** | −73.5 (38.8) *** | −72.5 (32.9) *** | −86.4 (41.3) *** | −100.8 (54.5) | |
| Serum creatinine (mg/dL) | n | 171 | 19 | 116 | 28 | 5 |
| Baseline | 1.02 (0.98) | 0.62 (0.10) | 0.83 (0.13) | 1.08 (0.27) | 2.98 (1.19) | |
| Week 52 | 1.09 (1.23) | 0.67 (0.14) | 0.85 (0.16) | 1.13 (0.43) | 3.78 (2.21) | |
| Change | 0.07 (0.34) *** | 0.06 (0.09) ** | 0.02 (0.07) ** | 0.06 (0.21) | 0.80 (1.26) | |
| eGFR (mL/min/1.73 m2) | n | 171 | 19 | 116 | 28 | 5 |
| Baseline | 69.8 (19.5) | 100.3 (8.1) | 73.1 (8.5) | 51.2 (7.2) | 19.2 (6.7) | |
| Week 52 | 67.8 (19.6) | 93.0 (14.8) | 71.5 (10.0) | 50.7 (10.8) | 17.4 (8.8) | |
| Change | −2.0 (7.2) *** | −7.2 (11.9) * | −1.5 (6.1) * | −0.5 (6.9) | −1.8 (4.9) | |
| CK (U/L) | n | 171 | 19 | 116 | 28 | 5 |
| Baseline | 142.4 (142.3) | 132.1 (61.5) | 149.2 (168.0) | 132.6 (60.5) | 113.6 (34.4) | |
| Week 52 | 134.3 (88.4) | 149.3 (113.0) | 135.5 (89.6) | 129.4 (75.8) | 110.2 (29.5) | |
| Change | −8.1 (139.9) | 17.2 (74.0) | −13.7 (163.9) | −3.2 (67.3) | −3.4 (15.1) | |
© 2019 by the authors. Licensee MDPI, Basel, Switzerland. This article is an open access article distributed under the terms and conditions of the Creative Commons Attribution (CC BY) license (http://creativecommons.org/licenses/by/4.0/).
Share and Cite
Yokote, K.; Yamashita, S.; Arai, H.; Araki, E.; Suganami, H.; Ishibashi, S., on Behalf of the K-877 Study Group. Long-Term Efficacy and Safety of Pemafibrate, a Novel Selective Peroxisome Proliferator-Activated Receptor-α Modulator (SPPARMα), in Dyslipidemic Patients with Renal Impairment. Int. J. Mol. Sci. 2019, 20, 706. https://doi.org/10.3390/ijms20030706
Yokote K, Yamashita S, Arai H, Araki E, Suganami H, Ishibashi S on Behalf of the K-877 Study Group. Long-Term Efficacy and Safety of Pemafibrate, a Novel Selective Peroxisome Proliferator-Activated Receptor-α Modulator (SPPARMα), in Dyslipidemic Patients with Renal Impairment. International Journal of Molecular Sciences. 2019; 20(3):706. https://doi.org/10.3390/ijms20030706
Chicago/Turabian StyleYokote, Koutaro, Shizuya Yamashita, Hidenori Arai, Eiichi Araki, Hideki Suganami, and Shun Ishibashi on Behalf of the K-877 Study Group. 2019. "Long-Term Efficacy and Safety of Pemafibrate, a Novel Selective Peroxisome Proliferator-Activated Receptor-α Modulator (SPPARMα), in Dyslipidemic Patients with Renal Impairment" International Journal of Molecular Sciences 20, no. 3: 706. https://doi.org/10.3390/ijms20030706