1. Introduction
Germline
BRCA1 and
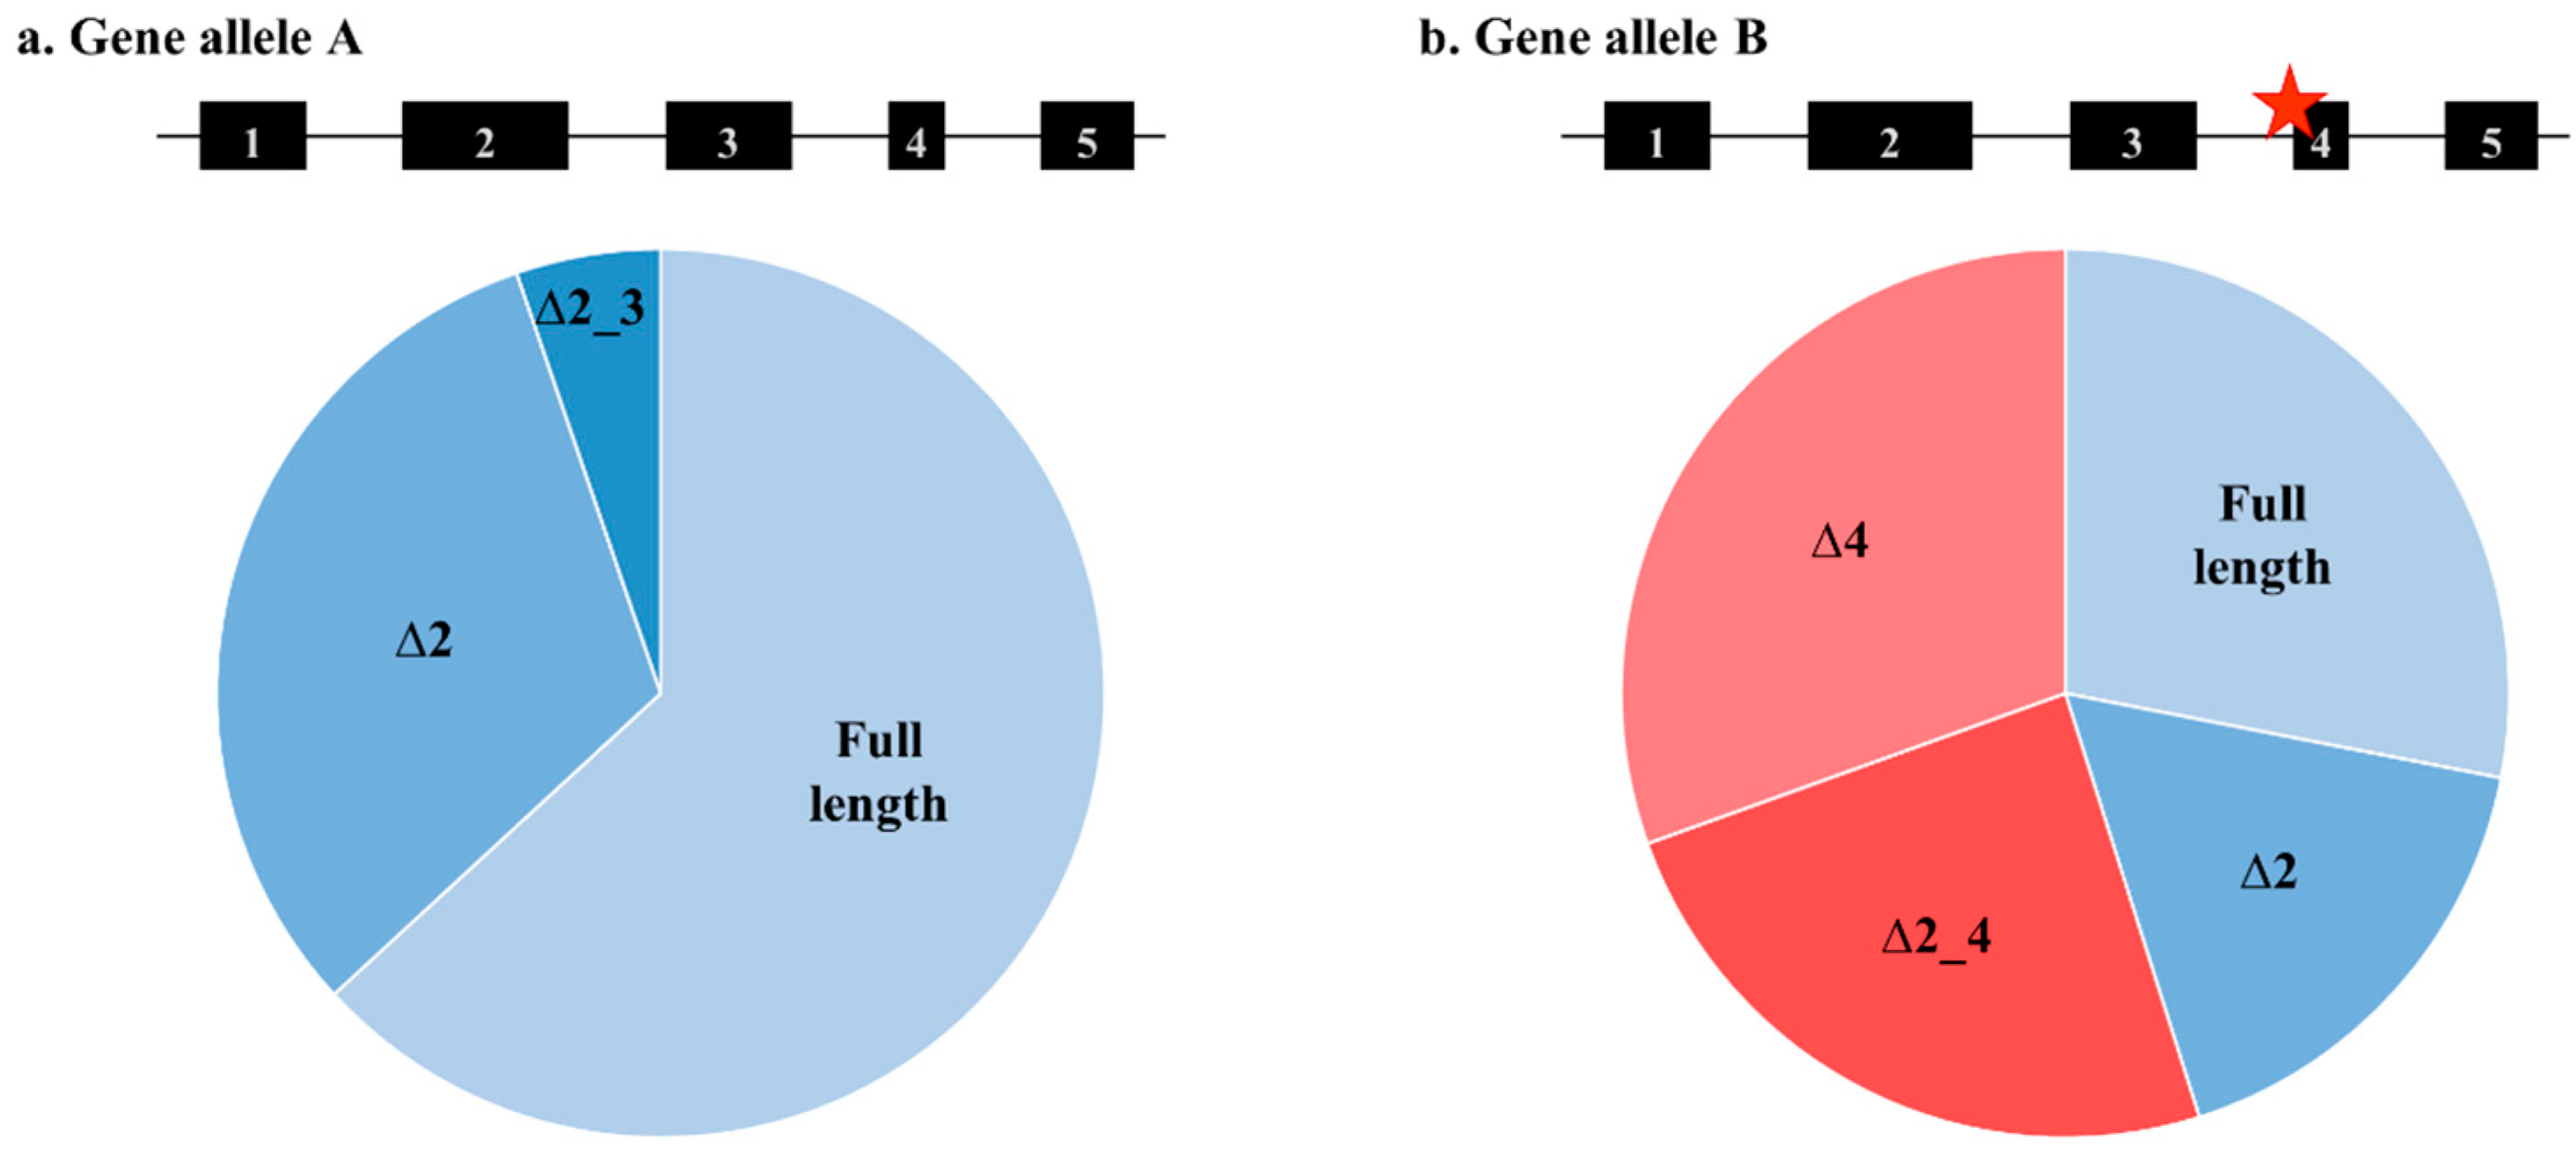
BRCA2 variants can confer an increased risk of breast and ovarian cancers, and many of these variants are known to disrupt mRNA splicing, as seen in
Figure 1.
BRCA1 and
BRCA2 mRNA splicing patterns have been explored in depth using a number of advanced sequencing technologies to highlight significant diversity, both in the number and level of the alternative events expressed naturally by these genes [
1,
2,
3]. This diversity can be attributed to the detection methods, diurnal rhythmic patterns and random variation, and/or the effects that spliceogenic variants have on the use of regulatory motifs by splicing machinery [
4,
5].
In particular, individual cells are known to express genes in a stochastic manner, occurring in bursts, irrespective of the transcription factors present [
6,
7], suggesting that the detected
BRCA1 and
BRCA2 mRNA expression levels may be influenced by such fluctuations. Expression based assays (such as reverse transcriptase-PCR and RNA-seq) measure average mRNA expression in a population of cells. However, the individual cells of the population are likely to be producing transcripts at very different levels, potentially providing an additional measure of mRNA expression patterns associated with spliceogenic variants. Advanced in situ hybridisation (ISH) technologies provide the means to observe actual levels of mRNA transcripts in single cells, in addition to detail on spatial expression within a cell. Measuring gene splicing at the single cell level may provide a more comprehensive method of evaluating the biological and clinical significance of alternative isoforms. In this study, we utilised RNAscope [
8], a unique method of RNA in situ hybridisation, to show the effect of known
BRCA1 and
BRCA2 spliceogenic variants on mRNA transcript expression in single cells.
2. Results
In this study, RNAscope allowed the detection of specific
BRCA1 and
BRCA2 mRNA splicing events in single cells, from individuals with or without germline spliceogenic variants. Results showed that the proportion of cells expressing
BRCA1 transcripts ranged from 4% (2/50) in the control to 44% (22/50) in the
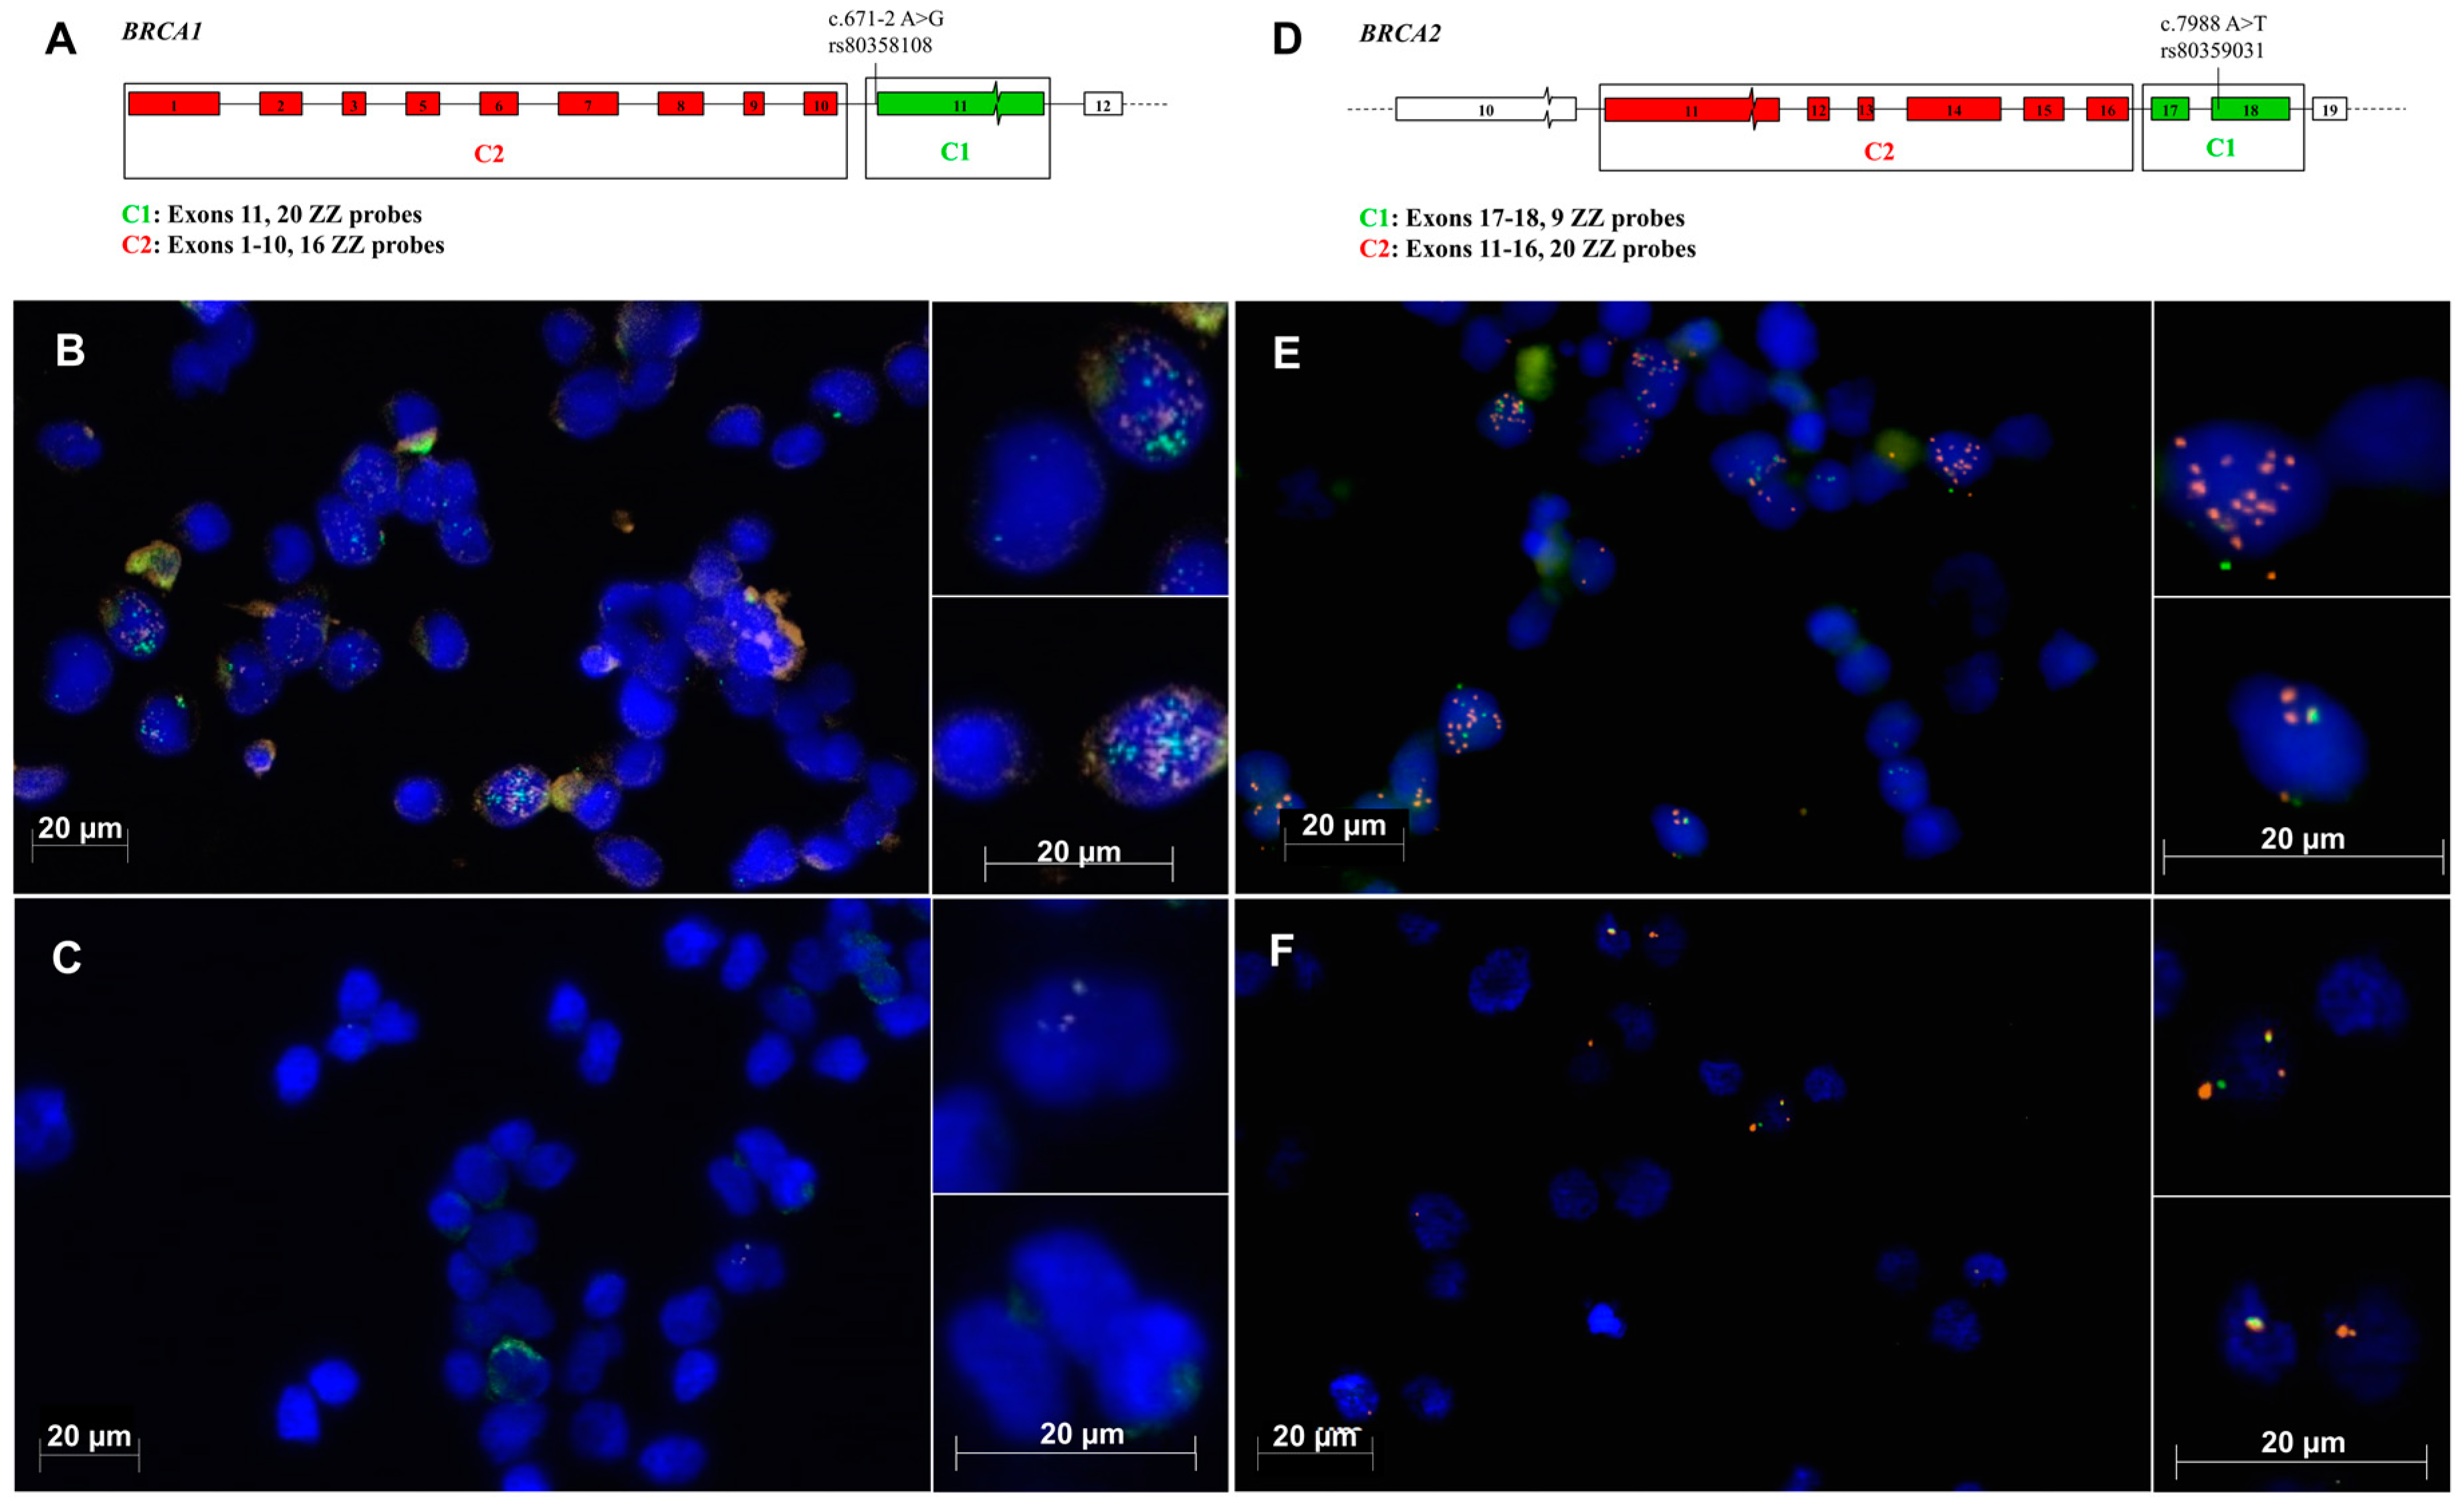
BRCA1c.671-2 A>G carrier, as seen in
Table 1. By comparison, the proportion of cells expressing
BRCA2 transcripts ranged from 24% (12/50) in the control to 58% (29/50) in the
BRCA2c.7988 A>T carrier. Results from the negative and positive control probes from the RNAscope Multiplex Fluorescent Detection Kit are shown in the
Supplementary Figures S1 and S2. Cell-specific
BRCA1 mRNA transcript expression ranged from 0 to 17 (mean = 2.1)
BRCA1 molecules per cell in the
BRCA1c.671-2 A>G carrier, and 0 to 10 (mean = 0.3) in the control. The
BRCA2 mRNA transcript expression ranged from 0 to 29 (mean = 3.2) molecules per cell in the
BRCA2c.7988 A>T carrier, and 0 to 5 (mean = 0.6) in the control as shown in
Table 1 and
Supplementary Tables S1–S4. Both carrier and non-carrier lymphoblastoid cell lines (LCL) treated with a nonsense mediated decay (NMD) inhibitor showed an average increase in
BRCA1 and
BRCA2 mRNA molecules per cell compared to non-treated LCLs (fold changes observed:
BRCA1 carrier = 5.2×;
BRCA1 control = 1.2×;
BRCA2 carrier = 1.6×;
BRCA2 control = 4.4×), as seen in
Supplementary Tables S1–S5 and the
Supplementary Figure S3. To be consistent with previous publications [
4,
9], we have focused our analysis on NMD-treated cells.
Previous studies [
4,
10] conducting RT-PCR and RNA-seq analyses of
BRCA1 mRNA expression in LCLs carrying the spliceogenic variants
BRCA1c.671-2 A>G and
BRCA2c.7988 A>T have reported increased expression of the ∆11 and ∆17_18 splicing events, respectively. However, these studies were unable to elucidate
BRCA1 and
BRCA2 expression patterns at the single cell level. Using RNAscope, we show that the
BRCA1c.671-2 A>G variant carrier LCL showed no significant difference in the total number of detected
BRCA1 ∆11 mRNAs compared to the control LCL across the cells assayed in each sample, demonstrated by
p = 0.48 in
Table 1,
Figure 2. However, the number of cells containing the
BRCA1 ∆11 splicing event was shown to be significantly greater in the variant carrier compared to the control (
p = 0.01, as seen in
Table 1). The detection of
BRCA2 ∆17_18 mRNA molecules in
BRCA2c.7988 A>T variant carrier cells was significantly higher compared to the control (
p = 0.04, as seen in
Table 1 and
Figure 2). Furthermore, the number of cells containing the
BRCA2 ∆17_18 splicing event was also shown to be significantly greater in the variant carrier compared to the control LCL (
p = 0.04, as seen in
Table 1).
Together these results show that RNA in situ hybridisation was able to demonstrate the increased expression of
BRCA2 ∆17_18 splicing events previously reported. Increasing cell-sampling size may allow the 1.3-fold increase of
BRCA1 ∆11 detected previously [
10] to also be identified. In addition to previous studies, we show that these samples show the punctuated expression of
BRCA1 and
BRCA2, with a large proportion of cells containing no detectable target mRNA molecules, as seen in
Table 1.
3. Discussion
mRNA splicing assays typically follow a population-based sampling approach, using sequencing or PCR-based methods to simultaneously detect and quantify mRNA splice isoforms in a large number of cells. Attempts to quantify the observed
BRCA1 and
BRCA2 mRNA expression in normal samples have identified huge variability, both between and within samples [
4,
10]. This suggests that a shift to focusing on individual cells may help determine the extent to which cellular heterogeneity contributes to this variation.
Here, specific
BRCA1 and
BRCA2 mRNA isoforms were quantified in individual cells. A large proportion of cells in all samples studied were not found to express any of the
BRCA1/
2 mRNA transcripts. Furthermore, the expression of
BRCA1 ∆11 and
BRCA2 ∆17_18 isoforms were observed in a greater proportion of cells isolated from the carriers of spliceogenic variants, compared to those observed from the control. However, this study has revealed that transcripts were not uniformly expressed across all cells, with a large proportion of cells containing no detectable target mRNA molecules. This suggests that results previously reported using RT-PCR [
4] and RNA-seq [
3] might reflect the number of cells with gene activity, rather than simply detecting an elevation of constitutive activity. Such inter-cellular variation may account for some of the inter-sample variability previously observed using RT-PCR and RNA-seq [
3,
4]. These results are also consistent with previous reports of variable gene expression between individual cells [
6,
11], but have not previously been shown for
BRCA1 and
BRCA2.
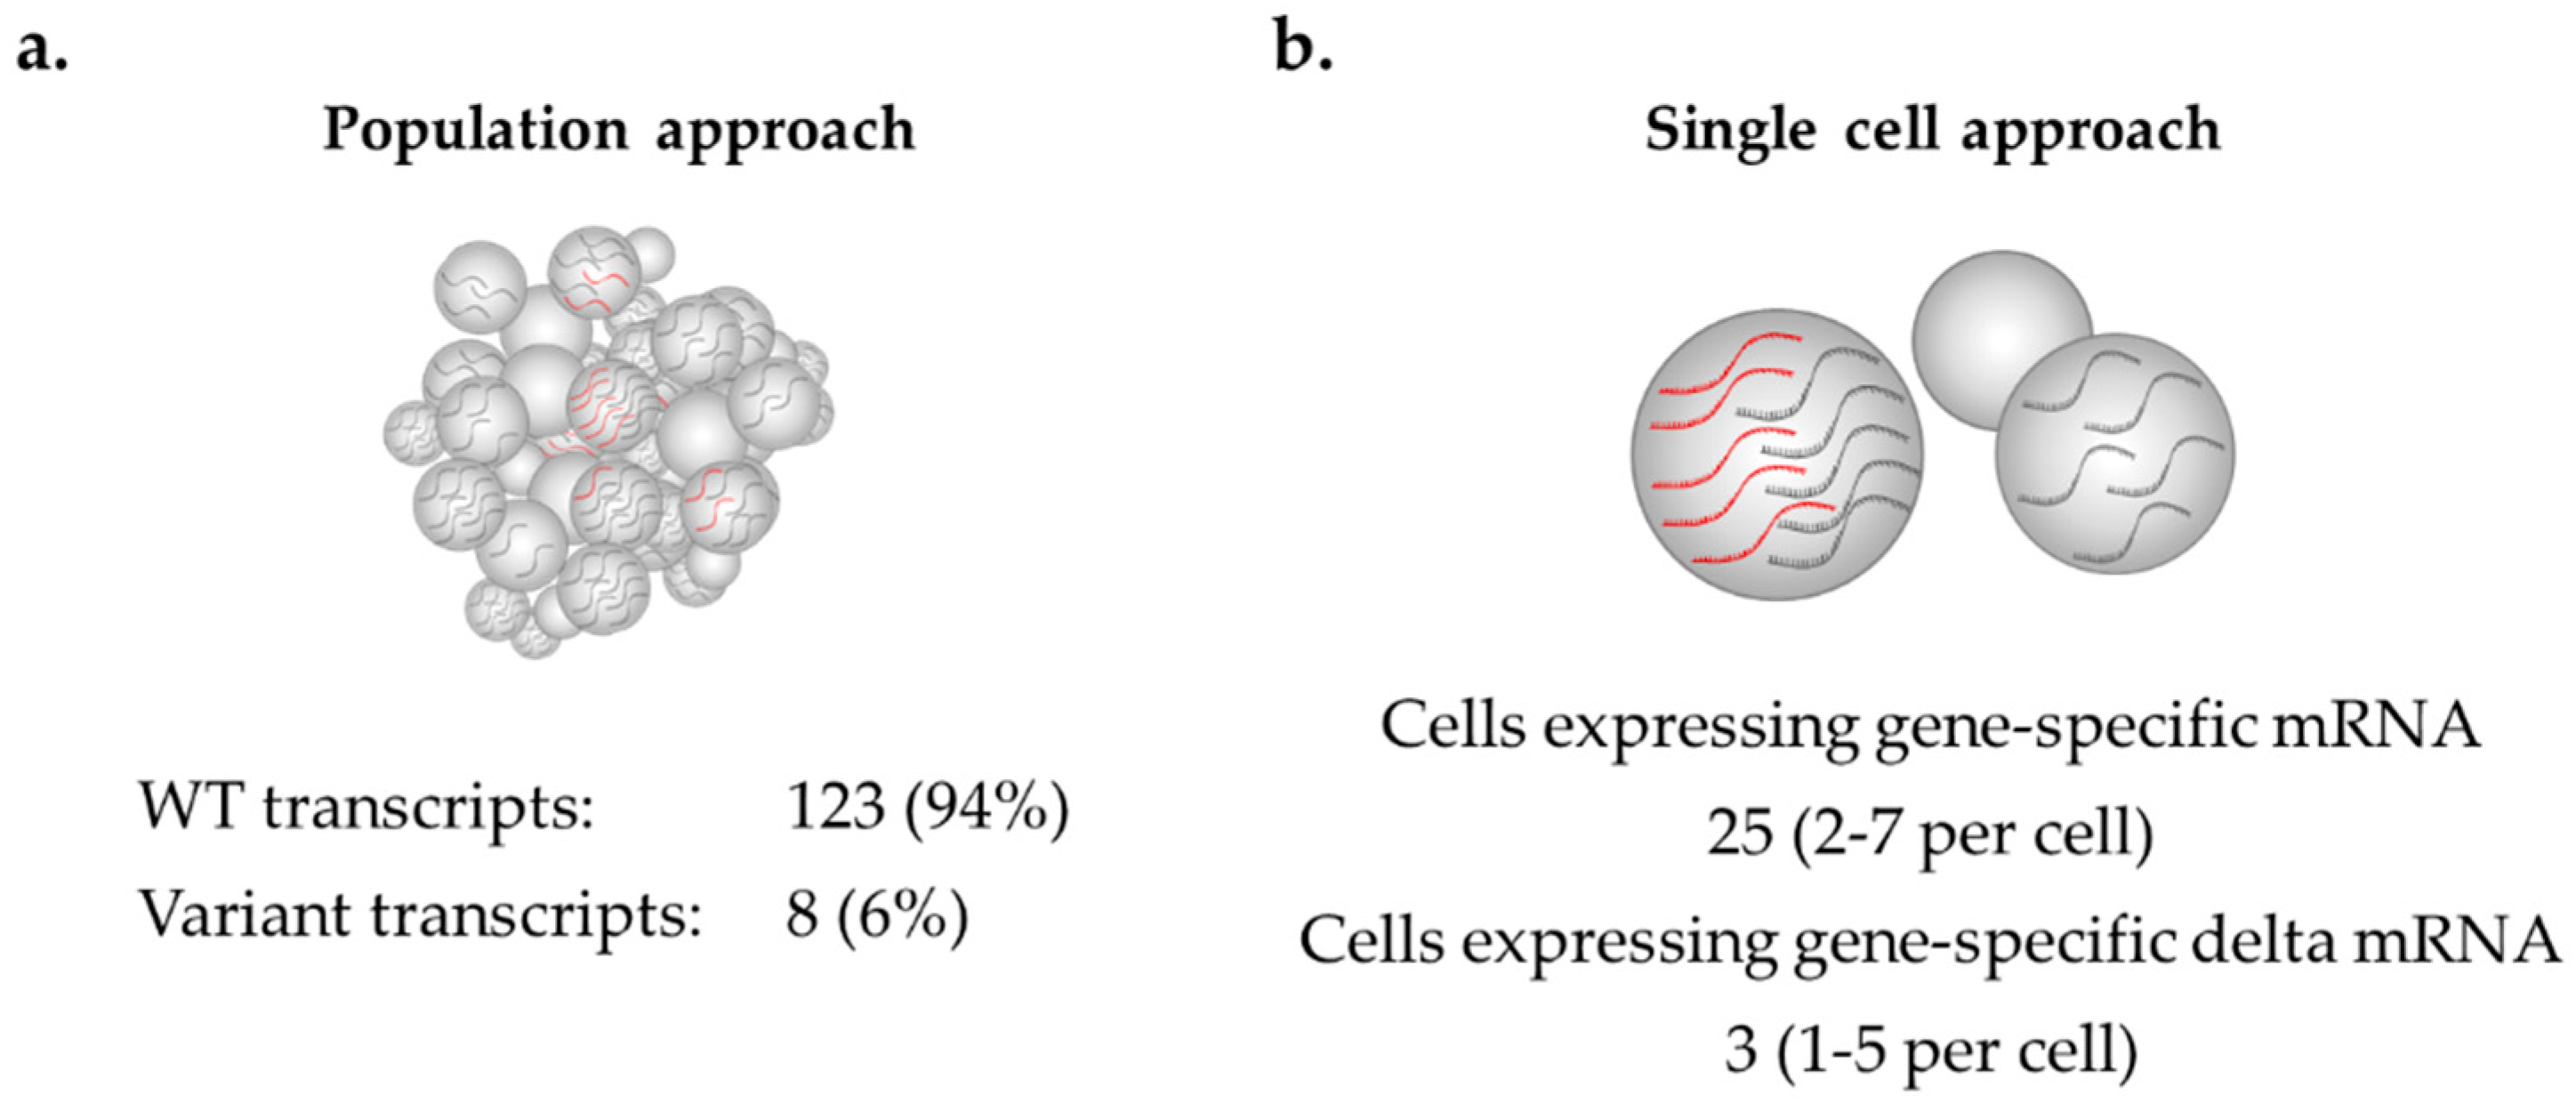
mRNA isoforms detected in samples at very low levels might actually be highly abundant in a small number of cells, but this observation can only be detected at the single-cell level, as seen in
Figure 3. Such isoform expression changes may be associated with an increased risk of disease, as a higher proportion of aberrant transcripts in a single cell may significantly increase the likelihood of cellular disruption, leading to cancer development, but may go undetected using cell population-based methods. RNAscope enables
BRCA1 and
BRCA2 alternative mRNA isoforms to be studied at a single molecule resolution to determine the expression range at which each isoform is tolerated in normal cells. Such information may help identify gene expression changes in patient samples that are outside the expected range. RNAscope may offer an alternative means for future diagnostic work to assess splice isoforms across individual cells using archival tissue (e.g., formalin fixed paraffin embedded tissue) and to identify cell-specific overexpression in different tissue types.
Nonsense-mediated decay inhibitors are often used in splicing analysis to prevent the degradation of mRNA [
4], thus improving the chances of detecting the present mRNA transcripts. Our study has showed both an increased number of
BRCA1 and
BRCA2 transcripts, and an increase in the number of cells containing transcripts, in the treated samples compared to the untreated samples. Higher expression in the treated samples facilitated the detection of the targeted alternative splicing event, suggesting that NMD inhibitor treatment is advantageous when analysing
BRCA1 or
BRCA2 transcript expression with RNAscope.
Our study is proof of concept, demonstrating the utility of RNA in situ hybridisation to characterise the effects of spliceogenic variants at the single cell level. Our study had several potential limitations, including the use of a single control and the number of cells analysed (
n = 50), which might have led to an under-representation of some isoforms, such as those that were lowly expressed. Increasing the total number of cells counted in each sample may provide a more accurate survey of isoform expression patterns. However, counting a greater number of cells would be relatively laborious using manual assessment. This challenge could be alleviated by using image analysis software, such as the Aperio RNA ISH Algorithm (Leica Biosystems), or Cell Profiler (
http://cellprofiler.org/). It is important to note that there is paucity in published data relating to the efficacy of these image analysis software tools. It is unclear why some cells contained a greater number of C1 (targeting the deletion of interest) probe signals compared to the reference C2 (targets all gene-specific transcripts) probe signals as seen in
Supplementary Tables S1–S4. While the C1 and C2 regions of any mature mRNA containing both domains are adjacent and thus predicted to generate corresponding signals in overlapping locations within the cell, our current scoring method does not allow for this analysis. Future research may employ confocal microscopy and image analysis tools, which enable the 3D imaging of transcripts detected using dual probe fluorescence. This could be a technical issue relating to probe binding and signal amplification efficiency, which could be addressed by sampling sufficient cell numbers. This disparity may also be due to probes binding to pre-mRNA. However, the time from transcription to pre-mRNA splicing is thought to be very short, only 2.5–3 min [
12], while the mRNA half-life of
BRCA1 and
BRCA2 is 4.5 and 4.8 h [
13], respectively. The proportion of C1 and C2 signals binding to pre-mRNA for either gene is therefore likely to be very small at any given time. A further explanation of this observation may be in relation to the expression of alternative spliced transcripts, which could be missing large parts of the C2, but not C1, probe-binding region. While predominant alternative isoforms are known for both
BRCA1 (∆3) and
BRCA2 (∆12) [
1,
2], these exons are each only a relatively small proportion of the possible C2 probe-binding region and so are not expected to influence the detection of the gene transcript. However, additional splicing events that are further restricting the number of binding sites may be present.
The unique probe design RNAscope uses to obtain high specificity also limits the number of isoforms that can be detected with this technique. Three probe pairs are required to return a detectable signal, with each pair taking up 36–50 nucleotides of the target sequence, while 10–20 pairs are recommended to gain optimal detection [
8]. This limits the minimal target size to ~350 bases in length, which is larger than many single
BRCA1 and
BRCA2 exons. With the advent of BaseScope
TM (Advanced Cell Diagnostics, Newark, CA, USA), specific mRNA transcripts are now able to be detected using shorter probes [
14]. However, this method is specific to a targeted splice junction and therefore may not detect multiple isoforms with overlapping deletion events. For example, the detection of
BRCA1 ∆11 using BaseScope
TM probes spanning the exon 10_12 junction will not identify the
BRCA1 ∆9_11 splice event, even though both isoforms contain a deletion of the large exon 11 sequence. Thus, assays targeting exon 11 may be utilised to examine potentially ‘leaky’ variants, which give rise to multiple alternative isoforms.
To our knowledge, this is the first study to reveal
BRCA1 and
BRCA2 mRNA expression patterns at the single cell level in LCLs. This technology could potentially play an important role in assessing variable expression levels of
BRCA1 and
BRCA2 isoforms by establishing whether mRNA isoforms detected in samples at very low levels may actually be highly abundant, but in a small number of cells. Such findings may be associated with an increased risk of disease, yet might go undetected using cell population-based methods because the number of cells expressing the aberrant change is likely to be insufficient to indicate an association with disease. Spliceogenic variants previously dismissed as low-risk might need to be re-evaluated at the single cell level to determine if aberrant mRNA isoforms are being expressed at high levels but in a low number of cells. Furthermore, single cell expression analysis provides an important means for investigating the poorly explored link between many human diseases and gene expression variability (variance) [
15,
16]. Such studies may uncover crucial indicators of early cancer development and would open the door for technologies like RNAscope to be applied in diagnostic work in the future.

 ,
, 


