Article

Species Identification of Oaks (Quercus L., Fagaceae) from Gene to Genome

1
Research Institute of Forestry, Chinese Academy of Forestry, Beijing 100091, China
2
Administration Bureau of Hongyashan State Owned Forest Farm in Yixian County, Yixian 074200, China
3
State Key Laboratory of Tree Genetics and Breeding, Chinese Academy of Forestry, Beijing 100091, China
4
Key Laboratory of Tree Breeding and Cultivation of State Forestry Administration, Chinese Academy of Forestry, Beijing 100091, China
*
Author to whom correspondence should be addressed.
Int. J. Mol. Sci. 2019, 20(23), 5940; https://doi.org/10.3390/ijms20235940
Submission received: 24 September 2019 / Revised: 5 November 2019 / Accepted: 8 November 2019 / Published: 26 November 2019
(This article belongs to the Special Issue Plant Genomics 2019)

Abstract

:
Species identification of oaks (Quercus) is always a challenge because many species exhibit variable phenotypes that overlap with other species. Oaks are notorious for interspecific hybridization and introgression, and complex speciation patterns involving incomplete lineage sorting. Therefore, accurately identifying Quercus species barcodes has been unsuccessful. In this study, we used chloroplast genome sequence data to identify molecular markers for oak species identification. Using next generation sequencing methods, we sequenced 14 chloroplast genomes of Quercus species in this study and added 10 additional chloroplast genome sequences from GenBank to develop a DNA barcode for oaks. Chloroplast genome sequence divergence was low. We identified four mutation hotspots as candidate Quercus DNA barcodes; two intergenic regions (matK-trnK-rps16 and trnR-atpA) were located in the large single copy region, and two coding regions (ndhF and ycf1b) were located in the small single copy region. The standard plant DNA barcode (rbcL and matK) had lower variability than that of the newly identified markers. Our data provide complete chloroplast genome sequences that improve the phylogenetic resolution and species level discrimination of Quercus. This study demonstrates that the complete chloroplast genome can substantially increase species discriminatory power and resolve phylogenetic relationships in plants.

1. Introduction

DNA barcoding has recently emerged as a new molecular tool for species identification [1]. A DNA barcode is a short, standardized DNA region normally employed for species identification. The mitochondrial gene cytochrome oxidase 1 (COI) is an effective and reliable standard animal DNA barcode for species identification [1]. Over the past 10 years, plant DNA barcode researchers have been evaluating the proposed barcode segments of plants. Previously proposed barcode segments exist primarily in chloroplast genomes that are relatively stable, single-copy, and easy to amplify. These proposed barcodes are matK, rbcL, ropC1, and rpoB in the coding region, and atpF-H, trnL-F, trnH-psbA, and psbK-I in the non-coding region [2]. At the third DNA barcode conference held in Mexico City in 2009, the majority of the Consortium for the Barcode of Life (CBOL) Plant Working Group preferred to recommend a core-barcode combination consisting of portions of two plastid coding regions, rbcL and matK, which are supplemented with additional markers (such as trnH-psbA and internal transcribed spacers [ITS]) as required. In 2011, the China Plant BOL Group suggested using ITS as the plant DNA barcode [3]. However, increasing numbers of studies show that core-barcodes remain problematic, especially in recently diverged and rapidly radiated taxa [4,5,6].
With the development of next-generation sequencing (NGS), the number of sequenced chloroplast genomes has increased rapidly, making it possible to generate chloroplast genome data to extend the concept of DNA barcoding for plant species identification [6,7,8,9]. The DNA barcoding approaches for species identification has extended from gene to genome, promptly extending phylogeny analysis from gene-based phylogenetics to phylogenomics. Chloroplast genome sequences are a primary source of data for inferring plant phylogenies and DNA barcoding because of their conserved gene content and genome structure, low nucleotide substitution mutation rates, usually uni-parental inheritance, and the low cost of generating whole chloroplast genomes with high throughput sequencing. Using chloroplast genome data, longstanding controversies at various taxonomic levels have been resolved [10,11,12], suggesting its power in resolving evolutionary relationships. However, challenges still exist in establishing phylogeny relationships and discrimination of closely related, recently divergent, hybridized, or introgressed lineages such as the oak group.
Oaks (Quercus L., Fagaceae) comprise approximately 400–500 species that are widespread throughout the temperate zones of the Northern Hemisphere; they are dominant, diverse forest and savannah angiosperm trees and shrubs belonging to a taxonomically complex group. The taxonomy of oak species remains controversial and incomplete, owing to the overlapping variation of individuals and population produced by ecological adaptation and differential reproductive isolation. A series of phylogenetic and DNA barcoding studies have mainly used several chloroplast DNA markers [13,14] such as rbcL, rpoC1, trnH-psbA, matK, ycf3-trnS, ycf1, and the nuclear ribosomal DNA ITS [4,15,16,17]. These studies focused only on regional flora, and those markers revealed low sequence divergence leading to lower discrimination success [4,18]. Yang et al. [13] compared two closely related species (Quercus rubra and Castanea mollissima) by exploring nine highly variable chloroplast DNA markers for species identification. However, the results showed a very low discrimination success rate using a single marker and all their combinations. On the other hand, oaks are notorious for interspecific hybridization and introgression, as well as complex speciation patterns involving incomplete lineage sorting [19,20,21], which have possible negative effects for barcoding and phylogeny of the species-rich Quercus genus [4].
In this study, we sequenced the complete chloroplast genome of 14 Quercus species and combined the previously reported chloroplast genomes of 10 other Quercus species in order to provide a comparative analysis. The study aimed to (1) investigate the genome structure, gene order, and gene content of the whole chloroplast genome of multiple Quercus species; (2) test whether chloroplast genome data yielded sufficient variation to construct a well-supported phylogeny of Quercus species; and (3) determine if multiple variable markers or whole chloroplast genome data can be successfully used for oaks species identification.

2. Results

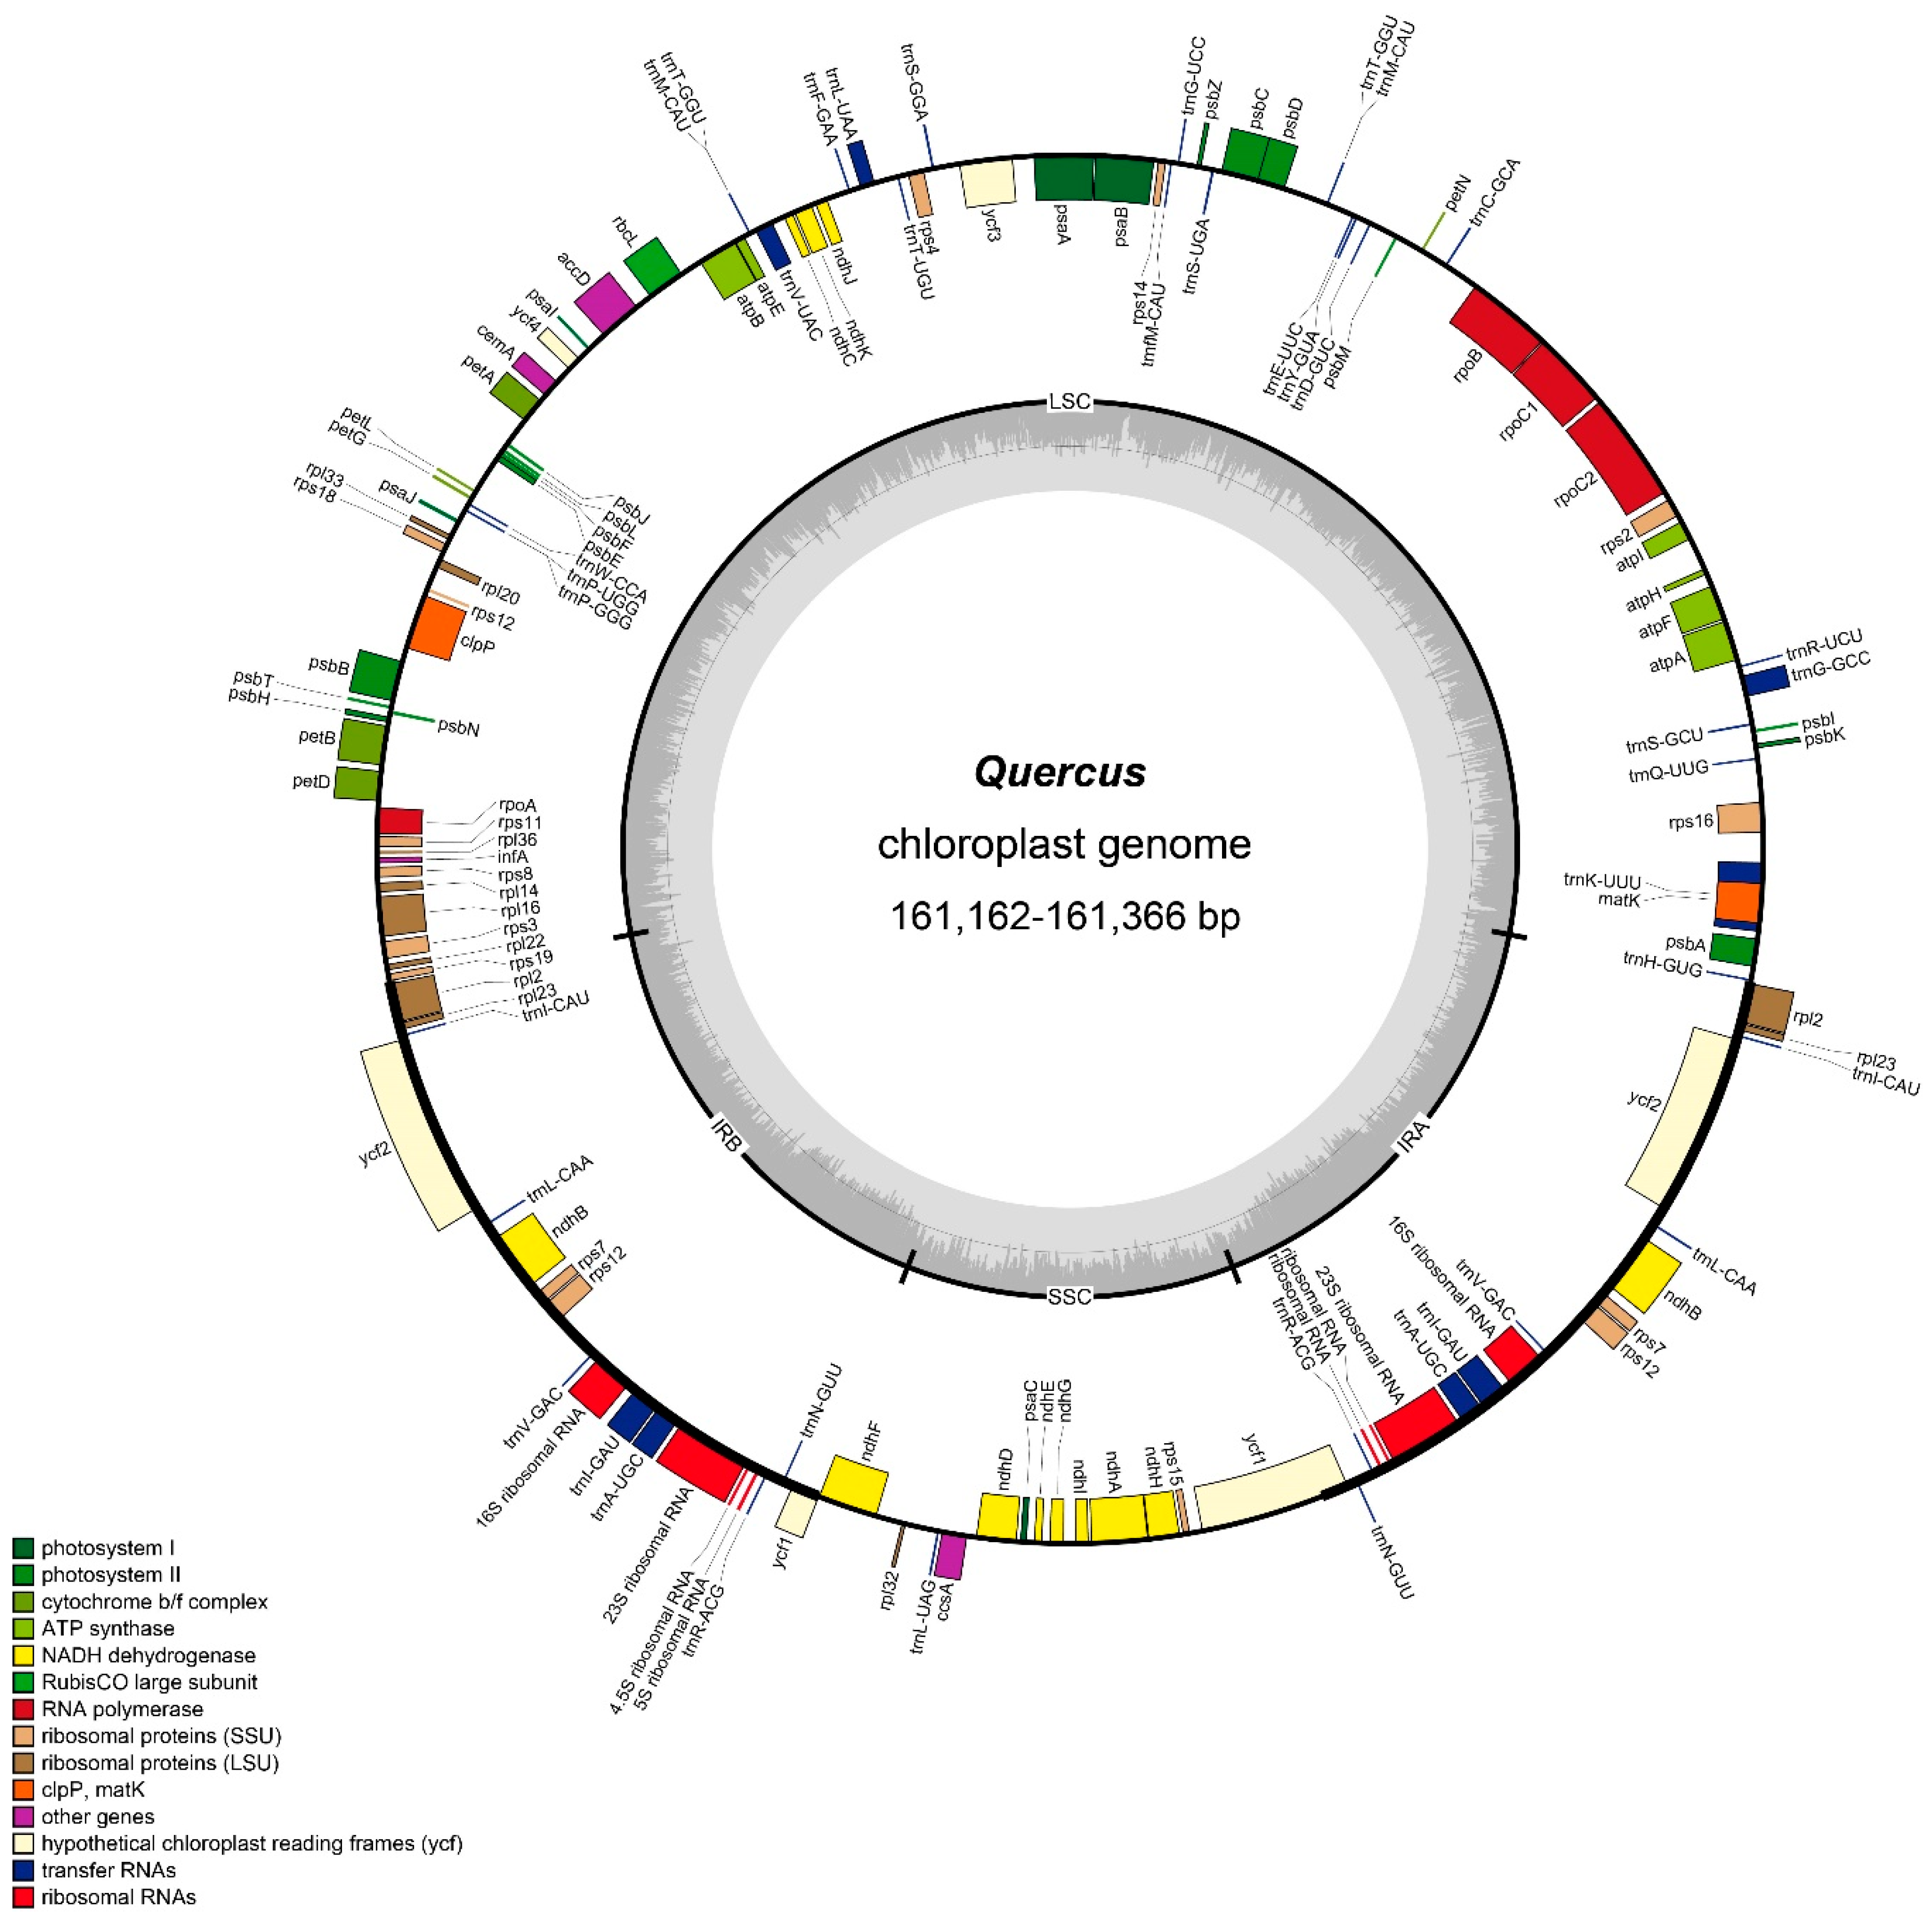
2.1. General Features of the Quercus Chloroplast Genome

Using the Illumina HiSeq X Ten system, 14 Quercus species were sequenced to produce 9,910,273–16,862,000 paired-end raw reads (150 bp average read length), with an average sequencing depth of 162× to 480× (Table S1). To validate the accuracy of the assembled chloroplast genome, we carried out Sanger sequencing of PCR amplicons spanning the junction regions (LSC/IRA, LSC/IRB, SSC/IRA, and SSC/IRB). The 14 Quercus chloroplast genome sequences were deposited in GenBank (accession numbers MK105451–MK105453, MK105456–MK105464, and MK105466-MK105467).
The total chloroplast genome sequence lengths of 14 Quercus species ranged from 161,132 bp (Q. phillyraeoides) to 161,366 bp (Q. rubra). These genomes displayed typical circular quadripartite structure consisting of a pair of IR regions (25,817–25,870 bp) separated by an LSC region (90,363–90,624 bp) and an SSC region (18,946–19,073 bp) (Figure 1). The overall GC content was absolutely identical (36.8%; Table 1) across all plastomes, but was clearly higher in the IR region (42.8%) than in the other regions (LSC 34.7%; SSC 30.9%), possibly because of the high GC content of the rRNA that was located in the IR regions. All plastomes possessed 113 unique genes, including 79 protein-coding genes, 30 tRNA genes, and 4 rRNA genes. Among the unique genes, 15 genes contained one intron, and two genes contained two introns.
The chloroplast genome results showed that all 14 Quercus plastomes were remarkably similar in terms of size, genes, and genome structures. The LSC/IR and IR/SSC boundaries were conserved. Rps19 was located in the LSC near the LSC/IRb, and trnH-GUG was located in the LSC near the IRa/LSC border. Additionally, the location of the SSC/IRa junction was within the coding region of the ycf1 gene.

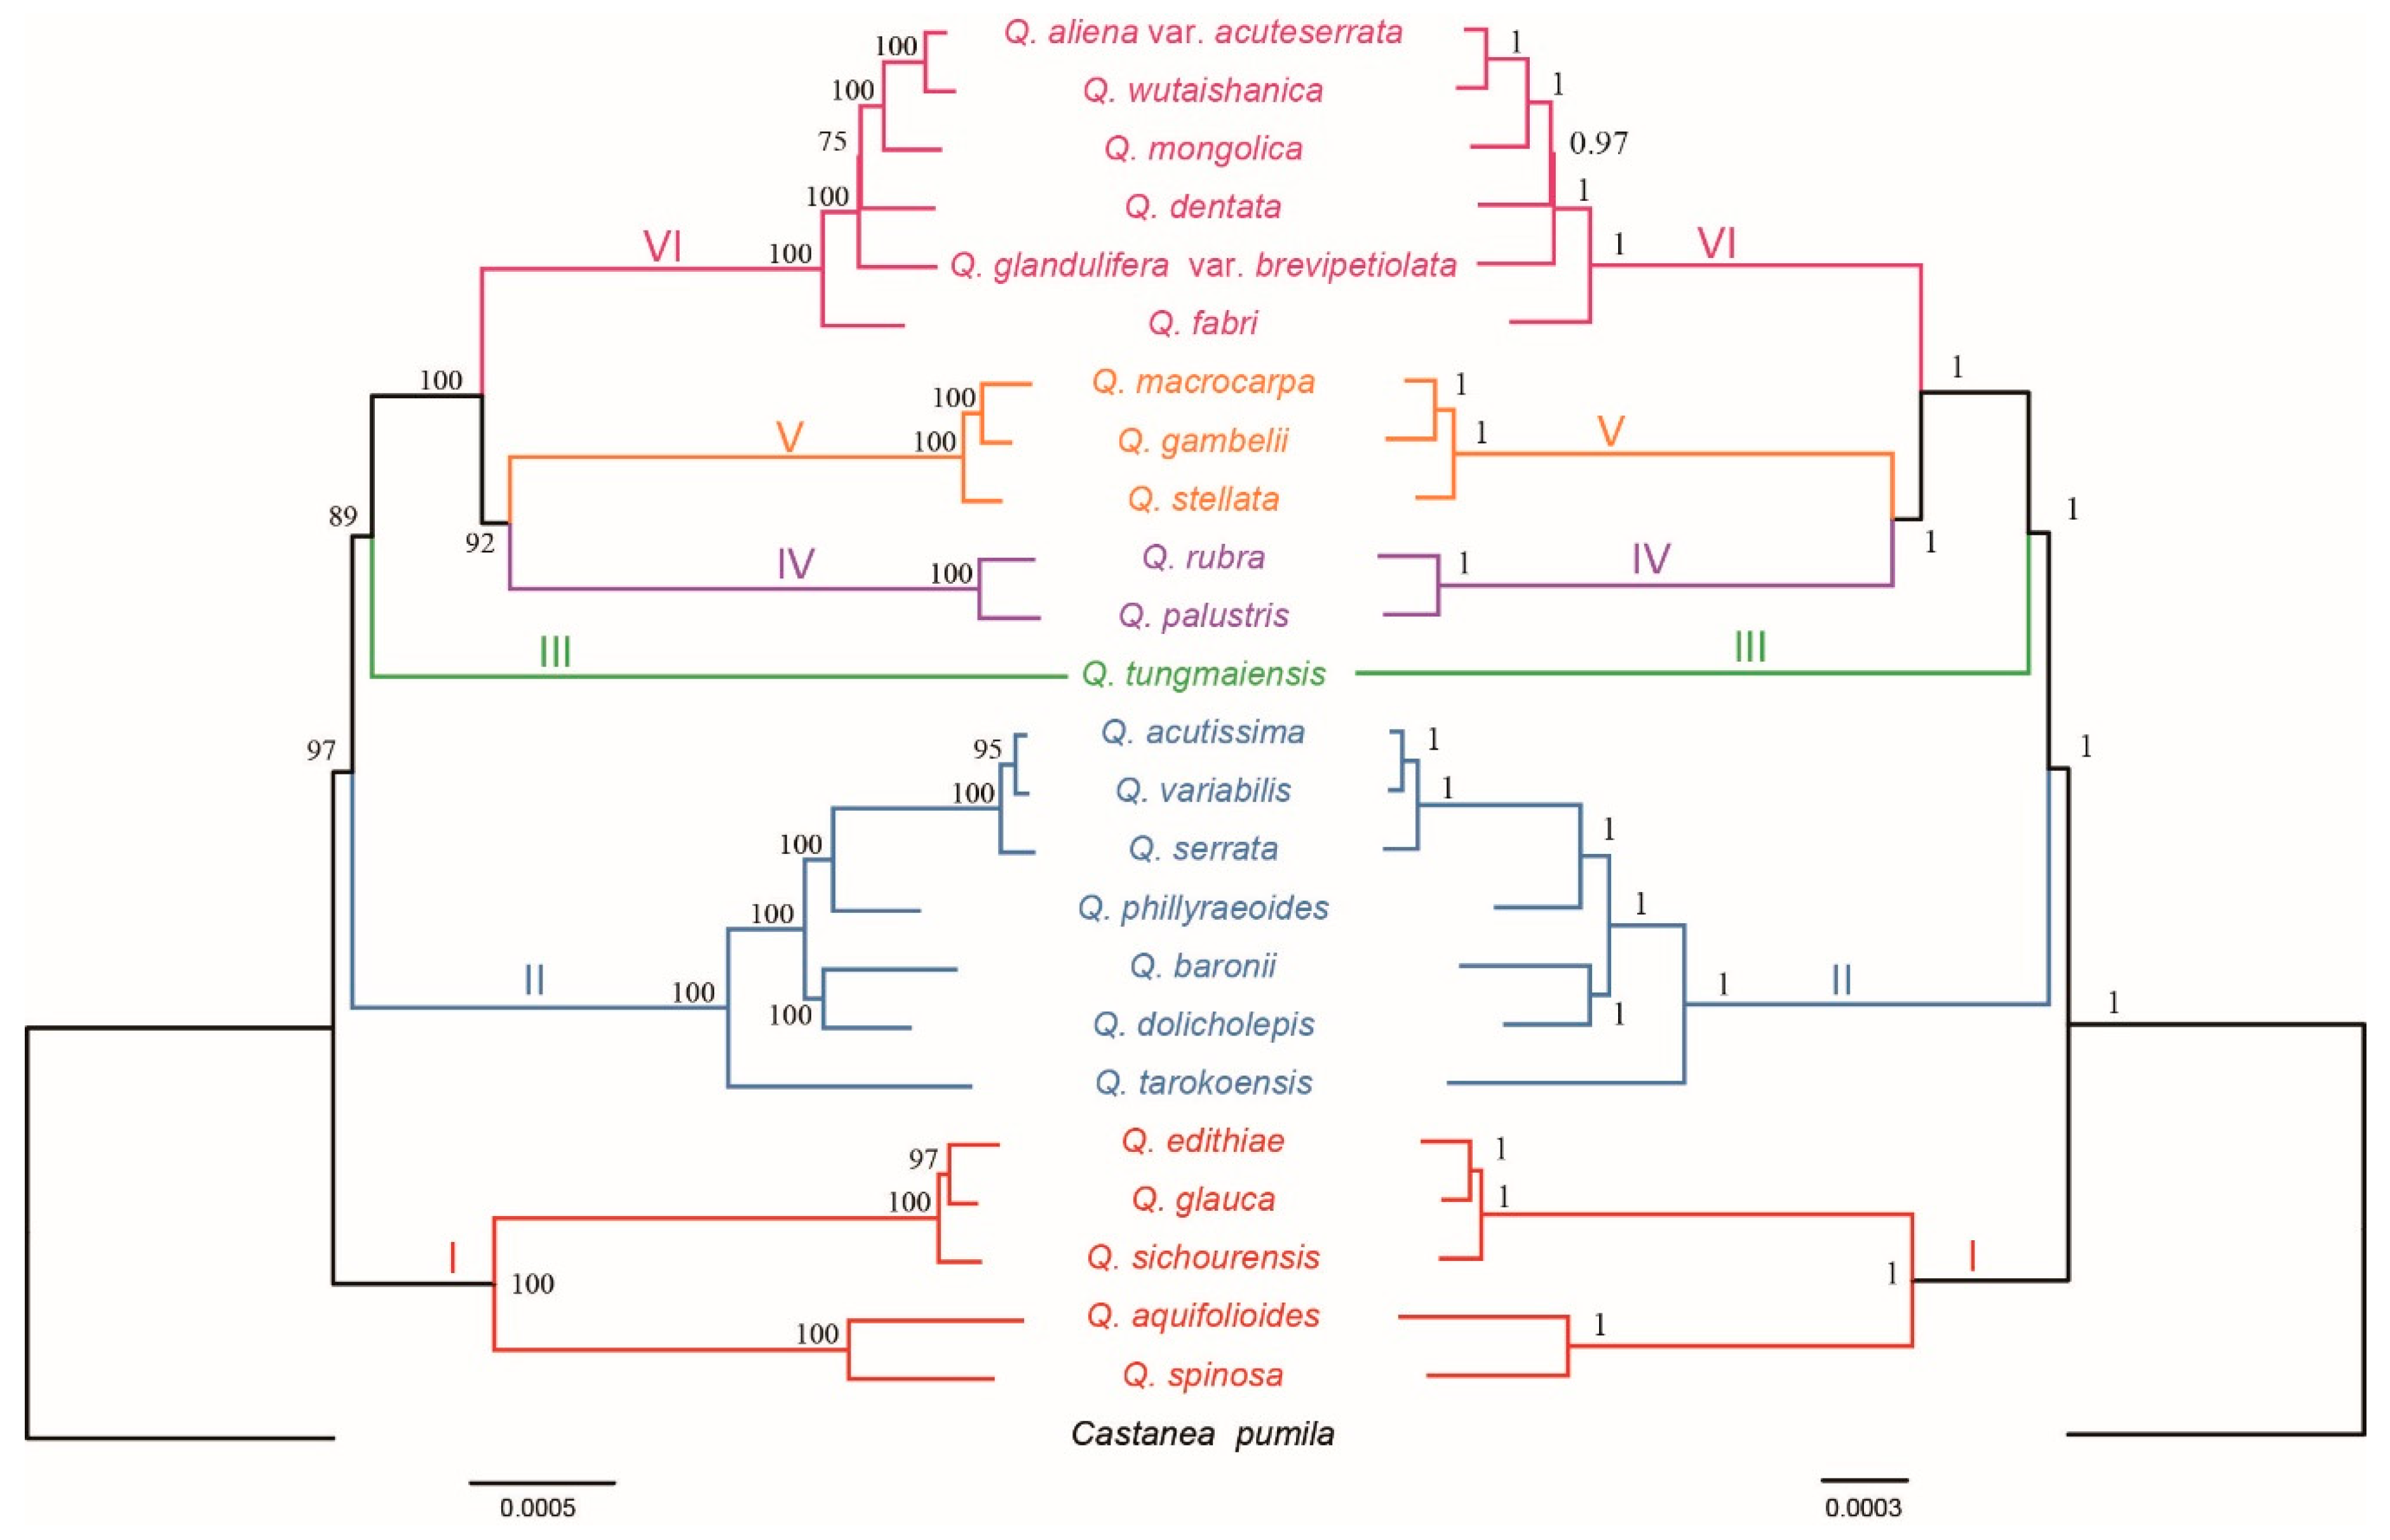
2.2. Phylogenetic Analyses

The matrix of whole chloroplast genome sequences was used to reconstruct the Quercus phylogenetic tree (Figure 2). Both maximum likelihood and Bayesian analyses produced similar topologies for the 24 species and were highly branch supported. All the sampled Quercus species were clustered into one clade with 100% bootstrap value (BS) or Bayesian posterior probability (PP). However, backbone branch supports were relatively poor, as were some internal branches. Moreover, six major clades were identified in Quercus and the analyses obtained high support for all six of the nodes.
Clade I on the base of the tree (BS = 100% and PP = 1) comprised Q. edithiae, Q. gambelii, Q. sichourensis, Q. aquifolioides, and Q. spinosa being the earliest diverging lineages. Clade II (BS = 100% and PP = 1) contained seven species: Q. acutissima, Q. variabilis, Q. serrata, Q. phillyraeoides, Q. dolicholepis, Q. baronii, and Q. tarokoensis. Clade III only contained Q. tungmaiensis. Q. rubra and Q. palustris formed clade IV, which was identified as a sister to clade V with high support value (BS = 92% and PP = 1). Clade V included three species, Q. macrocarpa, Q. glauca, and Q. stellata. The last clade (BS = 100% and PP = 1) was made up of Q. aliena var. acuteserrata, Q. wutaishanica, Q. mongolica, Q. fabri, Q. glandulifera var. brevipetiolata, and Q. dentata.

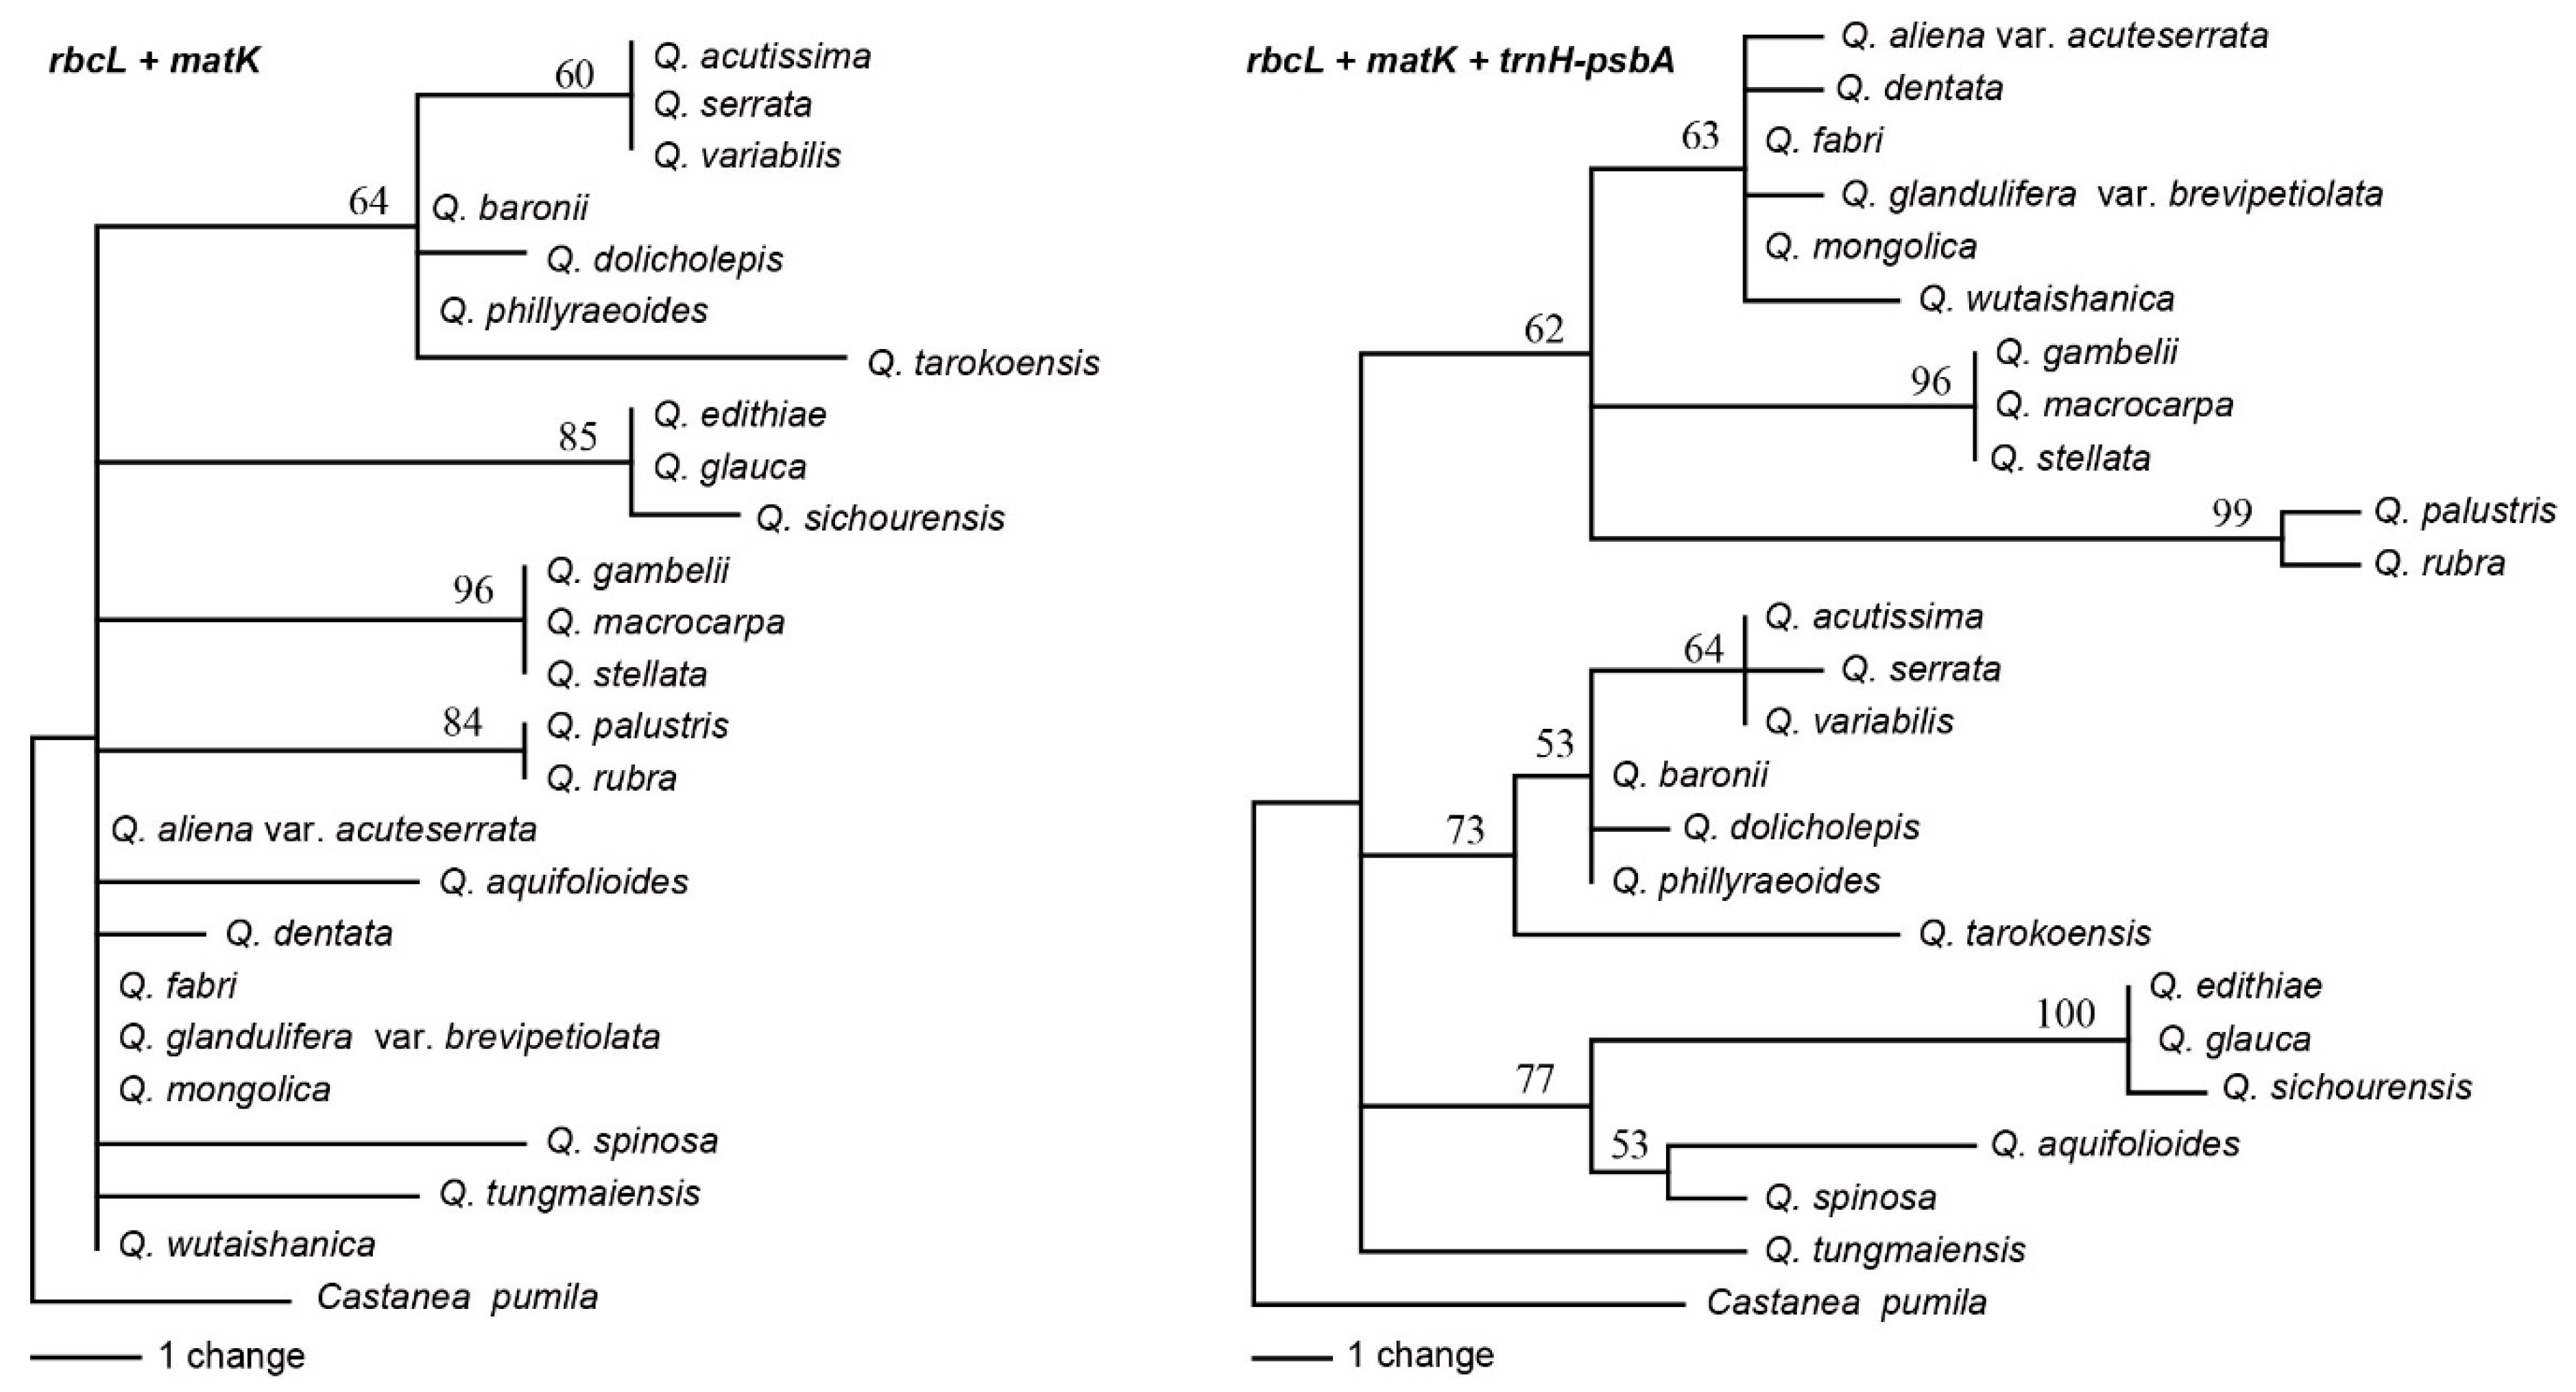
2.3. Analyses of the Standard DNA Barcodes

The trnH-psbA intergenic spacer region ranged from 412 bp to 474 bp with 27 variable sites, 16 informative sites, and nine indels of 3–20 bp within 574 aligned bp. A small 32 bp inversion occurred at 454 bp. RbcL and matK genes, both without indels, were 698 bp with eight variable and five informative sites, and 744 bp with 21 variable and 11 informative sites, respectively (Table 2). The mean interspecific genetic distances of the 24 oaks species with K2P were 0.0026 for rbcL, 0.0048 for matK, and 0.0125 for trnH-psbA. Based on the distance method, the universal DNA barcode had less discriminatory power; rbcL, matK, and trnH-psbA had only a 12.50%, 25.00%, and 37.50% success rate, respectively. With the two core DNA barcodes (rbcL and matK) combined, success was only 29.17%. Combined analyses of rbcL, matK, and trnH-psbA or rbcL and matK generated lower branch supported trees (Figure 3).

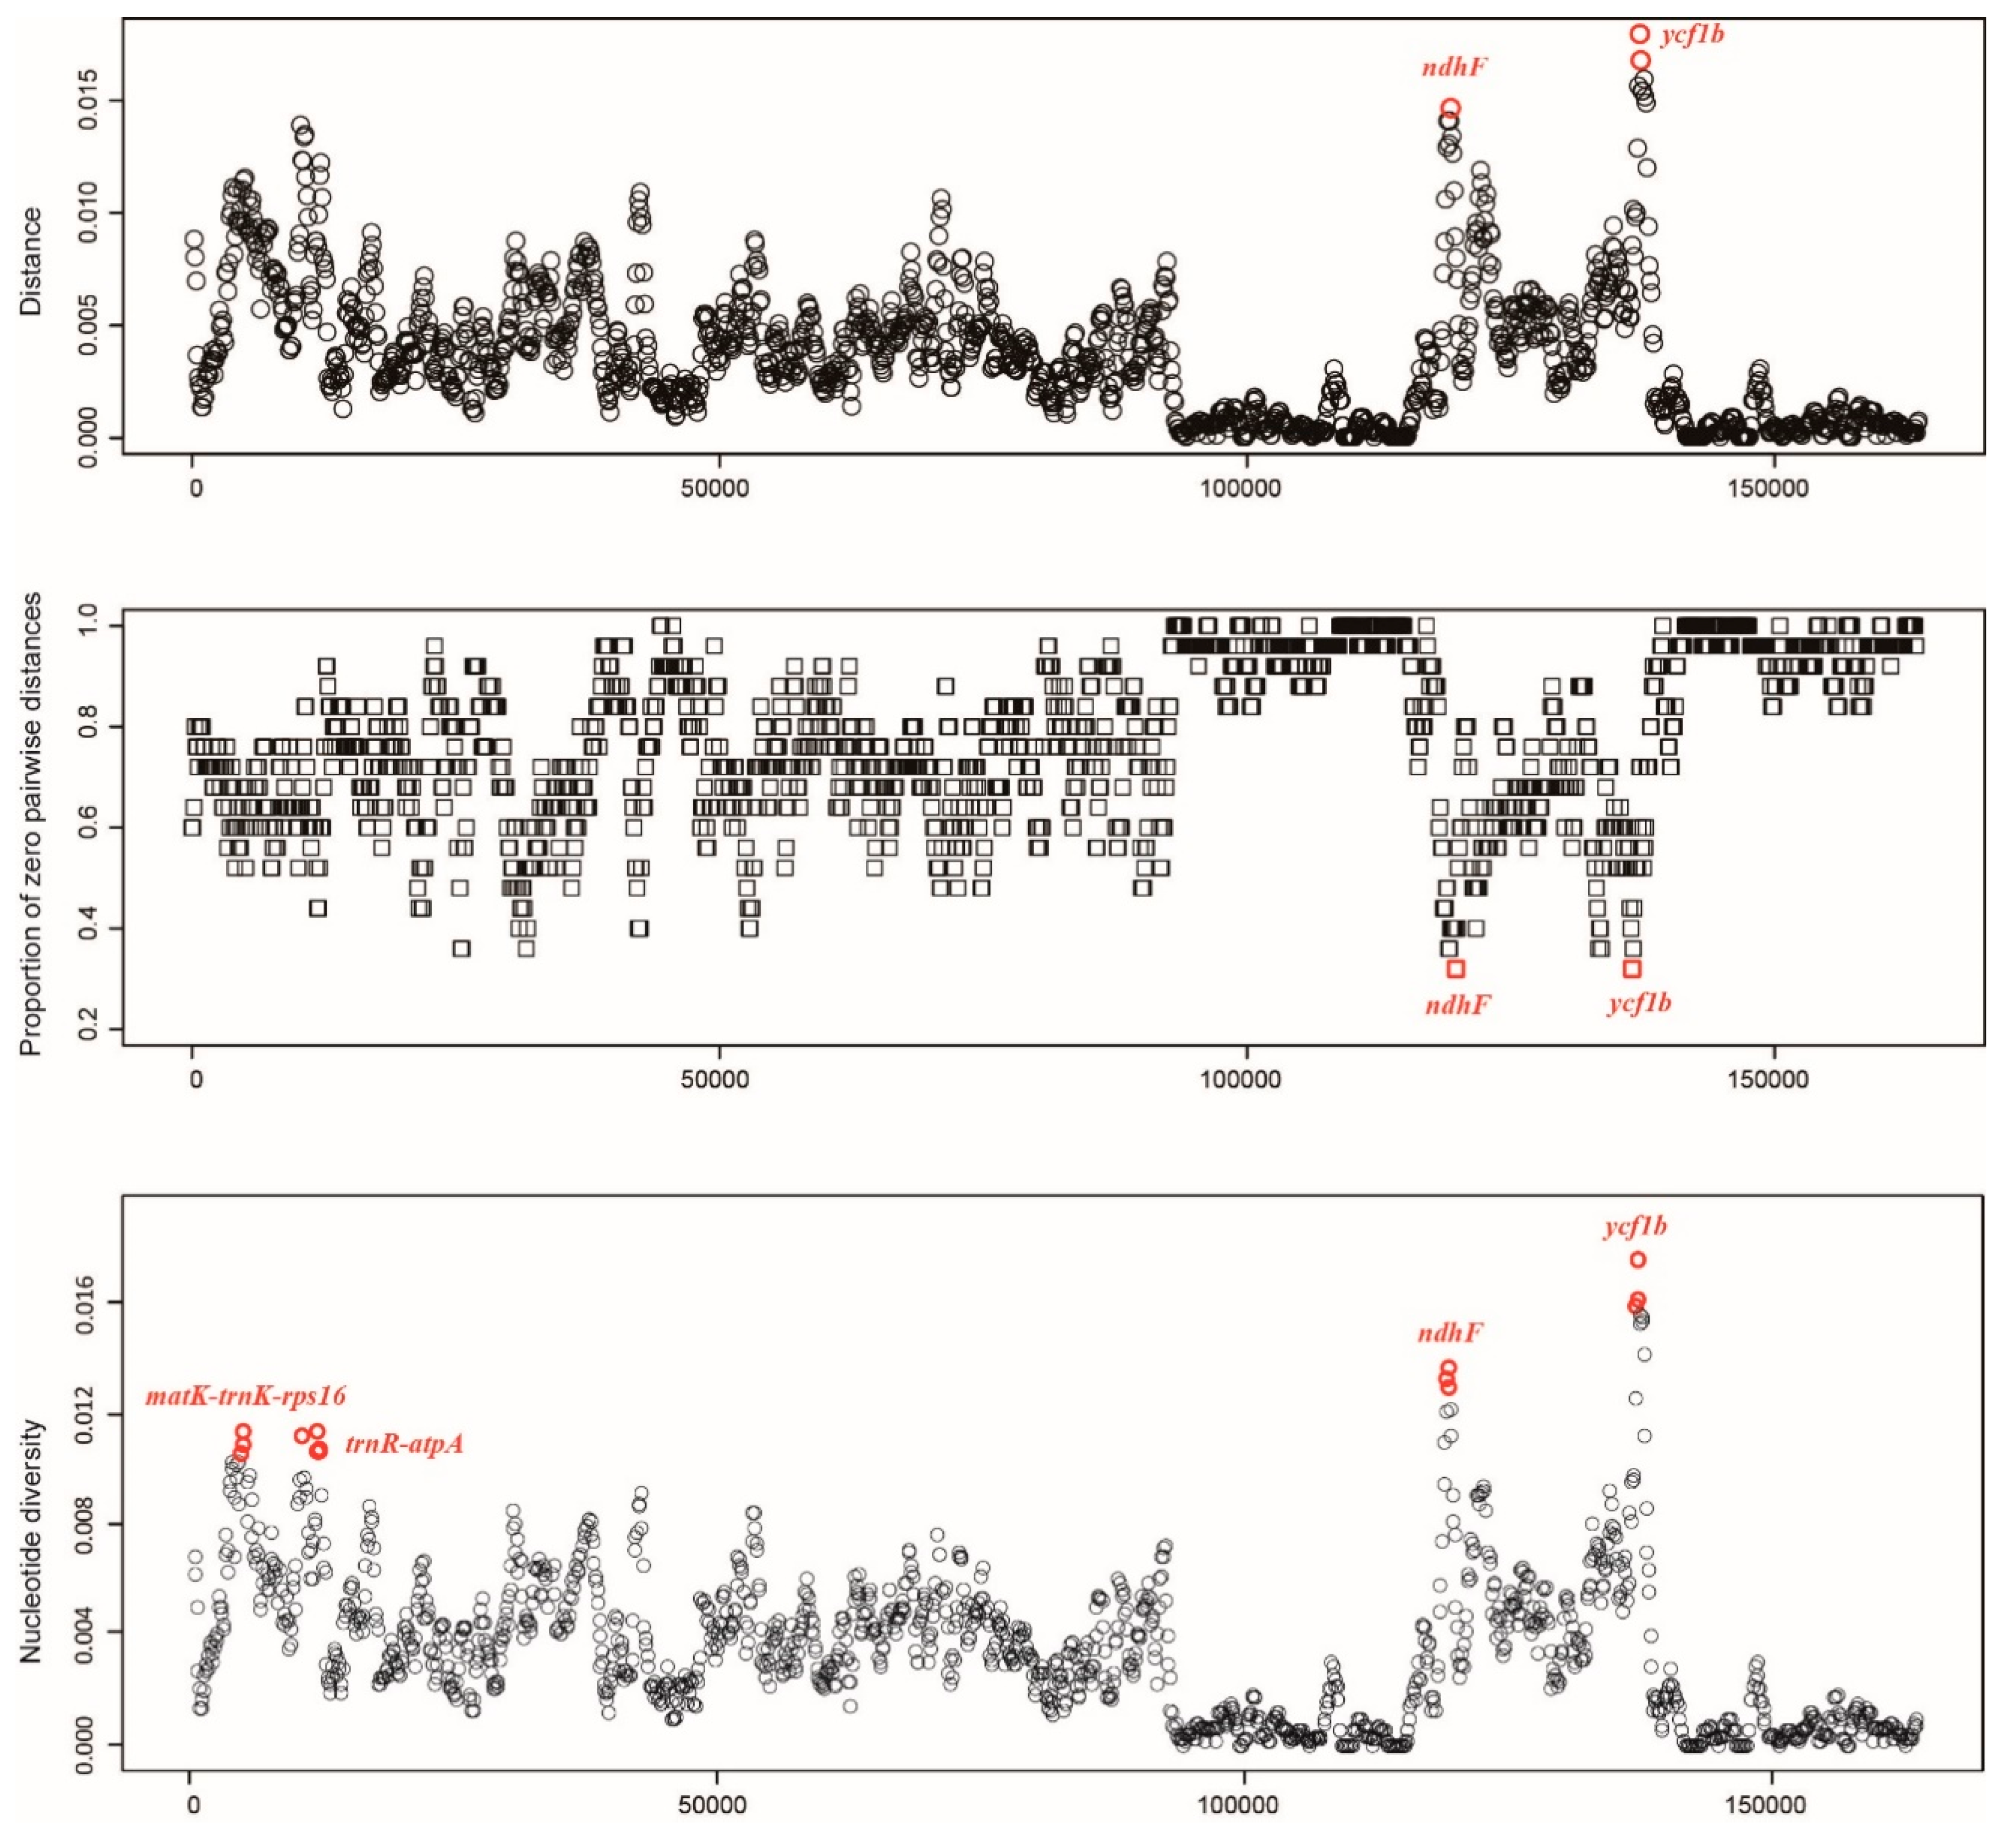
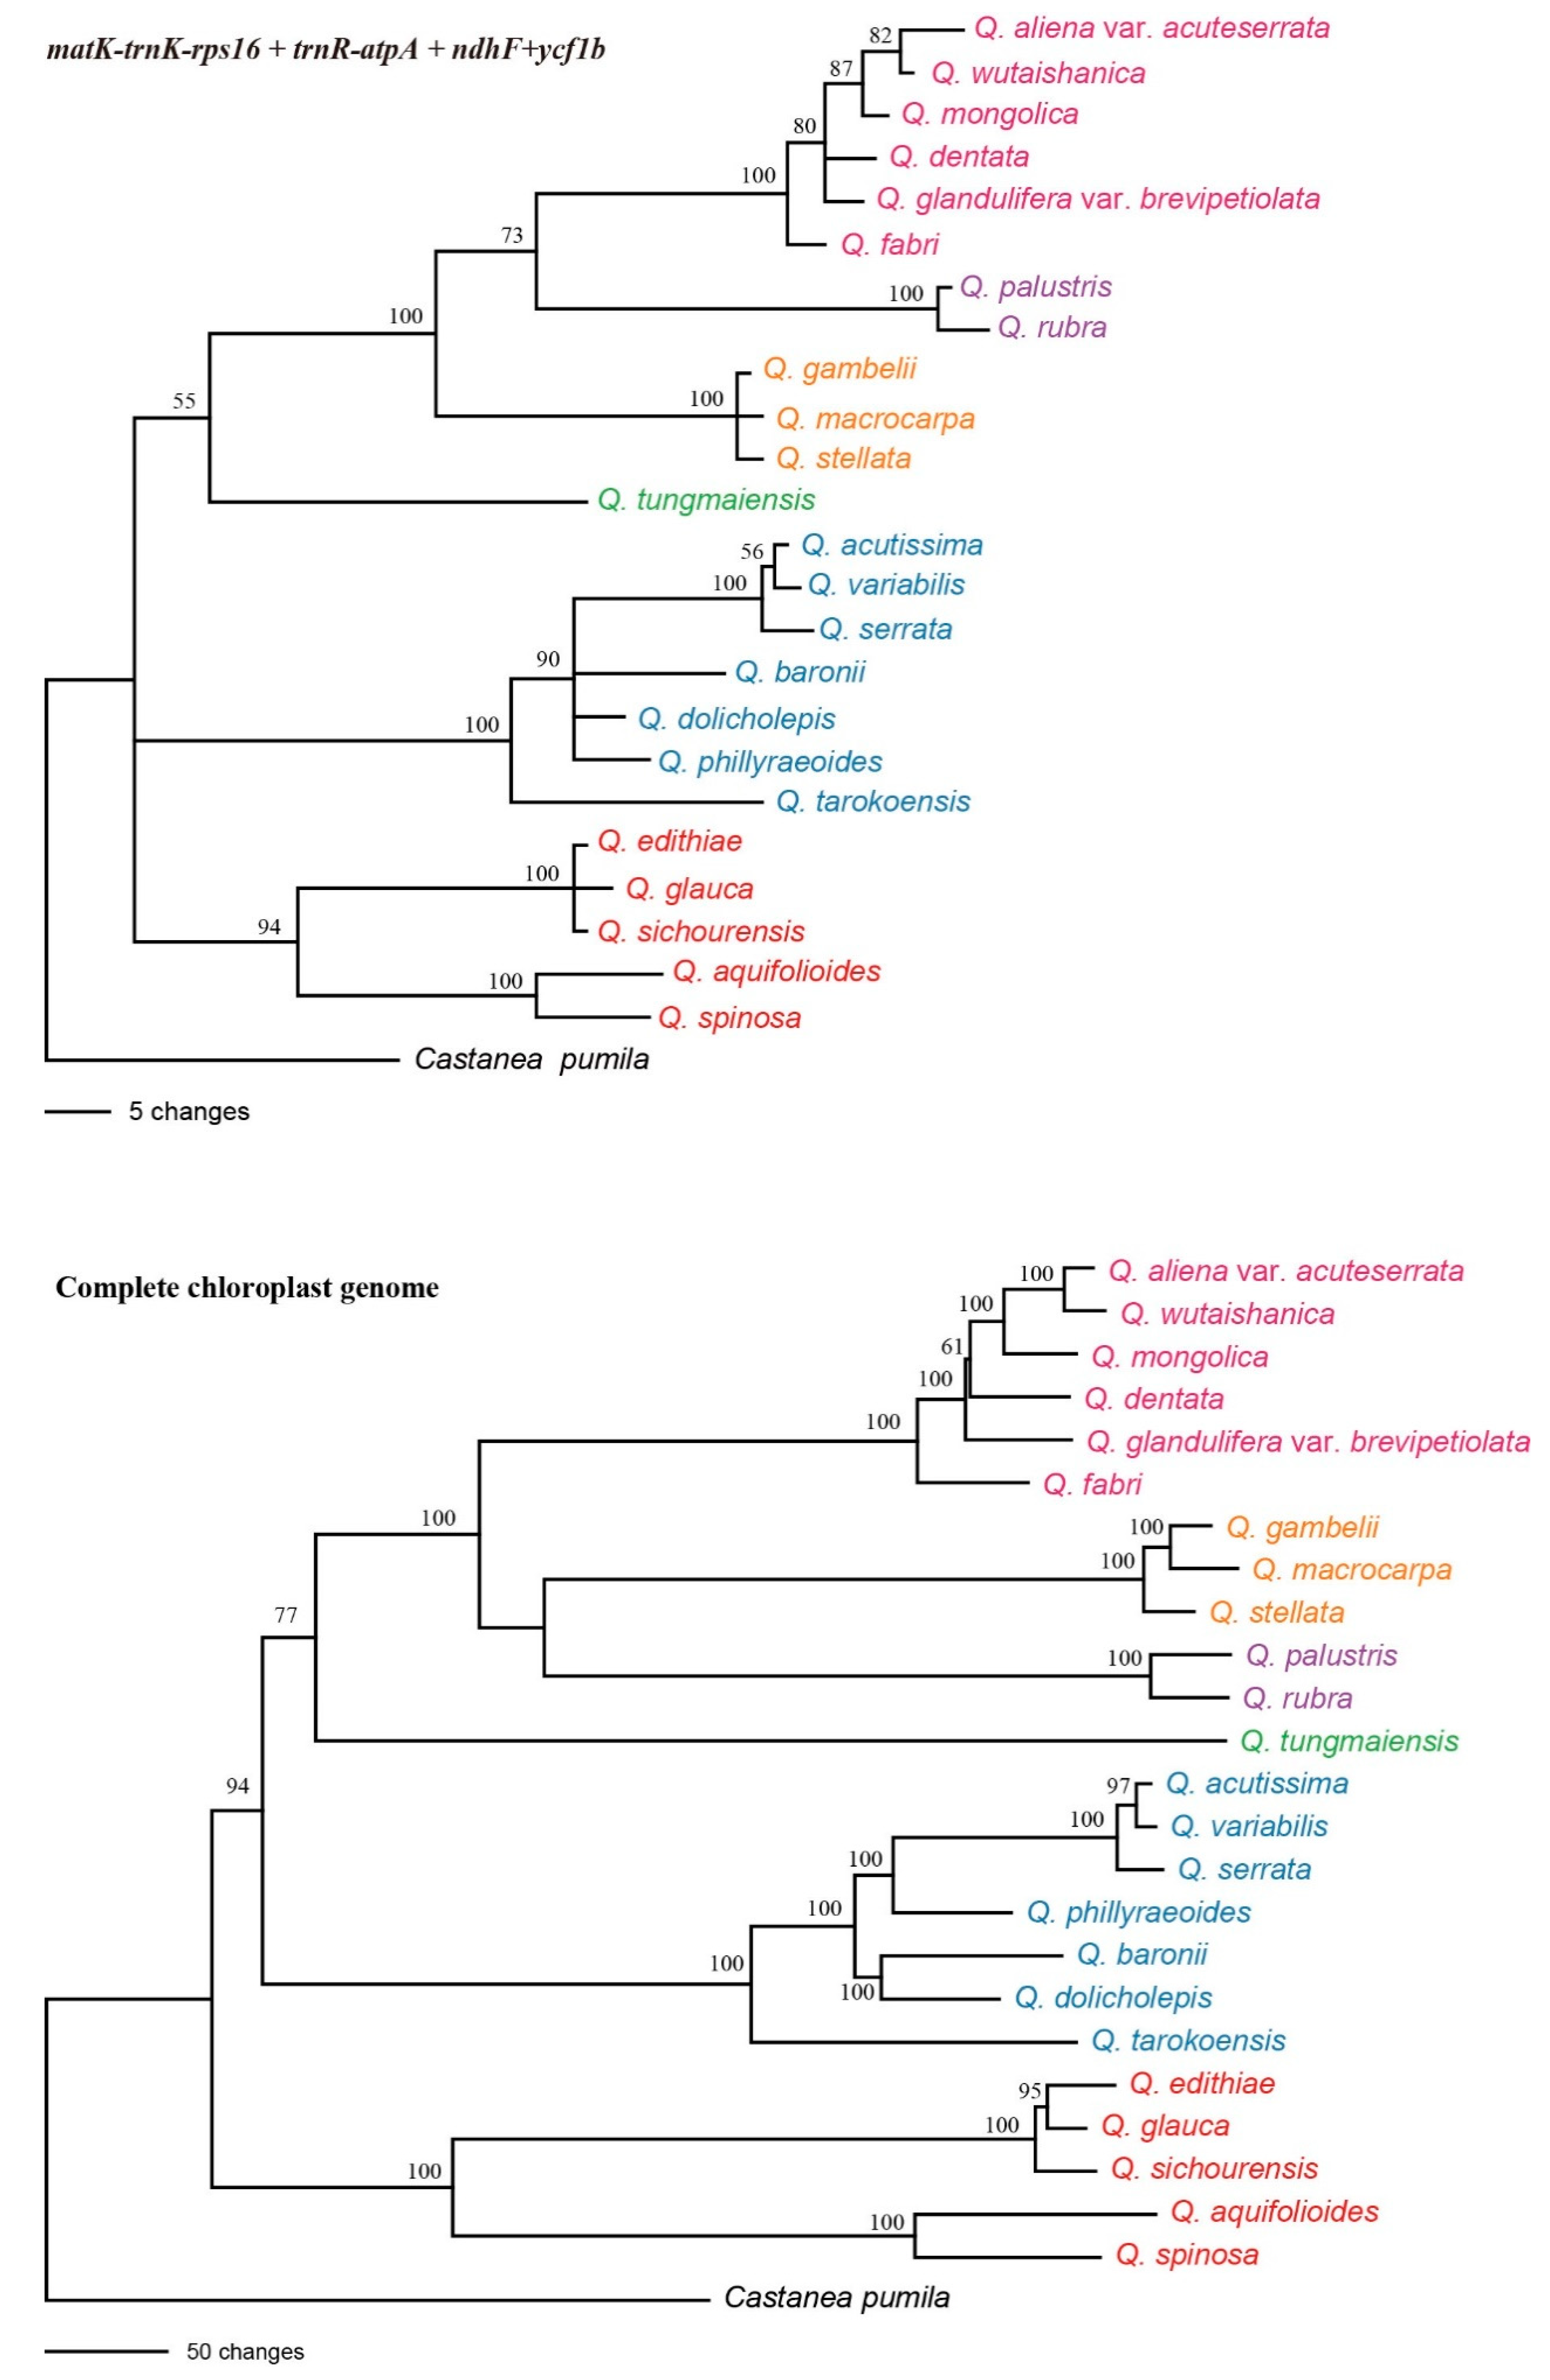
2.4. Analyses of Specific Barcodes

To identify closely related species, it is imperative to identify rapidly evolving markers. We used DNAsp and SPIDER to discover the variable mutation regions of the Quercus chloroplast genome (Figure 4). The nucleotide diversity (pi) value ranged from 0 to 0.01766 in the 800 bp window size, while the K2P-distance ranged from 0 to 0.0179. We found four relatively variable regions: matK-trnK-rps16, trnR-atpA, ndhF, and ycf1b. Two intergenic regions (matK-trnK-rps16 and trnR-atpA) were located in the LSC region, and two coding regions (ndhF and ycf1b) in the SSC region. We designed new primers for four variable regions (Table S3).
The ycf1b marker possessed the highest variability (5.33%), followed by the ndhF (4.82%), trnR-atpA (4.35%), and matK-trnK-rps16 (4.02%) regions. Of the four variable makers, ndhF had the highest rate of correct identifications (83.33%), followed by matK-trnK-rps16 (79.17%) and ycf1b (70.83%). Combining the four variable markers produced the most correct identifications (100%). The NJ tree-based method generated a graphical representation of the results and they were the same as those of the distance-based method (Figure 5).

2.5. Super-Barcode

The 24 Quercus chloroplast genomes were fully aligned, and an alignment matrix of 164,156 bp was obtained (Table 3). We identified 2778 variable sites (1.69%), including 1727 parsimony-informative sites (1.05%), in the total chloroplast genome. The average Pi value for the 24 Quercus chloroplast genomes was 0.00335. Among these regions, IR exhibited the least nucleotide diversity (0.00073) and SSC exhibited high divergence (0.00624).
To estimate the genetic divergence among Quercus chloroplast genomes, nucleotide substitutions and p-distance were calculated using MEGA. The overall sequence divergence estimated by p-distance among the 24 chloroplast genome sequences was only 0.0036. The number of nucleotide substitutions among the 24 species ranged from 14 to 734, and the p-distance ranged from 0.0001 to 0.0046. Q. tungmaiensis and Q. serrata had the largest sequence divergence. Q. variabilis had only 14 nucleotide substitutions with Q. acutissima.
The discriminatory power of the complete chloroplast genome as a DNA barcode was assessed using distance and tree-based methods. Compared to the standard DNA barcode or the four newly identified markers (specific barcodes), the complete chloroplast genome had the highest discriminatory power (Table 2 and Figure 5).

3. Discussion

Species delimitation remains one of the most controversial topics in biology. However, the accurate discrimination of material using only morphological characteristics is difficult. DNA barcoding is a widely used and effective tool that has enabled rapid and accurate identification of plant species since its development in 2003 [1]. Though DNA barcoding technology has developed significantly, no barcode can achieve the goal of sophisticated plant species identification [2]. In plants, the determination of a standardized barcode has been more complex. At present, increasing amounts of practical research tend to use chloroplast markers, such as atpB-rbcL, atpF-H, matK, rbcL, psbK-I, rpoB, rpoC1, trnH-psbA, and trnL-F, to identify species because of their relatively low evolutionary rates compared to those of nuclear loci and universal PCR primers [22,23,24,25]. The CBOL Working Group recently recommended a two-locus combination of matK + rbcL as the core plant barcode, with the recommendation to complement these using trnH-psbA and the ITS of the nuclear ribosomal DNA. However, because of the lower variability in standard DNA barcodes, discrimination power was low in plants [26]. In this study, the combination of rbcL, matK, and trnH-psbA had poor resolution (less than 50%) within Quercus (Table 2). Using the universal DNA barcode, the 12 Italian oak species revealed extremely low discrimination success (0%) [4]. Combined five chloroplast genome markers (psbA-trnH, matK-trnK, ycf3-trnS, matK, and ycf1), the species identification powers were only less than 20% [13]. Thus, there is an ongoing drive to develop additional oak barcodes.
With sequencing method development, greater numbers of DNA sequences were easily acquired. Identification of specific barcodes was an effective strategy for barcoding complex groups. Most studies showed that chloroplast genome mutations were clustered into hotspots, and those hotspots were defined as DNA barcodes [27,28,29,30]. The strategy of searching the complete chloroplast genome has been successfully applied to Oryza [30], Panax [28], Diospyros [31], and Dioscorea [32]. By comparing 24 Quercus chloroplast genomes in the present study, we identified four oak-specific barcodes including matK-trnK-rps16, trnR-atpA, ndhF, and ycf1b (Figure 4). The ycf1 gene was more variable than the matK and rbcL genes in most plant lineages, and recently has been the focus of a DNA barcoding and plant phylogeny study [14]. Furthermore, ycf1 has previously provided a higher species resolution in Quercus [13,14]. The ndhF gene has been widely used in plant phylogeny and is considered a variable coding gene in the chloroplast genome [27,33,34,35]. MatK-trnK-rps16 and trnR-atpA are two interspace regions less commonly used as DNA barcode. Combined with the four highly variable markers, all 24 Quercus species were successfully identified using the distance method (Table 2).
Although the four specific barcodes had the highest discriminatory power, it was necessary to develop additional markers for Quercus because of its complex evolutionary history. With the advent of the next-generation DNA sequencing technologies, genomic data have extended the concept of DNA barcoding for species identification [6,8,36,37,38]. The DNA barcode has extended from gene or genes to the entire genome, and the extended DNA barcoding approach has been referred to as “ultra-barcoding” [39], “super-barcoding” [7], or “plant barcoding 2.0” [40]. Compared to the nuclear and mitochondrial genomes, the chloroplast genome is easily sequenced and may be the best-suited genome for plant species super-barcoding [36,41].

4. Materials and Methods

4.1. Taxon Sampling

The collection and GenBank accession information for taxa sampled in the present study are listed in Table 1 and Table S1. Ten species with previously sequenced chloroplast genomes used for analysis in this study are listed in Table S2. Castanea pumila, the sister group of Quercus, was used as the out-group.

4.2. DNA Extraction and Sequencing

We used an Illumina HiSeq X Ten platform to produce chloroplast genome sequences. Quercus species total DNA was extracted from silica-dried leaflets using the mCTAB protocol [42]. After extraction, total DNA was quantified with a Nanodrop 1000 Spectrophotometer. Fragmented samples of 350 bp were used to prepare paired-end libraries using a NEBNext® Ultra™DNA Library Prep Kit following the manufacturer’s protocol. Each library that passed the first quality control step was tested with an Agilent 2100 Bio-147 analyzer (Agilent Technologies, Santa Clara, CA, USA) to ensure the libraries had the required size distributions. Real-time quantitative PCR was carried out to precisely measure library concentrations to balance the amounts used in multiplexed reactions. Paired-end sequencing (2 × 150 bp) was conducted on an Illumina HiSeq X Ten platform. For each species, approximately 5 Gb of raw data were generated.

4.3. Genome Assembly and Genome Annotation

A five-step approach was used to assemble the chloroplast genome. First, raw sequence reads were filtered for high quality reads by removing duplicate reads, as well as adapter-contaminated reads and reads with more than five Ns using the NGS QC Tool Kit [43]. Second, the SPAdes 3.6.1 program [44] was used for de novo assemblies. Third, chloroplast genome sequence contigs were selected from the SPAdes software by performing a BLAST search using the Quercus variabilis chloroplast genome sequence as a reference. Fourth, the Sequencher 5.4.5 program (Gene Codes Corp., Ann Arbor, Michigan, USA) was used to merge the selected contigs. Finally, small gaps or ambiguous nucleotides were bridged with specific primers designed for PCR based on their flanking sequences by Sanger sequencing. The four junctional regions between the IRs and small single copy (SSC) and large single copy (LSC) regions in the chloroplast genome sequences were further checked by PCR amplification and Sanger sequencing with specific primers as previously described [45].
Chloroplast genome annotation was performed with Plann [46] using the Quercus variabilis reference sequence. The chloroplast genome map was drawn using OGdraw online [47].

4.4. Phylogenetic Analyses

Multiple sequence alignment was performed using MAFFT v7 [48]. We estimated phylogenetic trees on the nucleotide substitution matrix using maximum likelihood (ML) and Bayesian inference (BI). ML analyses were performed using RAxML v.8.1.24 [49].
The RAxML analyses included 1000 bootstrap replicates in addition to a search for the best-scoring ML tree. BI was conducted with Mrbayes v3.2 [50]. The Metropolis-coupled Markov chain Monte Carlo (MCMC) algorithm was run for 50,000,000 generations with one cold and three heated chains, starting with a random tree and sampling one tree every 2000 generations. The first 25% of the trees were discarded as burn-in, and the remaining trees were used to build a 50% majority-rule consensus tree. Stationarity was considered reached when the average standard deviation of split frequencies remained below 0.01.

4.5. Sequence Divergence and Hotspot Identification

We analyzed the aligned sequences and counted the sequence divergence among Quercus chloroplast genomes to evaluate Quercus species divergence. Variable, parsimony-informative base sites, p-distances across the complete chloroplast genomes, and LSC, SSC, and inverted repeat (IR) regions of the 14 taxa were calculated using MEGA 6.0 software [51].
We used two methods to identify the hypervariable chloroplast genome regions. The first (nucleotide variability) was conducted using DnaSP version 5.1 software with the sliding window method. The second (genetic distance) was conducted using the slideAnalyses function of SPIDER [52] version 1.2-0 software. This function extracts all passable windows of a chosen size in a DNA alignment and performs pairwise distance (K2P) analyses of each window. The proportion of zero pairwise distances for each species and mean distance were considered for the definition of hypervariable regions. The step size was set to 100 bp with an 800 bp window length.

4.6. DNA Barcoding Analysis

To access the effectiveness of marker discriminatory performance, we used two methods to assess the barcoding resolution. The distance method used the nearNeighbour function of SPIDER software [52]. The distance method was used to analyze the barcode performances of newly identified highly variable regions.
Tree building analyses provide a convenient and visualized method for evaluating discriminatory performance by calculating the proportion of monophyletic species. A neighbor joining (NJ) tree was constructed for each hypervariable marker and different marker combinations using PAUP* 4.0 software [53]. Relative support for the NJ tree branches was assessed via 200 bootstrap replicates.

5. Conclusions

In this study, we sequenced and compared the chloroplast genomes of 24 Quercus species. The structure, size, and gene content of the Quercus chloroplast genomes were found to be well conserved, and comparative analyses revealed low levels of sequence variability. Four higher variable regions were identified, which were suitable as DNA barcodes for Quercus species identification. We also evaluated the resolution of the complete chloroplast genome in phylogenetic reconstruction and species discrimination in Quercus. The complete chloroplast genome sequence data produced strongly supported and highly resolved phylogenies in this taxonomically complex group despite the extensive hybridization and introgression in Quercus. Compared to standard plant DNA barcodes and the specific barcodes, analyses of the complete chloroplast genome sequences improved species identification resolution.

Supplementary Materials

Supplementary materials can be found at https://www.mdpi.com/1422-0067/20/23/5940/s1. Table S1. Sampling and assembly information for the 14 Quercus species; Table S2. A list of the 10 taxa sampled from GenBank in this study. Table S3. Primers for amplifying four highly variable loci.

Author Contributions

B.L. and X.P. designed the experiment; B.L., X.P., H.L., S.W., Y.Y., H.L., J.D., Z.L., C.A., Z.S. and P.H. collected samples and performed the experiment; B.L. and X.P. analyzed the data and wrote the manuscript; All of the authors have read and approved the final manuscript.

Funding

The study was funded by by “national forest germplasm resources bank of Quercus mongolica and Quercus variabilis in Hongyashan of Hebei (2017, 2018, 2019)”.

Conflicts of Interest

The authors declare no conflict of interest.

Abbreviations

LSCLarge single copy
SSCSmall single copy
IRInverted repeat

References

  1. Hebert, P.D.N.; Cywinska, A.; Ball, S.L.; DeWaard, J.R. Biological identifications through DNA barcodes. Proc. R. Soc. Lond. B 2003, 270, 313–321. [Google Scholar] [CrossRef]
  2. Hollingsworth, P.M.; Graham, S.W.; Little, D.P. Choosing and using a plant DNA barcode. PLoS ONE 2011, 6, e19254. [Google Scholar] [CrossRef]
  3. Groups, C.P.B.; Li, D.Z.; Gao, L.M.; Li, H.T.; Wang, H.; Ge, X.J.; Liu, J.Q.; Chen, Z.D.; Zhou, S.L.; Chen, S.L.; et al. Comparative analysis of a large dataset indicates that internal transcribed spacer (ITS) should be incorporated into the core barcode for seed plants. Proc. Nat. Acad. Sci. USA 2011. [Google Scholar] [CrossRef]
  4. Simeone, M.C.; Piredda, R.; Attimonelli, M.; Bellarosa, R.; Schirone, B. Prospects of barcoding the Italian wild dendroflora: Oaks reveal severe limitations to tracking species identity. Mol. Ecol. Resour. 2011, 11, 72–83. [Google Scholar] [CrossRef]
  5. von Crautlein, M.; Korpelainen, H.; Pietilainen, M.; Rikkinen, J. DNA barcoding: A tool for improved taxon identification and detection of species diversity. Biodivers. Conserv. 2011, 20, 373–389. [Google Scholar] [CrossRef]
  6. Coissac, E.; Hollingsworth, P.M.; Lavergne, S.; Taberlet, P. From barcodes to genomes: Extending the concept of DNA barcoding. Mol. Ecol. 2016. [Google Scholar] [CrossRef]
  7. Li, X.; Yang, Y.; Henry, R.J.; Rossetto, M.; Wang, Y.; Chen, S. Plant DNA barcoding: From gene to genome. Biol. Rev. 2015, 90, 157–166. [Google Scholar] [CrossRef]
  8. Ruhsam, M.; Rai, H.S.; Mathews, S.; Ross, T.G.; Graham, S.W.; Raubeson, L.A.; Mei, W.; Thomas, P.I.; Gardner, M.F.; Ennos, R.A.; et al. Does complete plastid genome sequencing improve species discrimination and phylogenetic resolution in Araucaria? Mol. Ecol. Resour. 2015. [Google Scholar] [CrossRef]
  9. Fabiana, F.; Rizzo, Z.A.; Weismann, G.J.; Souza, O.R.; Lohmann, L.G.; Marie-Anne, V.S. Complete chloroplast genome sequences contribute to plant species delimitation: A case study of the Anemopaegma species complex. Am. J. Bot. 2017, 104, 1493–1509. [Google Scholar] [CrossRef]
  10. Wu, C.S.; Chaw, S.M.; Huang, Y.Y. Chloroplast phylogenomics indicates that Ginkgo biloba is sister to cycads. Genome Biol. Evol. 2013, 5, 243–254. [Google Scholar] [CrossRef]
  11. Cox, C.J.; Li, B.; Foster, P.G.; Embley, T.M.; Civan, P. Conflicting phylogenies for early land plants are caused by composition biases among synonymous substitutions. Syst. Biol. 2014, 63, 272–279. [Google Scholar] [CrossRef]
  12. Carbonell-Caballero, J.; Alonso, R.; Ibañez, V.; Terol, J.; Talon, M.; Dopazo, J. A phylogenetic analysis of 34 chloroplast genomes elucidates the relationships between wild and domestic species within the genus Citrus. Mol. Biol. Evol. 2015, 32, 2015–2035. [Google Scholar] [CrossRef]
  13. Yang, J.; Vazquez, L.; Chen, X.; Li, H.; Zhang, H.; Liu, Z.; Zhao, G. Development of Chloroplast and Nuclear DNA Markers for Chinese Oaks (Quercus Subgenus Quercus) and Assessment of Their Utility as DNA Barcodes. Front. Plant Sci. 2017, 8, 816. [Google Scholar] [CrossRef]
  14. Dong, W.; Xu, C.; Li, C.; Sun, J.; Zuo, Y.; Shi, S.; Cheng, T.; Guo, J.; Zhou, S. ycf1, the most promising plastid DNA barcode of land plants. Sci. Rep. 2015, 5, 8348. [Google Scholar] [CrossRef]
  15. Mayol, M.; Rossello, J.A. Why nuclear ribosomal DNA spacers (ITS) tell different stories in Quercus. Mol. Phylogenet. Evol. 2001, 19, 167–176. [Google Scholar] [CrossRef]
  16. Bellarosa, R.; Simeone, M.C.; Papini, A.; Schirone, B. Utility of ITS sequence data for phylogenetic reconstruction of Italian Quercus spp. Mol. Phylogenet. Evol. 2005, 34, 355–370. [Google Scholar] [CrossRef]
  17. Simeone, M.C.; Piredda, R.; Papini, A.; Vessella, F.; Schirone, B. Application of plastid and nuclear markers to DNA barcoding of Euro-Mediterranean oaks (Quercus, Fagaceae): Problems, prospects and phylogenetic implications. Bot. J. Linn. Soc. 2013, 172, 478–499. [Google Scholar] [CrossRef]
  18. Fineschi, S.; Taurchini, D.; Grossoni, P.; Petit, R.J.; Vendramin, G.G. Chloroplast DNA variation of white oaks in Italy. For. Ecol. Manage. 2002, 156, 103–114. [Google Scholar] [CrossRef]
  19. Lumaret, R.; Jabbour-Zahab, R. Ancient and current gene flow between two distantly related Mediterranean oak species, Quercus suber and Q. ilex. Ann. Bot. 2009, 104, 725–736. [Google Scholar] [CrossRef]
  20. McVay, J.D.; Hipp, A.L.; Manos, P.S. A genetic legacy of introgression confounds phylogeny and biogeography in oaks. Proc. Biol. Sci. 2017, 284. [Google Scholar] [CrossRef]
  21. Eaton, D.A.R.; Hipp, A.L.; González-Rodríguez, A.; Cavender-Bares, J. Historical introgression among the American live oaks and the comparative nature of tests for introgression. Evolution 2015, 69, 2587–2601. [Google Scholar] [CrossRef]
  22. de Groot, G.A.; During, H.J.; Maas, J.W.; Schneider, H.; Vogel, J.C.; Erkens, R.H. Use of rbcL and trnL-F as a two-locus DNA barcode for identification of NW-European ferns: An ecological perspective. PLoS ONE 2011, 6, e16371. [Google Scholar] [CrossRef]
  23. Pang, X.; Liu, C.; Shi, L.; Liu, R.; Liang, D.; Li, H.; Cherny, S.S.; Chen, S. Utility of the trnH-psbA intergenic spacer region and its combinations as plant DNA barcodes: A meta-analysis. PLoS ONE 2012, 7, e48833. [Google Scholar] [CrossRef]
  24. Saarela, J.M.; Sokoloff, P.C.; Gillespie, L.J.; Consaul, L.L.; Bull, R.D. DNA barcoding the Canadian Arctic flora: Core plastid barcodes (rbcL + matK) for 490 vascular plant species. PLoS ONE 2013, 8, e77982. [Google Scholar] [CrossRef]
  25. Krawczyk, K.; Szczecińska, M.; Sawicki, J. Evaluation of 11 single-locus and seven multilocus DNA barcodes in Lamium L. (Lamiaceae). Mol. Ecol. Resour. 2014, 14, 272–285. [Google Scholar] [CrossRef]
  26. Group, C.P.W. A DNA barcode for land plants. Proc. Nat. Acad. Sci. USA 2009, 106, 12794–12797. [Google Scholar] [CrossRef]
  27. Dong, W.; Liu, J.; Yu, J.; Wang, L.; Zhou, S. Highly variable chloroplast markers for evaluating plant phylogeny at low taxonomic levels and for DNA barcoding. PLoS ONE 2012, 7, e35071. [Google Scholar] [CrossRef]
  28. Dong, W.; Liu, H.; Xu, C.; Zuo, Y.; Chen, Z.; Zhou, S. A chloroplast genomic strategy for designing taxon specific DNA mini-barcodes: A case study on ginsengs. BMC Genet. 2014, 15, 138. [Google Scholar] [CrossRef]
  29. Xu, C.; Dong, W.; Li, W.; Lu, Y.; Xie, X.; Jin, X.; Shi, J.; He, K.; Suo, Z. Comparative Analysis of Six Lagerstroemia Complete Chloroplast Genomes. Front. Plant Sci. 2017, 8, 15. [Google Scholar] [CrossRef]
  30. Song, Y.; Wang, S.; Ding, Y.; Xu, J.; Li, M.F.; Zhu, S.; Chen, N. Chloroplast Genomic Resource of Paris for Species Discrimination. Sci. Rep. 2017, 7, 3427. [Google Scholar] [CrossRef]
  31. Li, W.; Liu, Y.; Yang, Y.; Xie, X.; Lu, Y.; Yang, Z.; Jin, X.; Dong, W.; Suo, Z. Interspecific chloroplast genome sequence diversity and genomic resources in Diospyros. BMC Plant Biol. 2018, 18, 210. [Google Scholar] [CrossRef]
  32. Zhao, Z.; Wang, X.; Yu, Y.; Yuan, S.; Jiang, D.; Zhang, Y.; Zhang, T.; Zhong, W.; Yuan, Q.; Huang, L. Complete chloroplast genome sequences of Dioscorea: Characterization, genomic resources, and phylogenetic analyses. PeerJ 2018, 6, e6032. [Google Scholar] [CrossRef] [PubMed]
  33. Kim, K.J.; Jansen, R.K. NdhF sequence evolution and the major clades in the sunflower Family. Proc. Nat. Acad. Sci. USA 1995, 92, 10379–10383. [Google Scholar] [CrossRef] [PubMed] [Green Version]
  34. Li, J.H. Phylogeny of Catalpa (Bignoniaceae) inferred from sequences of chloroplast ndhF and nuclear ribosomal DNA. J. Syst. Evol. 2008, 46, 341–348. [Google Scholar] [CrossRef]
  35. Park, S.J.; Korompai, E.J.; Francisco-Ortega, J.; Santos-Guerra, A.; Jansen, R.K. Phylogenetic relationships of Tolpis (Asteraceae: Lactuceae) based on ndhF sequence data. Plant Syst. Evol. 2001, 226, 23–33. [Google Scholar] [CrossRef]
  36. Ji, Y.; Liu, C.; Yang, Z.; Yang, L.; He, Z.; Wang, H.; Yang, J.; Yi, T. Testing and using complete plastomes and ribosomal DNA sequences as the next generation DNA barcodes in Panax (Araliaceae). Mol. Ecol. Resour. 2019, 19, 1333–1345. [Google Scholar] [CrossRef] [PubMed]
  37. Kim, Y.; Choi, H.; Shin, J.; Jo, A.; Lee, K.-E.; Cho, S.-S.; Hwang, Y.-P.; Choi, C. Molecular Discrimination of Cynanchum wilfordii and Cynanchum auriculatum by InDel Markers of Chloroplast DNA. Molecules 2018, 23, 1337. [Google Scholar] [CrossRef] [Green Version]
  38. Wang, A.; Wu, H.; Zhu, X.; Lin, J. Species Identification of Conyza bonariensis Assisted by Chloroplast Genome Sequencing. Front. Genet. 2018, 9. [Google Scholar] [CrossRef] [Green Version]
  39. Kane, N.; Sveinsson, S.; Dempewolf, H.; Yang, J.Y.; Zhang, D.; Engels, J.M.; Cronk, Q. Ultra-barcoding in cacao (Theobroma spp.; Malvaceae) using whole chloroplast genomes and nuclear ribosomal DNA. Am. J. Bot. 2012. [Google Scholar] [CrossRef] [Green Version]
  40. Hollingsworth, P.M.; Li, D.Z.; van der Bank, M.; Twyford, A.D. Telling plant species apart with DNA: From barcodes to genomes. Philos. Trans. R. Soc. Lond. B. Biol. Sci. 2016, 371. [Google Scholar] [CrossRef]
  41. Fu, C.N.; Wu, C.S.; Ye, L.J.; Mo, Z.Q.; Liu, J.; Chang, Y.W.; Li, D.Z.; Chaw, S.M.; Gao, L.M. Prevalence of isomeric plastomes and effectiveness of plastome super-barcodes in yews (Taxus) worldwide. Sci. Rep. 2019, 9, 2773. [Google Scholar] [CrossRef] [PubMed]
  42. Li, J.; Wang, S.; Jing, Y.; Wang, L.; Zhou, S. A modified CTAB protocol for plant DNA extraction. Chin. Bull. Bot. 2013, 48, 72–78. [Google Scholar]
  43. Patel, R.K.; Jain, M. NGS QC Toolkit: A toolkit for quality control of next generation sequencing data. PLoS ONE 2012, 7, e30619. [Google Scholar] [CrossRef] [PubMed]
  44. Bankevich, A.; Nurk, S.; Antipov, D.; Gurevich, A.A.; Dvorkin, M.; Kulikov, A.S.; Lesin, V.M.; Nikolenko, S.I.; Pham, S.; Prjibelski, A.D.; et al. SPAdes: A new genome assembly algorithm and its applications to single-cell sequencing. J. Comput. Biol. 2012, 19, 455–477. [Google Scholar] [CrossRef] [Green Version]
  45. Dong, W.; Xu, C.; Cheng, T.; Lin, K.; Zhou, S. Sequencing angiosperm plastid genomes made easy: A complete set of universal primers and a case study on the phylogeny of Saxifragales. Genome Biol. Evol. 2013, 5, 989–997. [Google Scholar] [CrossRef] [Green Version]
  46. Huang, D.I.; Cronk, Q.C.B. Plann: A command-line application for annotating plastome sequences. Appl. Plant Sci. 2015, 3, 1500026. [Google Scholar] [CrossRef] [Green Version]
  47. Greiner, S.; Lehwark, P.; Bock, R. OrganellarGenomeDRAW (OGDRAW) version 1.3.1: Expanded toolkit for the graphical visualization of organellar genomes. Nucleic Acids Res. 2019, 47, W59–W64. [Google Scholar] [CrossRef] [Green Version]
  48. Katoh, K.; Standley, D.M. MAFFT multiple sequence alignment software version 7: Improvements in performance and usability. Mol. Biol. Evol. 2013, 30, 772–780. [Google Scholar] [CrossRef] [Green Version]
  49. Stamatakis, A. RAxML version 8: A tool for phylogenetic analysis and post-analysis of large phylogenies. Bioinformatics 2014, 30, 1312–1313. [Google Scholar] [CrossRef]
  50. Ronquist, F.; Teslenko, M.; van der Mark, P.; Ayres, D.L.; Darling, A.; Hohna, S.; Larget, B.; Liu, L.; Suchard, M.A.; Huelsenbeck, J.P. MrBayes 3.2: Efficient Bayesian phylogenetic inference and model choice across a large model space. Syst. Biol. 2012, 61, 539–542. [Google Scholar] [CrossRef] [Green Version]
  51. Tamura, K.; Stecher, G.; Peterson, D.; Filipski, A.; Kumar, S. MEGA6: Molecular Evolutionary Genetics Analysis version 6.0. Mol. Biol. Evol. 2013, 30, 2725–2729. [Google Scholar] [CrossRef] [PubMed] [Green Version]
  52. Brown, S.D.; Collins, R.A.; Boyer, S.; Lefort, M.C.; Malumbres-Olarte, J.; Vink, C.J.; Cruickshank, R.H. Spider: An R package for the analysis of species identity and evolution, with particular reference to DNA barcoding. Mol. Ecol. Resour. 2012, 12, 562–565. [Google Scholar] [CrossRef] [PubMed]
  53. Swofford, D. PAUP*. Phylogenetic Analysis Using Parsimony (*and Other Methods); Version 4.0 Beta; Sinauer Associates: Sunderland, MA, USA, 2002. [Google Scholar]
Figure 1. Gene map of Quercus chloroplast genome. Genes drawn within the circle are transcribed clockwise; genes drawn outside are transcribed counterclockwise. Genes in different functional groups are shown in different colors. Dark bold lines indicate the extent of the inverted repeats (IRa and IRb) that separate the genomes into small single-copy (SSC) and large single-copy (LSC) regions.
Ijms 20 05940 g001
Figure 2. Phylogenetic tree inferred from the 25 chloroplast genomes. Left: Maximum likelihood tree with maximum likelihood (ML) bootstrap values; right: Bayesian tree with posterior probabilities.
Ijms 20 05940 g002
Figure 3. Neighbor joining trees for Quercus using rbcL + matK, rbcL + matK, and trnH-psbA combinations.
Ijms 20 05940 g003
Figure 4. Specific DNA barcode development. (A) Mean distance of each window; (B) proportion of zero pairwise distances for each species; (C) nucleotide diversity (pi) of each window. Window length: 800 bp; Step size: 100 bp; X-axis: position of the midpoint of a window.
Ijms 20 05940 g004
Figure 5. Neighbor joining tree for Quercus using the four highly variable markers and complete chloroplast genome data.
Ijms 20 05940 g005
Table 1. Summary statistics for the assembly of 14 Quercus species chloroplast genomes.
SpeciesLSCIRSSCTotal Size (bp)Number of GenesProtein Coding GenestRNArRNAAccession Number in Genbank
Q. macrocarpa90594258481894616123611379304MK105459
Q. gambelii90570258481894716121311379304MK105457
Q. stellata90562258481895616121411379304MK105467
Q. palustris90624258521895616128411379304MK105461
Q. aliena var. acuteserrata90532258371898816119411379304MK105452
Q. phillyraeoides90363258661903716113211379304MK105462
Q. glandulifera var. brevipetiolata90534258261903816122411379304MK105458
Q. wutaishanica90520258251904116121111379304MK105466
Q. mongolica90504258201904716119111379304MK105460
Q. dentata90593258261905516130011379304MK105453
Q. fabri90557258321906416128511379304MK105456
Q. serrata90447258171906516114611379304MK105464
Q. variabilis90464258171907016116811379304MK105451
Q. rubra90553258701907316136611379304MK105463
Table 2. The variability of the four new markers, chloroplast genome, and the universal chloroplast DNA barcodes in Quercus.
MarkersLengthVariable SitesInformation SitesDiscrimination Success (%) Based on Distance Method
Numbers%Numbers%
rbcL69881.15%50.72%12.50%
matK744212.82%111.48%25.00%
trnH-psbA574274.70%162.79%37.50%
rbcL + matK1442292.01%161.11%29.17%
rbcL + matK + trnH-psbA2016562.78%321.59%50.00%
matK-trnK-rps162311934.02%592.55%79.17%
trnR-atpA1309574.35%352.67%66.67%
ndhF1536744.82%452.93%83.33%
ycf1b1765945.33%593.34%70.83%
ndhF+ycf1b33011685.09%1043.15%91.67%
matK-trnK-rps16 + trnR-atpA + ndhF + ycf1b69213184.59%1982.86%100.00%
Table 3. Variable site analyses in Quercus chloroplast genomes.
Number of SitesVariable SitesInformation SitesNucleotide Diversity
Numbers%Numbers%
LSC92,88820092.16%12571.35%0.0043
SSC19,5355933.04%3681.88%0.00624
IR25,879910.35%540.21%0.00073
Complete chloroplast genome164,15627781.69%17271.05%0.00335

