Article

GnRH Antagonists Produce Differential Modulation of the Signaling Pathways Mediated by GnRH Receptors

1
Unit of Endocrinology, Department of Biomedical, Metabolic and Neural Sciences, University of Modena and Reggio Emilia, Via P. Giardini 1355, 41126 Modena, Italy
2
Center for Genomic Research, University of Modena and Reggio Emilia, Via G. Campi 287, 41125 Modena, Italy
3
International PhD School in Clinical and Experimental Medicine (CEM), University of Modena and Reggio Emilia, Via G. Campi 287, 41125 Modena, Italy
4
Department of Biomedical, Metabolic Science and Neuroscience, University of Modena and Reggio Emilia, Via G. Campi 287, 41125 Modena, Italy
5
Department of Medicine and Surgery, Unit of Neurosciences, University of Parma, Via Volturno 39/E, 43125 Parma, Italy
6
Global Clinical Development, R and D Merck KGaA, Frankfurter Strasse 250, 64293 Darmstadt, Germany
7
Centre for Neuroendocrinology and Department of Immunology, Faculty of Health Sciences, University of Pretoria, Lynnwood Road and Roper Street, P.O. Box 2034, Pretoria 0001, South Africa
8
Unit of Endocrinology, Department of Medical Specialties, Azienda Ospedaliero-Universitaria, Via P. Giardini 1355, 41126 Modena, Italy
9
Physiologie de la Reproduction et des Comportements (PRC), Institut National de la Recherche Agronomique (INRA), Centre National de la Recherche Scientifique (CNRS), Institut Français du Cheval et de l’Equitation (IFCE), Université de Tours, 37380 Nouzilly, France
*
Author to whom correspondence should be addressed.
Int. J. Mol. Sci. 2019, 20(22), 5548; https://doi.org/10.3390/ijms20225548
Submission received: 25 September 2019 / Revised: 29 October 2019 / Accepted: 4 November 2019 / Published: 7 November 2019
(This article belongs to the Section Molecular Endocrinology and Metabolism)

Abstract

:
Commercial gonadotropin-releasing hormone (GnRH) antagonists differ by 1–2 amino acids and are used to inhibit gonadotropin production during assisted reproduction technologies (ART). In this study, potencies of three GnRH antagonists, Cetrorelix, Ganirelix and Teverelix, in inhibiting GnRH-mediated intracellular signaling, were compared in vitro. GnRH receptor (GnRHR)-transfected HEK293 and neuroblastoma-derived SH-SY5Y cell lines, as well as mouse pituitary LβT2 cells endogenously expressing the murine GnRHR, were treated with GnRH in the presence or absence of the antagonist. We evaluated intracellular calcium (Ca2+) and cAMP increases, cAMP-responsive element binding-protein (CREB) and extracellular-regulated kinase 1 and 2 (ERK1/2) phosphorylation, β-catenin activation and mouse luteinizing-hormone β-encoding gene (Lhb) transcription by bioluminescence resonance energy transfer (BRET), Western blotting, immunostaining and real-time PCR as appropriate. The kinetics of GnRH-induced Ca2+ rapid increase revealed dose-response accumulation with potency (EC50) of 23 nM in transfected HEK293 cells, transfected SH-SY5Y and LβT2 cells. Cetrorelix inhibited the 3 × EC50 GnRH-activated calcium signaling at concentrations of 1 nM–1 µM, demonstrating higher potency than Ganirelix and Teverelix, whose inhibitory doses fell within the 100 nM–1 µM range in both transfected HEK293 and SH-SY5Y cells in vitro. In transfected SH-SY5Y, Cetrorelix was also significantly more potent than other antagonists in reducing GnRH-mediated cAMP accumulation. All antagonists inhibited pERK1/2 and pCREB activation at similar doses, in LβT2 and transfected HEK293 cells treated with 100 nM GnRH. Although immunostainings suggested that Teverelix could be less effective than Cetrorelix and Ganirelix in inhibiting 1 µM GnRH-induced β-catenin activation, Lhb gene expression increase occurring upon LβT2 cell treatment by 1 µM GnRH was similarly inhibited by all antagonists. To conclude, this study has demonstrated Cetrorelix-, Ganirelix- and Teverelix-specific biased effects at the intracellular level, not affecting the efficacy of antagonists in inhibiting Lhb gene transcription.

1. Introduction

Gonadotropin releasing hormone (GnRH) is secreted by hypothalamic GnRH-expressing neurons and regulates mammalian reproductive functions. It is a decapeptide released in a pulsatile fashion into the hypophyseal portal blood system and acts on GnRH receptor (GnRHR)-expressing gonadotrope cells of the anterior pituitary, triggering the synthesis and secretion of the luteinizing (LH) and follicle-stimulating (FSH) hormones [1,2,3].
GnRHR is a G-protein coupled receptor (GPCR) [4,5], and its main effector in pituitary cells is the Gαq/11 protein, the activation of which results in phosphoinositide phospholipase Cβ (PLCβ) stimulation and subsequent production of inositol (1,4,5)-trisphosphate (IP3) and diacylglycerol (DAG) [6]. IP3 induces intracellular Ca2+ release by the endoplasmic reticulum, which is linked to gonadotropin secretion and activation of the calmodulin/calcineurin/NFAT- and calmodulin/ Ca2+ calmodulin-dependent protein kinase II (CaMKII)-pathway, as well as in further Ca2+ influx through L-type voltage gated calcium channels [2]. However, GnRHR modulates the simultaneous activation of multiple intracellular signaling cascades, depending on cell specific-contexts [7,8]. DAG mediates protein kinase C (PKC) activation and downstream phosphorylation of the extracellular signal-regulated kinase 1 and 2 (ERK1/2), jun-N-terminal kinase (JNK), and p38 mitogen-activated protein kinases (MAPKs) [2,9,10,11]. GnRHR coupling to other heterotrimeric G-protein subunits, such as the Gαs [12,13,14] and Gαi [15], has also been described [6,16]. Gαs protein activation by GnRHR-hormone binding results in adenylyl cyclase and (cAMP) increase, and cAMP response element-binding protein (CREB) phosphorylation via protein kinase A (PKA) activation. cAMP production may also be induced by alternative pathways involving the Gαq/11 protein and specific PKC isoforms [17], implementing the complexity of GnRHR signaling signature. All of these intracellular events precede the expression of LHB and FSHB target genes [13,18]. Finally, another target of GnRH-mediated signal transduction is β-catenin activation [19,20]. β-catenin acts as a dual-function protein, participating in both cell-adhesion, as a member of the adherens junction, and in the regulation of LHB and Wnt-target gene transcription [21,22,23] after translocation into the cell nucleus [19,24].
GnRH agonists and antagonists are useful to control gonadotropin production, in the context of assisted reproduction technologies (ART), as well as for the treatment of certain hormone-dependent diseases [25,26,27]. GnRH antagonists are typically decapeptides structurally similar to GnRH, differing from the native hormone by a few amino acids which results in reversible GnRHR binding without activation [5,28]. The GnRH antagonists Cetrorelix, Ganirelix and Teverelix, share highly similar structure (Figure 1), differing by only two amino acids at position 6 and 8 of the protein chain [5,26]. While the effects of these different GnRH antagonists have never been comprehensively compared in vitro, the use of Cetrorelix and Ganirelix to prevent premature ovulation is considered to lead to similar clinical outcomes [29,30], while Teverelix, although potentially useful for clinical purposes, has not yet been commercially marketed [31,32,33]. Although they share a high degree of similarity, the molecular differences between the antagonists lead to the hypothesis that antagonist-specific, biased effects on GnRHR-dependent pathways may occur upon receptor binding, resulting in ligand-induced selective signaling (LiSS) [34].
In cell lines expressing GnRHR, we compared Cetrorelix, Ganirelix and Teverelix in inhibiting a range of GnRH-induced intracellular signaling cascades, in vitro. This study improves the knowledge of the structure–function relationship of GnRH antagonists and provides results useful to develop drugs for personalized clinical applications.

2. Results

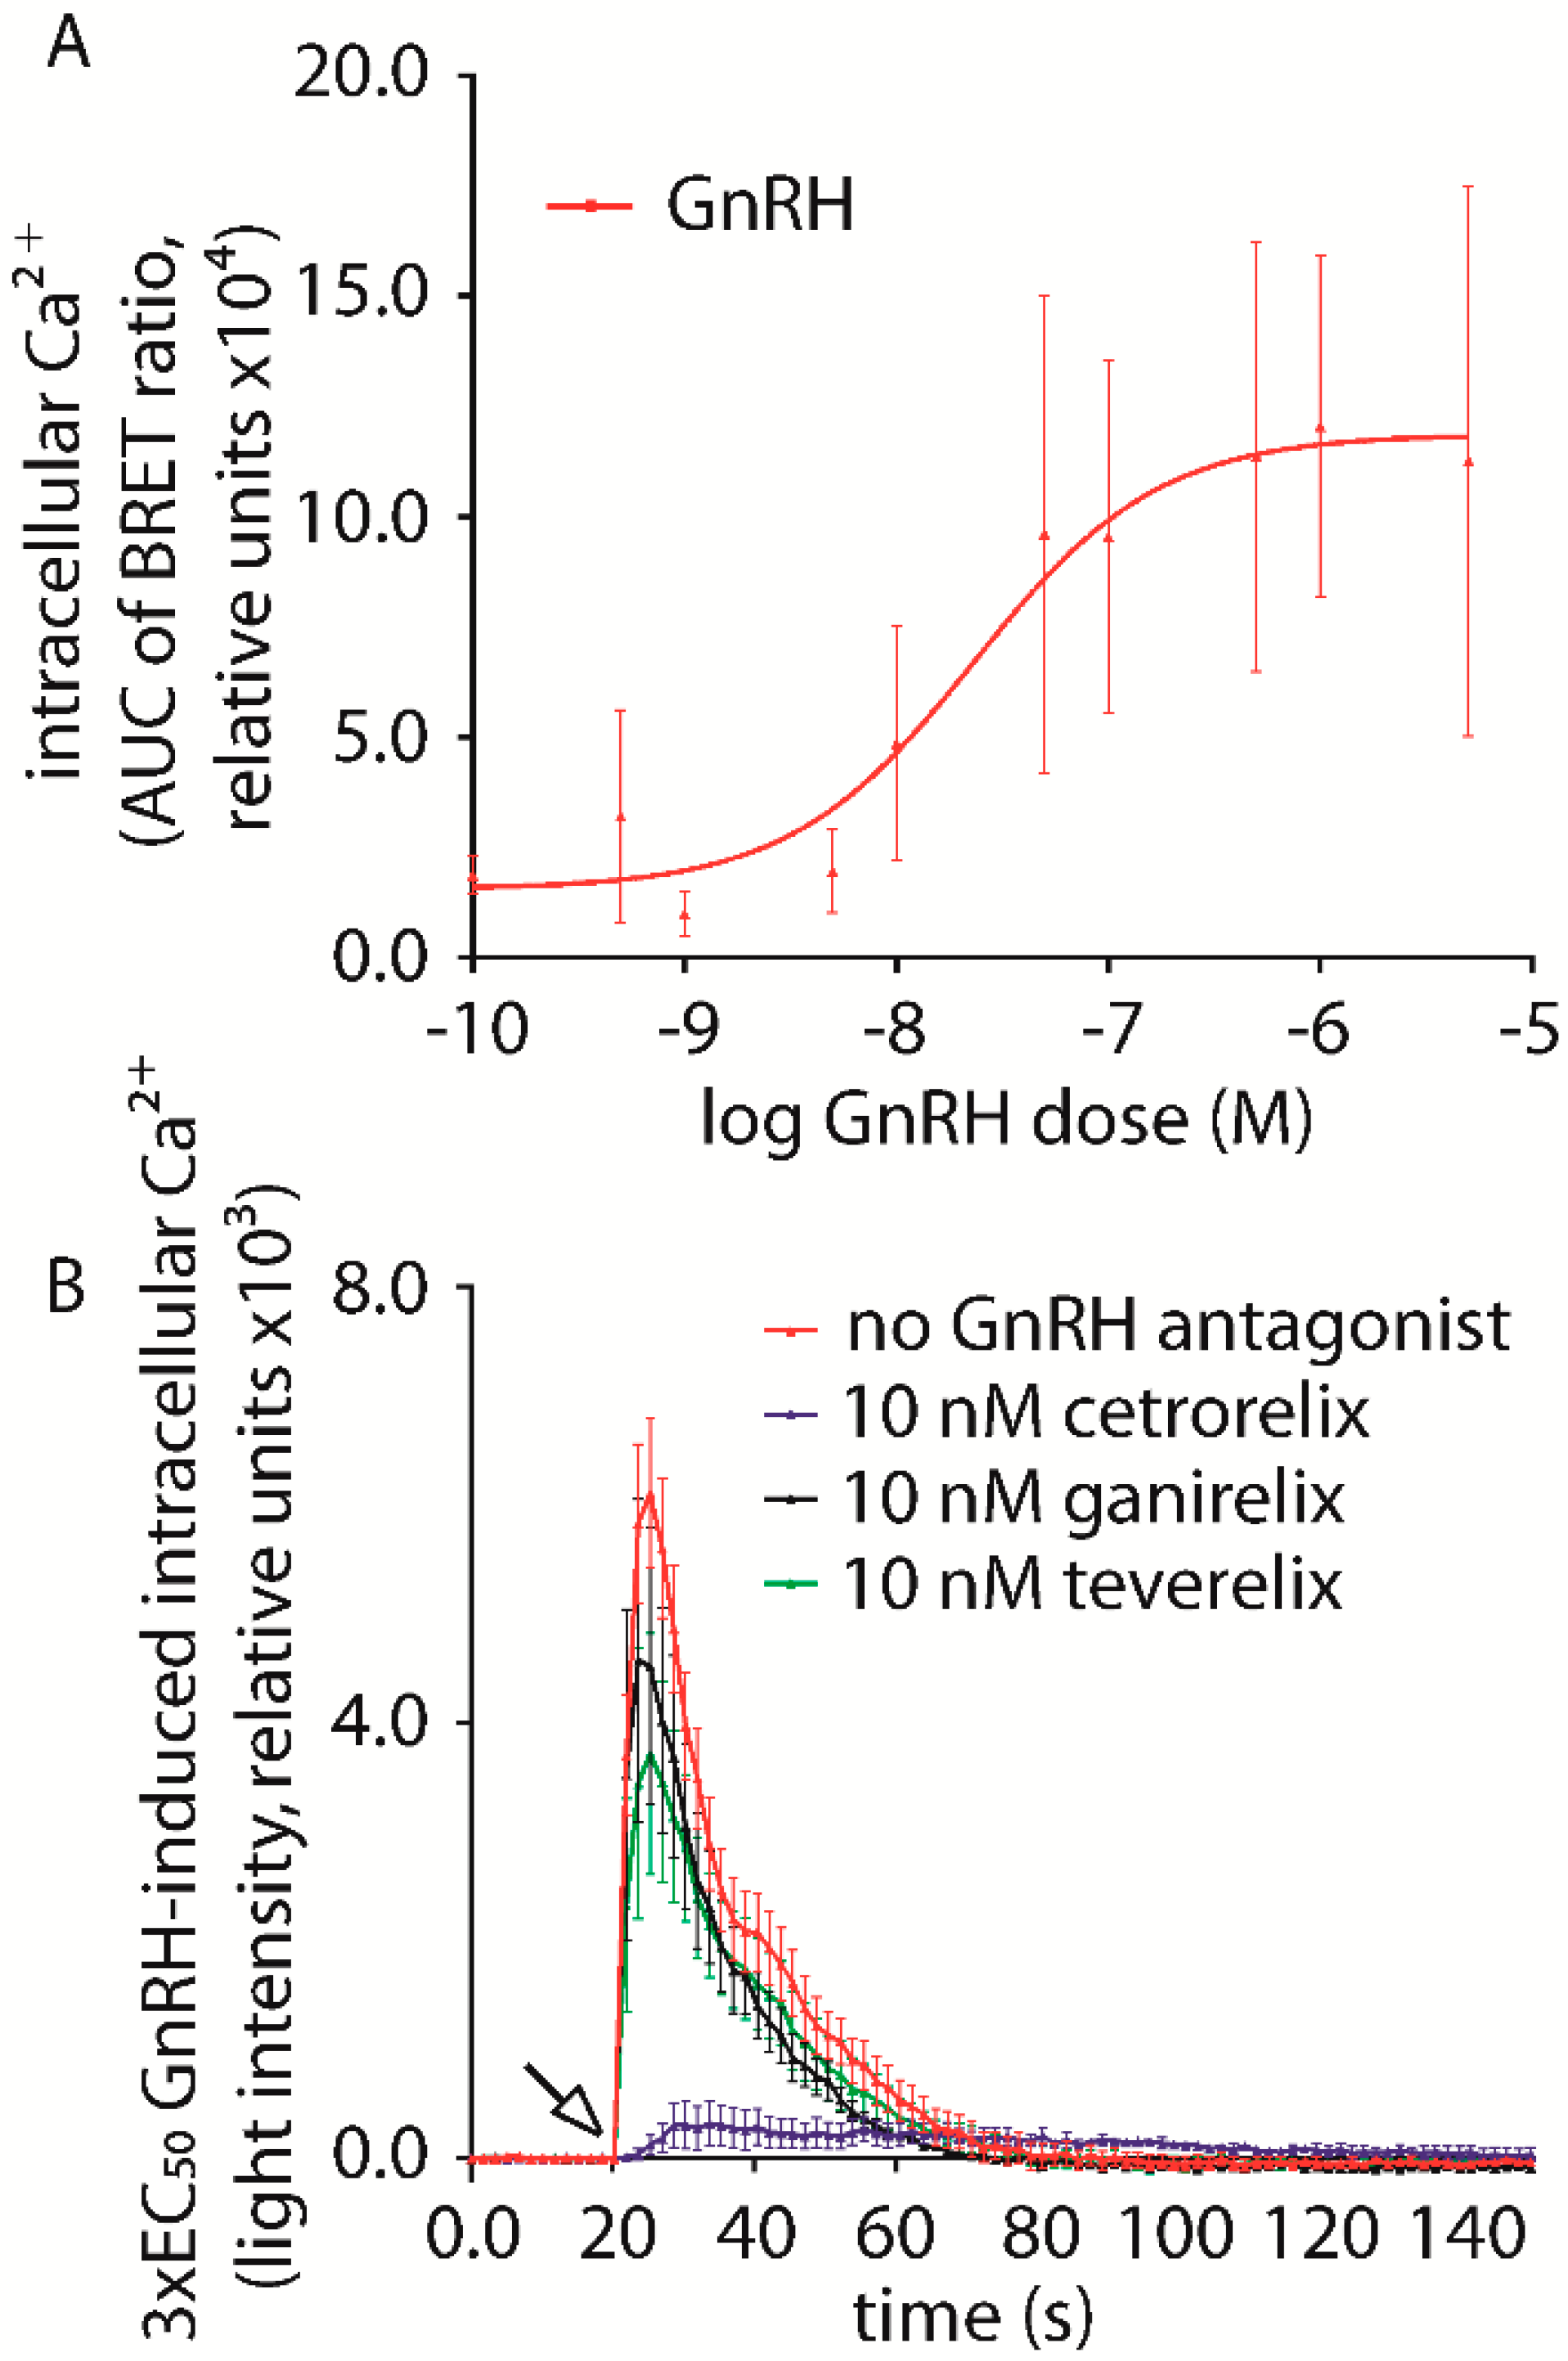
2.1. Gonadotropin Releasing Hormone (GnRH) Antagonist-Induced Inhibition of Intracellular Ca2+ Increase

In order to find the optimal GnRH dose to evaluate the action of antagonists in inhibiting the intracellular Ca2+ increase, dose-response experiments were performed. Thus, Ca2+ biosensor-expressing cells were treated by increasing concentrations of GnRH (pM–µM range) and luminescent signals corresponding to the intracellular Ca2+ concentration were measured by BRET. GnRH-mediated Ca2+ accumulation was measured in transiently transfected HEK293/GnRHR and SH-SY5Y/GnRHR cells, and in a LβT2 cell line, naturally expressing the murine GnRHR [35].
Upon GnRH injection, intracellular Ca2+ rapidly increased, achieving the maximal level within about 5 s, before decreasing back to the basal level within about 80 s. No response was observed upon injection of vehicle (negative control). AUCs obtained from Ca2+ activation kinetics were plotted against the GnRH concentration in a X-Y graph. Data were interpolated by non-linear regression and the potency (EC50) of GnRH in inducing the intracellular ion increase in HEK293/GnRHR cells was calculated to be 23.26 ± 3.37 nM (Figure 2A). GnRH-induced intracellular Ca2+ accumulation was also observed in both the SH-SY5Y/GnRHR and LβT2 cell lines (SH-SY5Y/GnRHR EC50 = 5.78 ± 3.04 nM; LβT2 EC50 = 1.80 ± 2.88 nM; Supplementary Figure S1). For all cell lines, GnRH potency was similar and fell within the nM range (Kruskal-Wallis test; p ≥ 0.05; n = 3).
Potencies of Cetrorelix, Ganirelix and Teverelix in inhibiting the hormone-induced intracellular Ca2+ increase were then compared in vitro. Each of the cell lines were treated by a fixed concentration of GnRH corresponding to the three-fold higher dose than the calculated EC50 (3 × EC50; a concentration optimized for evaluating signal variations in inhibition experiments), in the presence or absence of increasing antagonist (Cetrorelix, Ganirelix or Teverelix) concentrations. Data representing the kinetics of intracellular Ca2+ increase, evaluated over 150 s by BRET were compared after AUC calculation.
Analysis revealed that the antagonists have different potencies in inhibiting the GnRH-induced intracellular Ca2+ increase (Figure 2B). In HEK293/GnRHR cells, the highest inhibition of the GnRH-induced signal was observed with 10 nM Cetrorelix, with an area under the curve (AUC) of 21,482 ± 6718. The same concentration (10 nM) of Ganirelix and Teverelix resulted in different inhibitory effects. For Ganirelix, the AUC was 73,164 ± 16,237 while for Teverelix it was 74,321 ± 17,569. The AUC for HEK293/GnRHR cells without GnRH antagonist treatment was 109,340 ± 13,866. When compared with the inhibition induced by Cetrorelix, significant differences were observed for all treatments (p = 0.005) (Figure 2B). These results were confirmed after comparing the AUCs obtained with a number of antagonist concentrations (Table 1). Interestingly, a small (1.2-fold) increase in GnRH-induced intracellular Ca2+ appears to occur in the presence of 10–100 pM antagonist, although this is not statistically significant, compared to treatment by GnRH alone.
SH-SY5Y and LβT2 cell lines were selected to serve as control models in vitro as they have been shown to endogenously express human [36] or mouse [35] GnRHRs, respectively. However, no GnRH-induced intracellular Ca2+ increase was mediated by the endogenous receptors in either of these cell lines (not shown). Overexpression of the GnRHR-encoding cDNA in the SH-SY5Y cells (SH-SY5Y/GnRHR cells) was required to achieve detectable signals. In this experimental setting, complete efficacy of GnRH antagonists is demonstrated at the 1 µM concentration (Supplementary Table S1) and no drug-specific differences were observed (Kruskal-Wallis test; p ≥ 0.05; Supplementary Figure S2). Unfortunately, transfection of LβT2 cells with GnRHR- and Ca2+ biosensor-encoding cDNA were not successful.
Both HEK293/GnRHR and SH-SY5Y/GnRHR control experiments, in which the effect of increasing antagonist concentrations was examined in the absence of GnRH stimulation, showed no response (Supplementary Figure S3).

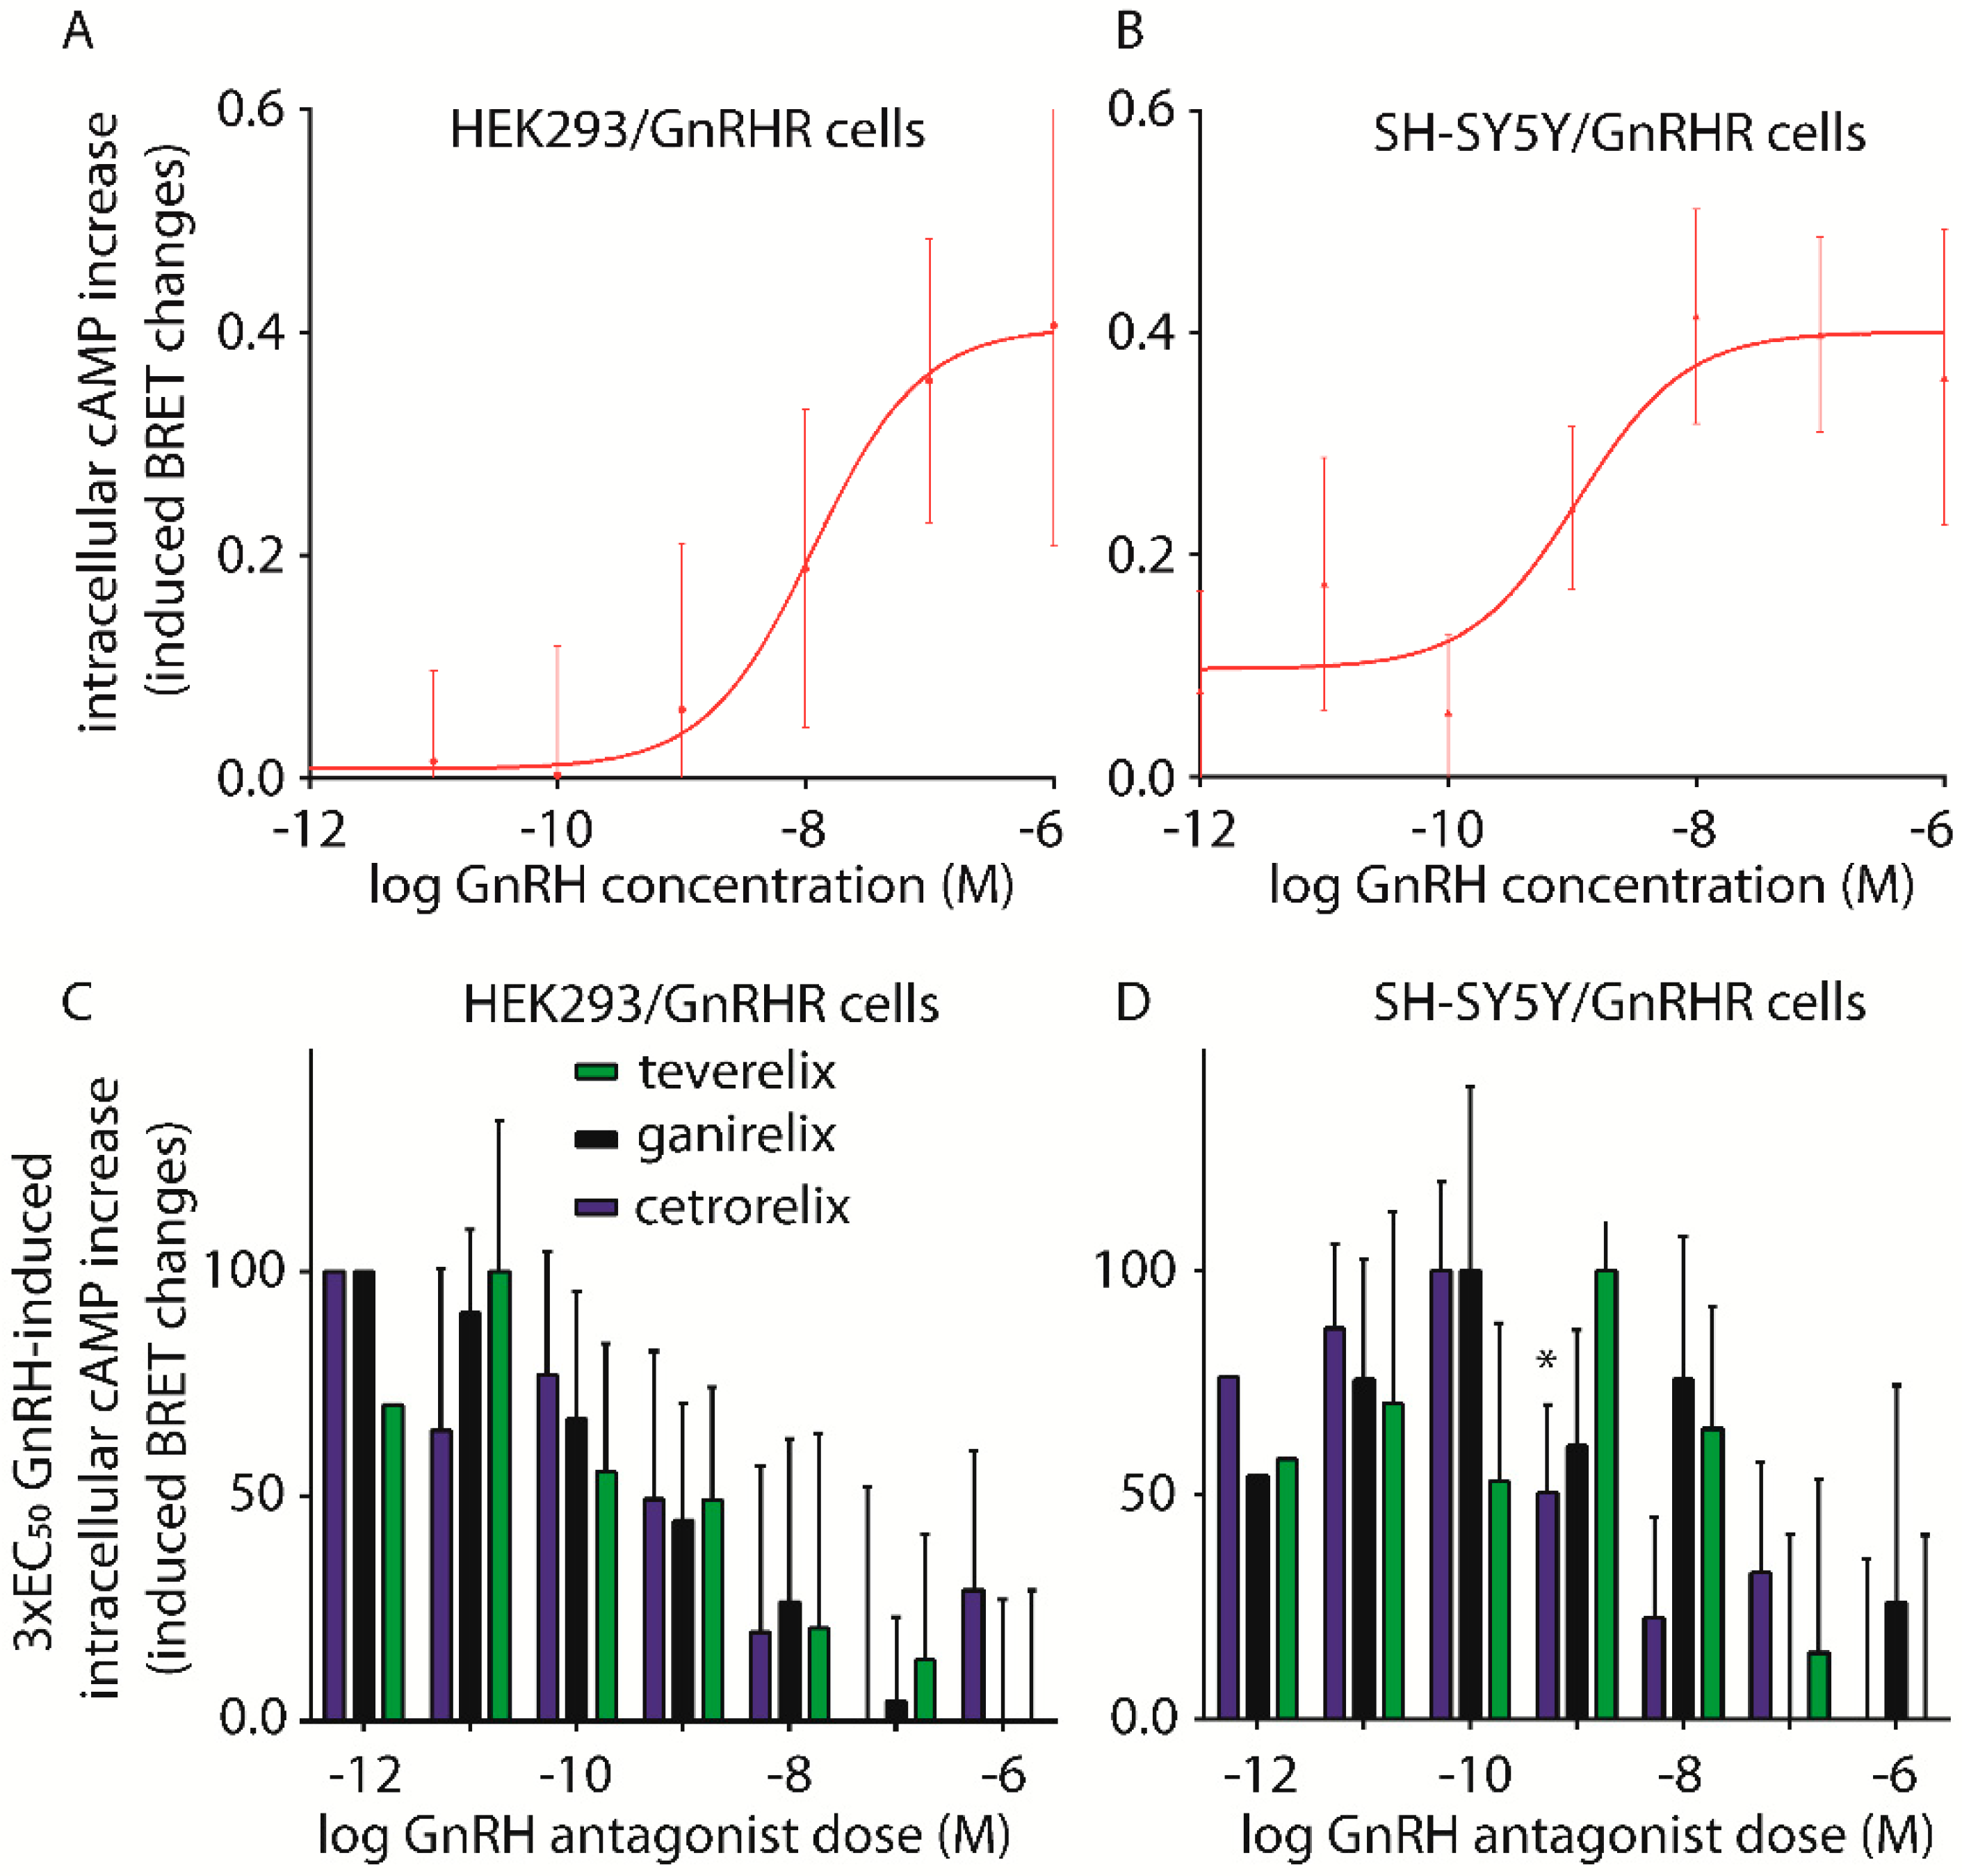
2.2. Assessment of cAMP Accumulation

In order to find the optimal GnRH dose necessary to evaluate the action of antagonists in inhibiting the intracellular cAMP increase, dose-response experiments were performed. HEK293/GnRHR and SH-SY5Y cells transiently expressing the CAMYEL cAMP-biosensor were treated with increasing concentrations of GnRH (pM–µM range), in the presence of a phosphodiesterase inhibitor, and the 30 min cAMP accumulation was evaluated by BRET. The appropriate time-point for measurements of this second messenger was established after assessing the kinetics of the GnRH-induced cAMP accumulation, which is maintained at the plateau level between 10 and 50 min (Supplementary Figure S4). Similarly to what have been seen with Ca2+ accumulation, in untransfected SH-SY5Y cells, no GnRH-induced cAMP increases were detected (not shown), although these cells are reported to endogenously express the human GnRHR [36], as a likely effect due to cell-specific receptor expression levels and/or intracellular enzymatic milieu. Since no GnRH-induced Ca2+ accumulation was observed in LβT2 cells and endogenous GnRHRs are shown to be uncoupled from the Gαs protein/cAMP/PKA-pathway in cells of nervous system origin [6], LβT2 cells were not used for these studies.
Treatment of HEK293/GnRHR and SH-SY5Y/GnRHR cells with GnRH-induced dose-dependent intracellular cAMP accumulation (Figure 3A,B). In both cell lines, similar GnRH potencies were observed (EC50s: HEK293/GnRHR = 11.58 ± 1.95 nM; n = 3; SH-SY5Y/GnRHR = 1.11 ± 4.05 nM; n = 5; Mann–Whitney U test; p ≥ 0.05; means ± SEM).
GnRH 3 × EC50 concentrations were then used as fixed concentrations for the evaluation of Cetrorelix, Ganirelix and Teverelix potencies in inhibiting the hormone-induced cAMP increase. Cells were treated with the hormone, in the presence of increasing antagonist concentrations, and intracellular cAMP accumulation was assessed. cAMP concentrations were determined as “induced BRET changes” and plotted against antagonist concentration in an X-Y graph before data interpolation by non-linear regression.
In HEK293/GnRHR cells (Figure 3C), similar dose-inhibition curves were obtained for each of the antagonists. These data demonstrate overall equal potency of antagonists in reducing the GnRH-induced cAMP accumulation (IC50s: Cetrorelix = 0.84 ± 3.85 nM; Ganirelix = 0.61 ± 2.57 nM; Teverelix = 0.49 ± 3.21 nM; Mann–Whitney U test test; p ≥ 0.05; means ± SEM; n = 4) and do not reflect the antagonist-specific modulation that was observed for calcium signaling in this cell line (Figure 2). Interestingly, in SH-SY5Y/GnRHR cells, Cetrorelix displayed higher potency than Teverelix or Ganirelix in inhibiting cAMP accumulation (Figure 3D), (IC50: Cetrorelix = 1.56 ± 2.49* nM; Ganirelix = 16.60 ± 3.76 nM; Teverelix = 62.80 ± 3.77 nM; * = significantly different versus other antagonists; Mann–Whitney U test; p < 0.05; means ± SEM; n = 5). Control experiments, in which cells were treated with GnRH antagonists in the absence of the hormone, demonstrated no cAMP activation (Supplementary Figure S5).

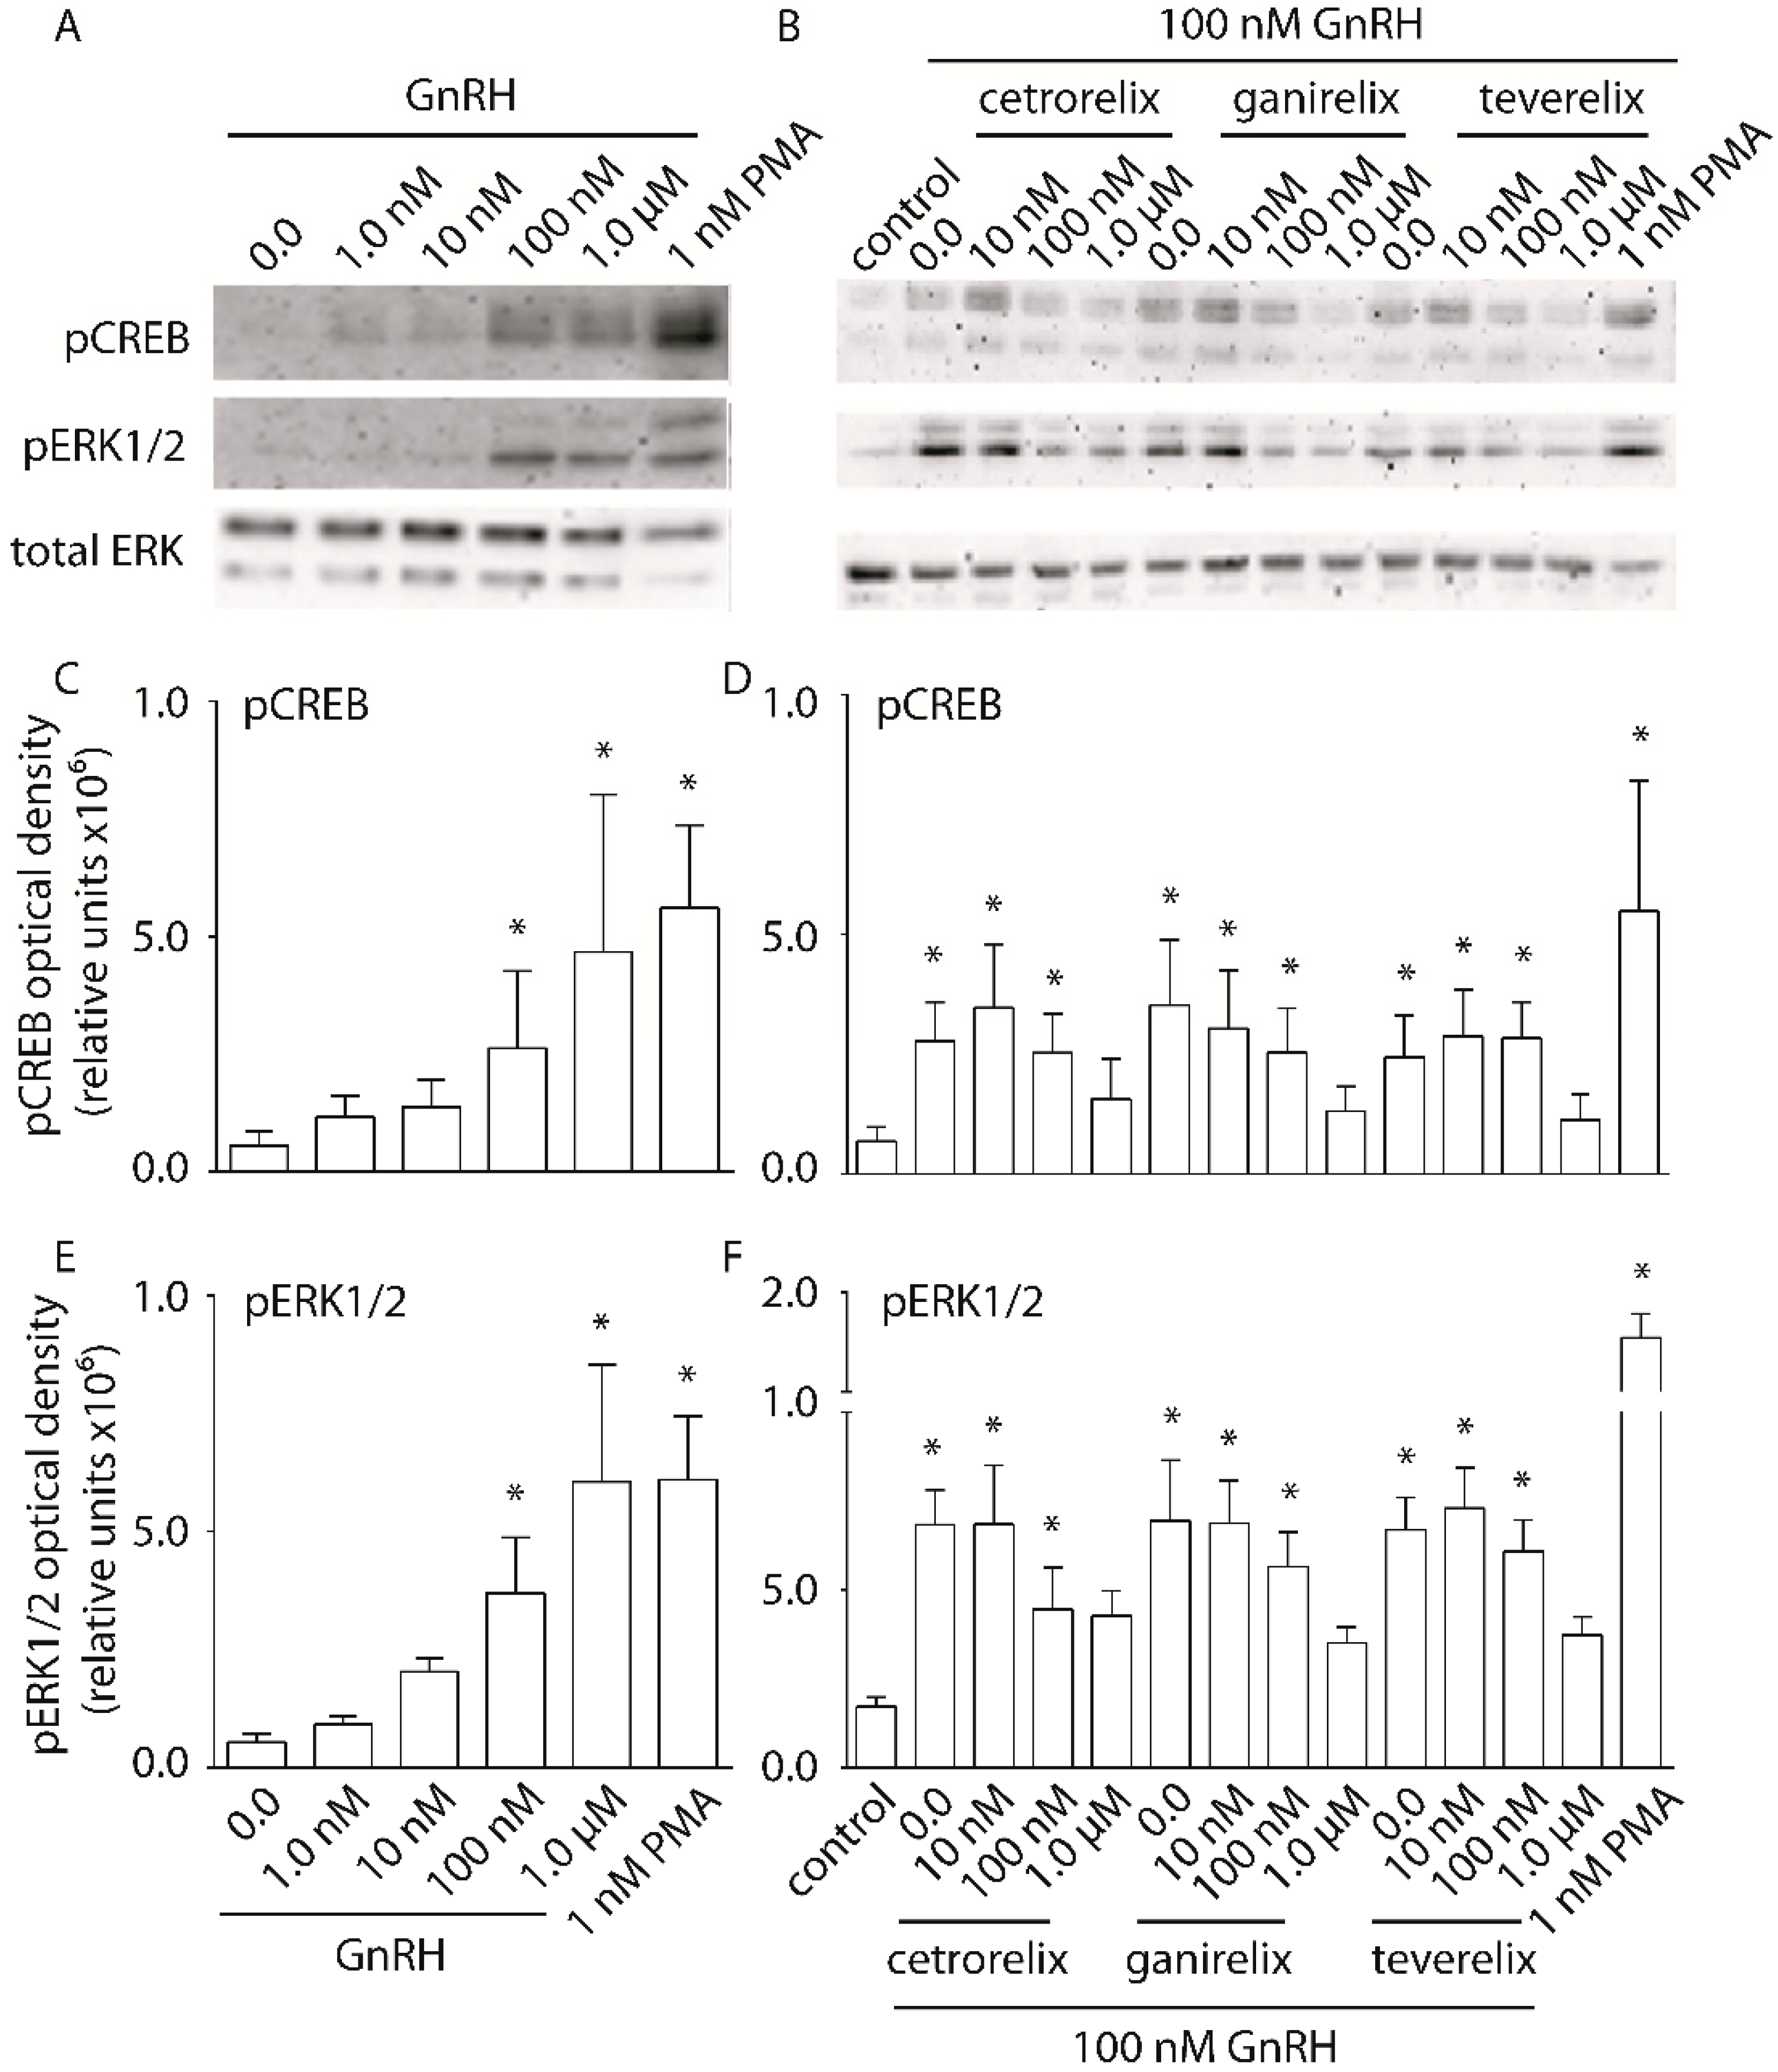
2.3. Evaluation of pERK1/2 and pCREB Activation

The phosphorylation of ERK1/2 and CREB, as events occurring downstream of intracellular Ca2+ and/or cAMP accumulation, were evaluated in cells treated by nM–µM GnRH concentrations (Figure 4). HEK293/GnRHR cells were treated with GnRH, in the presence or in the absence of antagonists before evaluation of ERK1/2 and CREB phosphorylation by semi-quantitative Western blotting
HEK293/GnRHR cell treatment by 100 nM and 1 µM GnRH resulted in significant activation of both pERK1/2 and pCREB (Figure 4A), compared to basal levels (Kruskal-Wallis test; p < 0.05; n = 3). This reflects the hormone doses required for maximal intracellular Ca2+ and cAMP accumulation (Figure 2 and Figure 3).
Since 100 nM GnRH was the minimum concentration required to see robust activation of these phospho-proteins, it was used as a fixed dose for testing pERK1/2 and pCREB inhibition by the antagonists (Figure 4B). Inhibition of pCREB activation occurred upon treatment of cells with antagonist concentrations as low as 10 nM, with complete inhibition observed with concentrations of 1 µM (Kruskal-Wallis test; p < 0.05; n = 3). Inhibition of GnRH-induced pERK1/2 activation required higher doses of antagonist, but at 1 µM, significant inhibition was observed. The inhibition profiles of each antagonist were similar, revealing that Cetrorelix, Ganirelix and Teverelix similarly impact the phospho-protein activation. One representative experiment performed with gonadotrope LβT2 cells revealed similar findings (Supplementary Figure S6), while sub-optimal Western blotting signals were obtained using SH-SY5Y/GnRHR cells, which impeded data interpretation (not shown).

2.4. Analysis of β-Catenin Activation and Localization

In HEK293/GnRHR cells, activation and intracellular localization of β-catenin in response to GnRH treatment was assessed by fluorescence microscopy. Cells were treated for 1 h with a high concentration (1 µM) of GnRH, in the presence or absence of 1 µM GnRH antagonist, prior to fixation and staining with an anti-active-β-catenin antibody and DAPI nuclear stain. Cells treated for 16 h with 100 nM CHIR99021 served as a positive control for β-catenin activation.
While no active β-catenin staining (red in Figure 5) was observed in untreated cells, 1 h treatment with GnRH resulted in robust activation and staining of the molecule, detectable even in the nuclei (Figure 5). Similar to that demonstrated using the positive control CHIR99021, GnRH-activated β-catenin was localized both in the cytoplasm and in the nucleus of the cell. This staining was reduced in the presence of 1 µM Cetrorelix or Ganirelix, while the equimolar concentration of Teverelix did not result in any decrease of signal.

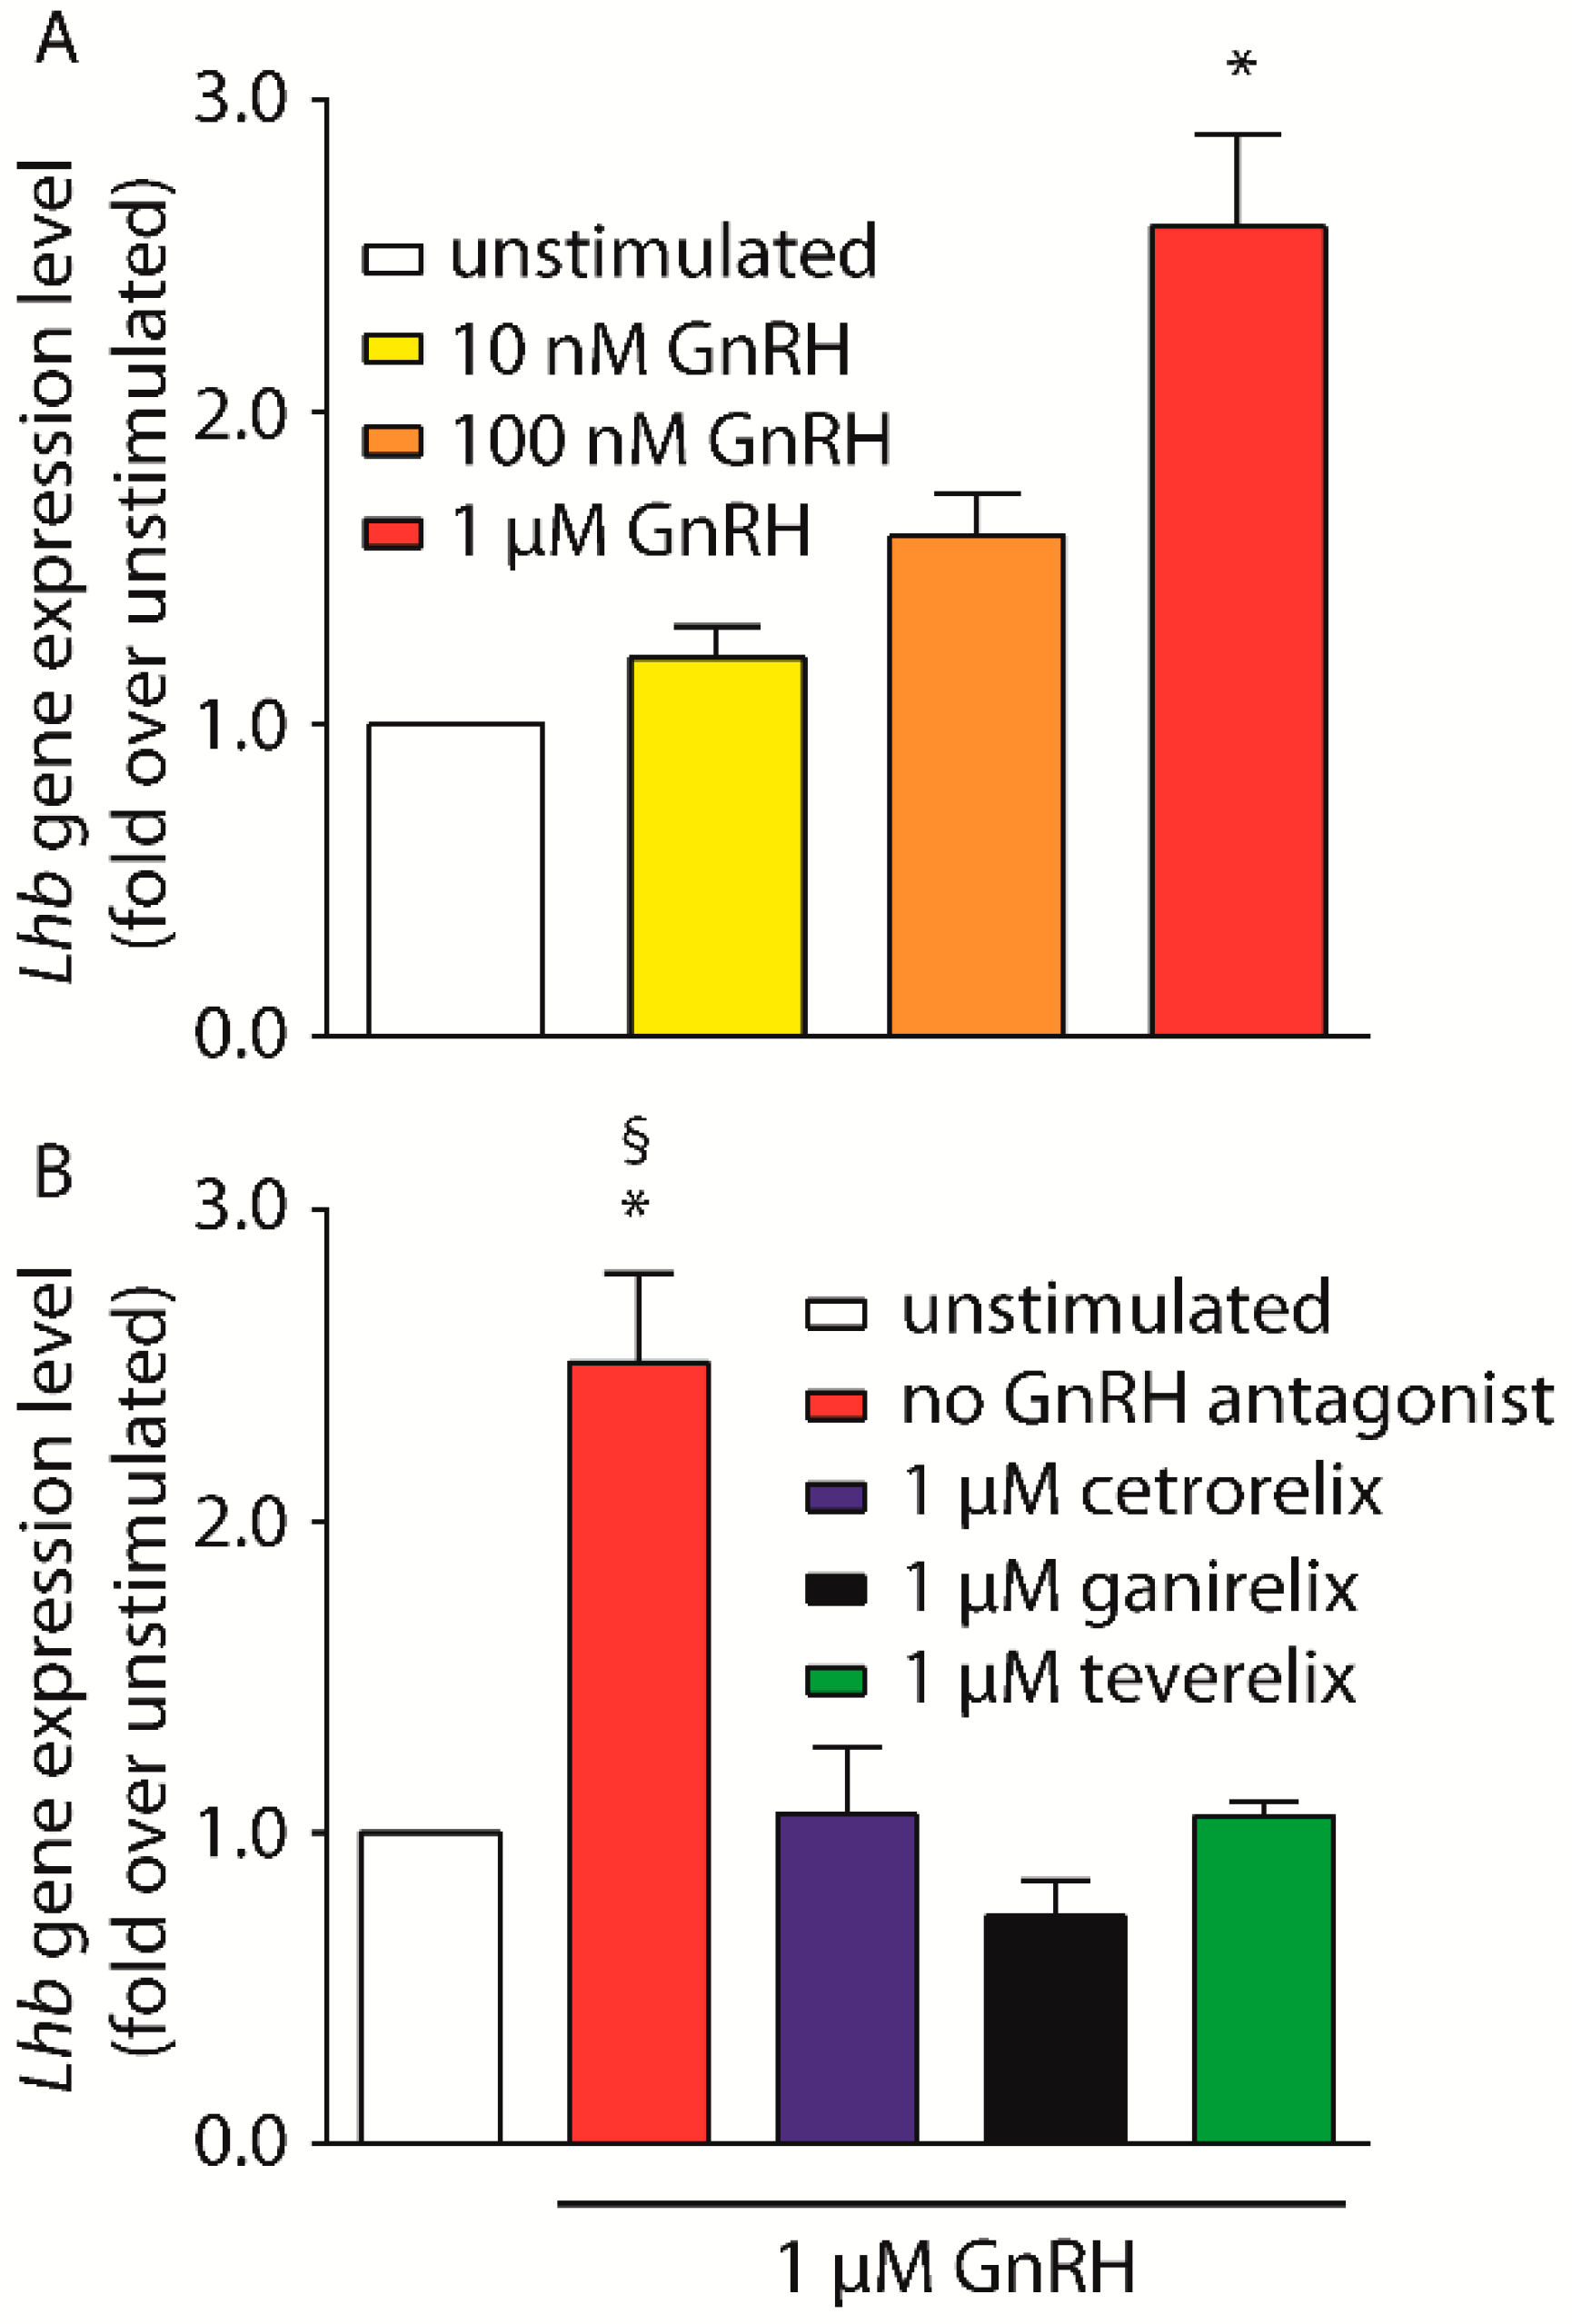
2.5. Analysis of GnRH-Induced Lhb Gene Expression

One of the physiological outcomes of GnRHR-mediated signaling in pituitary gonadotropes is the increased expression and secretion of the gonadotropins, luteinizing hormone (LH) and follicle-stimulating hormone (FSH). To assess the potential effects of the different antagonists’ gonadotropin expression, Lhb gene expression was evaluated by qRT-PCR in LβT2 cells. The same analysis was not possible in HEK293 and SH-SY5Y due to the lack of LH receptor-encoding gene expression. Cells were first treated by increasing doses of GnRH (nM–µM range) to find the optimal GnRH concentration to be used for subsequent experiments comparing Cetrorelix, Ganirelix and Teverelix efficacy in inhibiting Lhb gene transcription.
LβT2 cell treatment by 1 µM GnRH resulted in Lhb gene expression increase (2.6-fold over basal; Kruskal-Wallis test; p < 0.05; n = 4), while lower hormone concentrations did not result in significantly different expression levels compared to basal (Figure 6A).
1 µM was therefore used as a fixed GnRH concentration to test the efficacy of equimolar concentrations of antagonists in inhibiting Lhb gene expression. 1 µM of Cetrorelix, Ganirelix or Teverelix inhibited GnRH-induced activation of target gene expression (Figure 6B) (Kruskal-Wallis test; p < 0.05; n = 4), achieving Lhb expression levels similar to basal (Kruskal-Wallis test; p ≥ 0.05; n = 4).

3. Discussion

Herein, it has been demonstrated that three GnRH antagonists developed for clinical purposes, such as prevention of premature ovulation and prostate cancer therapy [37], have different potencies in inhibiting hormone-dependent intracellular signaling in vitro. Peptide chains of Cetrorelix, Ganirelix and Teverelix differ by two amino acids [5,26], likely specifically modulating their receptor binding and GnRH-induced signaling. Indeed, 10 nM Cetrorelix fully inhibited intracellular Ca2+ increase upon HEK293/GnRHR cell treatment by the hormone, while the same concentration of the other two antagonists resulted in only partial antagonism. These data are supported by the higher potency of Cetrorelix in inhibiting cAMP production in SH-SY5Y/GnRHR cells, although all three antagonists elicit equivalent inhibition on GnRH-induced cAMP responses in HEK293/GnRHR cells in vitro. Furthermore, inhibition of GnRH-induced activation of β catenin by GnRH in HEK293/GnRH cells was inhibited by Cetrorelix and Ganirelix but not Teverelix. Taken together, these data suggest that GnRH antagonists are capable of cell-specific, biased signaling. Other downstream intracellular signals, such as pERK1/2 and pCREB activation, were not affected by antagonist-specific inhibition and hormone-induced expression of the Lhb target gene was decreased similarly by all three, in the mouse LβT2 cell line.
Amino acidic differences between these GnRH antagonists fall within a peptide region which is crucial in regulating the interaction with the GnRHR [5,38]. In particular, Cetrorelix carries the amino acid arginine at position 8 of the protein chain (Figure 1), where Ganirelix and Teverelix have the D-isomer of arginine (D-arginine) or lysine, respectively. In native human GnRH there is an arginine in this position which is conserved in mammals (although less conserved in other vertebrates [39]). This arginine has been proposed to be a contact point with an asparagine residue located within the third extracellular loop of the receptor, and to play a role in stabilizing the receptors active conformation and thus its activation [34]. Cetrorelix and Teverelix both have a D-isomer of citrulline at position 6 (Figure 1), while Ganirelix carries a D-arginine in this position [5]. In vertebrates, native GnRH peptides display a highly conserved glycine at position 6. This residue plays a crucial role in preserving binding affinity to the human receptor and in stimulating activation and down-stream signaling, such as inositol phosphate production [39].
GnRH-induced intracellular Ca2+ increase was evaluated by BRET in transfected cell lines overexpressing a specific biosensor and GnRHR. Previous studies demonstrated that, in pituitary gonadotrope cells, calcium signalling is potently up-regulated by GnRH via activation of ion channels [40,41] and it is a fundamental mediator of the LH and FSH release [42,43]. In fact, in LβT2 cells, Lhb mRNA expression, induced by GnRH agonists, can be inhibited by a Ca2+ chelator [44]. However, in the present study, no consistent GnRH-induced intracellular Ca2+ increase was observed in LβT2 cells, presumably due to relatively low transfection and transcription efficiency of the Ca2+ biosensor-encoding plasmid. Experiments performed using transfected HEK293 and SH-SY5Y cell lines overexpressing both the biosensor and the hormone receptor, revealed that intracellular Ca2+ increase may be dampened, or even prevented by nM–µM concentrations of GnRH antagonist. Interestingly, we demonstrated that Cetrorelix has higher potency than Ganirelix and Teverelix in inhibiting calcium signaling. 10 nM Cetrorelix fully antagonizes 3 × EC50 GnRH, while other compounds fully antagonize the hormone only when they are administered at higher concentrations. These different inhibitory potencies may be assumed to be a result of compound-specific intracellular signaling signatures underlying the LiSS concept [34] and provide a basis to explain apparent differential clinical effects, such as lower pregnancy rate with Ganirelix versus Cetrorelix when using these antagonists for ART [30]. This data also supports other in vitro studies, which have revealed that GnRH antagonists may counteract hormone-induced apoptosis in GnRHR-expressing cells [45] and this effect may vary according to the type of antagonist used [46].
It is noteworthy that at pM concentrations, the antagonists appeared to potentiate rather than inhibit GnRH-induced intracellular Ca2+ accumulation, although these effects were not statistically significant. Agonistic action exerted by low GnRH antagonist concentrations has previously been described using human prostate cancer cells [46]. However, the molecular mechanism underlying this behavior is not known.
The primary transduction mechanism utilized by the GnRHR is via coupling to Gαq/11 G proteins. Coupling to the cAMP pathway has also been observed but this has been attributed to the overexpression of exogenous receptor in transfected cells [47], since it typically does not occur in human gonadotrope cells [5]. Indeed, cAMP production may be achieved with non-human GnRHR due to a specific motif in the C-terminal tail [48], which is lacking in the human receptor [49]. Considering together intracellular Ca2+ and cAMP data obtained from HEK293/GnRHR cells, it is conceivable that antagonists mediate biased GnRH-induced signaling, strengthening the concept that they may be linked to LiSS [34]. Indeed, cell treatment by Cetrorelix, Ganirelix and Teverelix resulted in similar cAMP inhibition, in spite of higher potency of Cetrorelix in depleting the hormone-induced intracellular Ca2+ increase. Interestingly, although effects on intracellular Ca2+ accumulation were similar in the HEK293/GnRH and SH-SY5Y cells, antagonist effects on GnRH-induced cAMP accumulation were different between the two cell lines. In the SH-SY5Y cells, Cetrorelix displayed higher efficacy than other compounds in inhibiting GnRH-induced cAMP increase, reflecting the effects on intracellular Ca2+ accumulation. These cell line-specific differences might be due to cell-specific receptor interacting proteins [50], resulting in the so-called tissue bias [51].
Analysis of GnRH-induced pCREB and pERK1/2 activation suggested that the activity of these cAMP-dependent kinase enzymes [52] is similarly modulated by all three antagonists, which were equipotent in decreasing the phosphorylation of ERK and CREB, corroborating with the findings from the cAMP accumulation studies, at least in the HEK293/GnRHR cells. Unfortunately, comparisons between cAMP and phospho-protein data obtained from SHSY5Y/GnRHR were not possible due to the inconsistency of Western blotting signals (not shown), while results from gonadotrope LβT2 cells confirmed that in this cell line, the GnRH antagonists are also equipotent in inhibiting pERK1/2 and pCREB activation. Since phospho-proteins control the GnRH pulse frequency [52] and transcription of gonadotropin β subunits gene [53,54], we might expect that Cetrorelix, Ganirelix and Teverelix similarly impact Lhb gene mRNA levels in LβT2 cells. The transcription of GnRH target genes is modulated by several factors, such as β-catenin [24], which activation, in turn, is itself dependent on a number of molecules including intracellular Ca2+ and CREB. Although β-catenin activation acts as an enhancer of the Lhb gene transcription [55], and immunostaining has revealed its weak inhibition by Teverelix, all three antagonists had similar effects on GnRH-induced Lhb expression. These data highlight the potential of GnRH antagonists in exerting LiSS behavior at the early signaling level, in spite of the similar inhibition of gonadotropin production. This observation of differential effects at different endpoints may be due to the balance of GnRH-mediated signals at the intracellular level, as previously demonstrated by treating gonadal cells by gonadotropic hormones [56,57], resulting in smoothing of the ligand-specific, early biased signaling across the intracellular cascade progression. While future studies could examine these effects further using human gonadotrope cell lines and also further explore the links to clinical efficacy, the data obtained herein are overall indicative of the structure-specific action of the GnRH antagonists at the receptor. On the other hand, limitations due to the in vitro environment and transcription efficiency of the receptor-encoding cDNA used for cell transfection should be taken into account, since it might result in cell-specific responses. Therefore, it may be supposed that the cell model may be a source of variations between activities of antagonists due to intrinsic factors, such as GnRHR expression levels, exposing the cell context to receptor saturation at high hormone concentrations or other potential modulatory effects to be further investigated.

4. Materials and Methods

4.1. Materials

Cell treatments were performed using GnRH purchased from SANOFI (Relefact LH-RH 0.1 mg), in the presence or in the absence of Cetrorelix acetate (C5249; Sigma-Aldrich, St. Louis, MO, USA), Ganirelix acetate (SML024; Sigma-Aldrich) or Teverelix [31]. Hemagglutinin-tagged GnRHR (GnRHR-HA)-expressing vector was previously described [58] and was used for inducing the overexpression of the receptor in cell lines.

4.2. Cell Culture

Human embryonic kidney (HEK293) and mouse pituitary gonadotrope LβT2 cells [35] were grown in DMEM medium, modified with 4.5 g/L glucose and supplemented with 10% fetal bovine serum (FBS), 2 mM glutamine, 100 U/mL penicillin and 0.1 mg/mL streptomycin (Invitrogen, Carlsbad, CA, USA). Human neuroblastoma-derived SH-SY5Y cells were kindly provided by Professor Fabio Tascedda (University of Modena and Reggio Emilia, Modena, Italy) and maintained in DMEM/F12 medium, supplemented with 10% FBS, 2 mM glutamine, 100 U/mL penicillin, 0.1 mg/mL streptomycin and 1% MEM non-essential amino acids solution (Invitrogen, Carlsbad, CA, USA). All cell lines were maintained at 37 °C and 5.0% CO2.
While the mouse and human GnRHR are known to be naturally expressed in both the LβT2 [35] and SH-SY5Y cell lines [36] respectively, they are not in HEK293 cells.

4.3. Transfection Methods

Different transfection protocols were followed, depending on the endpoint to be measured. For BRET experiments, 3 × 10⁴ cells were transiently transfected using vectors expressing the cAMP-CAMYEL or the aequorin-Ca2+ BRET biosensor-encoding cDNA [59], as appropriate, together with the GnRHR-HA-encoding vector. Transfections were performed in a 96-well plate using the Metafectene PRO reagent (Biontex, München, Germany), as previously described [60]. 100 ng of the receptor-encoding vector + 100 ng of the BRET biosensor-encoding vector were used for co-transfecting HEK293 cells, while SH-SY5Y cells were co-transfected using 200 ng of the receptor-encoding vector + 100 ng of the BRET biosensor-encoding vector. 200 ng of the aequorin-Ca2+ BRET biosensor-encoding cDNA were used for transfecting LβT2 cells. Each sample was prepared in duplicate, cultured for 48 h and serum-starved over-night before experiments.
In order to evaluate the activation of phospho-proteins and β-catenin by Western blotting and immunofluorescence, 1 × 10⁵ HEK293 cells were transiently transfected in a 24-well plate. To this purpose, 500 ng of GnRHR-HA-encoding vector diluted in 2 µL/well Lipofectamine® 2000 Transfection Reagent (Invitrogen) were used, according to the manufacturer’s instructions. Transfected HEK293 cells (HEK293/GnRHR) were cultured for 48 h and maintained over-night in serum-free medium before experiments.

4.4. BRET Measurement of Intracellular Ca2+ Increase and cAMP Production

GnRH-induced intracellular cAMP and Ca2+ increase was assessed by the BRET technique in biosensor- and GnRHR-expressing cells, as previously described [57,59,61,62], in the presence or in the absence of GnRH antagonist. To evaluate Ca2+ increase, cells were incubated in Hank’s Balanced Salt Solution (HBSS) with Ca2+ and Mg2+, 1 mM Hepes and 5 µM Coelenterazine H (NanoLight Technologies, a division of Prolume, Ltd., Pinetop, AZ, USA), for 45 minutes, together with Cetrorelix, Ganirelix, Teverelix or vehicle, as appropriate. Light emissions at 480 and 540 nm wavelengths were detected every 1.68 s, over 150 s, while a fixed concentration of GnRH (equivalent to the 50% effective concentration (EC50)) was injected at the 21.94 s time-point. Dose-response experiments were performed by treating LβT2, HEK293/GnRHR and SH-SY5Y/GnRHR cells with increasing concentrations of GnRH (pM-µM range) in the absence of antagonist. AUC extrapolated from Ca2+ kinetics was calculated, for each cell line, and plotted against the GnRH concentration in a X-Y graph. The EC50 was extrapolated from the curve obtained from each cell line. Cells treated by 5 µM of the sarco/endoplasmic reticulum Ca2+ ATPase enzyme inhibitor, thapsigargin (Tocris Bioscience), served as positive control [63]. Treatment by the vehicle (HBSS) was the negative control and used as a normalizer.
cAMP accumulation was measured in cells transiently expressing both the BRET-based cAMP biosensor CAMYEL [64] and GnRHR. Dose-response experiments were prepared by 20 min cell incubation in 40 µL/well of Dulbecco’s phosphate buffered saline (PBS), 1 mM HEPES and 200 µM of the phosphodiesterases inhibitor 3-isobutyl-1-methylxanthine (IBMX) (#I5879, Sigma-Aldrich) before 30 min treatment by increasing doses of antagonist together with a fixed (3 × EC50) concentration of GnRH. BRET signals were detected at 475 and 535 nm wavelengths upon the addition of 5 µM Coelenterazine H (NanoLight Technologies). Treatment by 200 µM of the adenylyl cyclase activator forskolin (Sigma-Aldrich) served as a positive control.
BRET experiments were performed using a CLARIOstar plate reader equipped by a monocromator (BMG Labtech, Ortenberg, Germany), as previously described [56,59,60,61,62,63].

4.5. Western Blotting Analysis

GnRH-induced ERK1/2 and CREB phosphorylation, in the presence or in the absence of antagonists, was analyzed by Western blotting, as previously described [65,66]. LβT2 and HEK293/GnRHR cells were plated in 24-well plates (1 × 10⁵ cells/well). After 48 h, cells were incubated in serum-free media for 24 h and treated for 15 min with GnRH in the presence or absence of antagonists. 20 nM of the activator of protein kinase C (PKC), phorbol 12-myristate 13-acetate (PMA), was used as a positive control [65]. After treatment, cells were lysed in ice-cold RIPA buffer enriched by one tablet/10 mL of the phosphatase inhibitor PhosStop (Roche, Basel, Switzerland) and protease inhibitor cocktail. pERK1/2 and pCREB were detected using specific rabbit antibodies (#9101and #9198, respectively; Cell Signaling Technology Inc., Danvers, MA, USA) after Western blotting, while total ERK1/2 (# 4695; Cell Signaling Technology Inc.) served as a normalizer. Membranes were incubated with a secondary anti-rabbit HRP-conjugated antibody (#NA9340V; GE HealthCare, Chicago, IL USA) before signal development through the ECL chemiluminescent compound (GE HealthCare) and acquisition by the QuantityOne analysis software (Bio-Rad Laboratories Inc., Hercules, CA, USA). Densitometric analyses were performed using the ImageJ software (National Institute of Health, Bethesda, MD, USA) [67].

4.6. Immunofluorescence Analysis

3 × 10⁴ HEK293/GnRHR and mock-transfected HEK293 cells (negative control) were plated on gelatine-treated slides. After 48 h, cells were serum starved for 16 h before 1 h treatment by 1 µM GnRH, in the presence or in the absence of equimolar concentrations of the antagonists. As a positive control, cells were treated for 16 h with 100 nM of the selective glycogen synthase kinase 3 (GSK3) inhibitor, CHIR99021 (Sigma-Aldrich), which stabilizes free cytosolic β-catenin [68]. After stimulations, cells were washed in PBS with Ca2+/Mg2+ and fixed for 20 min in paraformaldehyde 4%/PBS. Cell monolayers were washed by PBS and permeabilized using 0.1% Triton X-100. Samples were incubated in 4% bovine serum albumin (BSA)/PBS, for 1 h at room temperature (RT), before incubation with a mouse primary antibody targeting β-catenin (#05-665, 1:300 dilution in 4% BSA/PBS; Merck KGaA) overnight at 4 °C. Following washing, cells were then incubated with Cy3-conjugated anti-mouse IgG secondary antibody (#C2181, 1:200 dilution in 4% BSA/PBS; Sigma-Aldrich) for 1 h at RT. Cell monolayers were then stained for 10 min with 4′,6-diamidino-2-phenylindole (DAPI) (Sigma-Aldrich) and washed in PBS before slide treatment by polyvinyl alcohol mounting medium with 1,4-diazabicyclo[2.2.2]octane (DABCO®) (Sigma-Aldrich). Fluorescent signals were detected using the Eclipse Ni-E microscope (Nikon Instruments BV, Amsterdam, The Netherlands).

4.7. Lhb Gene Expression

LβT2 cells were seeded in 24-well plates (2 × 10⁵ cells/well) and cultured for 24 h in DMEM supplemented with 10% Charcoal Stripped FBS, 4.5 g/L glucose, 100 IU/mL penicillin, 0.1 mg/mL streptomycin, and 1 mM glutamine (all from Sigma-Aldrich) before treatments. Cells were maintained for 24 h with increasing GnRH concentrations (nM–µM range) in the presence or absence of antagonist. Samples were lysed for RNA extraction using TRIzol™ Reagent (Invitrogen) and equal amounts of total RNA were used for cDNA synthesis performed using the iScript reverse transcriptase (BioRad), as previously described [57]. qRT-PCR was carried out in triplicates on the CFX96™ Real-Time PCR Detection System (BioRad) using the following primers pairs: fwd: 5′-CTGGCCGCAGAGAATGAGTT-3′; rev:5′-TCGGACCATGCTAGGACAGT-3′ for mouse Lhb; 5′-GGCATTGCTCTCAATGACAA-3′; rev:5′-ATGTAGGCCATGAGGTCCAC-3′ for mouse Gapdh. Primer sequences were drawn using the Mus musculus Lhb (NCBI Reference Sequence: NM_008497.2) and Gapdh (NM_008084.3) mRNAs as templates. Gene expression of Lhb was normalized to mouse Gapdh gene expression using the 2−ΔΔCt method [69].

4.8. Statistical Analysis

Data were plotted on graphs as means ± standard error of means (SEM). The kinetics of intracellular Ca2+ increase was represented by the BRET biosensor emission after background subtraction (vehicle). AUC were calculated for each line and plotted against the GnRH concentration, obtaining dose-response curves after non-linear regression analysis. Data distributions were analyzed by D’Agostino and Pearson normality tests and inhibition of intracellular Ca2+ increase by different concentrations of antagonist were compared using two-way analysis of variance (ANOVA), followed by Bonferroni post-test or Kruskal-Wallis and proper post-test. cAMP accumulation was represented as acceptor:donor emission ratio (induced BRET changes) after basal subtraction (untreated cells). Dose-response curves were obtained by data interpolation using non-linear regressions and normalized as percentage of the maximal response. EC50s, as well as half-maximal inhibitory concentrations (IC50), were compared by t-test or Mann–Whitney U test, while results obtained by Western blotting and qRT-PCR data were compared by one-way ANOVA followed by Bonferroni post-test. Statistical differences were considered as significant for p < 0.05. These analyses were performed using the GraphPad Prism software (GraphPad Software Inc., San Diego, CA, USA).

5. Conclusions

Cetrorelix, Ganirelix and Teverelix are characterized by different amino acid structures which result in compound-specific differential potencies in inhibiting GnRH-mediated early signaling. Although their action may vary depending on cell type and GnRHR expression levels, Cetrorelix displays the highest efficacy in depleting intracellular Ca2+ and cAMP increase, while Teverelix has the lowest potency in depleting hormone-induced β-catenin activation and all three antagonists show similar effects on phospho-protein activation. Nevertheless, biased signaling demonstrated between the antagonists at earlier endpoints suggests that structure-specific features of GnRH antagonists are linked to LiSS behavior. However, these differences observed in intracellular signaling cascades are not reflected in compound-specific inhibition of the Lhb gene transcription, a final physiological result of GnRH signaling in gonadotrope cells, as all three antagonists had equivalent effects. These data provide a molecular basis for evaluating whether GnRH antagonists, used for depleting the production of pituitary gonadotropins, are linked to potentially different clinical outcomes which may be relevant for the clinical use of these drugs and future development of similar analogues.

Supplementary Materials

Supplementary materials can be found at https://www.mdpi.com/1422-0067/20/22/5548/s1.

Author Contributions

Conceptualization, S.S., S.L. (Salvatore Longobardi), R.P.M., M.S., C.L. and L.C.; Methodology, S.S., S.L. (Silvia Limoncella), C.L., E.P., L.R., S.T., I.F. and J.B.; Validation, S.S., S.Li., C.L., E.P., L.R., S.T., I.F., J.B., F.P. and L.C.; Formal Analysis, S.S and L.C.; Investigation, S.S., S.L. (Silvia Limoncella), C.L., E.P., L.R., S.T., I.F., J.B. and L.C.; Resources, J.B., C.P., R.P.M., M.S., C.L.N. and L.C.; Data Curation, S.S., J.B., C.P., F.P., R.P.M., M.S., C.L.N. and L.C.; Writing—Original Draft Preparation, S.S. and L.C.; Writing—Review and Editing, L.C., S.L. (Salvatore Longobardi), R.P.M., M.S. and C.L.N.; Visualization, L.C.; Supervision, L.C., C.P., R.P.M., M.S. and C.L.N.; Project Administration, L.C.; Funding Acquisition, M.S., L.C. All authors listed have approved the submitted version, agree to be personally accountable for the author’s own contributions and for ensuring that questions related to the accuracy or integrity of the study are appropriately investigated, resolved, and documented in the literature.

Funding

This research was funded by European Union’s Skłodowska-Curie grant No 665790.

Acknowledgments

This study was supported by the Italian Ministry of University and Research by the “Departments of Excellence Programme” granted to the Department of Biomedical, Metabolic and Neural Sciences (University of Modena and Reggio Emilia (Italy). Manuela Simoni, is a LE STUDIUM RESEARCH FELLOW, Loire Valley Institute for Advanced Studies, Orléans & Tours, France,—INRA—Centre Val de Loire, 37380 Nouzilly, France, receiving funding from the European Union’s Horizon 2020 research and innovation programme under the Marie Skłodowska-Curie grant agreement No 665790. Authors thank Merck KGaA for supporting the study.

Conflicts of Interest

The authors declare no conflict of interest.

References

  1. McArdle, C.A. Gonadotropin-releasing hormone receptor signaling: Biased and unbiased. Mini Rev. Med. Chem. 2012, 12, 841–850. [Google Scholar] [CrossRef]
  2. Naor, Z. Signaling by G-protein-coupled receptor (GPCR): Studies on the GnRH receptor. Front. Neuroendocr. 2009, 30, 10–29. [Google Scholar] [CrossRef]
  3. Pawson, A.J.; McNeilly, A.S. The pituitary effects of GnRH. Anim. Reprod. Sci. 2005, 88, 75–94. [Google Scholar] [CrossRef]
  4. Kaiser, U.B. Studies of Gonadotropin-Releasing Hormone (GnRH) Action Using GnRH Receptor-Expressing Pituitary Cell Lines. Endocr. Rev. 1997, 18, 46–70. [Google Scholar] [CrossRef] [PubMed]
  5. Millar, R.P.; Lu, Z.L.; Pawson, A.J.; Flanagan, C.A.; Morgan, K.; Maudsley, S.R. Gonadotropin-Releasing Hormone Receptors. Endocr. Rev. 2004, 25, 235–275. [Google Scholar] [CrossRef] [PubMed] [Green Version]
  6. Grosse, R.; Schmid, A.; Schöneberg, T.; Herrlich, A.; Muhn, P.; Schultz, G.; Gudermann, T. Gonadotropin-releasing hormone receptor initiates multiple signaling pathways by exclusively coupling to G(q/11) proteins. J. Boil. Chem. 2000, 275, 9193–9200. [Google Scholar] [CrossRef] [PubMed]
  7. Mulvaney, J.M. Divergent Signaling Pathways Requiring Discrete Calcium Signals Mediate Concurrent Activation of Two Mitogen-activated Protein Kinases by Gonadotropin-releasing Hormone. J. Boil. Chem. 2000, 275, 14182–14189. [Google Scholar] [CrossRef] [PubMed] [Green Version]
  8. Dobkin-Bekman, M.; Naidich, M.; Pawson, A.J.; Millar, R.P.; Seger, R.; Naor, Z. Activation of Mitogen-activated protein kinase (MAPK) by GnRH is cell-context dependent. Mol. Cell. Endocrinol. 2006, 252, 184–190. [Google Scholar] [CrossRef]
  9. Neves, S.R.; Ram, P.T.; Iyengar, R. G protein pathways. Science 2002, 296, 1636–1639. [Google Scholar] [CrossRef]
  10. Naor, Z.; Benard, O.; Seger, R. Activation of MAPK cascades by G-protein-coupled receptors: The case of gonadotropin-releasing hormone receptor. Trends Endocrinol. Metab. 2000, 11, 91–99. [Google Scholar] [CrossRef]
  11. Bonfil, D.; Chuderland, D.; Kraus, S.; Shahbazian, D.; Friedberg, I.; Seger, R.; Naor, Z. Extracellular signal-regulated kinase, Jun N-terminal kinase, p38, and c-Src are involved in gonadotropin-releasing hormone-stimulated activity of the glycoprotein hormone follicle-stimulating hormone beta-subunit promoter. Endocrinology 2004, 145, 2228–2244. [Google Scholar] [CrossRef] [PubMed]
  12. Tsutsumi, R.; Mistry, D.; Webster, N.J.G. Signaling Responses to Pulsatile Gonadotropin-releasing Hormone in LbetaT2 Gonadotrope Cells. J. Boil. Chem. 2010, 285, 20262–20272. [Google Scholar] [CrossRef] [PubMed]
  13. Liu, F.; Usui, I.; Evans, L.G.; Austin, D.A.; Mellon, P.L.; Olefsky, J.M.; Webster, N.J.G. Involvement of Both G q/11 and G s Proteins in Gonadotropin-releasing Hormone Receptor-mediated Signaling in LβT2 Cells. J. Biol. Chem. 2002, 277, 32099–32108. [Google Scholar] [CrossRef]
  14. Perrett, R.M.; McArdle, C.A. Molecular Mechanisms of Gonadotropin-Releasing Hormone Signaling: Integrating Cyclic Nucleotides into the Network. Front. Endocrinol. 2013, 4, 4. [Google Scholar] [CrossRef]
  15. Maudsley, S.; Davidson, L.; Pawson, A.J.; Chan, R.; López de Maturana, R.; Millar, R.P. Gonadotropin-releasing hormone (GnRH) antagonists promote proapoptotic signaling in peripheral reproductive tumor cells by activating a Galphai-coupling state of the type I GnRH receptor. Cancer Res. 2004, 64, 7533–7544. [Google Scholar] [CrossRef]
  16. Naor, Z.; Huhtaniemi, I. Interactions of the GnRH receptor with heterotrimeric G proteins. Front. Neuroendocr. 2013, 34, 88–94. [Google Scholar] [CrossRef]
  17. Larivière, S.; Garrel, G.; Simon, V.; Soh, J.W.; Laverrière, J.N.; Counis, R.; Cohen-Tannoudji, J. Gonadotropin-releasing hormone couples to 3′,5′-cyclic adenosine-5′-monophosphate pathway through novel protein kinase Cdelta and -epsilon in LbetaT2 gonadotrope cells. Endocrinology 2007, 148, 1099–1107. [Google Scholar] [CrossRef]
  18. Thompson, I.R.; Kaiser, U.B. GnRH pulse frequency-dependent differential regulation of LH and FSH gene expression. Mol. Cell. Endocrinol. 2014, 385, 28–35. [Google Scholar] [CrossRef]
  19. Gardner, S.; Maudsley, S.; Millar, R.P.; Pawson, A.J. Nuclear stabilization of beta-catenin and inactivation of glycogen synthase kinase-3beta by gonadotropin-releasing hormone: Targeting Wnt signaling in the pituitary gonadotrope. Mol. Endocrinol. 2007, 21, 3028–3038. [Google Scholar] [CrossRef]
  20. Salisbury, T.B.; Binder, A.K.; Nilson, J.H. Welcoming beta-catenin to the gonadotropin-releasing hormone transcriptional network in gonadotropes. Mol. Endocrinol. 2008, 22, 1295–1303. [Google Scholar] [CrossRef]
  21. Brembeck, F.H.; Rosário, M.; Birchmeier, W. Balancing cell adhesion and Wnt signaling, the key role of beta-catenin. Curr. Opin. Genet. Dev. 2006, 16, 51–59. [Google Scholar] [CrossRef] [PubMed]
  22. Nelson, W.J.; Nusse, R. Convergence of Wnt, beta-catenin, and cadherin pathways. Science 2004, 303, 1483–1487. [Google Scholar] [CrossRef] [PubMed]
  23. Moon, R.T.; Kohn, A.D.; De Ferrari, G.V.; Kaykas, A. WNT and beta-catenin signalling: Diseases and therapies. Nat. Rev. Genet. 2004, 5, 691–701. [Google Scholar] [CrossRef]
  24. Salisbury, T.B.; Binder, A.K.; Grammer, J.C.; Nilson, J.H. Maximal activity of the luteinizing hormone beta-subunit gene requires beta-catenin. Mol. Endocrinol. 2007, 21, 963–971. [Google Scholar] [CrossRef] [PubMed]
  25. Reissmann, T.; Felberbaum, R.; Diedrich, K.; Engel, J.; Comaru-Schally, A.M.; Schally, A.V. Endocrinology: Development and applications of luteinizing hormone-releasing hormone antagonists in the treatment of infertility: An overview. Hum. Reprod. 1995, 10, 1974–1981. [Google Scholar] [CrossRef]
  26. Millar, R.P.; Newton, C.L. Current and future applications of GnRH, kisspeptin and neurokinin B analogues. Nat. Rev. Endocrinol. 2013, 9, 451–466. [Google Scholar] [CrossRef] [Green Version]
  27. Engel, J.B.; Schally, A.V. Drug Insight: Clinical use of agonists and antagonists of luteinizing-hormone-releasing hormone. Nat. Clin. Pract. Endocrinol. Metab. 2007, 3, 157–167. [Google Scholar] [CrossRef]
  28. Emons, G.; Schally, A.V. The use of luteinizing hormone releasing hormone agonists and antagonists in gynaecological cancers. Hum. Reprod. 1994, 9, 1364–1379. [Google Scholar] [CrossRef]
  29. Wilcox, J.; Potter, D.; Moore, M.; Ferrande, L.; Kelly, E.; CAP IV Investigator Group. Prospective, randomized trial comparing cetrorelix acetate and ganirelix acetate in a programmed, flexible protocol for premature luteinizing hormone surge prevention in assisted reproductive technologies. Fertil. Steril. 2005, 84, 108–117. [Google Scholar] [CrossRef]
  30. Check, J.H.; Brasile, D.; Choe, J.K.; Amui, J.; Wilson, C. The effect of cetrorelix vs. ganirelix on pregnancy outcome using minimal gonadotropin stimulation in women with elevated day 3 serum follicle stimulating hormone levels. Clin. Exp. Obstet. Gynecol. 2009, 36, 148–149. [Google Scholar]
  31. Deghenghi, R.; Boutignon, F.; Wüthrich, P.; Lenaerts, V. Antarelix (EP 24332) a novel water soluble LHRH antagonist. Biomed. Pharmacother. 1993, 47, 107–110. [Google Scholar] [CrossRef]
  32. Erb, K.; Pechstein, B.; Schueler, A.; Engel, J.; Hermann, R. Pituitary and gonadal endocrine effects and pharmacokinetics of the novel luteinizing hormone-releasing hormone antagonist teverelix in healthy men-a first-dose-in-humans study. Clin. Pharmacol. Ther. 2000, 67, 660–669. [Google Scholar] [CrossRef] [PubMed]
  33. Gianotti, L.; Veldhuis, J.D.; Destefanis, S.; Lanfranco, F.; Ramunni, J.; Arvat, E.; Marzetto, M.; Boutignon, F.; Deghenghi, R.; Ghigo, E. Suppression and recovery of LH secretion by a potent and selective GnRH-receptor antagonist peptide in healthy early follicular-phase women are mediated via selective control of LH secretory burst mass. Clin. Endocrinol. 2003, 59, 526–532. [Google Scholar] [CrossRef]
  34. Millar, R.P.; Pawson, A.J.; Morgan, K.; Rissman, E.F.; Lu, Z.L. Diversity of actions of GnRHs mediated by ligand-induced selective signaling. Front. Neuroendocrinol. 2008, 29, 17–35. [Google Scholar] [CrossRef] [Green Version]
  35. Turgeon, J.L. Steroid and pulsatile gonadotropin-releasing hormone (GnRH) regulation of luteinizing hormone and GnRH receptor in a novel gonadotrope cell line. Mol. Endocrinol. 1996, 10, 439–450. [Google Scholar]
  36. Wilson, A.C.; Salamat, M.S.; Haasl, R.J.; Roche, K.M.; Karande, A.; Meethal, S.V.; Terasawa, E.; Bowen, R.L.; Atwood, C.S. Human neurons express type I GnRH receptor and respond to GnRH I by increasing luteinizing hormone expression. J. Endocrinol. 2004, 191, 651–663. [Google Scholar] [CrossRef]
  37. Huirne, J.A.; Lambalk, C.B. Gonadotropin-releasing-hormone-receptor antagonists. Lancet 2001, 358, 1793–1803. [Google Scholar] [CrossRef]
  38. Sealfon, S.C.; Weinstein, H.; Millar, R.P. Molecular Mechanisms of Ligand Interaction with the Gonadotropin-Releasing Hormone Receptor. Endocr. Rev. 1997, 18, 180–205. [Google Scholar] [CrossRef]
  39. Barran, P.E.; Roeske, R.W.; Pawson, A.J.; Sellar, R.; Bowers, M.T.; Morgan, K.; Lu, Z.L.; Tsuda, M.; Kusakabe, T.; Millar, R.P. Evolution of Constrained Gonadotropin-releasing Hormone Ligand Conformation and Receptor Selectivity. J. Boil. Chem. 2005, 280, 38569–38575. [Google Scholar] [CrossRef] [Green Version]
  40. Stojilkovic, S.S.; Bjelobaba, I.; Zemkova, H. Ion Channels of Pituitary Gonadotrophs and Their Roles in Signaling and Secretion. Front. Endocrinol. 2017, 8, 126. [Google Scholar] [CrossRef]
  41. Merelli, F.; Stojilkovic, S.S.; Iida, T.; Krsmanovic, L.Z.; Zheng, L.; Mellon, P.L.; Catt, K.J. Gonadotropin-releasing hormone-induced calcium signaling in clonal pituitary gonadotrophs. Endocrinology 1992, 131, 925–932. [Google Scholar] [PubMed]
  42. Durán-Pastén, M.L.; Fiordelisio, T. GnRH-Induced Ca2+ Signaling Patterns and Gonadotropin Secretion in Pituitary Gonadotrophs. Functional Adaptations to Both Ordinary and Extraordinary Physiological Demands. Front. Endocrinol. 2013, 4, 127. [Google Scholar] [CrossRef]
  43. Naor, Z.; Capponi, A.M.; Rossier, M.F.; Ayalon, D.; Limor, R. Gonadotropin-Releasing Hormone- Induced Rise in Cytosolic Free Ca2+ Levels: Mobilization of Cellular and Extracellular Ca2+ Pools and Relationship to Gonadotropin Secretion. Mol. Endocrinol. 1988, 2, 512–520. [Google Scholar] [CrossRef] [PubMed]
  44. Kawaminami, M.; Uematsu, N.; Funahashi, K.; Kokubun, R.; Kurusu, S. Gonadotropin releasing hormone (GnRH) enhances annexin A5 mRNA expression through mitogen activated protein kinase (MAPK) in LbetaT2 pituitary gonadotrope cells. Endocr. J. 2008, 55, 1005–1014. [Google Scholar] [CrossRef] [PubMed]
  45. Miles, L.E.C.; Hanyaloglu, A.C.; Dromey, J.R.; Pfleger, K.D.G.; Eidne, K.A. Gonadotropin-releasing hormone receptor-mediated growth suppression of immortalized LbetaT2 gonadotrope and stable HEK293 cell lines. Endocrinology 2004, 145, 194–204. [Google Scholar] [CrossRef]
  46. Maiti, K.; Oh, D.Y.; Moon, J.S.; Acharjee, S.; Li, J.H.; Bai, D.G.; Park, H.S.; Lee, K.; Lee, Y.C.; Jung, N.C.; et al. Differential Effects of Gonadotropin-Releasing Hormone (GnRH)-I and GnRH-II on Prostate Cancer Cell Signaling and Death. J. Clin. Endocrinol. Metab. 2005, 90, 4287–4298. [Google Scholar] [CrossRef] [Green Version]
  47. Knollman, P.E.; Conn, P.M. Multiple G proteins compete for binding with the human gonadotropin releasing hormone receptor. Arch. Biochem. Biophys. 2008, 477, 92–97. [Google Scholar] [CrossRef] [Green Version]
  48. Oh, D.Y.; Song, J.A.; Moon, J.S.; Moon, M.J.; Kim, J.I.; Kim, K.; Seong, J.Y. Membrane-Proximal Region of the Carboxyl Terminus of the Gonadotropin-Releasing Hormone Receptor (GnRHR) Confers Differential Signal Transduction between Mammalian and Nonmammalian GnRHRs. Mol. Endocrinol. 2005, 19, 722–731. [Google Scholar] [CrossRef] [Green Version]
  49. Hanyaloglu, A.C.; Vrecl, M.; Kroeger, K.M.; Miles, L.E.C.; Qian, H.; Thomas, W.G.; Eidne, K.A. Casein Kinase II Sites in the Intracellular C-terminal Domain of the Thyrotropin-releasing Hormone Receptor and Chimeric Gonadotropin-releasing Hormone Receptors Contribute to β-Arrestin-dependent Internalization. J. Boil. Chem. 2001, 276, 18066–18074. [Google Scholar] [CrossRef]
  50. Avet, C.; Garrel, G.; Denoyelle, C.; Laverrière, J.N.; Counis, R.; Cohen-Tannoudji, J.; Simon, V. SET Protein Interacts with Intracellular Domains of the Gonadotropin-releasing Hormone Receptor and Differentially Regulates Receptor Signaling to cAMP and Calcium in Gonadotrope Cells. J. Biol. Chem. 2013, 288, 2641–2654. [Google Scholar] [CrossRef] [Green Version]
  51. Steen, A.; Larsen, O.; Thiele, S.; Rosenkilde, M.M. Biased and G Protein-Independent Signaling of Chemokine Receptors. Front. Immunol. 2014, 5, 277. [Google Scholar] [CrossRef] [PubMed] [Green Version]
  52. Thompson, I.R.; Ciccone, N.A.; Zhou, Q.; Xu, S.; Khogeer, A.; Carroll, R.S.; Kaiser, U.B. GnRH Pulse Frequency Control of Fshb Gene Expression Is Mediated via ERK1/2 Regulation of ICER. Mol. Endocrinol. 2016, 30, 348–360. [Google Scholar] [CrossRef] [PubMed] [Green Version]
  53. Mayer, S.I.; Dexheimer, V.; Nishida, E.; Kitajima, S.; Thiel, G. Expression of the Transcriptional Repressor ATF3 in Gonadotrophs Is Regulated by Egr-1, CREB, and ATF2 after Gonadotropin-Releasing Hormone Receptor Stimulation. Endocrinology 2008, 149, 6311–6325. [Google Scholar] [CrossRef] [PubMed] [Green Version]
  54. Son, Y.L.; Ubuka, T.; Millar, R.P.; Kanasaki, H.; Tsutsui, K. Gonadotropin-Inhibitory Hormone Inhibits GnRH-Induced Gonadotropin Subunit Gene Transcriptions by Inhibiting AC/cAMP/PKA-Dependent ERK Pathway in LβT2 Cells. Endocrinology 2012, 153, 2332–2343. [Google Scholar] [CrossRef]
  55. Gardner, S.; Stavrou, E.; Rischitor, P.E.; Faccenda, E.; Pawson, A.J. Targeting mediators of Wnt signalling pathways by GnRH in gonadotropes. J. Mol. Endocrinol. 2010, 44, 195–201. [Google Scholar] [CrossRef] [Green Version]
  56. Riccetti, L.; Klett, D.; Ayoub, M.A.; Boulo, T.; Pignatti, E.; Tagliavini, S.; Varani, M.; Trenti, T.; Nicoli, A.; Capodanno, F.; et al. Heterogeneous hCG and hMG commercial preparations result in different intracellular signalling but induce a similar long-term progesterone response in vitro. Mol. Hum. Reprod. 2017, 23, 685–697. [Google Scholar] [CrossRef] [Green Version]
  57. Riccetti, L.; De Pascali, F.; Gilioli, L.; Potì, F.; Giva, L.B.; Marino, M.; Tagliavini, S.; Trenti, T.; Fanelli, F.; Mezzullo, M.; et al. Human LH and hCG stimulate differently the early signalling pathways but result in equal testosterone synthesis in mouse Leydig cells in vitro. Reprod. Boil. Endocrinol. 2017, 15, 2. [Google Scholar] [CrossRef]
  58. Tello, J.A.; Newton, C.L.; Bouligand, J.; Guiochon-Mantel, A.; Millar, R.P.; Young, J. Congenital Hypogonadotropic Hypogonadism Due to GNRH Receptor Mutations in Three Brothers Reveal Sites Affecting Conformation and Coupling. PLoS ONE 2012, 7, e38456. [Google Scholar] [CrossRef]
  59. Ayoub, M.A.; Landomiel, F.; Gallay, N.; Jégot, G.; Poupon, A.; Crépieux, P.; Reiter, E. Assessing Gonadotropin Receptor Function by Resonance Energy Transfer-Based Assays. Front. Endocrinol. 2015, 6, 130. [Google Scholar] [CrossRef] [Green Version]
  60. Riccetti, L.; Yvinec, R.; Klett, D.; Gallay, N.; Combarnous, Y.; Reiter, E.; Simoni, M.; Casarini, L.; Ayoub, M.A. Human Luteinizing Hormone and Chorionic Gonadotropin Display Biased Agonism at the LH and LH/CG Receptors. Sci. Rep. 2017, 7, 940. [Google Scholar] [CrossRef]
  61. Lazzaretti, C.; Riccetti, L.; Sperduti, S.; Anzivino, C.; Brigante, G.; De Pascali, F.; Potì, F.; Rovei, V.; Restagno, G.; Mari, C.; et al. Inferring biallelism of two FSH receptor mutations associated with spontaneous ovarian hyperstimulation syndrome by evaluating FSH, LH and HCG cross-activity. Reprod. Biomed. Online 2019, 38, 816–824. [Google Scholar] [CrossRef] [PubMed]
  62. Casarini, L.; Riccetti, L.; Limoncella, S.; Lazzaretti, C.; Barbagallo, F.; Pacifico, S.; Guerrini, R.; Tagliavini, S.; Trenti, T.; Simoni, M.; et al. Probing the Effect of Sildenafil on Progesterone and Testosterone Production by an Intracellular FRET/BRET Combined Approach. Biochemistry 2019, 58, 799–808. [Google Scholar] [CrossRef] [PubMed]
  63. Brigante, G.; Riccetti, L.; Lazzaretti, C.; Rofrano, L.; Sperduti, S.; Potì, F.; Diazzi, C.; Prodam, F.; Guaraldi, G.; Lania, A.G.; et al. Abacavir, nevirapine, and ritonavir modulate intracellular calcium levels without affecting GHRH-mediated growth hormone secretion in somatotropic cells in vitro. Mol. Cell. Endocrinol. 2019, 482, 37–44. [Google Scholar] [CrossRef] [PubMed]
  64. Jiang, L.I.; Collins, J.; Davis, R.; Lin, K.M.; DeCamp, D.; Roach, T.; Hsueh, R.; Rebres, R.A.; Ross, E.M.; Taussig, R.; et al. Use of a cAMP BRET sensor to characterize a novel regulation of cAMP by the sphingosine 1-phosphate/G13 pathway. J. Boil. Chem. 2007, 282, 10576–10584. [Google Scholar] [CrossRef]
  65. Casarini, L.; Reiter, E.; Simoni, M. β-arrestins regulate gonadotropin receptor-mediated cell proliferation and apoptosis by controlling different FSHR or LHCGR intracellular signaling in the hGL5 cell line. Mol. Cell. Endocrinol. 2016, 437, 11–21. [Google Scholar] [CrossRef]
  66. Casarini, L.; Riccetti, L.; De Pascali, F.; Gilioli, L.; Marino, M.; Vecchi, E.; Morini, D.; Nicoli, A.; La Sala, G.B.; Simoni, M. Estrogen Modulates Specific Life and Death Signals Induced by LH and hCG in Human Primary Granulosa Cells In Vitro. Int. J. Mol. Sci. 2017, 18, 926. [Google Scholar] [CrossRef]
  67. Collins, T.J. ImageJ for microscopy. Biotechniques 2007, 43, 25–30. [Google Scholar] [CrossRef]
  68. Bennett, C.N.; Ross, S.E.; Longo, K.A.; Bajnok, L.; Hemati, N.; Johnson, K.W.; Harrison, S.D.; MacDougald, O. Regulation of Wnt Signaling during Adipogenesis. J. Boil. Chem. 2002, 277, 30998–31004. [Google Scholar] [CrossRef] [Green Version]
  69. Livak, K.J.; Schmittgen, T.D. Analysis of Relative Gene Expression Data Using Real- Time Quantitative PCR and the 2(-Delta Delta C(T)) Method. Methods 2001, 25, 402–408. [Google Scholar] [CrossRef]
Figure 1. Amino acid sequence of mammalian gonadotropin releasing hormone (GnRH) and antagonists. Substitution of amino acids at position 6 (orange) by D-amino acids increases binding affinity and decreases metabolic clearance, resulting in increased activity of the compound. The COOH-terminal domain (Arg-Pro-Gly-NH2 group; green) is involved in receptor binding, while the NH2-terminal domain (pGlu-His-Trp; blue) is involved in both the receptor binding and activation. Amino acid substitutions falling within the C-terminal region produce antagonists and are indicated by the multiple letter code. The image is adapted from Millar et al. [5].
Ijms 20 05548 g001
Figure 2. Analysis of the kinetics of GnRH-induced intracellular Ca2+ increase, in HEK293/GnRHR cells, in the presence or in the absence of GnRH and antagonists. (A) Ca2+ BRET biosensor signal was measured over 150 s and the arrow indicates the GnRH injection (pM–µM range) that occurred at the 20 s time-point. AUCs were calculated from kinetic data and represented as means ± SEM. The dose-response curve was obtained by interpolating means of AUC data using non-linear regression (EC50 = 23.26 ± 3.37 nM; means ± SEM; n = 3). (B) Kinetics of 3 × EC50 GnRH-induced intracellular Ca2+ increase, in the presence or in the absence of 10 nM Cetrorelix, Ganirelix and Teverelix. Light emissions are represented in the X-Y graph as means ± SEM and consecutive points were connected by lines. AUC of antagonists were calculated and statistically compared (Cetrorelix AUC = 21,482 ± 6718; Ganirelix AUC = 73,164 ± 16,237 *; Teverelix AUC = 74,321 ± 17,569 *; 3 × EC50 GnRH AUC = 109,340 ± 13,866 *; * = significantly different versus Cetrorelix AUC; Kruskal-Wallis test; p < 0.005; means ± SEM; n = 6).
Ijms 20 05548 g002
Figure 3. Evaluation of cAMP activation induced by GnRH, in the presence or in the absence of GnRH antagonists. (A) HEK293/GnRHR or (B) SH-SY5Y/GnRHR cells were maintained for 30 min with pM-µM GnRH concentrations, in the presence of 200 µM IBMX, as a phosphodiesterase enzymes inhibitor. AUC data are represented in the X-Y graph as means ± SEM and interpolated using non-linear regression. Dose-response curves obtained in the two cell models resulted in similar EC50s (HEK293/GnRHR = 11.58 ± 1.95 nM; n = 3; SH-SY5Y/GnRHR = 1.11 ± 4.05 nM; n = 5; Mann–Whitney U test; p ≥ 0.05; means ± SEM). (C,D) 3 × EC50 GnRH-induced cAMP inhibition by Cetrorelix, Ganirelix and Teverelix (pM–µM range), in (C) HEK293/GnRHR and (D) SH-SY5Y/GnRHR cells. cAMP data were interpolated by non-linear regression (not shown in panels C and D) and GnRH antagonist IC50s obtained in the two cell models were compared and found to be similar in HEK293/GnRHR cells (Cetrorelix = 0.84 ± 3.85 nM; Ganirelix = 0.61 ± 2.57 nM; Teverelix = 0.49 ± 3.21 nM; Mann–Whitney U test test; p ≥ 0.05; means ± SEM; n = 4), but not in SH-SY5Y/GnRHR cells (Cetrorelix = 1.56 ± 2.49 * nM; Ganirelix = 16.60 ± 3.76 nM; Teverelix = 62.80 ± 3.77 nM; * = significantly different versus Teverelix; Mann–Whitney U test; p < 0.05; means ± SEM; n = 5).
Ijms 20 05548 g003
Figure 4. GnRH-induced pERK1/2 and pCREB activation, and inhibition exerted by GnRH antagonists, in HEK293/GnRHR cells. (A) Cells were treated 15 min with increasing GnRH concentrations (pM–µM range) and the phosphorylation of ERK1/2 and CREB was evaluated by Western blotting. Untreated samples are used as negative controls, while samples treated by 1 nM PMA served as positive control. Total ERK was the loading control. Images are representative of three independent experiments. (B) Cetrorelix, Ganirelix and Teverelix dose-inhibition of 100 nM GnRH-induced pERK1/2 and pCREB activation. Images are representative of three independent experiments. (CF) Semi-quantitative evaluations of pCREB and pERK1/2 Western blotting signals displayed in panels A and B, by an image analysis software. Bars indicate means ± SEM (* = significantly different versus control; Kruskal-Wallis test; p < 0.05; n = 3).
Ijms 20 05548 g004
Figure 5. GnRH-induced β-catenin activation and inhibition by antagonists, in HEK293/GnRHR cells. Cells were treated for 1 h by 1 µM dose of GnRH, in the presence or in the absence of 1 µM GnRH antagonist, and immunostaining was performed in fixed samples using a primary antibody against the active-β-catenin and a Cy3-conjugated secondary antibody (red). DAPI was used for nuclei staining (blue). (A) Control samples maintained in the absence of hormone and GnRH antagonist (negative control). (B) Cells treated with GnRH alone, (C) Cells treated for 16 h with 100 nM of the glycogen synthase kinase 3 (GSK3) inhibitor CHIR99021 cells (positive controls for β-catenin activation). (DF) Cells treated with (D) both GnRH and Cetrorelix, (E) Ganirelixor and (F) Teverelix. Images are representative of three independent experiments. Bar = 50 µm.
Ijms 20 05548 g005
Figure 6. Lhβ gene expression induced by GnRH, in LβT2 cells. (A) Samples were treated for 24 h with increasing doses of GnRH (nM–µM range) and Lhb gene expression levels detected by real time PCR. Data were normalized to Gapdh gene expression levels and are presented as fold-increase over basal (unstimulated cells). (B) Results from real time PCR analysis of LβT2 cells treated with 1 µM GnRH in the presence of 1 µM of Cetrorelix Ganirelix or Teverelix antagonist. * = significantly different versus unstimulated; § = significantly different versus antagonists; Kruskal-Wallis test; p < 0.05; means ± SEM; n = 4.
Ijms 20 05548 g006
Table 1. GnRH-antagonist dose-dependent AUCs of the kinetics of intracellular Ca2+ response.
No Antagonist109,340 ± 13,866
CetrorelixGanirelixTeverelix
1 pM78,113 ± 29,97976,189 ± 18,56485,301 ± 21,321
10 pM124,981 ± 33,68491,896 ± 21,76698,939 ± 27,373
100 pM126,243 ± 34,982101,943 ± 27,38858,864 ± 27,101
1 nM71,127 ± 25,26866,665 ± 16,03581,702 ± 18,920
10 nM21,482 ± 6718 *73,164 ± 16,23774,321 ± 17,569
75 nM18,632 ± 4423 *43,870 ± 4193 *42,401 ± 8974 *
100 nM8946 ± 3296 *34,734 ± 13,731 *29,931 ± 8731 *
1 µM3264 ± 3024 *3346 ± 2977 *4107 ± 3804 *
Bold: Kruskal-Wallis test and Dunn’s post-test after correction for multiple comparisons (means ± SEM; p < 0.05; n = 6). * Significant versus no antagonist.

