Examination of Adsorption Orientation of Amyloidogenic Peptides Over Nano-Gold Colloidal Particle Surfaces


 ,
,
Abstract
:1. Introduction
2. Results
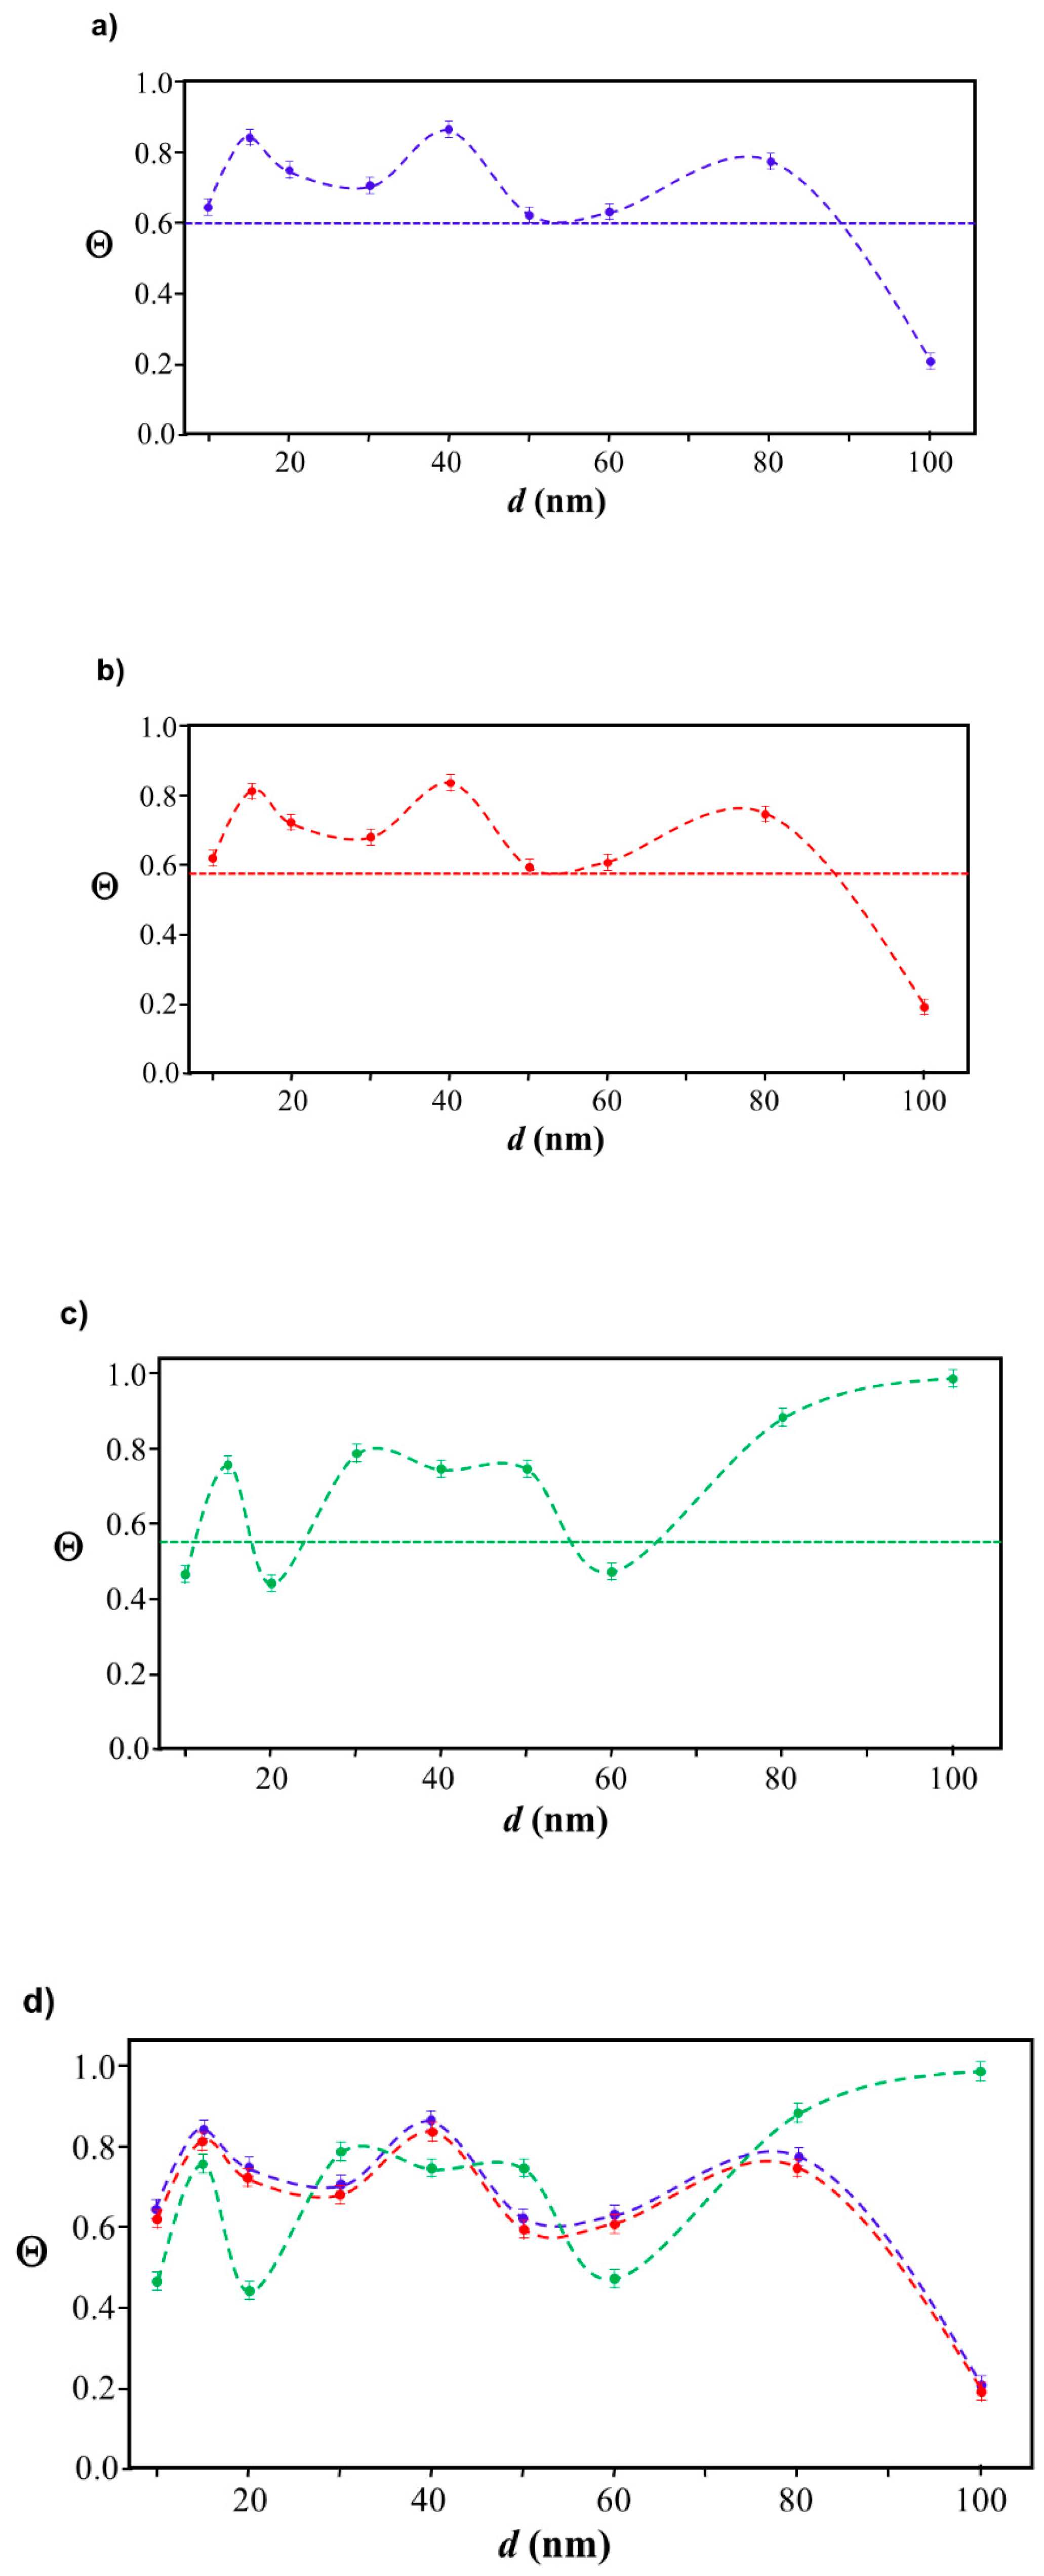
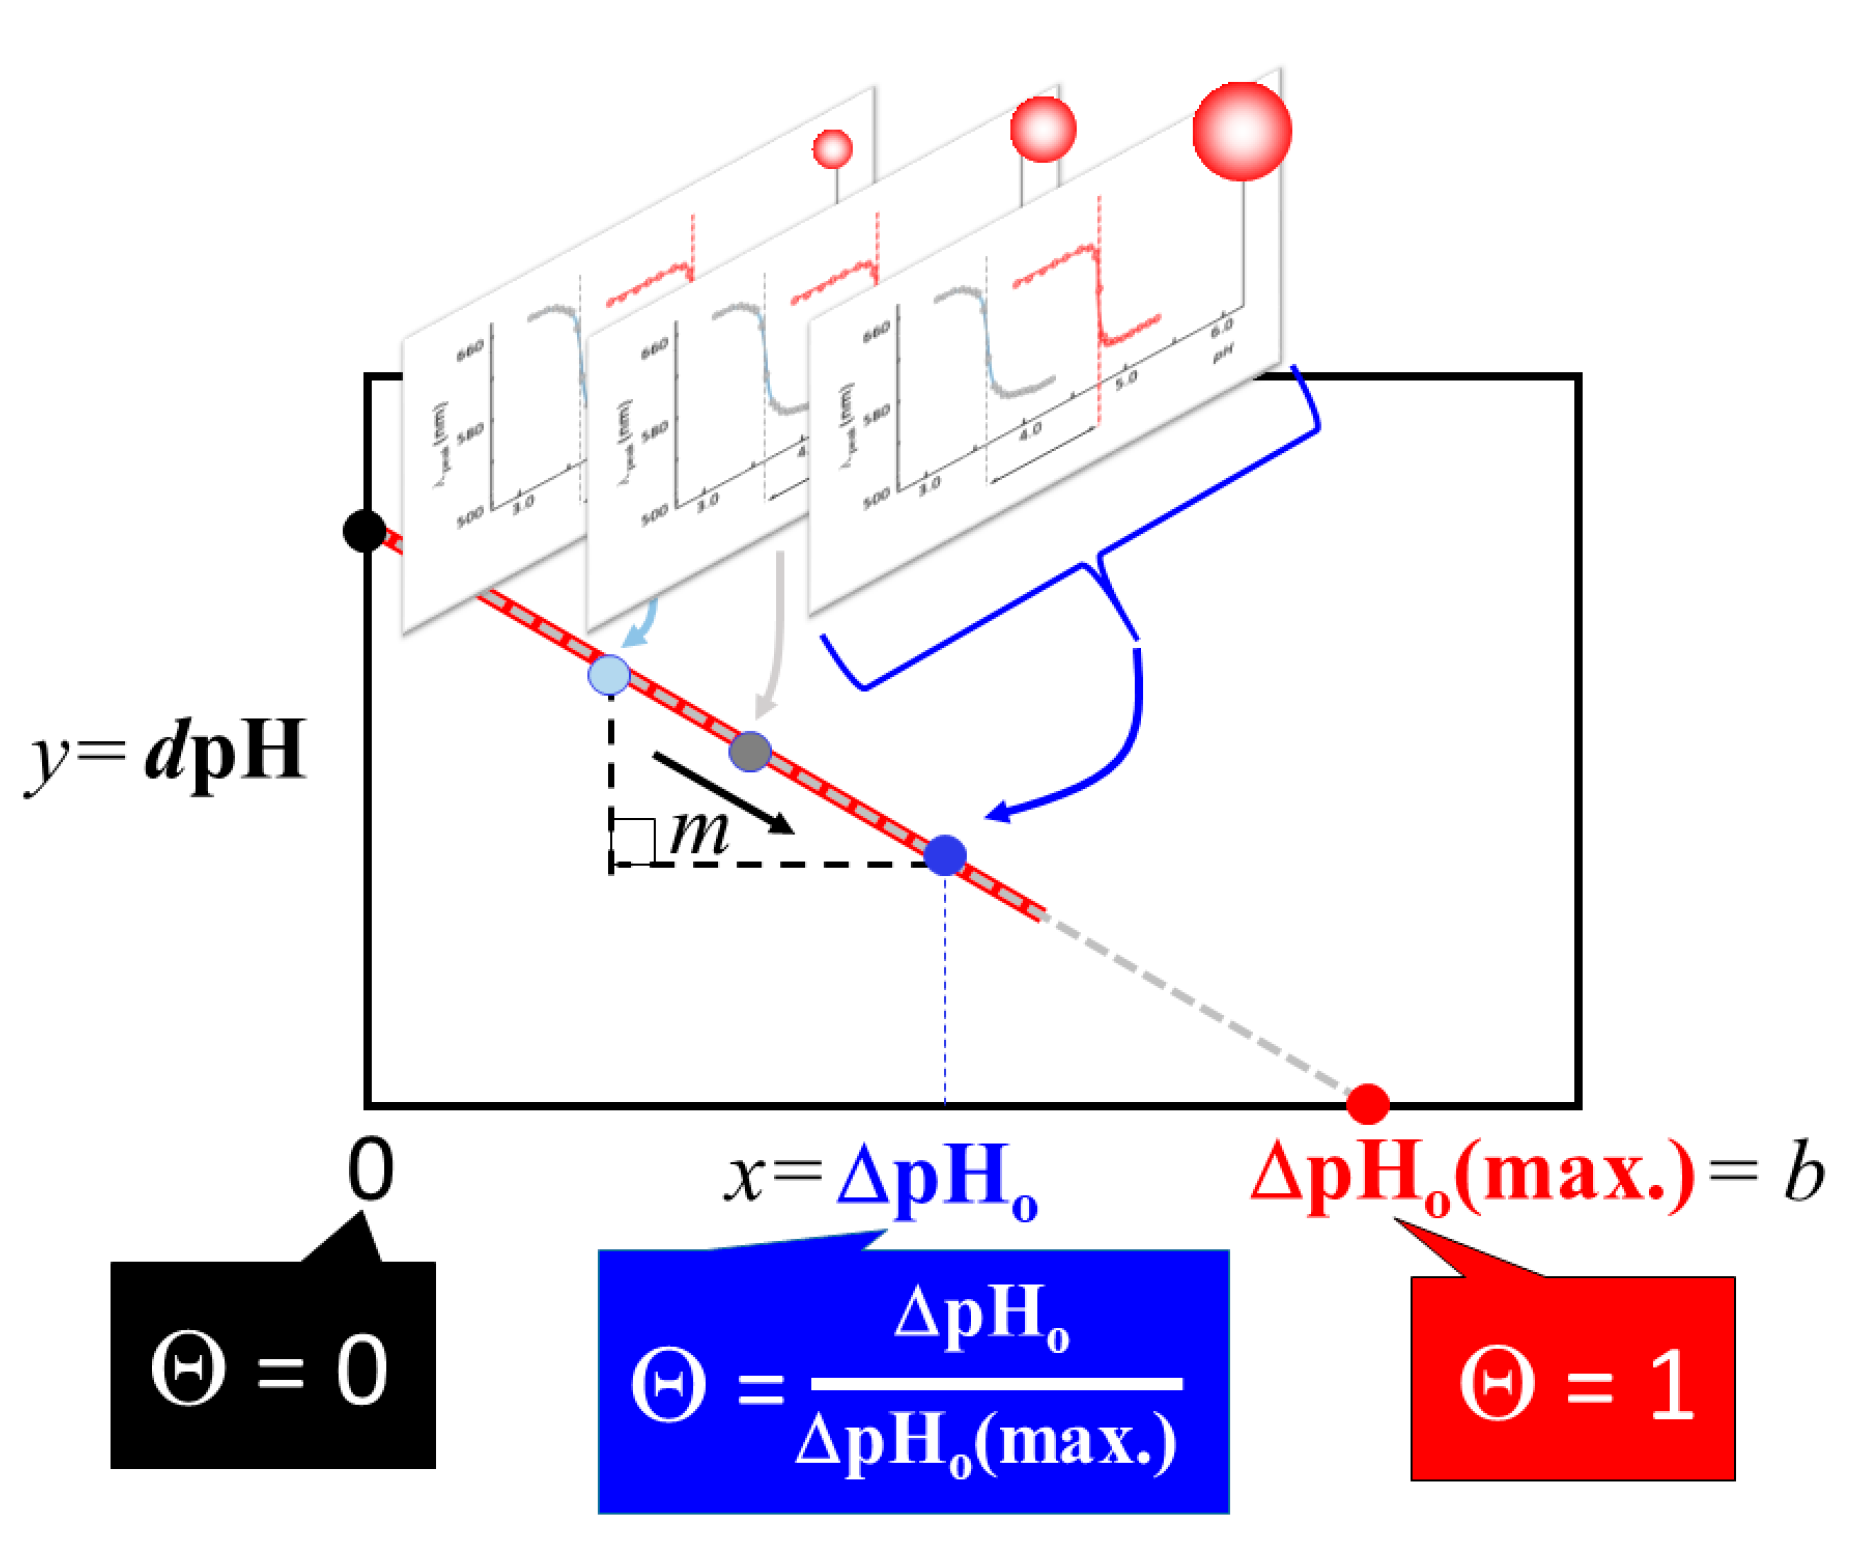
2.1. Extraction of Θ
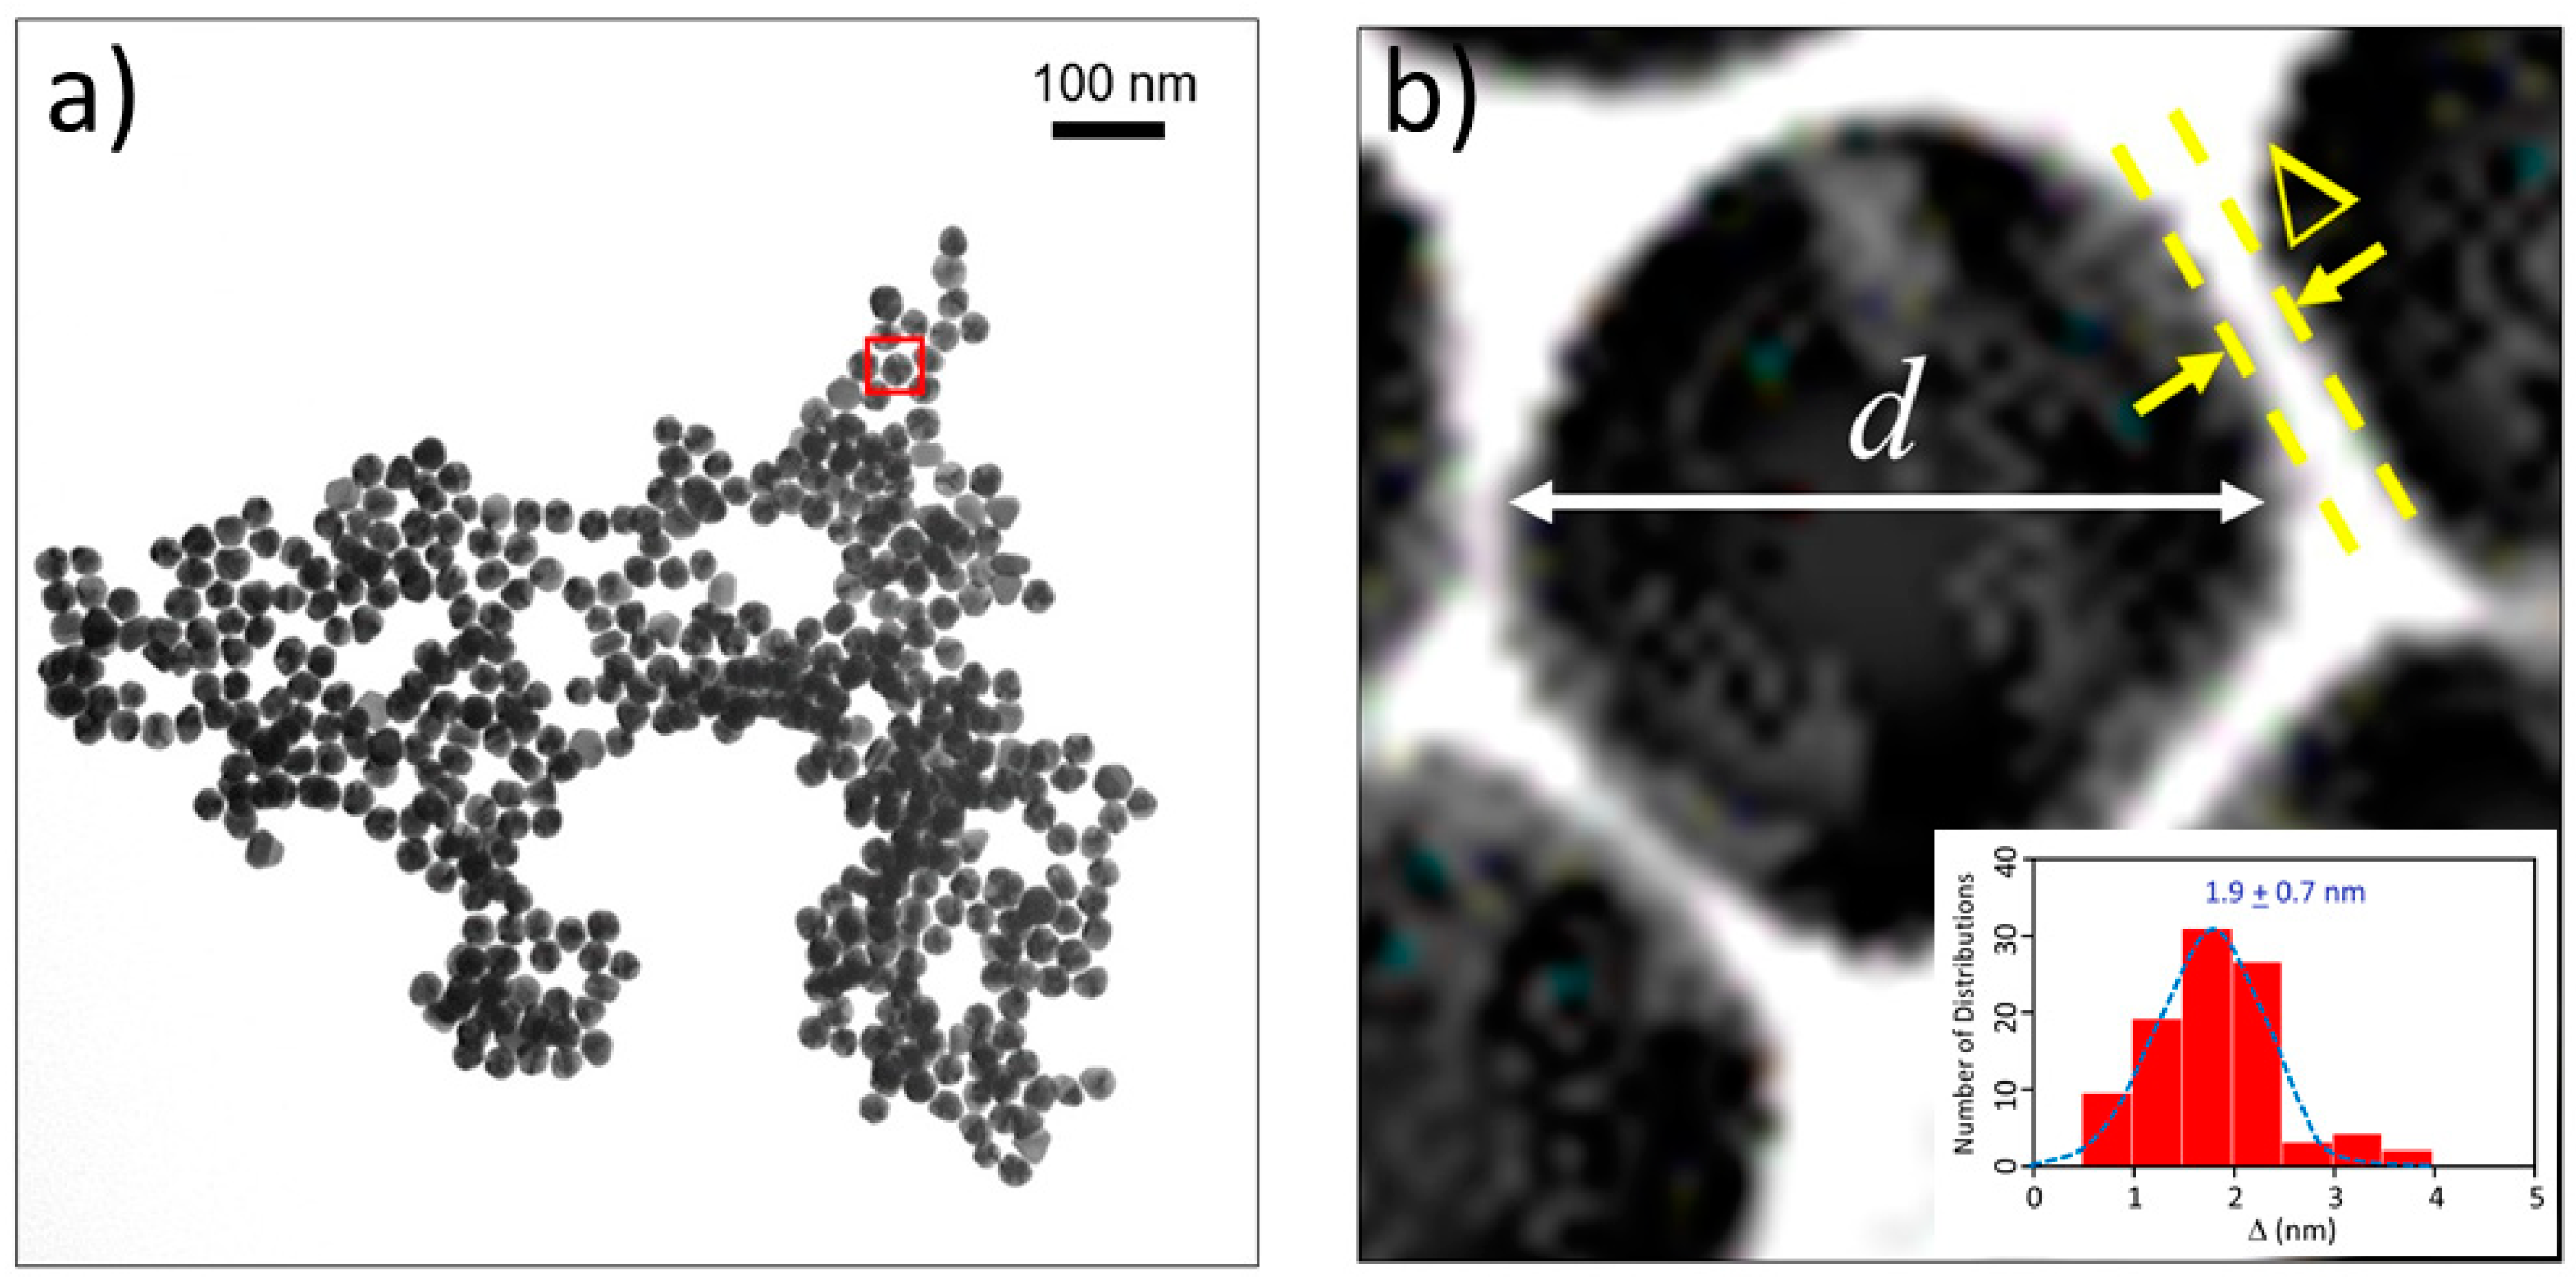
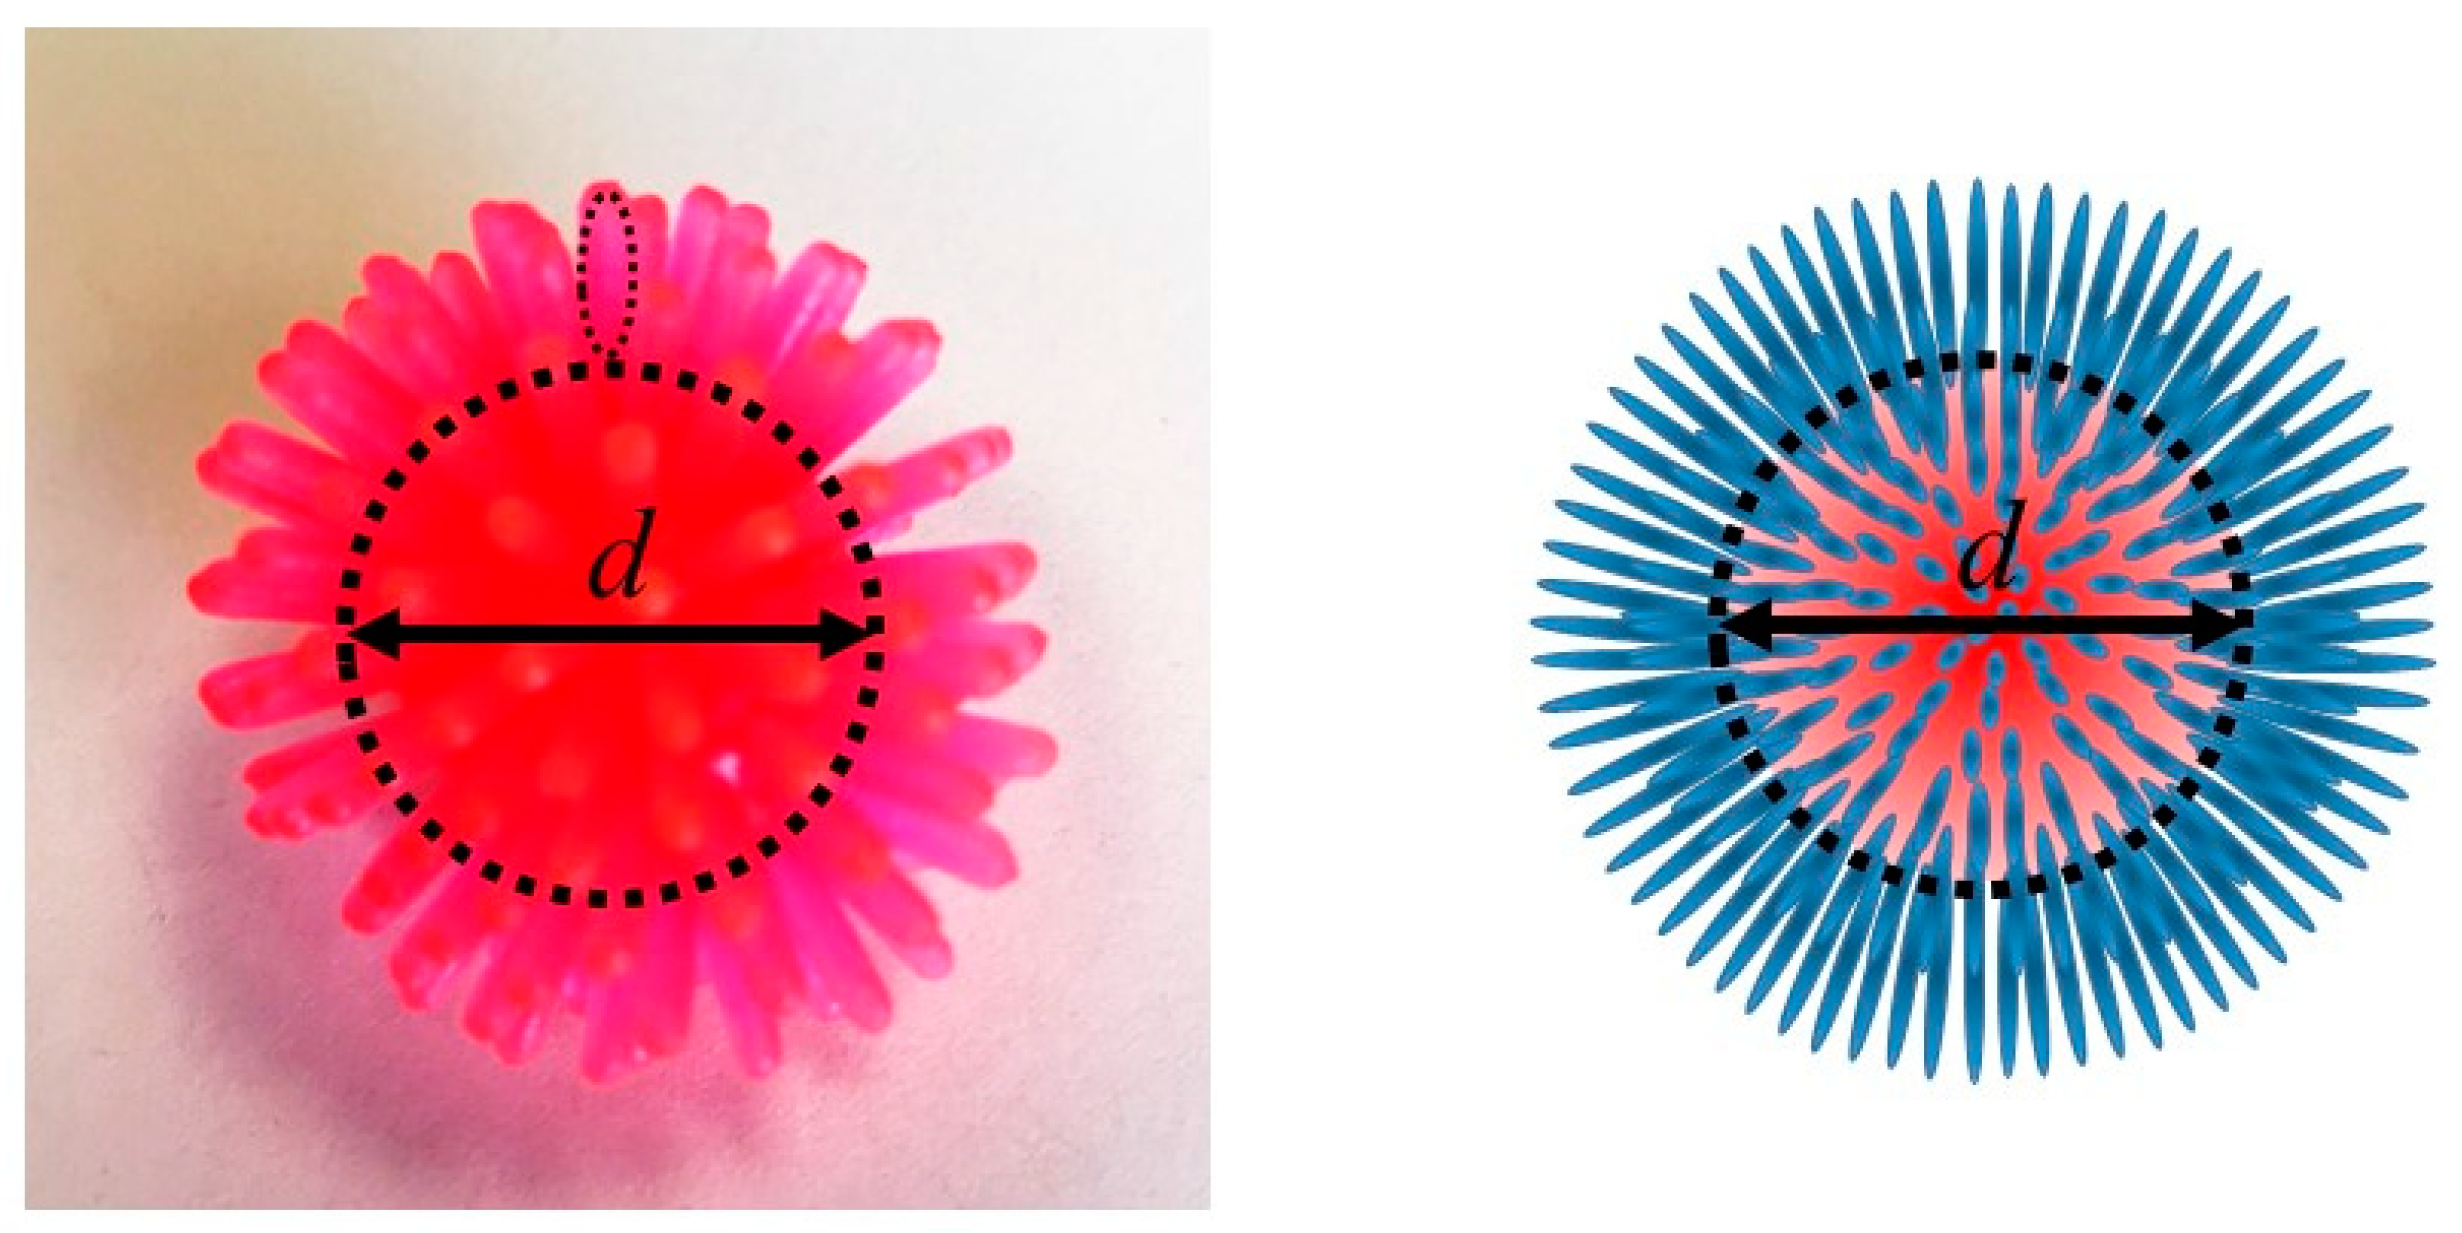
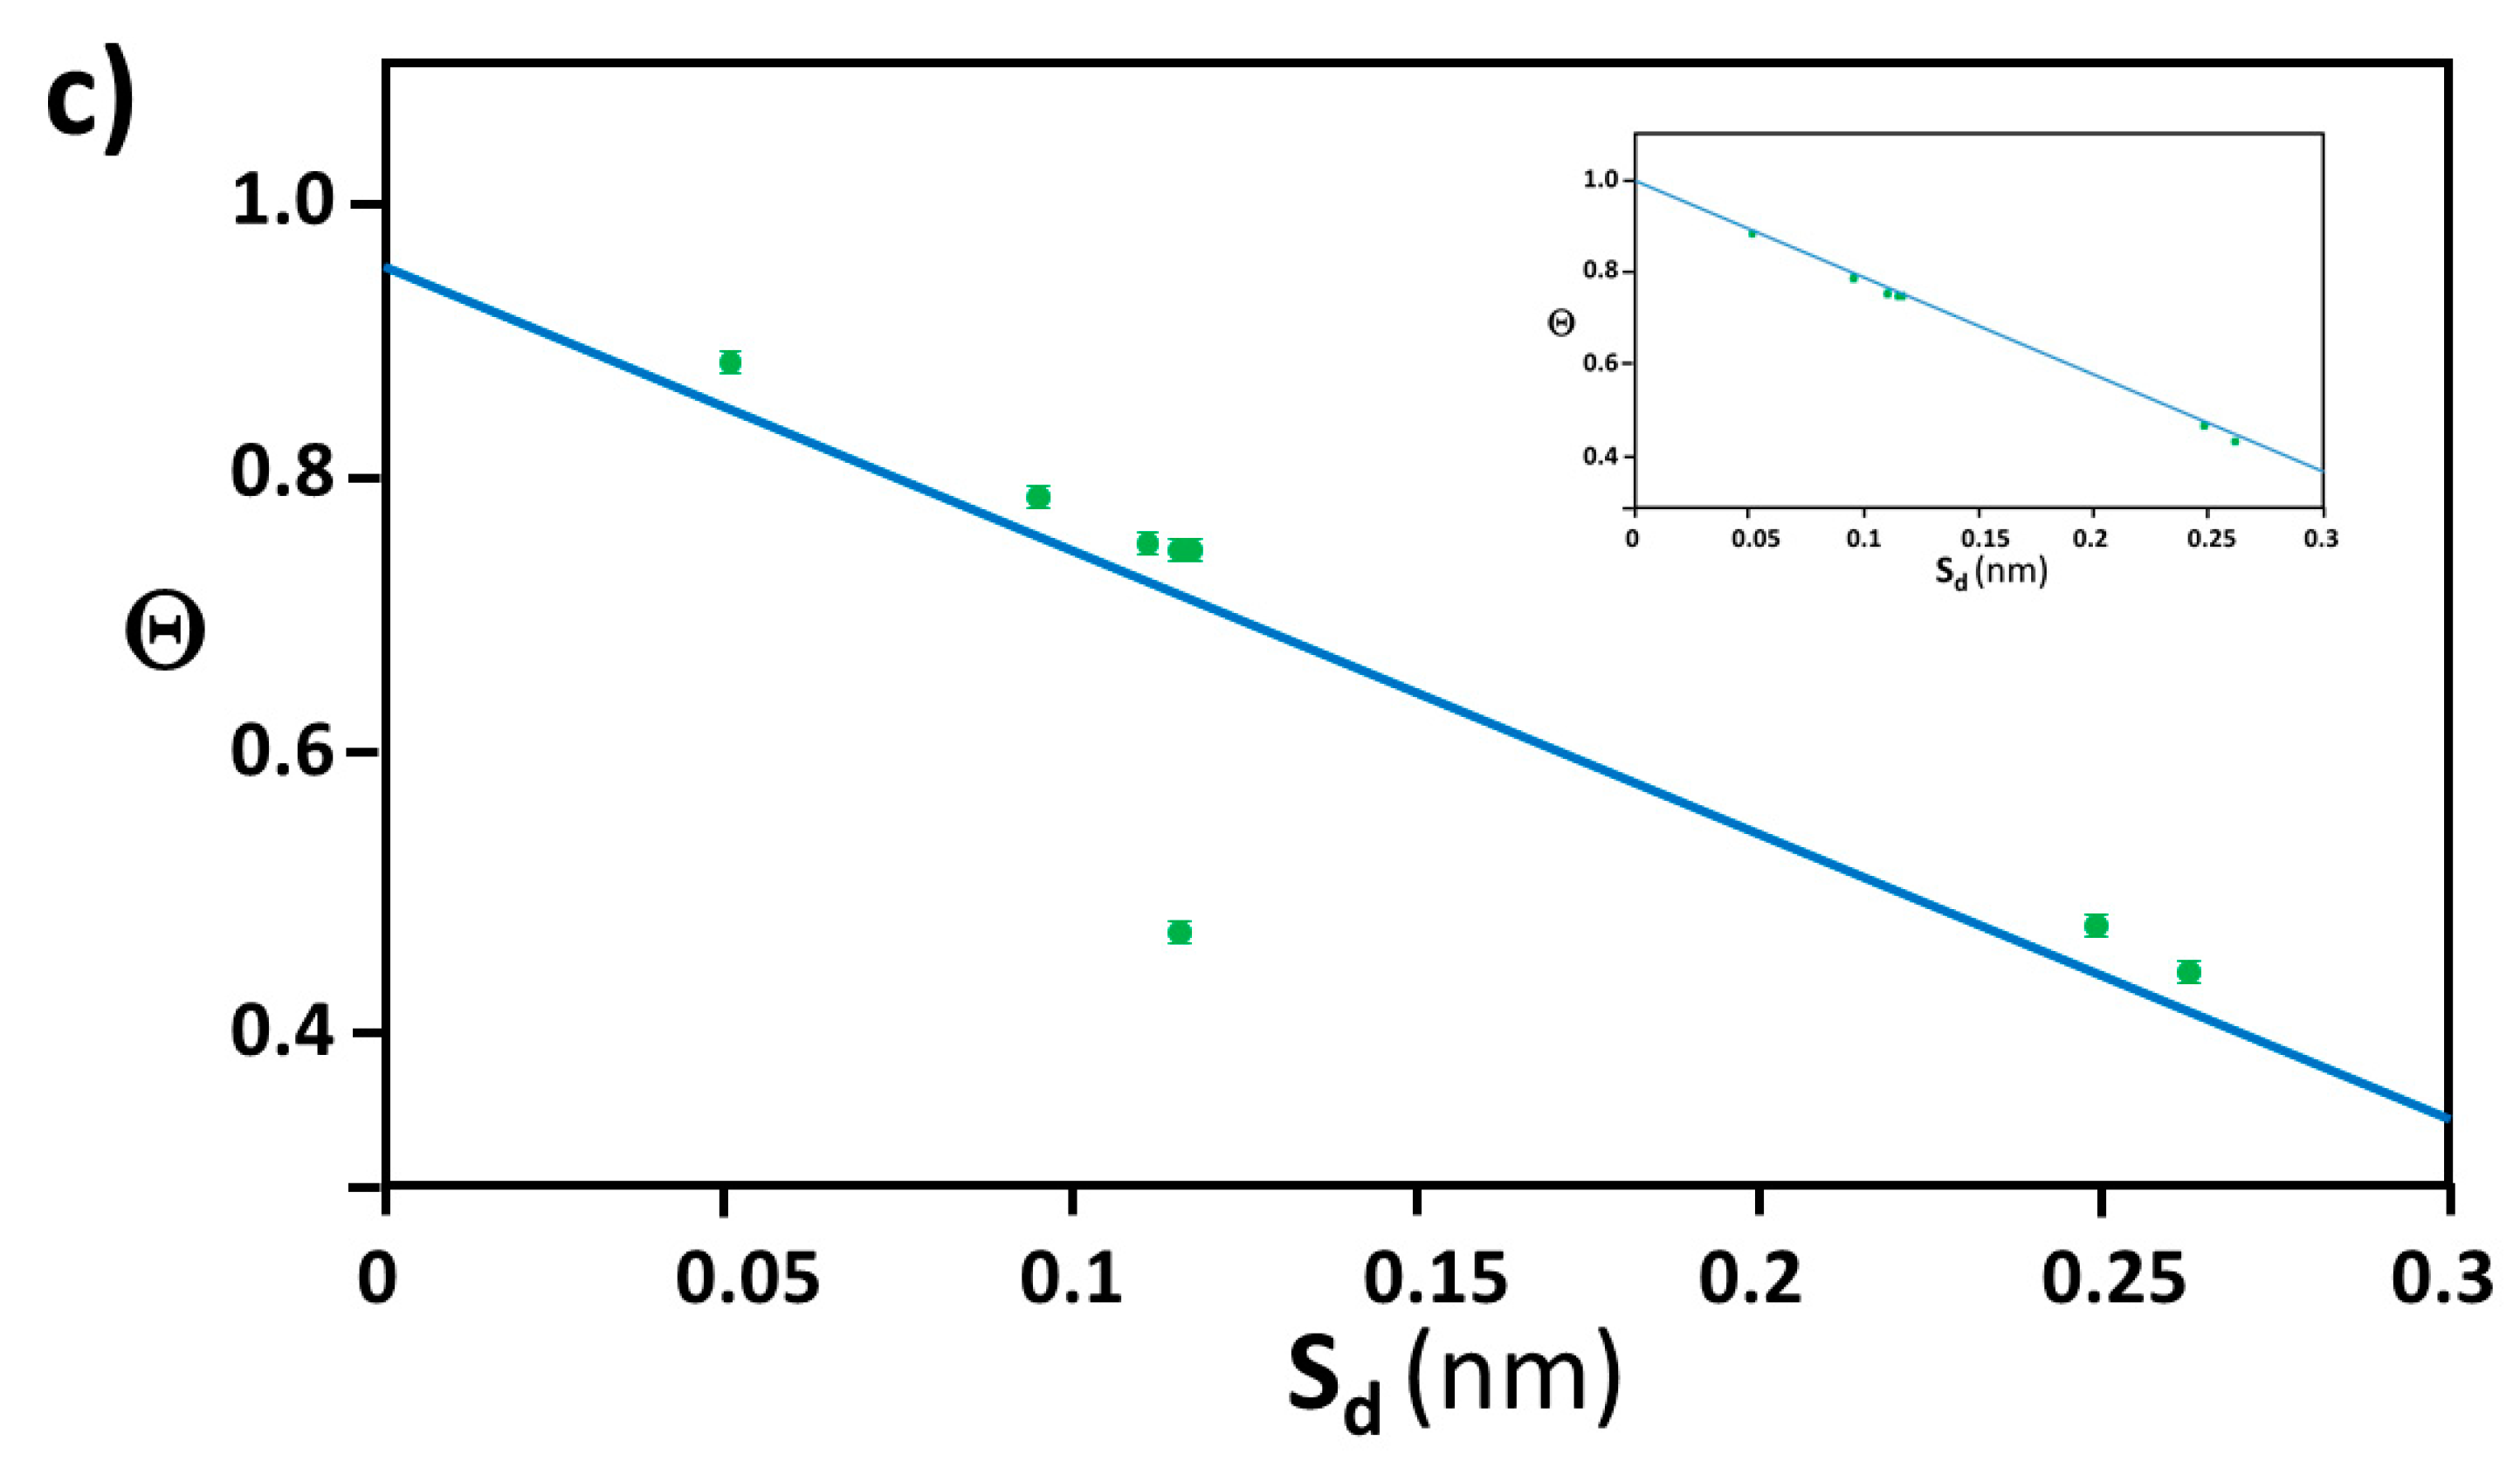
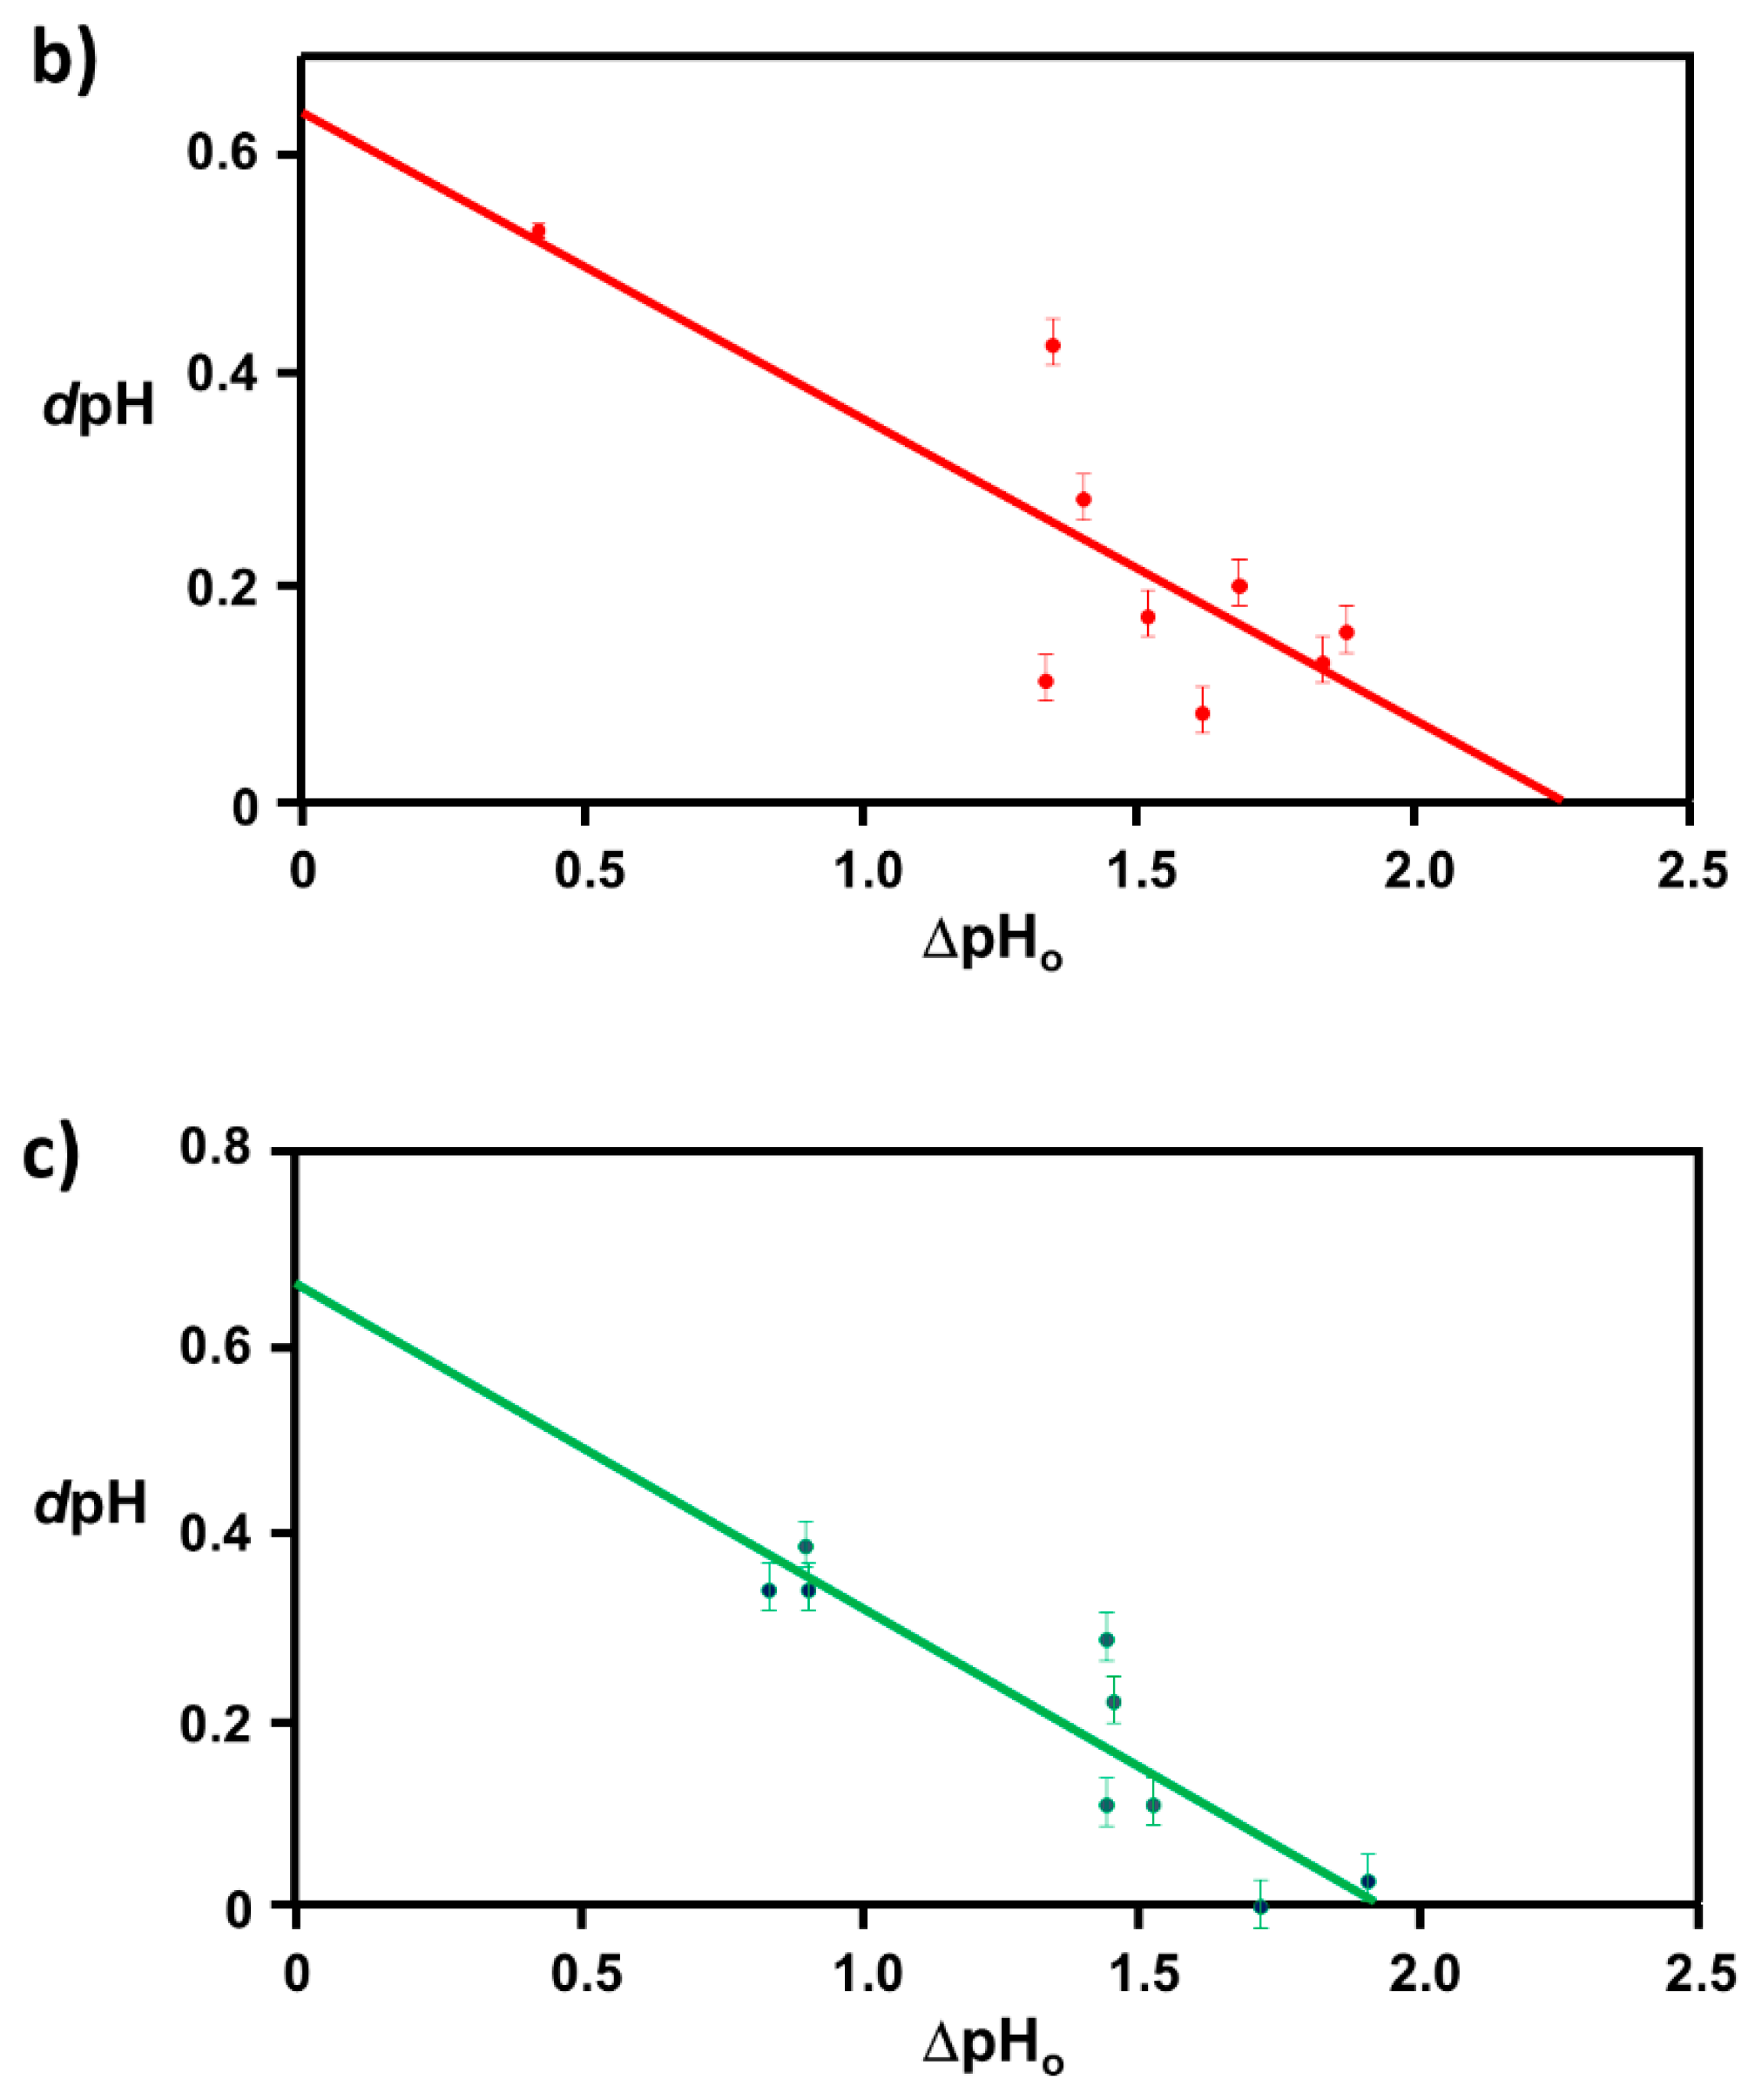
2.2. Distance between Colloidal Particles
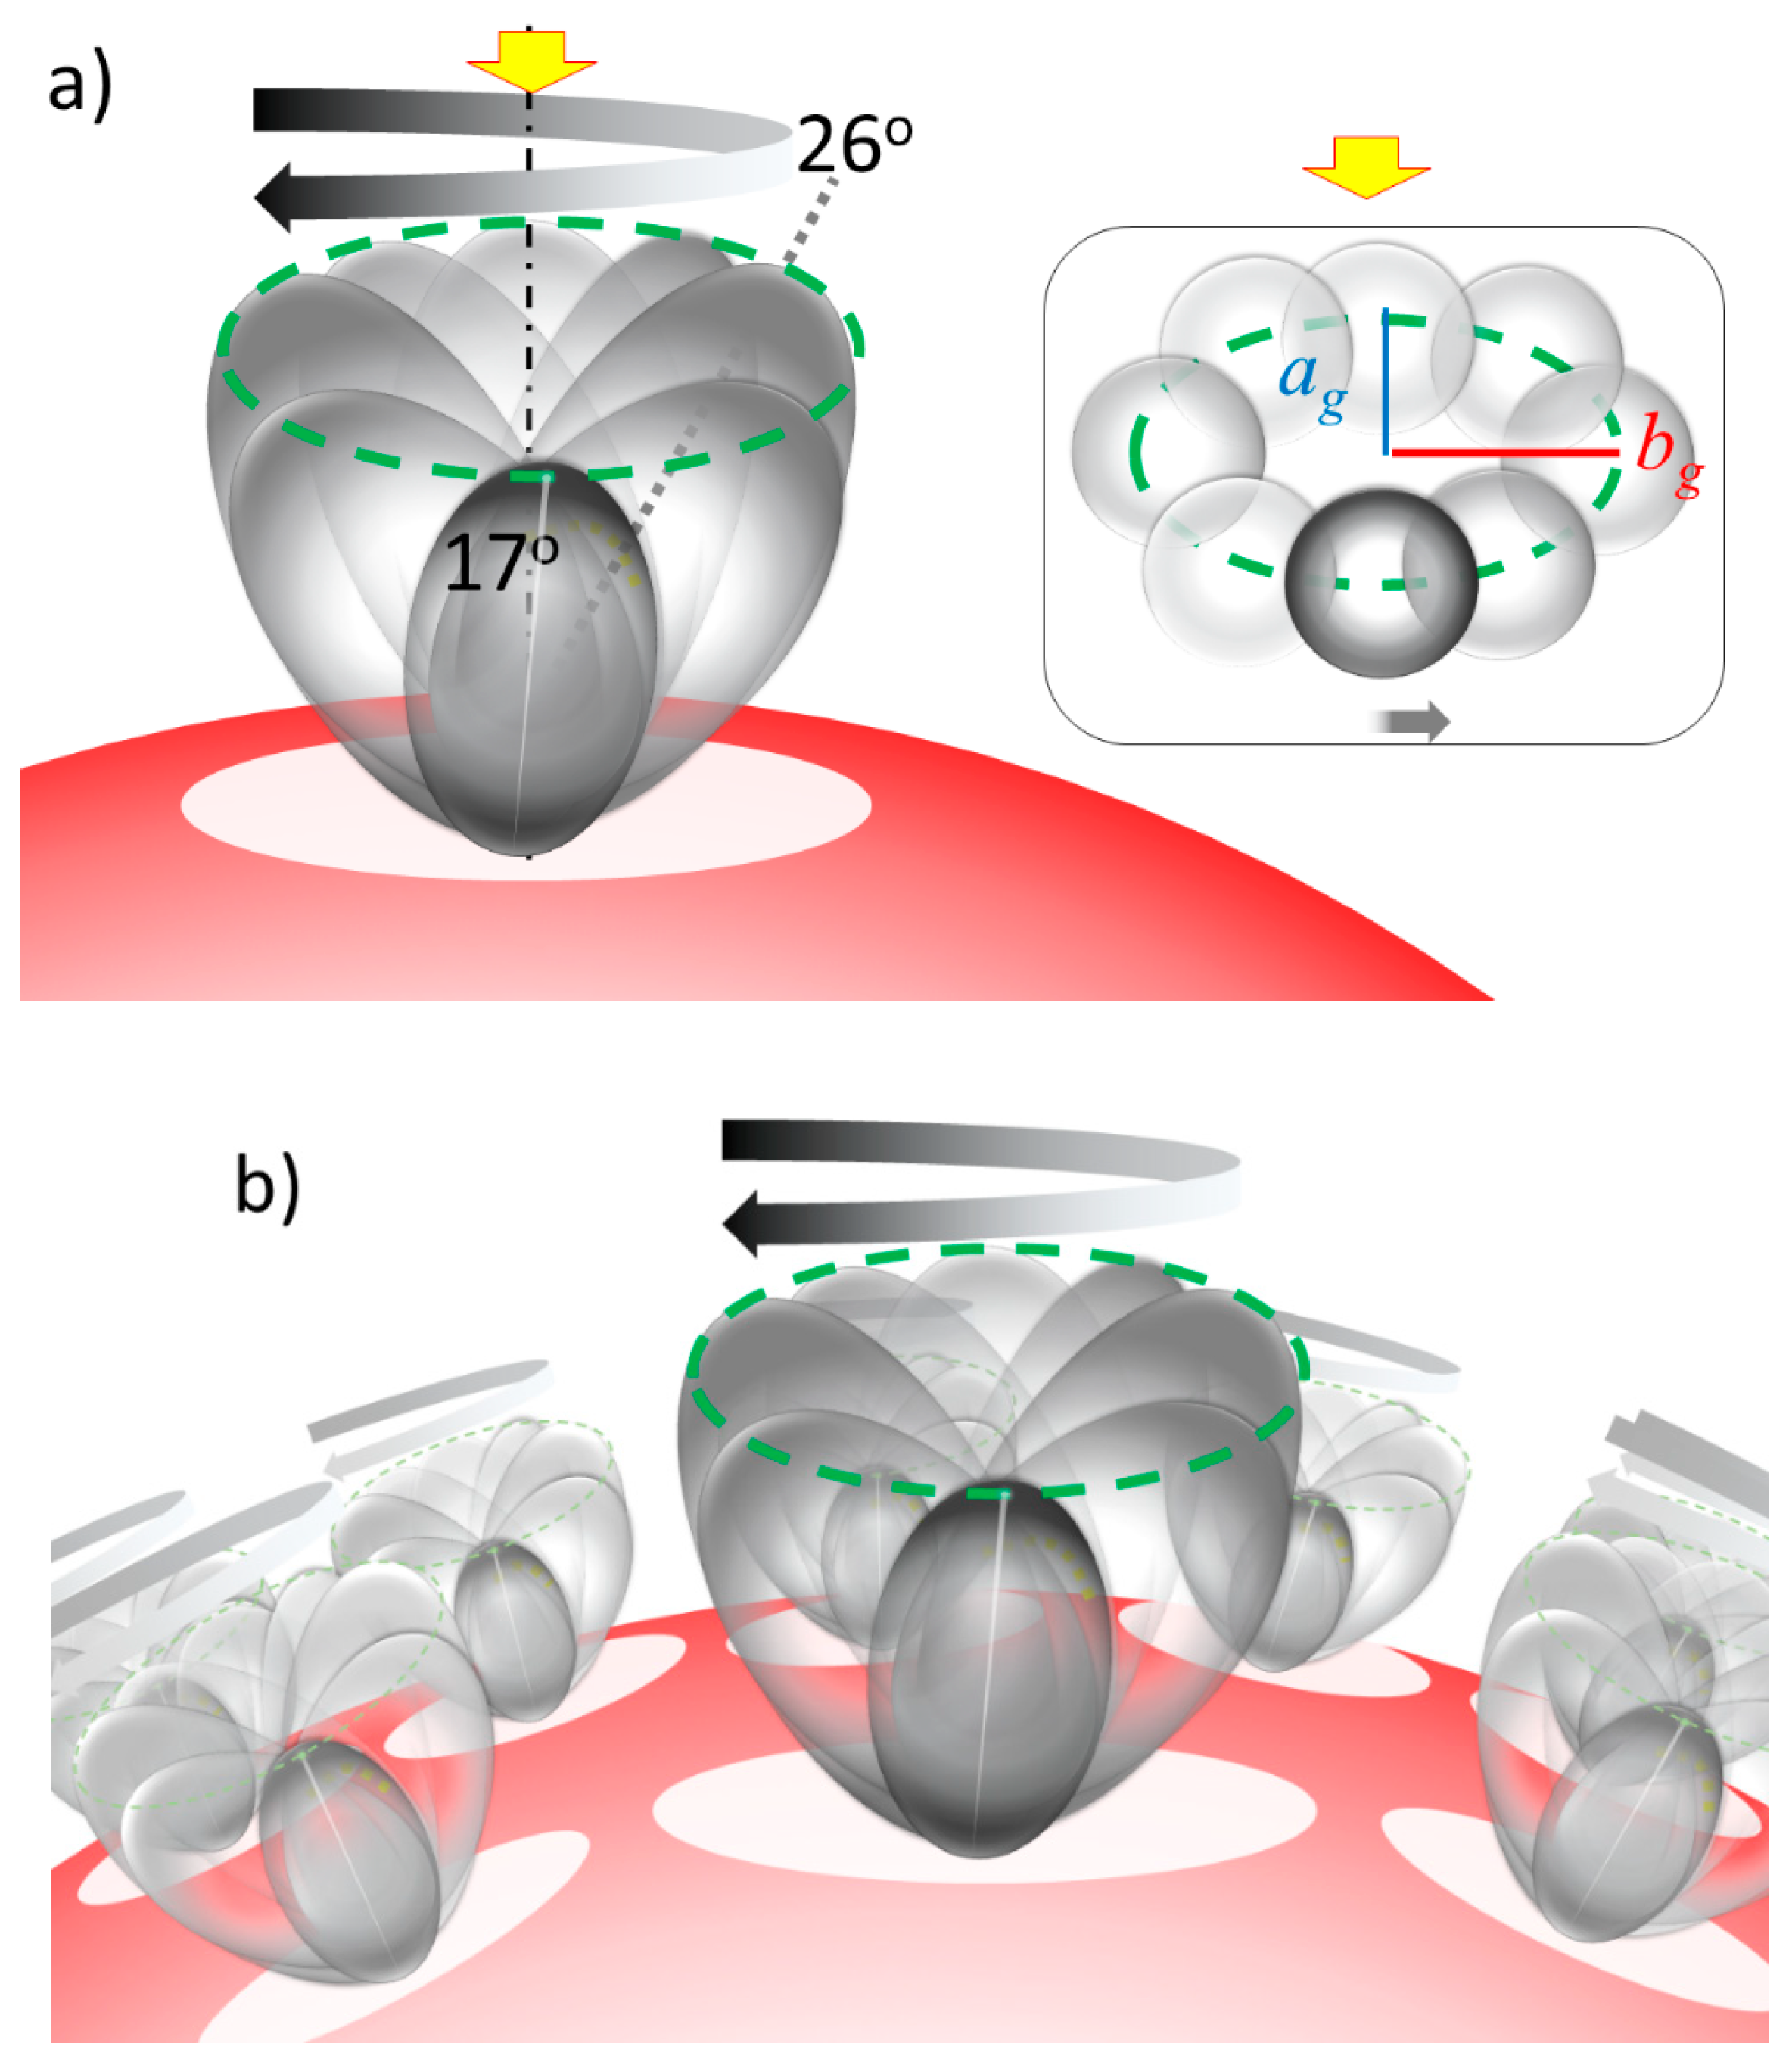
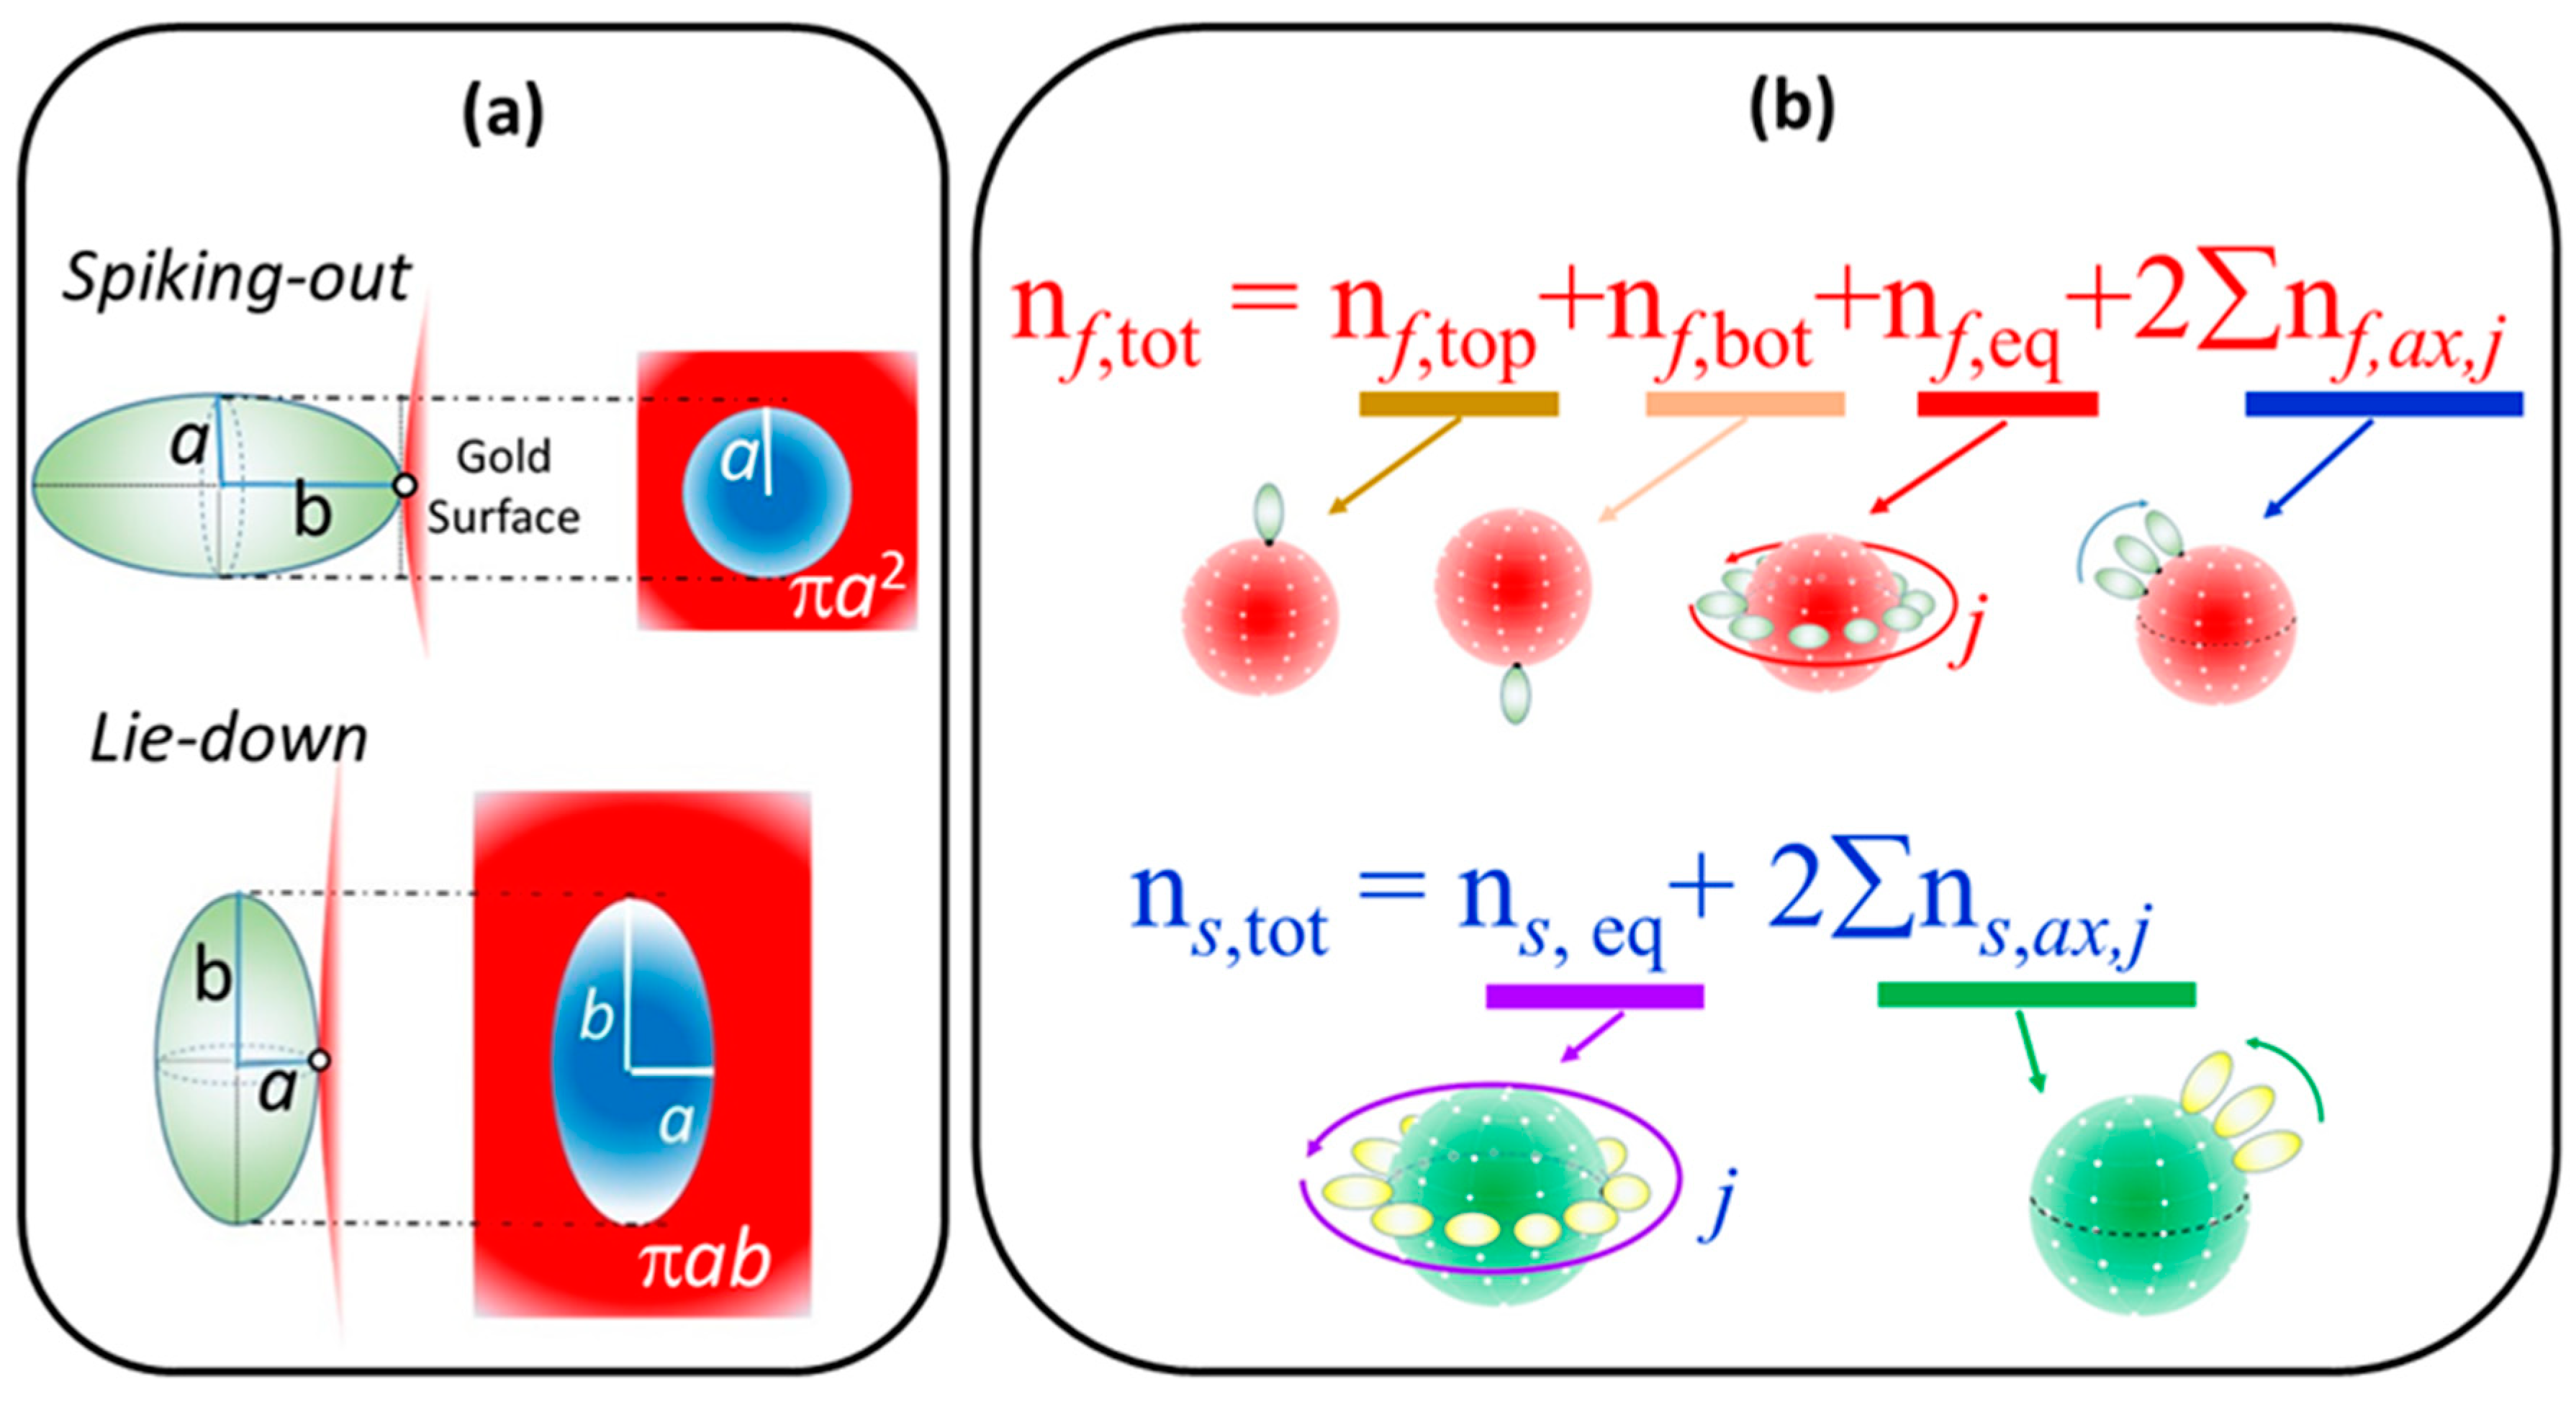
2.3. Simulation of Θ and Orientation
3. Discussions
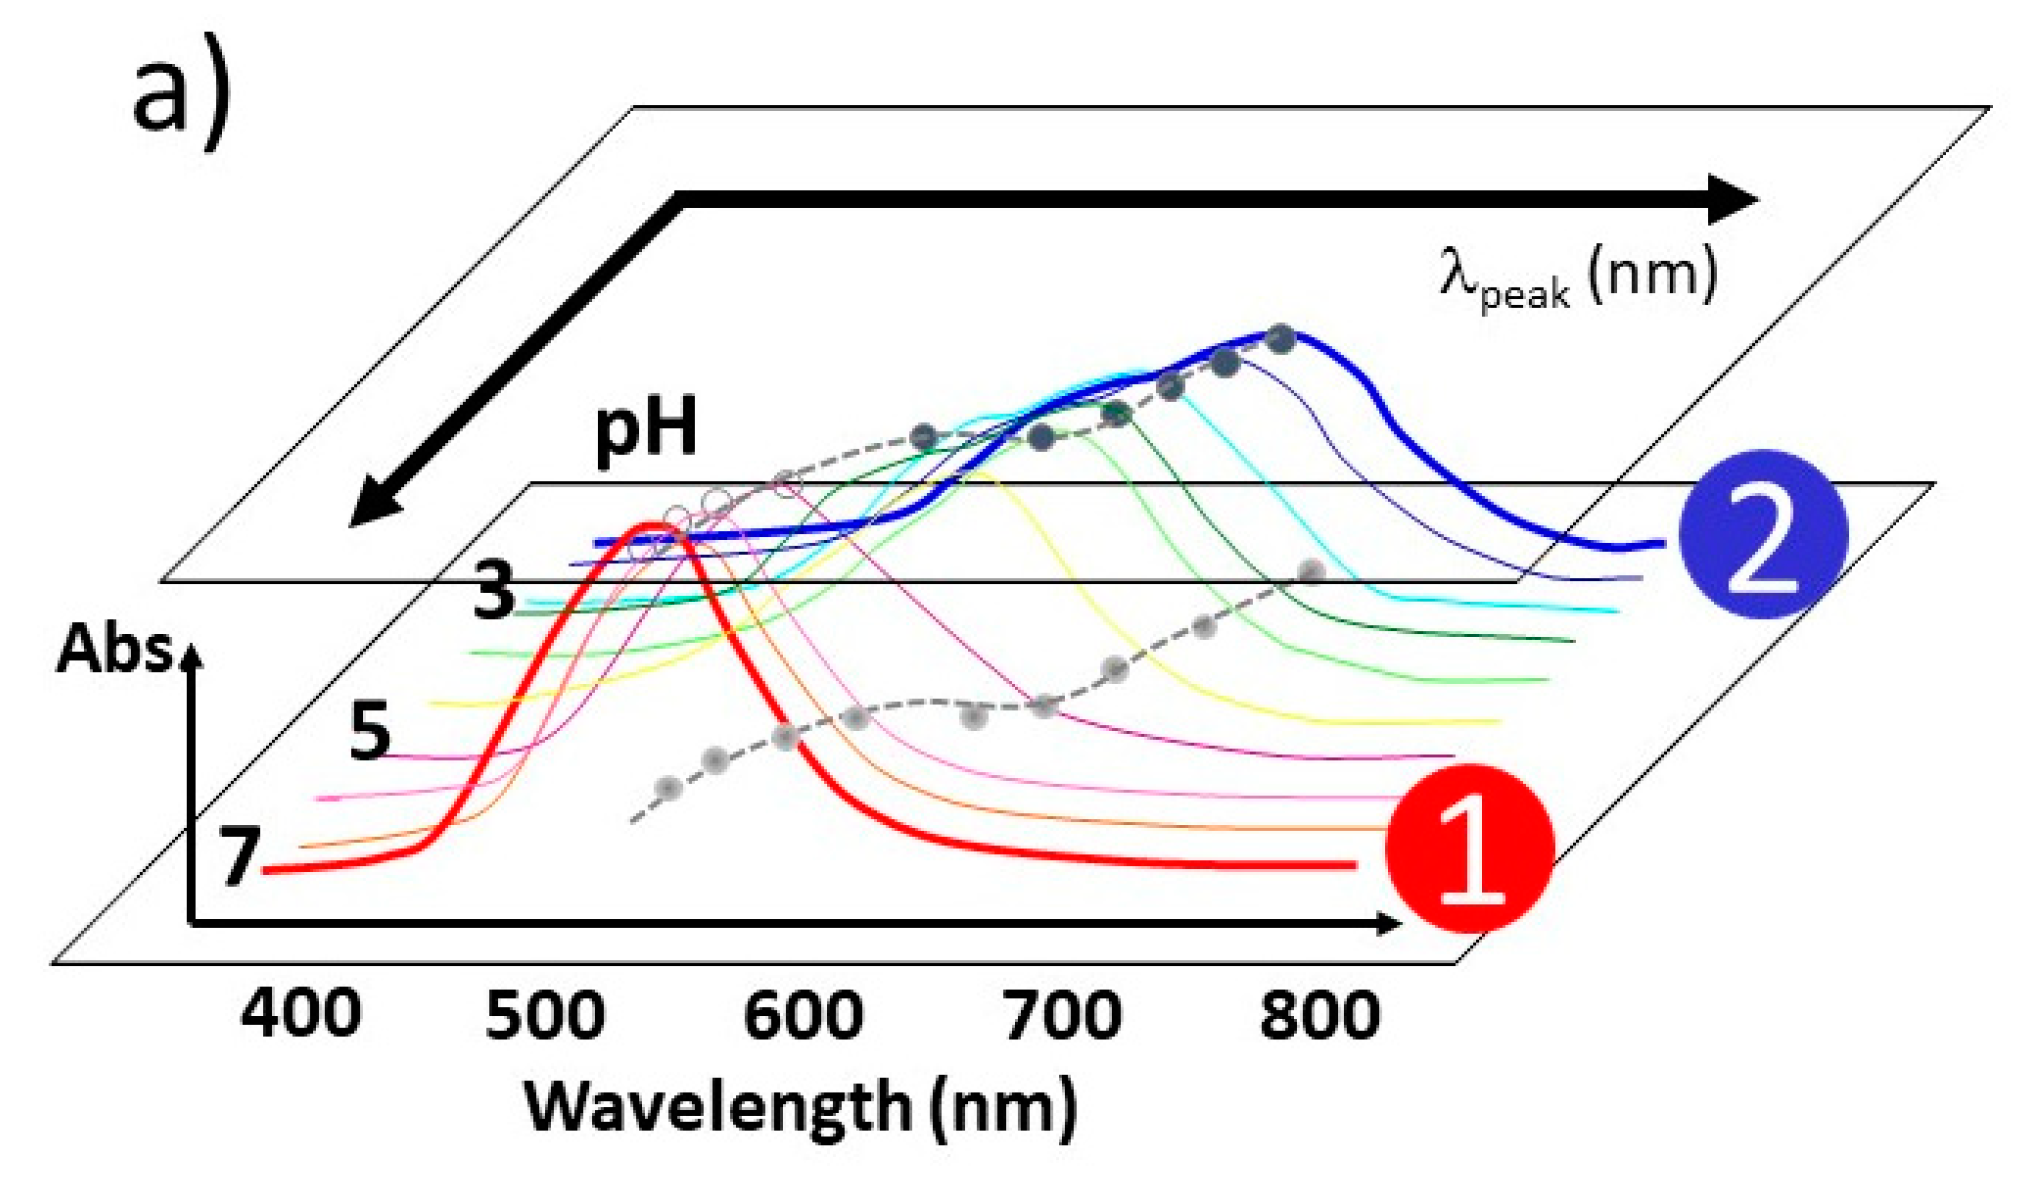
3.1. Elucidation of Θ and Spectroscopic Measurement
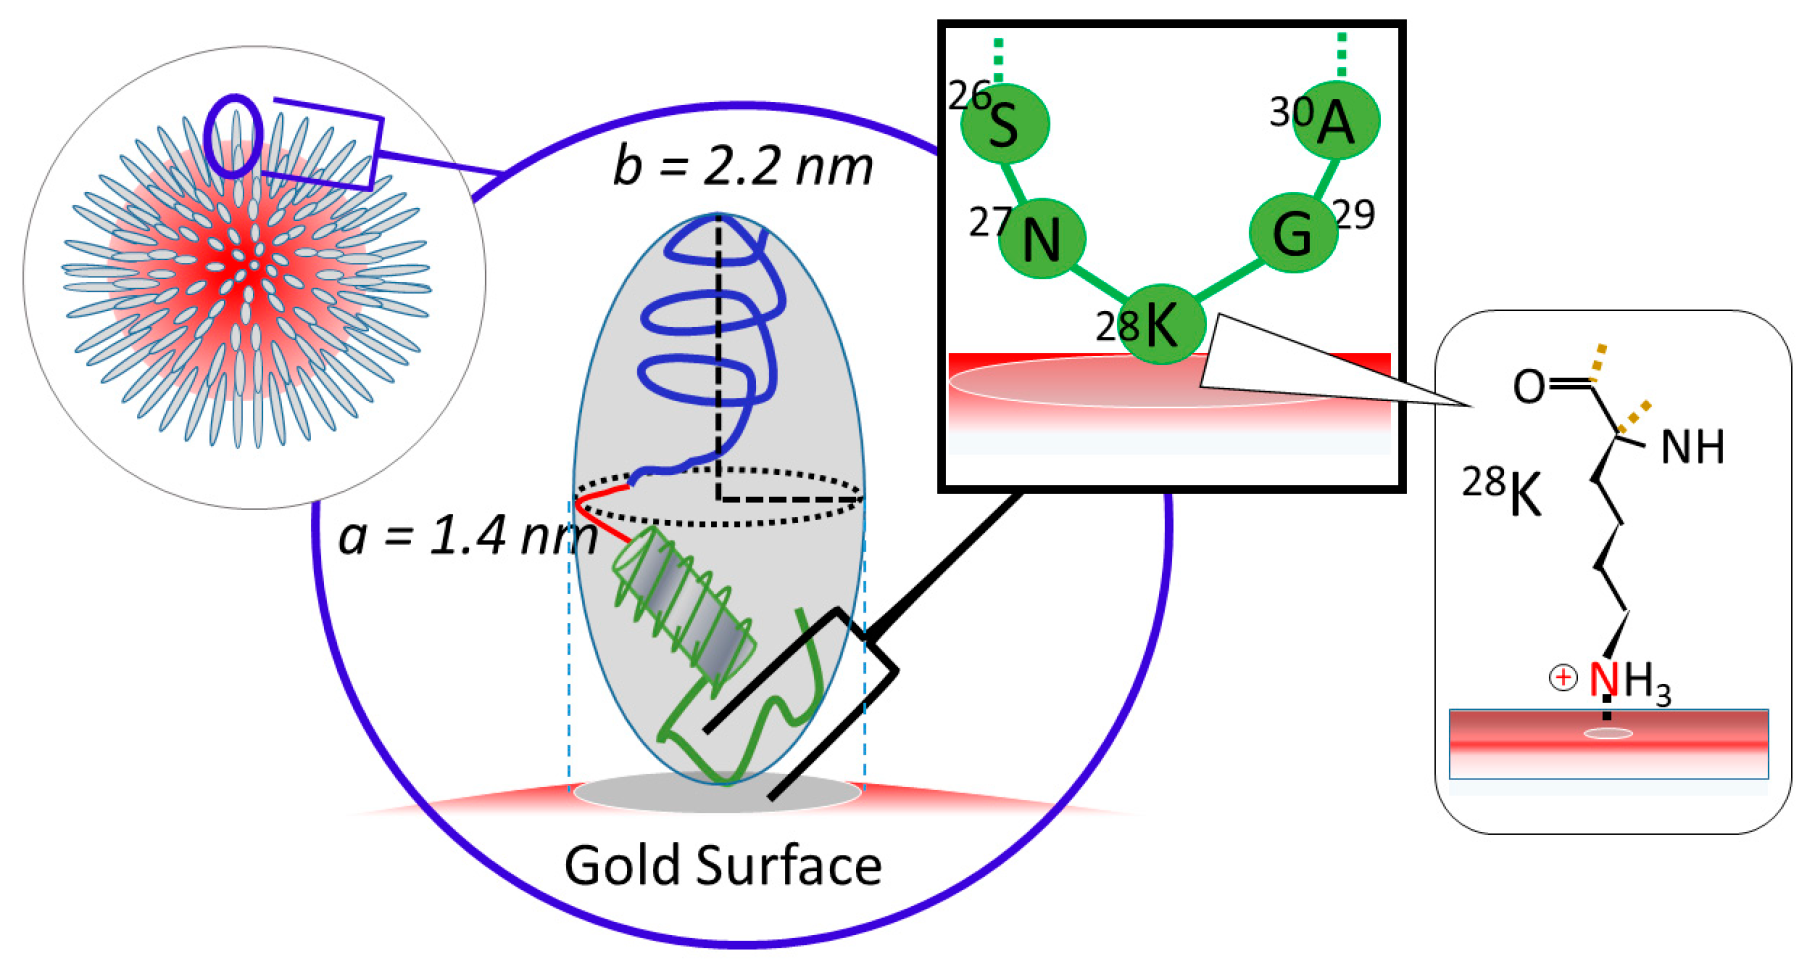
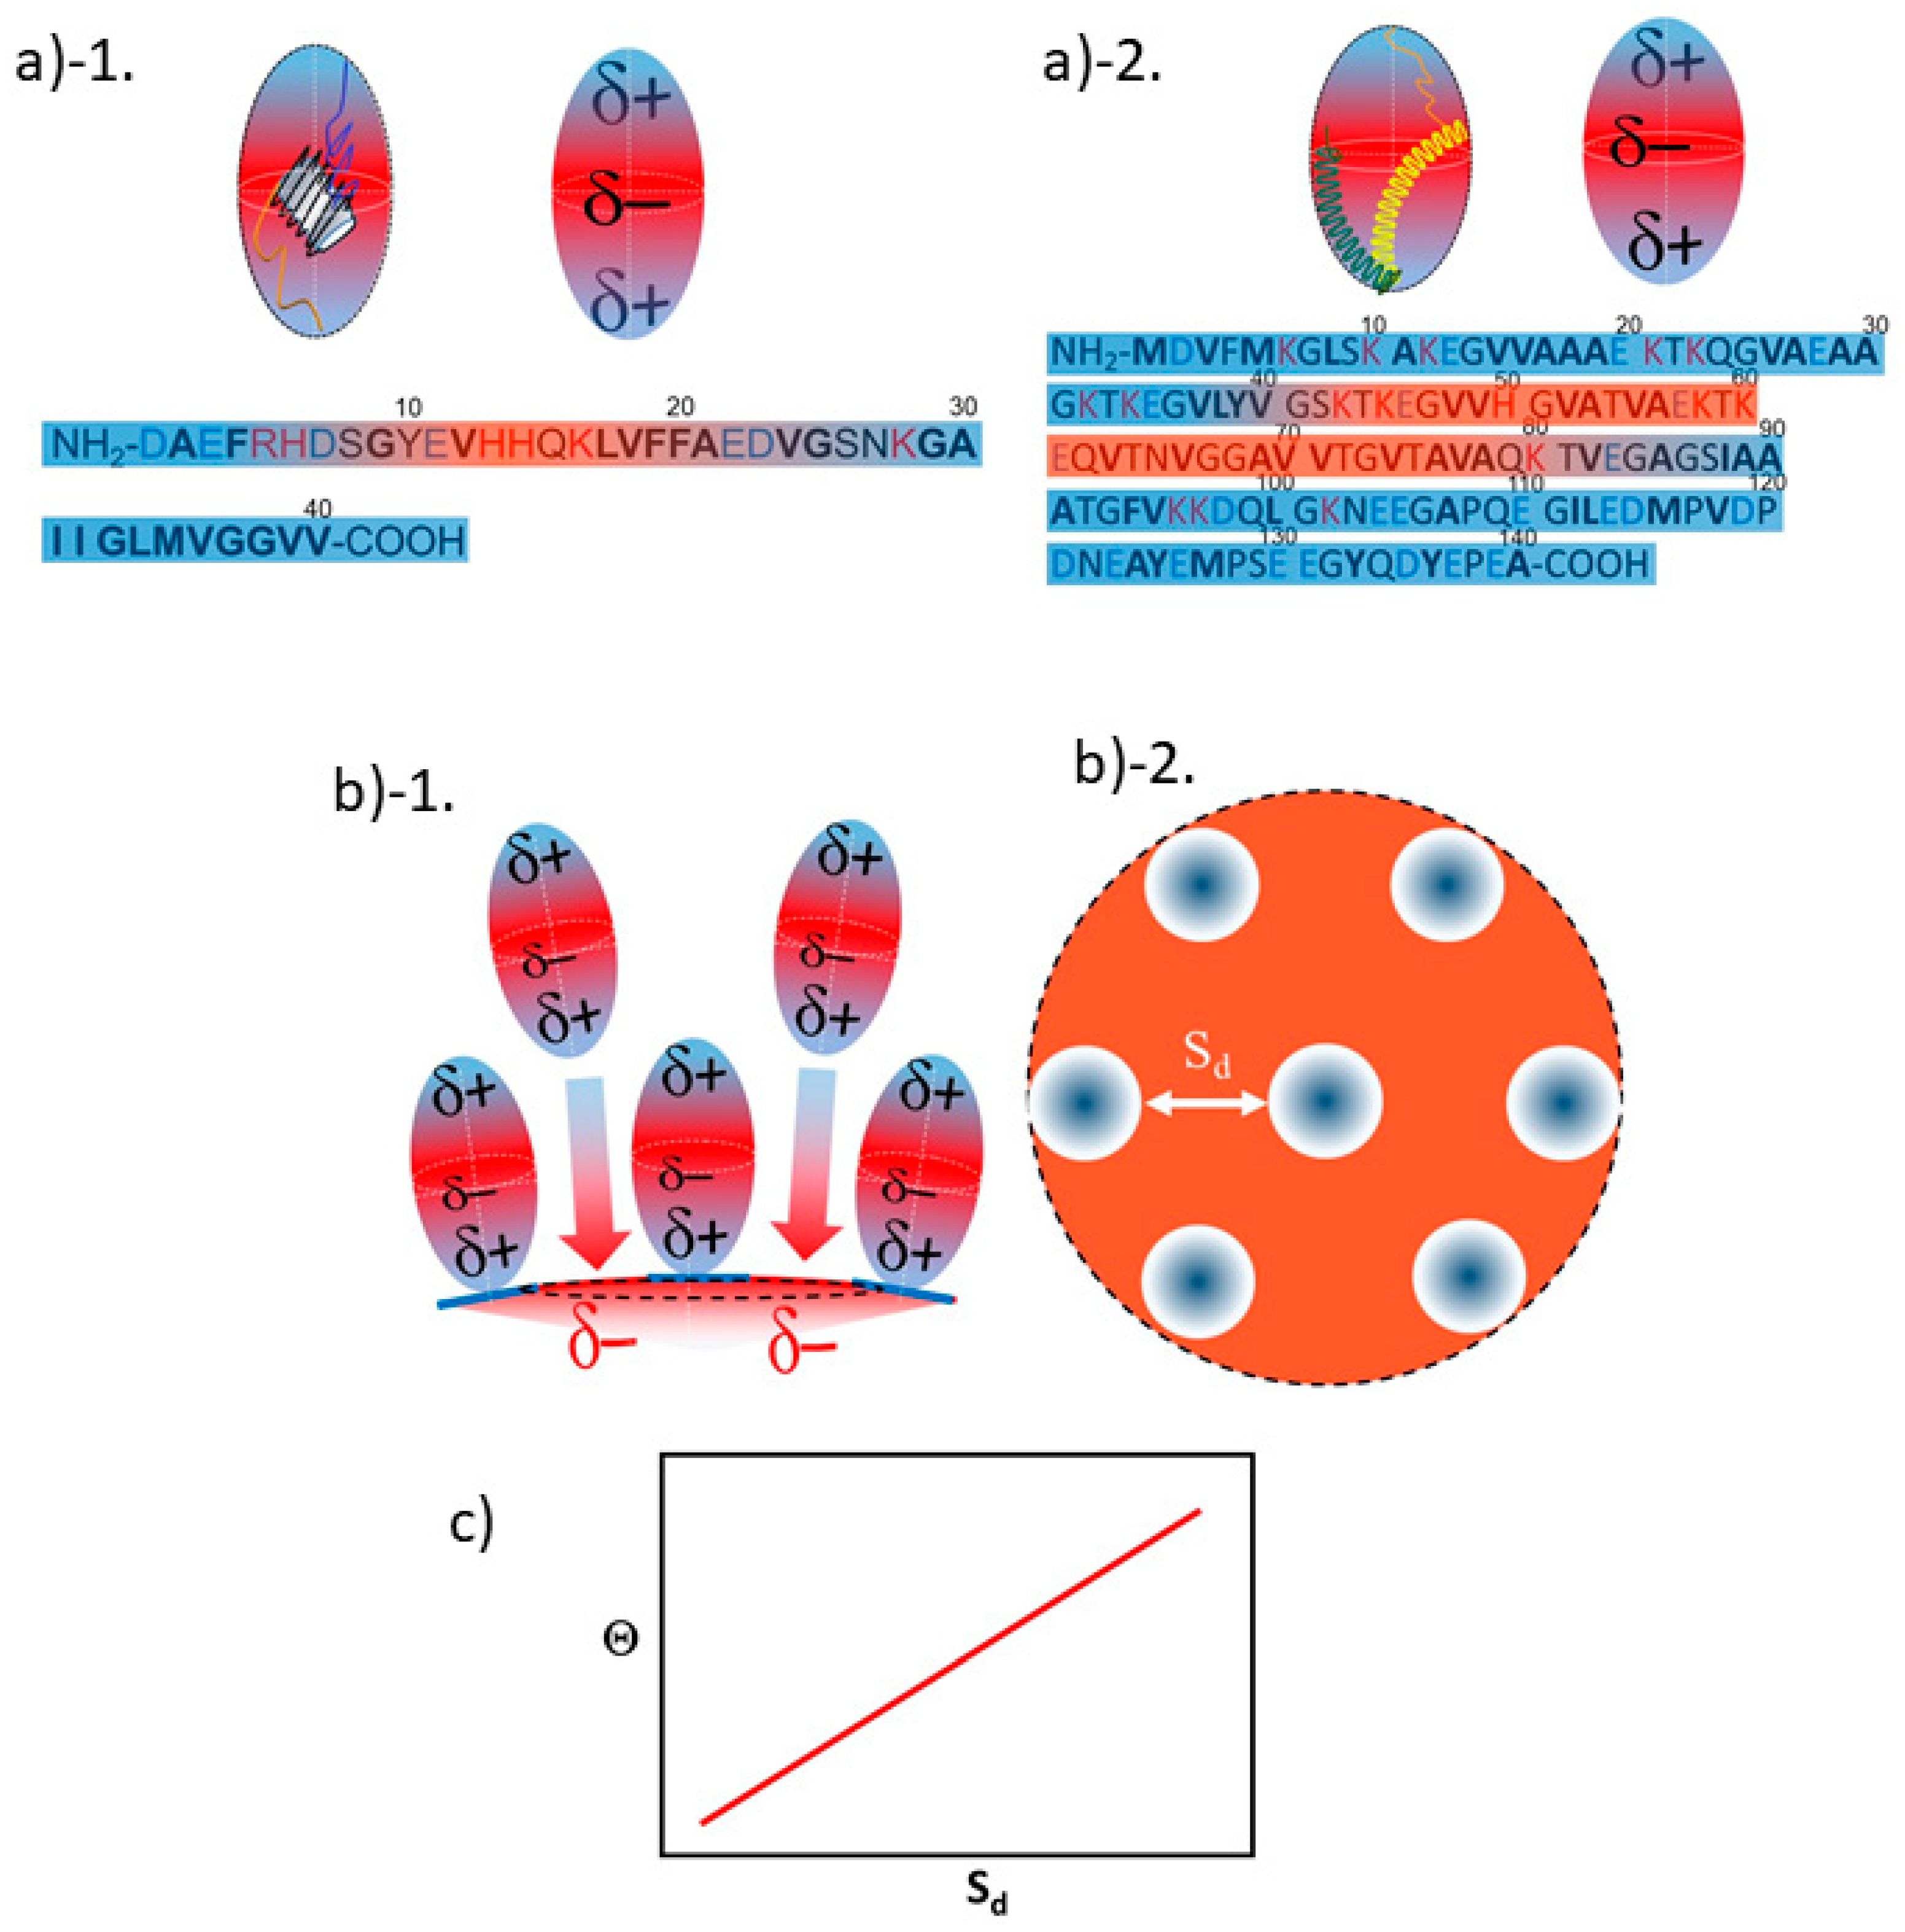
3.2. Orientation of the Peptide over the Surface of Gold Colloidal Surface
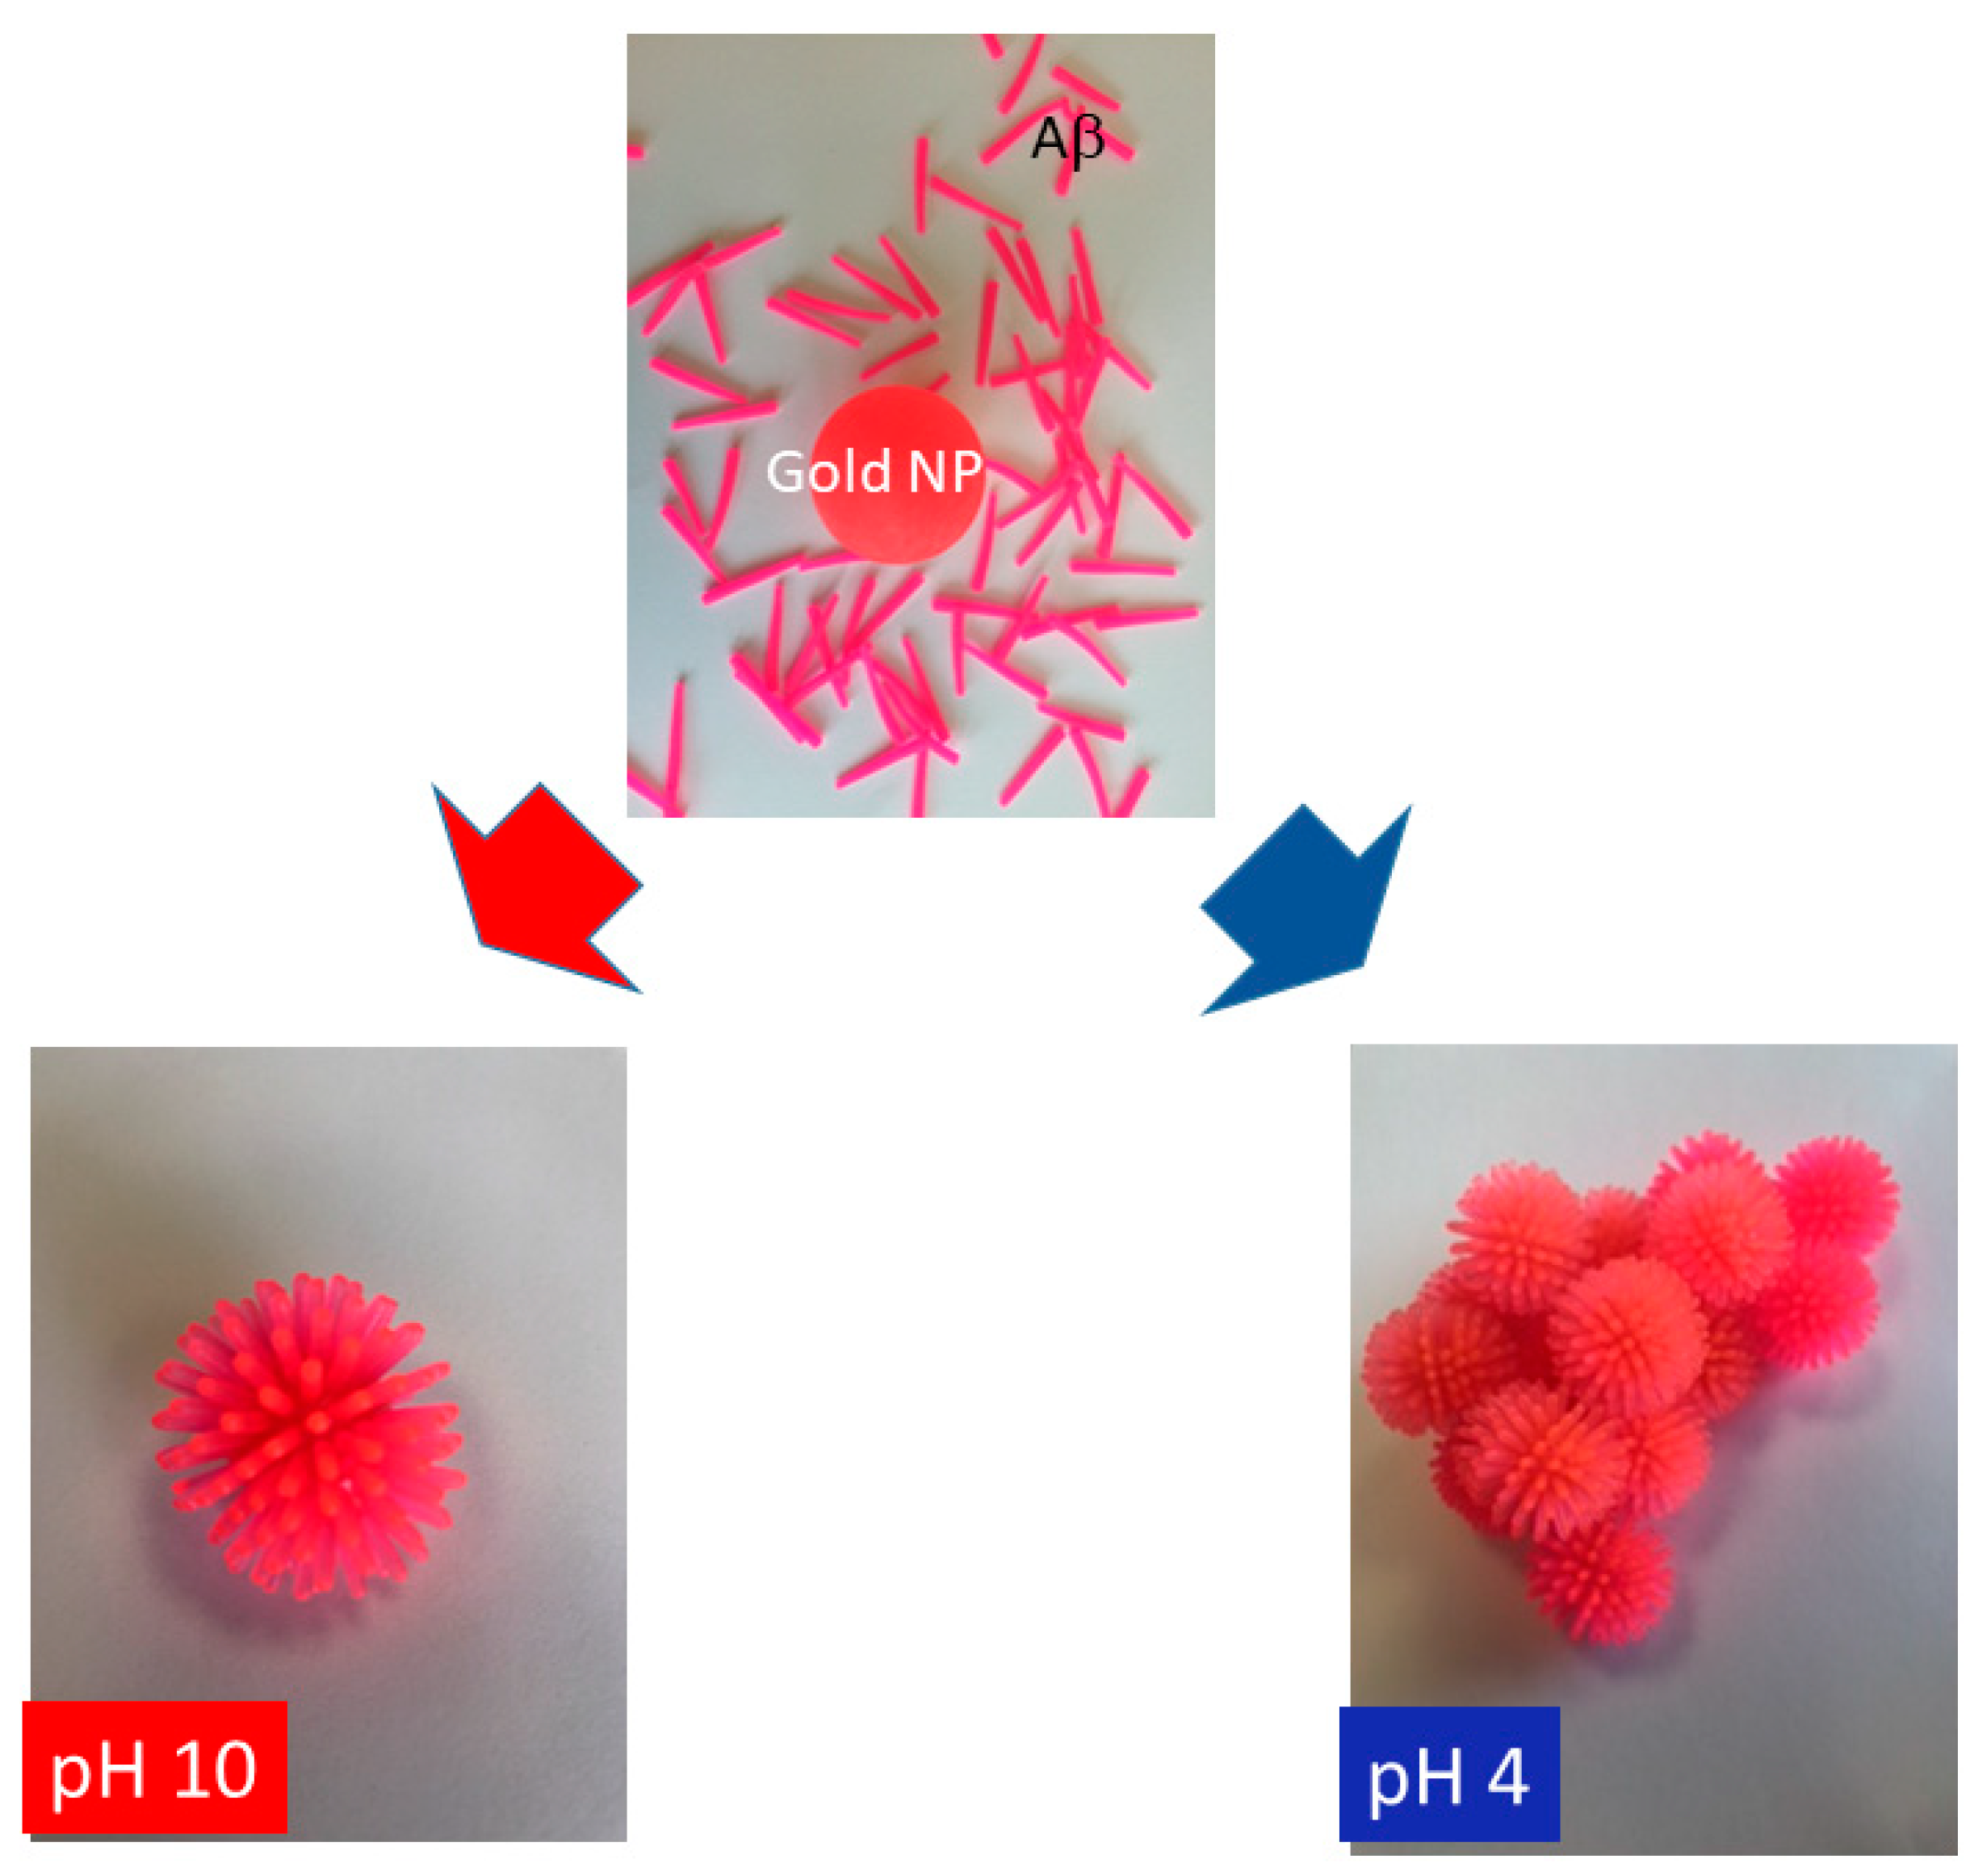
3.3. Networking of the Peptide at an Interfacial Area
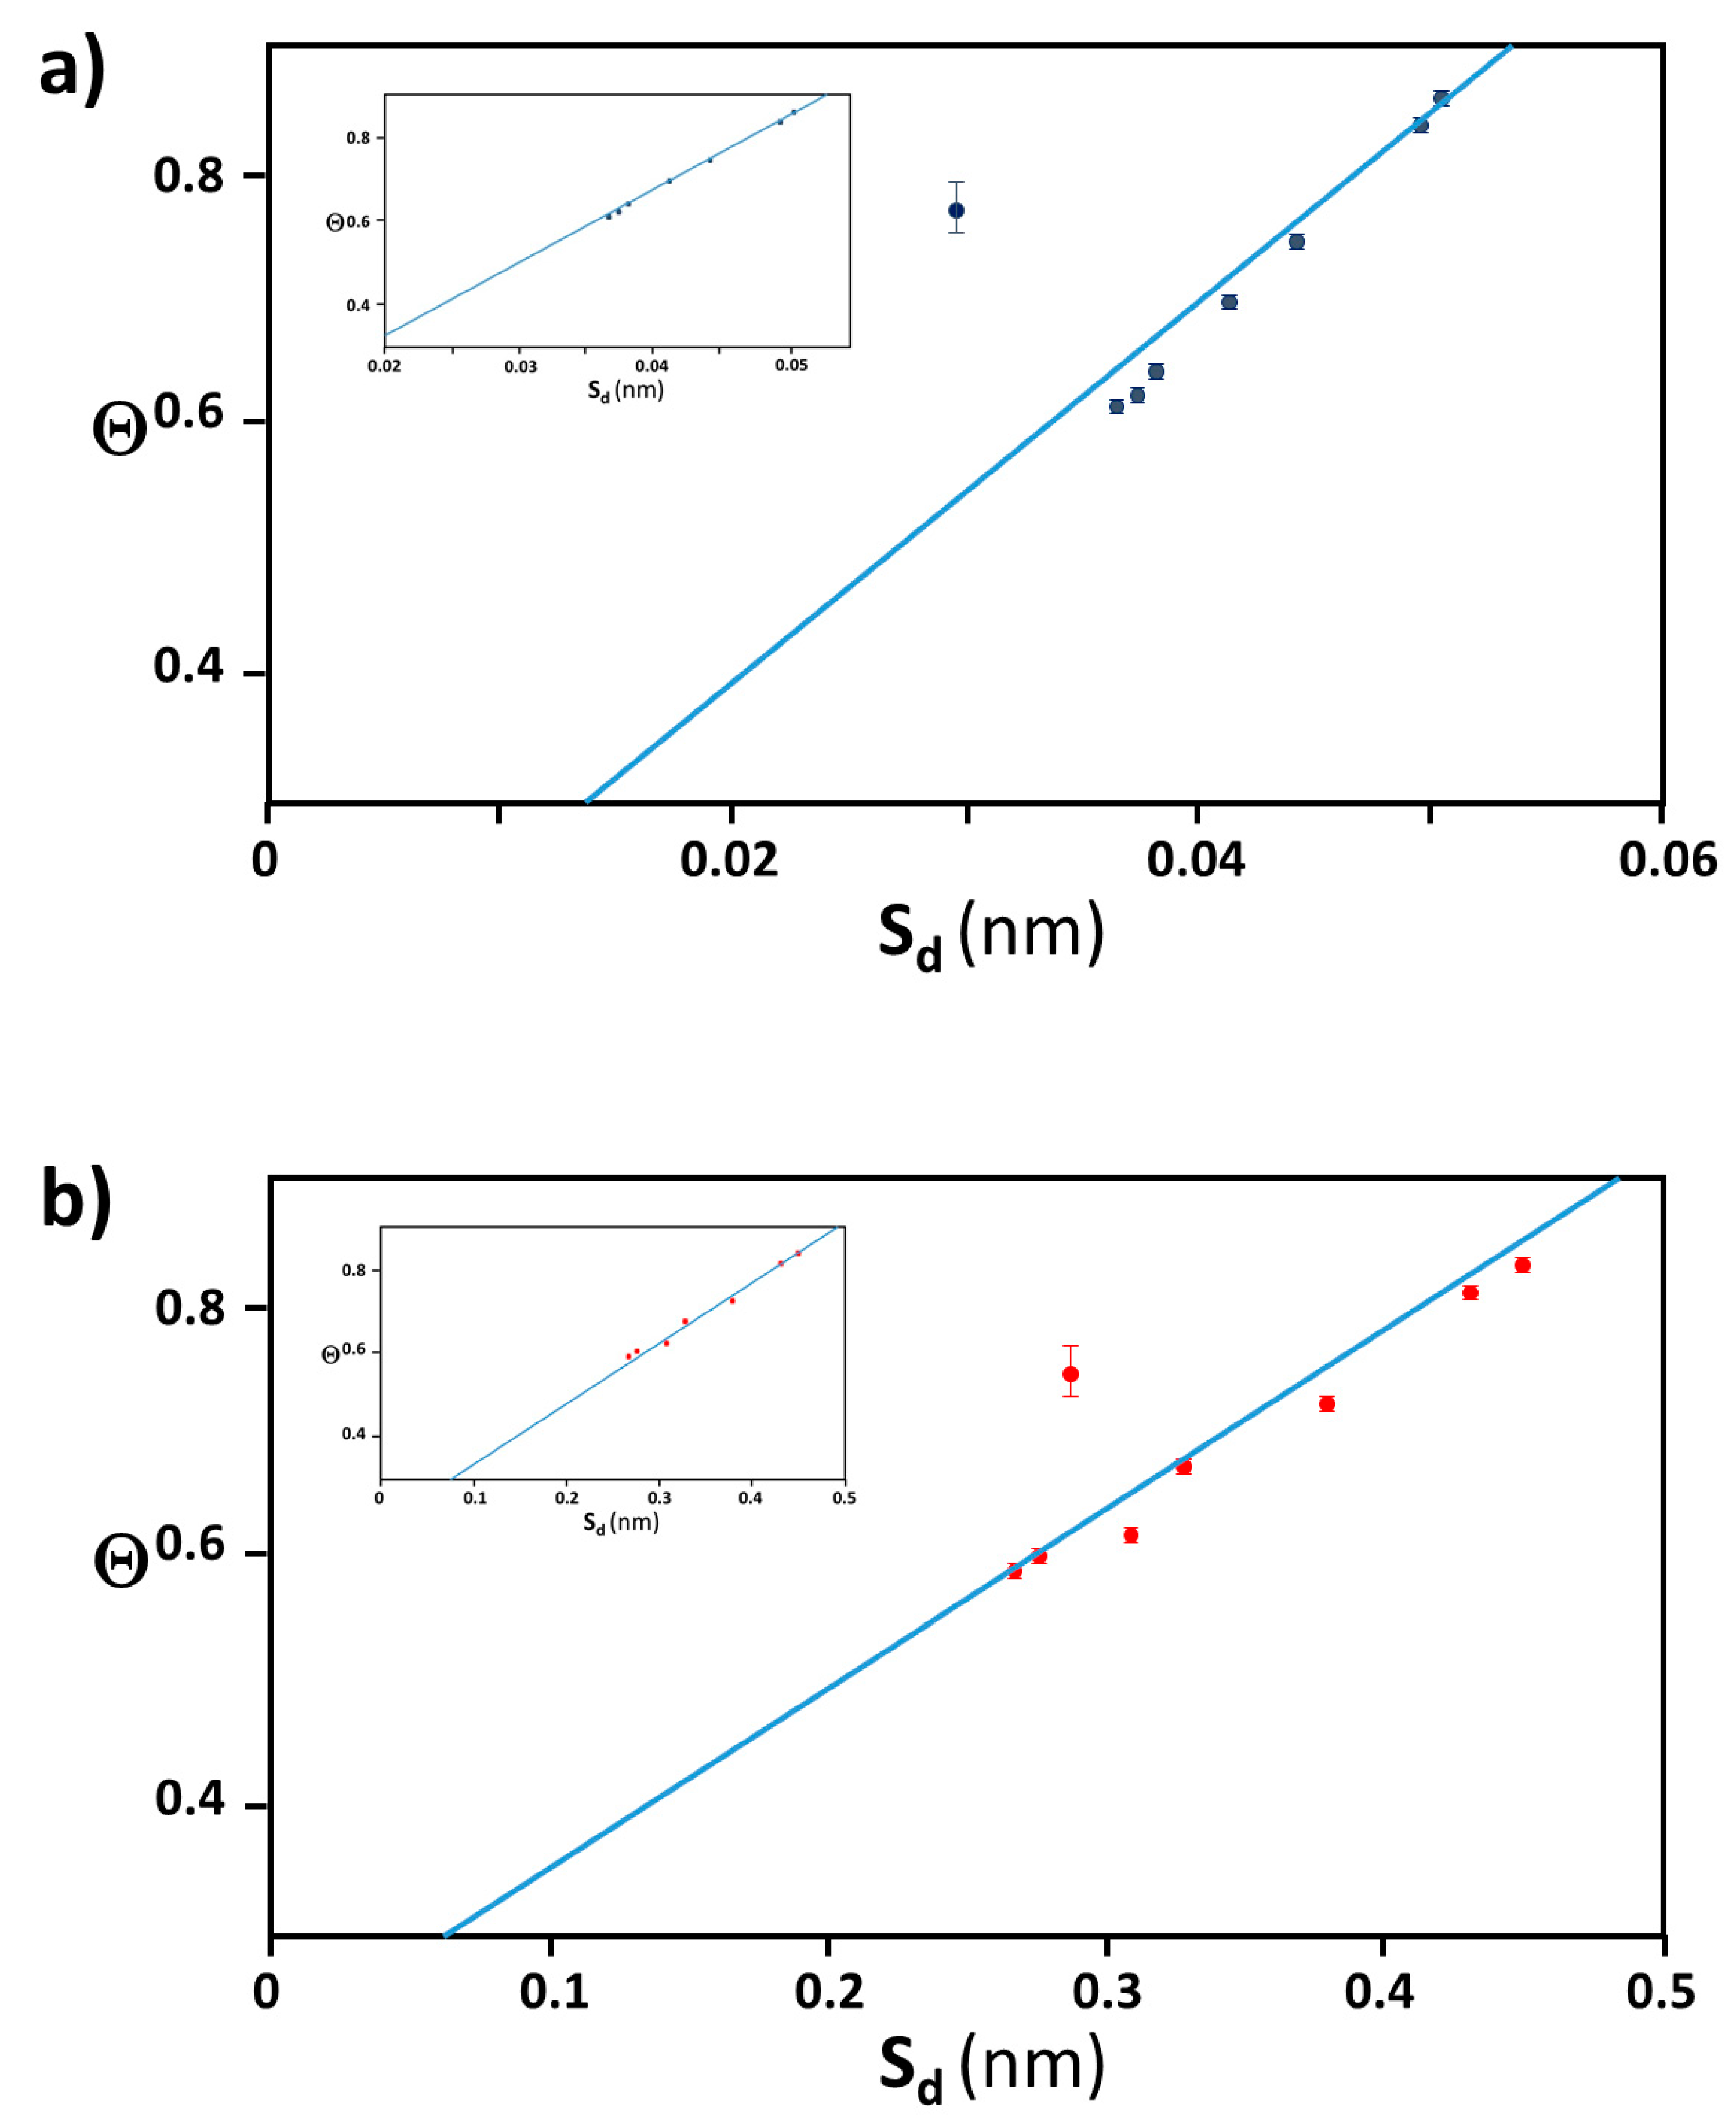
3.4. Verification of the Relationship between Physical Displacement and Coverage Ratio
3.5. Justification of Lower Coverage Ratio and Associated Prolate Shape
4. Materials and Methods
4.1. Materials
4.2. TEM Imaging
4.3. Methods
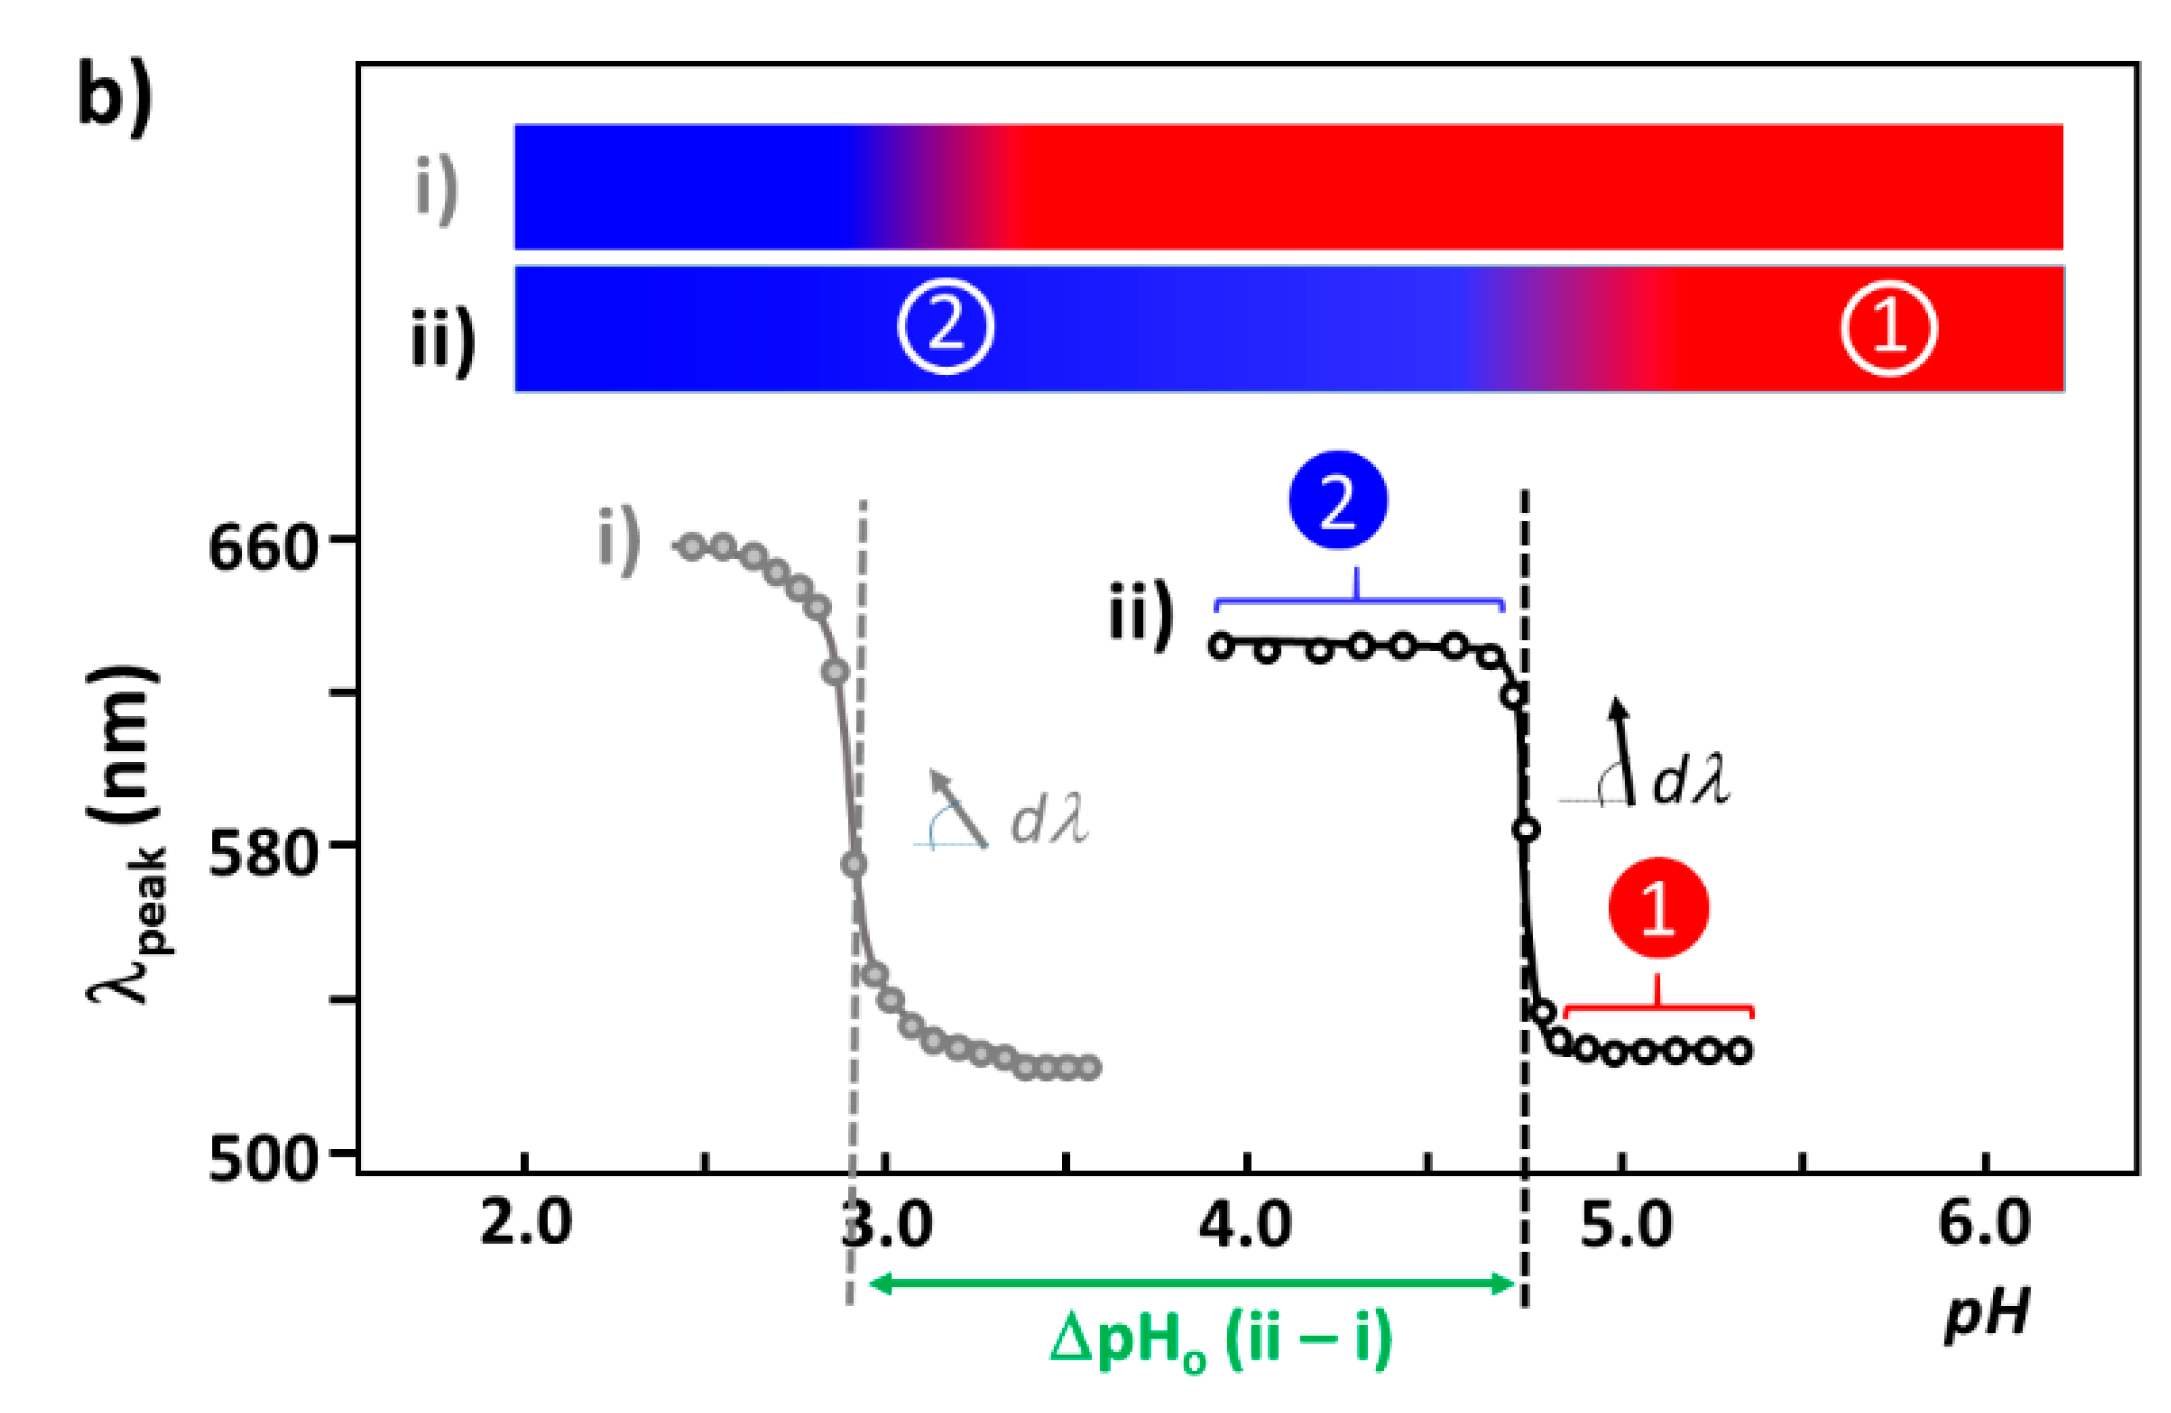
4.3.1. pH-Dependent UV–Vis Absorption Band
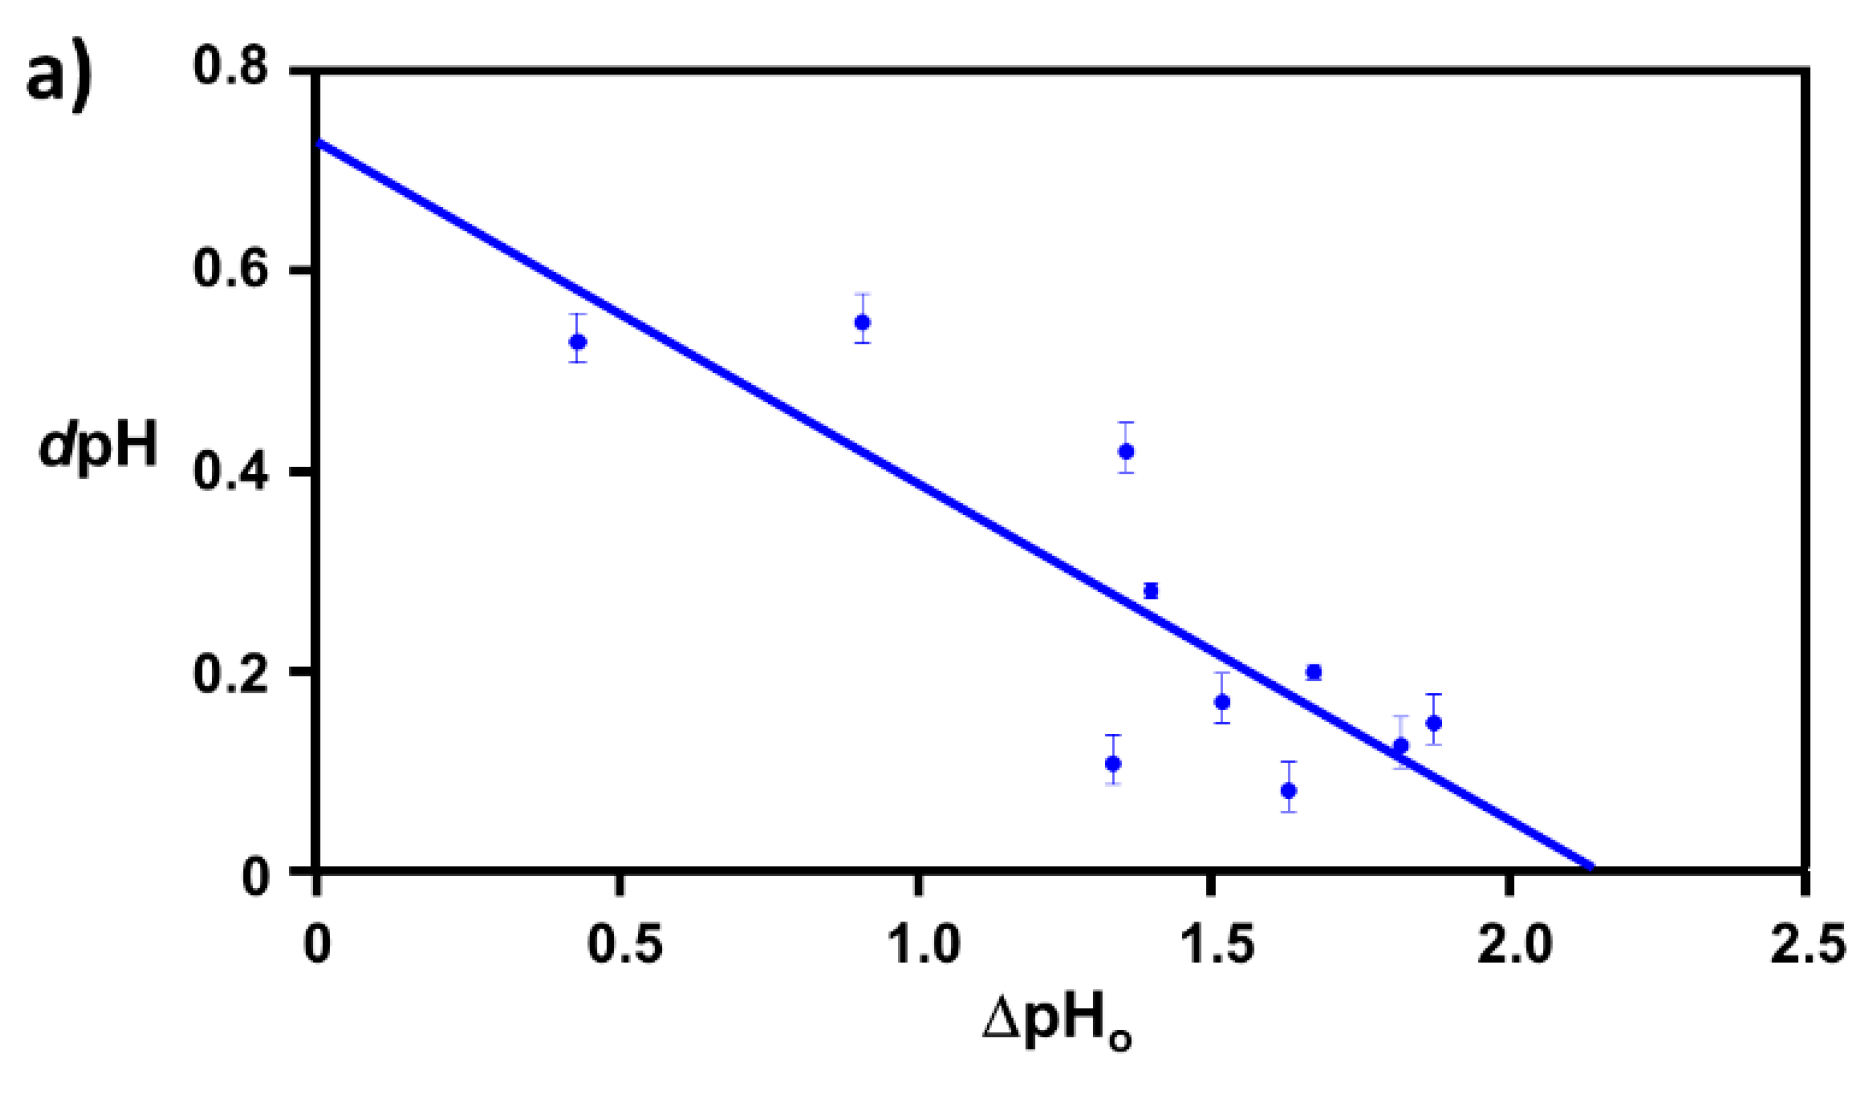
4.3.2. Correlation Relation between ΔpHo and dpH and Extraction of Coverage Ratio
4.3.3. Simulation Process for Calculating the Coverage Fraction
5. Conclusions
Supplementary Materials
Author Contributions
Funding
Acknowledgments
Conflicts of Interest
References
- Norde, W. BioInterface Perspective-My voyage of discovery to proteins in flatland and beyond. Colloids Surf. B Biointerfaces 2008, 61, 1–9. [Google Scholar] [CrossRef] [PubMed]
- Cook, N.P.; Kilpatrick, K.; Segatori, L.; Martí, A.A. Detection of α-Synuclein Amyloidogenic Aggregates in Vitro and in Cells using Light-Switching Dipyridophenazine Ruthenium(II) Complexes. J. Am. Chem. Soc. 2012, 134, 20776–20782. [Google Scholar] [CrossRef] [PubMed]
- Muangchuen, A.; Chaumpluk, P.; Suriyasomboon, A.; Ekgasit, S. Colorimetric detection of Ehrlichia canis via nucleic acid hybridization in gold nano-colloids. Sensors 2014, 14, 14472–14487. [Google Scholar] [CrossRef] [PubMed]
- Rasheed, P.A.; Sandhyarani, N. Femtomolar level detection of BRCA1 gene using a gold nanoparticle labeled sandwich type DNA sensor. Colloids Surf. B Biointerfaces 2014, 1, 7–13. [Google Scholar] [CrossRef] [PubMed]
- Suarasan, S.; Focsan, M.; Soritau, O.; Maniu, D.; Astilean, S. One-pot, green synthesis of gold nanoparticles by gelatin and investigation of their biological effects on Osteoblast cells. Colloids Surf. B Biointerfaces 2015, 32, 122–131. [Google Scholar] [CrossRef] [PubMed]
- Zhao, T.; Yu, K.; Li, L.; Zhang, T.; Guan, Z.; Gao, N.; Yuan, P.; Li, S.; Yao, S.Q.; Xu, Q.H.; et al. Gold nanorod enhanced two-photon excitation fluorescence of photosensitizers for two-photon imaging and photodynamic therapy. ACS Appl. Mater. Interfaces 2014, 6, 2700–2708. [Google Scholar] [CrossRef]
- Politi, J.; Spadavecchia, J.; Iodice, M.; De Stefano, L. Oligopeptide–heavy metal interaction monitoring by hybrid gold nanoparticle based assay. Analyst 2015, 140, 149–155. [Google Scholar] [CrossRef]
- Heinz, H.; Farmer, B.L.; Pandey, R.B.; Slocik, J.M.; Patnaik, S.S.; Pachter, R.; Naik, R.R. Nature of Molecular Interactions of Peptides with Gold, Palladium, and Pd-Au Bimetal Surfaces in Aqueous Solution. J. Am. Chem. Soc. 2009, 131, 9704–9714. [Google Scholar] [CrossRef]
- Heinz, H.; Vaia, R.A.; Farmer, B.L.; Naik, R.R. Accurate Simulation of Surfaces and Interfaces of Face-Centered Cubic Metals Using 12-6 and 9-6 Lennard-Jones Potentials. J. Phys. Chem. C 2008, 112, 17281–17290. [Google Scholar] [CrossRef]
- Venditti, I.; Hassanein, T.F.; Fratoddi, I.; Fontana, L.; Battocchio, C.; Rinaldi, F.; Carafa, M.; Marianecci, C.; Diociaiuti, M.; Agostinelli, E.; et al. Bioconjugation of gold-polymer core-shell nanoparticles with bovine serum amine oxidase for biomedical applications. Colloids Surf. B Biointerfaces. 2015, 134, 314–321. [Google Scholar] [CrossRef]
- Yokoyama, K. Nanoscale Surface Size Dependence in Protein Conjugation. In Advances in Nanotechnology; Chen, E.J., Peng, N., Eds.; Nova Science Publishing: Hauppauge, NY, USA, 2010; pp. 65–104. [Google Scholar]
- Yokoyama, K. Modeling of Reversible Protein Conjugation on Nanoscale Surface. In Computational Nanotechnology: Modeling and Applications with MATLAB; Musa, S.M., Ed.; CRC Press-Taylor and Francis Group, LLC: Boca Raton, FL, USA, 2011; pp. 381–410. [Google Scholar]
- Yokoyama, K. Nano Size Dependent Properties of Colloidal Surfaces. In Colloids: Classification, Properties and Applications; Ray, P.C., Ed.; Nova Science Publishing: Hauppauge, NY, USA, 2012; pp. 25–58. [Google Scholar]
- Kowalewski, T.; Holtzman, D.M. In situ atomic force microscopy study of Alzheimer’s beta-amyloid peptide on different substrates: New insights into mechanism of beta-sheet formation. Proc. Natl. Acad. Sci. USA 1999, 96, 3688–3693. [Google Scholar] [CrossRef] [PubMed]
- Schladitz, C.; Vieira, E.P.; Hermel, H.; Mohwald, H. Amyloid-beta-sheet formation at the air-water interface. Biophys. J. 1999, 77, 3305–3310. [Google Scholar] [CrossRef]
- Kusumoto, Y.; Lomakin, A.; Teplow, D.B.; Benedek, G.B. Temperature dependence of amyloid beta-protein fibrillization. Proc. Natl. Acad. Sci. USA 1998, 95, 12277–12282. [Google Scholar] [CrossRef] [PubMed]
- Coles, M.; Bicknell, W.; Watson, A.A.; Fairlie, D.P.; Craik, D.J. Solution structure of amyloid beta-peptide(1–40) in a water-micelle environment. Is the membranespanning domain where we think it is? Biochemistry 1998, 37, 11064–11077. [Google Scholar] [CrossRef] [PubMed]
- Shao, H.Y.; Jao, S.C.; Ma, K.; Zagorski, M.G. Solution structures of micelle-bound amyloid beta-(1–40) and beta-(1–42) peptides of Alzheimer’s disease. J. Mol. Biol. 1999, 285, 755–773. [Google Scholar] [CrossRef]
- Giacomelli, C.E.; Norde, W. Conformational changes of the amyloid beta-peptide(1-40) adsorbed on solid surfaces. Macromol. Biosci. 2005, 5, 401–407. [Google Scholar] [CrossRef]
- Rocha, S.; Krastev, R.; Thunemann, A.F.; Pereira, M.C.; Mohwald, H.; Brezesinski, G. Adsorption of amyloid beta-peptide at polymer surfaces: A neutron reflectivity study. Chem. Phys. Chem. 2005, 6, 2527–2534. [Google Scholar] [CrossRef]
- Moshe, A.; Landau, M.; Eisenberg, D. Preparation of Crystalline Samples of Amyloid Fibrils and Oligomers. Methods Mol. Biol. 2016, 1345, 201–210. [Google Scholar]
- Scarff, C.A.; Ashcroft, A.E.; Radford, S.E. Characterization of Amyloid Oligomers by Electrospray Ionization-Ion Mobility Spectrometry-Mass Spectrometry (ESI-IMS-MS). Methods Mol. Biol. 2016, 1345, 115–132. [Google Scholar]
- Pujol-Pina, R.; Vilapriny-Pascual, S.; Mazzucato, R.; Arcella, A.; Vilaseca, M.; Orozco, M.; Carulla, N. SDS-PAGE analysis of Aβ oligomers is disserving research into Alzheimer’s disease: Appealing for ESI-IM-MS. Sci. Rep. 2015, 5, 14809–14821. [Google Scholar]
- El-Shimy, I.A.; Heikal, O.A.; Hamdi, N. Minocycline attenuates Aβ oligomers-induced pro-inflammatory phenotype in primary microglia while enhancing Aβ fibrils phagocytosis. Neurosci. Lett. 2015, 609, 36–41. [Google Scholar] [CrossRef] [PubMed]
- Attanasio, F.; Convertino, M.; Magno, A.; Caflisch, A.; Corazza, A.; Haridas, H.; Esposito, G.; Cataldo, S.; Pignataro, B.; Milardi, D.; et al. Carnosine Inhibits Ab42 Aggregation by Perturbing the HBond Network in and around the Central Hydrophobic Cluster. ChemBioChem 2013, 14, 583–592. [Google Scholar] [CrossRef] [PubMed]
- Liu, G.; Aliaga, L.; Cai, H. α-synuclein, LRRK2 and their interplay in Parkinson’s disease. Future Neurol. 2012, 7, 145–153. [Google Scholar] [CrossRef] [PubMed]
- Paslawski, W.; Andreasen, M.; Nielsen, S.B.; Lorenzen, N.; Thomsen, K.; Kaspersen, J.D.; Pedersen, J.S.; Otzen, D.E. High Stability and Cooperative Unfolding of α-Synuclein Oligomers. Biochemistry 2014, 53, 6252–6263. [Google Scholar] [CrossRef]
- Pchelina, N.; Nuzhnyi, E.P.; Emelyanov, A.K.; Boukinac, T.M.; Usenko, T.S.; Nikolaev, M.A.; Salogub, G.N.; Yakimovskii, A.F.; Zakharova, E.Y. Increased plasma oligomeric alpha-synuclein in patients withlysosomal storage diseases. Neurosci. Lett. 2014, 583, 188–193. [Google Scholar] [CrossRef]
- van Rooijen, B.D.; Claessens, M.M.A.E.; Subramaniam, V. Lipid bilayer disruption by oligomeric α-synuclein depends on bilayer charge and accessibility of the hydrophobic core. Biochim. Biophys. Acta 2009, 1788, 1271–1278. [Google Scholar] [CrossRef]
- Vasudevaraiu, P.; Guerrero, E.; Hegda, M.L.; Collen, T.B.; Britton, G.B.; Rao, K.S. New evidence on alpha-synuclein and Tau binding to conformation and sequence specific GC* rich DNA: Relevance to neurological disorders. J. Pharm. Bioallied Sci. 2012, 4, 112–117. [Google Scholar]
- Comellas, G.; Lemkau, L.R.; Zhou, D.H.; George, J.M.; Rienstra, C.M. Structural Intermediates during α-Synuclein Fibrillogenesis on Phospholipid Vesicles. J. Am. Chem. Soc. 2012, 134, 5090–5099. [Google Scholar] [CrossRef]
- Fecchio, C.; De Franceschi, G.; Relini, A.; Greggio, E.; Dalla Serra, M.; Bubacco, L.; de Laureto, P.P. α-Synuclein Oligomers Induced by Docosahexaenoic Acid Affect Membrane Integrity. PLoS ONE 2013, 8, 1–12. [Google Scholar] [CrossRef]
- Esposito, G.; Garvey, M.; Alverdi, V.; Pettirossi, F.; Corazza, A.; Fogolari, F.; Polano, M.; Mangione, P.P.; Giorgetti, S.; Stoppini, M.; et al. Monitoring the Interaction between β2-Microglobulin and the Molecular Chaperone alpha B-crystallin by NMR and Mass Spectrometry: α B-Crystallin dissociates β2-Microglobulin Oligomers. J. Biol. Chem. 2013, 288, 17844–17858. [Google Scholar] [CrossRef]
- Esposito, G.; Corazza, A.; Bellotti, V. Pathological Self-Aggregation of β2-Microglobulin: A Challenge for Protein Biophysics. In Protein Aggregation and Fibrillogenesis in Cerebral and Systemic Amyloid Disease, Subcellular Biochemistry; Harris, J.R., Ed.; Springer: Berlin, Germany, 2012; Volume 65, pp. 165–182. [Google Scholar]
- Mustata, M.; Capone, R.; Jang, H.; Arce, F.T.; Ramachandran, S.; Lal, R.; Nussinov, R. K3 fragment of amyloidogenic β2-microglobulin forms ion channels: Implication for dialysis related amyloidosis. J. Am. Chem Soc. 2009, 131, 14938–14945. [Google Scholar] [CrossRef]
- Yokoyama, K.; Catalfamo, C.D.; Yuan, M. Reversible Peptide Oligomerization over Nanosclae Gold Surfaces. Aims Biophys. 2015, 2, 679–695. [Google Scholar] [CrossRef]
- Ulmer, T.S.; Bax, A.; Cole, N.B.; Nussbaum, R.L. Strcture and dynamics of micelle-bound human α-synuclein. J. Biol. Chem. 2005, 280, 9595–9603. [Google Scholar] [CrossRef] [PubMed]
- Verdone, G.; Corazza, A.; Viglino, P.; Pettirossi, F.; Giorgetti, S.; Mangione, P.; Andreola, A.; Stoppini, M.; Bellotti, V.; Esposito, G. The solution structure of human beta2-microglobulin reveals the prodromes of its amyloid transition. Protein Sci. 2002, 11, 487–499. [Google Scholar] [CrossRef] [PubMed]
- Yokoyama, K.; Welchons, D.R. The conjugation of amyloid beta protein on the gold colloidal nanoparticles’ surfaces. Nanotechnology 2007, 18, 105101–105107. [Google Scholar] [CrossRef]
- Yokoyama, K.; Briglio, N.M.; Sri Hartati, D.; Tsang, S.M.W.; MacCormac, J.E.; Welchons, D.R. Nanoscale size dependence in the conjugation of amyloid beta and ovalbumin proteins on the surface of gold colloidal particles. Nanotechnology 2008, 19, 375101–375108. [Google Scholar] [CrossRef]
- Wang, A.; Perera, Y.R.; Davidson, M.B.; Fitzkee, N.C. Electrostatic Interactions and Protein Competition Reveal a Dynamic Surface in Gold Nanoparticle–Protein Adsorption. J. Phys. Chem. C 2016, 120, 24231–24239. [Google Scholar] [CrossRef]
- Kuna, J.J.; Voïtchovsky, K.; Singh, C.; Jiang, H.; Mwenifumbo, S.; Ghorai, P.K.; Stevens, M.M.; Glotzer, S.C.; Stellacci, F. The effect of nanometre-scale structure on interfacial energy. Nat. Mater. 2009, 8, 837–842. [Google Scholar] [CrossRef] [Green Version]
- DeVries, G.A.; Brunnbauer, M.; Hu, Y.; Jackson, A.M.; Long, B.; Neltner, B.T.; Uzun, O.; Wunsch, B.H.; Stellacci, F. Divalent Metal Nanoparticles. Science 2007, 315, 358–361. [Google Scholar] [CrossRef] [Green Version]
- Jackson, A.M.; Myerson, J.W.; Stellacci, F. Spontaneous assembly of subnanometreordered domains in the ligand shell of monolayer-protected nanoparticles. Nat. Mater. 2004, 3, 330–336. [Google Scholar] [CrossRef]
- Singh, C.; Ghorai, P.K.; Horsch, M.A.; Jackson, A.M.; Larson, R.G.; Stellacci, F.; Glotzer, S.C. Entropy-Mediated Patterning of Surfactant-Coated Nanoparticles and Surfaces. Phys. Rev. Lett. 2007, 99, 1–3. [Google Scholar] [CrossRef] [PubMed]
- Verma, A.; Uzun, O.; Hu, Y.; Hu, Y.; Han, H.-S.; Watson, N.; Chen, S.; Irvine, D.J.; Stellacci, F. Surface-structure-regulated cell-membrane penetration by monolayer-protected nanoparticles. Nat. Mater. 2008, 7, 588–595. [Google Scholar] [CrossRef] [PubMed]
- Yuan, J.; Liu, X.; Akbulut, O.; Hu, J.; Suib, S.L.; Kong, J.; Stellacci, F. Superwetting nanowire membranes for selective absorption. Nat. Nanotechnol. 2008, 3, 332–336. [Google Scholar] [CrossRef] [PubMed]
- Voı¨tchovsky, K.; Kuna, J.J.; Contera, S.A.; Tosatti, E.; Stellacci, F. Direct mapping of the solid–liquid adhesion energy with subnanometre resolution. Nat. Nanotechnol. 2010, 5, 401–405. [Google Scholar] [CrossRef]
- Davidson, W.S.; Jonas, A.; Clayton, D.F.; George, J.M. Stabilization of alpha-synuclein secondary structure upon binding to synthetic membranes. J. Biol. Chem. 1998, 273, 9443–9449. [Google Scholar] [CrossRef]
- George, J.M.; Jin, H.; Woods, W.S.; Clayton, D.F. Characterization of a novel protein regulated during the critical period for song learning in the zebra finch. Neuron 1995, 15, 361–372. [Google Scholar] [CrossRef] [Green Version]
- Platt, G.W.; Routledge, K.E.; Homans, S.W.; Radford, S.E. Fibril Growth Kinetics Reveal a Region of β2-microglobulin Important for Nucleation and Elongation of Aggregation. J. Mol. Biol. 2008, 378, 251–263. [Google Scholar] [CrossRef]
- D’Ambrosio, E.; Ralbovsky, N.; Yokoyama, K. Direct probing of the reversible selfassembly of amyloid beta peptide oligomers over nanoscale metal colloidal surfaces. In Proceedings of the 251st ACS National Meeting & Exposition, San Diego, CA, USA, March 13–17 2016. [Google Scholar]
- Yokoyama, K.; Gaulin, N.B.; Cho, H.; Briglio, N.M. Temperature Dependence of Conjugation of Amyloid Beta Peptide on the Gold Colloidal Nanoparticles. J. Phys. Chem. A 2010, 114, 1521–1528. [Google Scholar] [CrossRef]
- Yokoyama, K.; Ichiki, A. Peptide adsorption orientation. In Oligomerization; NOVA Science Publisher; In Preparation.
- Yang, J.A.; Johnson, B.J.; Wu, S.; Woods, W.S.; George, J.M.; Murphy, C.J. Study of Wild-Type α-Synuclein Binding and Orientation on Gold Nanoparticles. Langmuir 2013, 29, 4603–4615. [Google Scholar] [CrossRef]
- Jang, S.; Shin, S. Computational study on the structural diversity of amyloid beta peptide (Aβ10–35) Oligomers. J. Phys. Chem. B 2008, 112, 3479–3484. [Google Scholar] [CrossRef]
- Fraser, P.E.; Nguyen, J.T.; Surewicz, W.K.; Kirschner, D.A. pH-dependent structural transitions of Alzheimer amyloid peptides. Biophys. J. 1991, 60, 1190–1201. [Google Scholar] [CrossRef] [Green Version]
- Shen, C.L.; Scott, G.L.; Merchant, F.; Murphy, R.M. Light scattering analysis of fibril growth from the amino-terminal fragment beta(1-28) of beta-amyloid peptide. Biophys. J. 1993, 65, 2383–2395. [Google Scholar] [CrossRef]
- Inouye, H.; Fraser, P.E.; Kirshner, D.A. Structure of -crystallite assemblies formed by Alzheimer-amyloid protein analogues: Analysis by X-ray diffraction. Biophys. J. 1993, 64, 502–519. [Google Scholar] [CrossRef]
- Lomakin, A.; Chung, D.S.; Benedek, G.B.; Kirshner, D.A.; Teplow, D.B. On the nucleation and growth of amyloid -protein fibrils: Detection of nuclei and quantitation of rate constants. Proc. Natl. Acad. Sci. USA 1996, 93, 1125–1129. [Google Scholar] [CrossRef]
- Vine, H.L. Soluble multimeric Alzheimer (1-40) pre-amyloid complexes in dilute solution. Neurobiol. Aging 1995, 16, 755–764. [Google Scholar]
- Kuo, Y.M.; Emmerling, M.R.; Vigo-Pelfrey, C.; Kasunic, T.C.; Kirkpatrick, J.B.; Murdoch, G.H.; Ball, M.J.; Roher, A.E. Water-soluble A (N-40, N-42) oligomers in normal and Alzheimer disease brains. J. Biol. Chem. 1996, 271, 4077–4081. [Google Scholar] [CrossRef]
- Lambert, M.P.; Barlow, A.K.; Chromy, B.A.; Edwards, C.; Freed, R.; Liosatos, M.; Morgan, T.E.; Rozovsky, I.; Trommer, B.; Viola, K.L.; et al. Diffusible, nonfibrillar ligands derived from A 1-42 are potent central nervous system neurotoxins. Proc. Natl. Acad. Sci. USA 1998, 95, 6448–6453. [Google Scholar] [CrossRef]
- Teller, J.K.; Russo, C.; DeBusk, L.M.; Angelini, G.; Zaccheo, D.; Dagna-Bricarelli, F.; Scartezzini, P.; Bertolini, S.; Mann, D.M.; Tabaton, M.; et al. Presence of soluble amyloid beta-peptide precedes amyloid plaque formation in Down’s syndrome. Nat. Med. 1996, 2, 93–95. [Google Scholar] [CrossRef]
- Huang, T.H.J.; Yang, D.S.; Plaskos, N.P.; Go, S.; Yip, C.M.; Fraser, P.E.; Chakrabartty, A. Structural studies of soluble oligomers of the Alzheimer beta-amyloid peptide. J. Mol. Biol. 2000, 297, 73–87. [Google Scholar] [CrossRef]
- Garzon-Rodriguez, W.; Sepulveda-Bacerra, M.; Milton, S.; Glable, C.G. Soluble amyloid A-(1-40) exists as a stable dimer at low concentrations. J. Biol. Chem. 1997, 272, 21037–21044. [Google Scholar] [CrossRef]
- Barrow, C.J.; Zagorski, M.G. Solution structures of peptide and its constituent fragments: Relation to amyloid deposition. Science 1991, 253, 179–182. [Google Scholar] [CrossRef] [PubMed]
- Barrow, C.J.; Yasuda, A.; Kenny, P.T.; Zagorski, M.G. Solution conformations and aggregational properties of synthetic amyloid beta-peptides of Alzheimer’s disease. Analysis of circular dichroism spectra. J. Mol. Biol. 1992, 225, 1075–1093. [Google Scholar] [CrossRef]
- Zagorski, M.G.; Barrow, C.J. NMR studies of amyloid beta-peptides: Proton assignments, secondary structure, and mechanism of an alpha-helix----beta-sheet conversion for a homologous, 28-residue, N-terminal fragment. Biochemistry 1992, 31, 5621–5631. [Google Scholar] [CrossRef] [PubMed]
- Walsh, D.M.; Lomakin, A.; Benedek, G.B.; Condron, M.M.; Teplow, D.B. Amyloid -protein fibrillogenesis. J. Biol. Chem. 1997, 272, 22364–22372. [Google Scholar] [CrossRef]
- Crawford, F.; Soto, C.; Suo, Z.; Fang, C.; Parker, T.; Sawar, A.; Frangione, B.; Mullan, M. Alzheimer’s -amyloid vasoactivity: Identification of a novel -amyloid conformational intermediate. FEBS Lett. 1998, 436, 445–448. [Google Scholar] [CrossRef]
- Link, S.; El-Sayed, M. Spectral properties and relaxation dynamics of surface plasmon electronic oscillations in gold and silver nanodots and nanorods. J. Phys. Chem. B 1999, 103, 8410–8426. [Google Scholar] [CrossRef]
- Kelly, K.L.; Coronado, E.; Zhao, L.L.; Schatz, G.C. The optical properties of metal nanoparticles: The influence of size, shape, and dielectric environment. J. Phys. Chem. B 2003, 107, 668–677. [Google Scholar] [CrossRef]
- Jensen, T.R.; Schatz, G.C.; Van Duyne, R.P. Nanosphere lithography: Surface plasmon resonance spectrum of a periodic array of silver nanoparticles by ultraviolet–visible extinction spectroscopy and electrodynamic modeling. J. Phys. Chem. B 1999, 103, 2394–2401. [Google Scholar] [CrossRef]


| Gold Colloidal Size (Diameter d nm) | (Δ) | (η) |
|---|---|---|
| 10 | 2.2 ± 0.6 | 25 ± 39 |
| 30 | 1.9 ± 0.7 | 123 ± 130 |
| 60 | 2.0 ± 0.7 | 39 ± 38 |
| 80 | 2.1 ± 0.5 | 17 ± 13 |
| d (d) | Aβ1–40 | α-syn | β2m |
|---|---|---|---|
| 10 (9.8) | 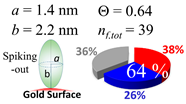 |  |  |
| 15 (15.2) |  |  |  |
| 20 (19.7) |  |  |  |
| 30 (30.7) |  |  |  |
| 40 (40.6) |  |  |  |
| 50 (51.5) |  |  |  |
| 60 (60.0) |  |  |  |
| 80 (80.0) |  |  |  |
| 100 (99.5) |  |  |  |
| (a) Aβ1–40 | |||
| d (d) | 99.5 (100) nm | ||
| b | 2.200 nm | ||
| ag | 3.720 nm | ||
| θτ | 57.7° | ||
| θβ | 0.155° | ||
| bg | 0.905 nm | ||
| θτ | 11.9° | ||
| θβ | 0.565° | ||
| (θτ) | 35 ± 2° | ||
| (b) α-syn | |||
| d (d) | 99.5 (100) nm | ||
| b | 7.400 nm | ||
| ag | 7.400 nm | ||
| θτ | 30.0° | ||
| θβ | 0.000° | ||
| bg | 1.40 nm | ||
| θτ | 5.4° | ||
| θβ | 0.127° | ||
| (θτ) | 18 ± 2° | ||
| (c) β2m | |||
| d (d) | 9.80 (10) nm | 19.7 (20) nm | 60.0 (60) nm |
| b | 4.6 nm | 4.6 nm | 4.6 nm |
| ag | 4.03 nm | 6.41 nm | 5.40 nm |
| θτ | 26.0° | 44.2° | 36.0° |
| θβ | 0.354° | 0.064° | 0.326° |
| bg | 2.70 nm | 2.73 nm | 4.80 nm |
| θτ | 17.1° | 17.3° | 31.4° |
| θβ | 0.508° | 0.234° | 0.060° |
| (θτ) | 29 ± 6° | ||
© 2019 by the authors. Licensee MDPI, Basel, Switzerland. This article is an open access article distributed under the terms and conditions of the Creative Commons Attribution (CC BY) license (http://creativecommons.org/licenses/by/4.0/).
Share and Cite
Yokoyama, K.; Brown, K.; Shevlin, P.; Jenkins, J.; D’Ambrosio, E.; Ralbovsky, N.; Battaglia, J.; Deshmukh, I.; Ichiki, A. Examination of Adsorption Orientation of Amyloidogenic Peptides Over Nano-Gold Colloidal Particle Surfaces. Int. J. Mol. Sci. 2019, 20, 5354. https://doi.org/10.3390/ijms20215354
Yokoyama K, Brown K, Shevlin P, Jenkins J, D’Ambrosio E, Ralbovsky N, Battaglia J, Deshmukh I, Ichiki A. Examination of Adsorption Orientation of Amyloidogenic Peptides Over Nano-Gold Colloidal Particle Surfaces. International Journal of Molecular Sciences. 2019; 20(21):5354. https://doi.org/10.3390/ijms20215354
Chicago/Turabian StyleYokoyama, Kazushige, Kieran Brown, Peter Shevlin, Jack Jenkins, Elizabeth D’Ambrosio, Nicole Ralbovsky, Jessica Battaglia, Ishan Deshmukh, and Akane Ichiki. 2019. "Examination of Adsorption Orientation of Amyloidogenic Peptides Over Nano-Gold Colloidal Particle Surfaces" International Journal of Molecular Sciences 20, no. 21: 5354. https://doi.org/10.3390/ijms20215354