Article

Comparison of Whole Plastome Sequences between Thermogenic Skunk Cabbage Symplocarpus renifolius and Nonthermogenic S. nipponicus (Orontioideae; Araceae) in East Asia

1
Department of Biological Sciences, Sungkyunkwan University, Suwon, Gyeonggi-do 16419, Korea
2
Research Institute for Dok-do and Ulleung-do Island, Department of Biology, Kyungpook National University, Daegu, Gyeongsangbuk-do 41566, Korea
3
InfoBoss Co. Ltd., Seoul 06088, Korea
4
Botanical Gardens, Tohoku University, Sendai 980-0862, Japan
*
Author to whom correspondence should be addressed.
These authors contributed equally.
Int. J. Mol. Sci. 2019, 20(19), 4678; https://doi.org/10.3390/ijms20194678
Submission received: 23 August 2019 / Revised: 11 September 2019 / Accepted: 17 September 2019 / Published: 20 September 2019
(This article belongs to the Section Molecular Plant Sciences)

Abstract

:
Symplocarpus, a skunk cabbage genus, includes two sister groups, which are drastically different in life history traits and thermogenesis, as follows: The nonthermogenic summer flowering S. nipponicus and thermogenic early spring flowering S. renifolius. Although the molecular basis of thermogenesis and complete chloroplast genome (plastome) of thermogenic S. renifolius have been well characterized, very little is known for that of S. nipponicus. We sequenced the complete plastomes of S. nipponicus sampled from Japan and Korea and compared them with that of S. renifolius sampled from Korea. The nonthermogenic S. nipponicus plastomes from Japan and Korea had 158,322 and 158,508 base pairs, respectively, which were slightly shorter than the thermogenic plastome of S. renifolius. No structural or content rearrangements between the species pairs were found. Six highly variable noncoding regions (psbC/trnS, petA/psbJ, trnS/trnG, trnC/petN, ycf4/cemA, and rpl3/rpl22) were identified between S. nipponicus and S. renifolius and 14 hot-spot regions were also identified at the subfamily level. We found a similar total number of SSR (simple sequence repeat) motifs in two accessions of S. nipponicus sampled from Japan and Korea. Phylogenetic analysis supported the basal position of subfamily Orontioideae and the monophyly of genus Symplocarpus, and also revealed an unexpected evolutionary relationship between S. nipponicus and S. renifolius.

1. Introduction

The skunk cabbage genus Symplocarpus Salisb. ex W.P.C.Barton belongs to the basal lineage known as Proto-Araceae of the arum family Araceae. It specifically belongs to the subfamily Orontioideae, which includes two other genera, Orontium L. and Lysichiton Schott [1,2]. While the monotypic genus Orontium occurs exclusively in the eastern United States, two genera, Lysichiton and Symplocarpus, are found in both eastern Asia (EAS) and western North America (WNA)/eastern North America (ENA), making these two genera an ideal system to study intercontinental disjunction in the Northern Hemisphere. In particular, genus Symplocarpus is of great interest for pollination biology and biogeography given its distribution pattern and thermogenesis that is characteristic of certain species. It includes five species (S. renifolius Schott ex Tzvelev, S. nipponicus Makino, S. foetidu (L.) Salisb. ex W.P.C.Barton, S. nabekuraensis Otsuka & K.Inoue, and S. egorovii N.S.Pavlova & V.A.Nechaev) and usually occurs in wet places and forest swamps [1,3,4]. Symplocarpus foetidus is the only species widely distributed in ENA and the remaining four species are found in EAS. Of the five species, S. renifolius and S. foetidus share flowering time in the early spring before the emergence of leaves and fruit ripening in the fall of the same year. The two species, especially the eastern Asian skunk cabbage S. renifolius, have been a subject of intensive study in thermogenesis. Blooming in early spring, often under snow, the plants can maintain a spadix temperature above 20 °C, despite ambient temperatures down to −14 °C [5,6,7,8,9,10]. Thermogenesis by flowers occurs convergently in several lineages of ancient seed plants (e.g., Araceae, Annonaceae, Cycadaceae, Magnoliaceae, Nelumbonaceae) and is known to be a direct energy reward for insect visitors by enhancing their activities [11,12,13]. Unlike thermogenic S. renifolius, its sister species, S. nipponicus, is not thermogenic and has a more spherical spadix while lacking precocious flowering. Its flowering season is in summer and its fruits ripen in the following spring [14]. Therefore, these two species have a sister relationship and demonstrate drastically different life history traits and thermogenesis during flowering. The phylogeny of Symplocarpus suggested that S. nipponicus is the earliest divergent lineage within the genus [1,15,16]. The chromosome numbers are also known for S. foetidus (2n = 4x = 60, tetraploid) and S. nipponicus (2n = 2x = 30, diploid), with a basic chromosome number of x = 15 [17]. The cytological evidence suggests that thermogenesis of S. renifolius was most likely evolved during or after polyploidization of nonthermogenic S. nipponicus. The divergence between S. nipponicus and S. renifolius was estimated to be 20.65 ± 6.44 million years ago (mya) based on the Bayesian molecular dating method [1].
Since the first whole chloroplast (cp) genome sequence was reported in the late 1980s, hundreds of plastomes have been characterized and utilized at various levels for phylogenetic analyses as well as DNA barcoding studies [18,19,20]. Typical angiosperm plastomes are 107–218 kilobase (kb) in length and contain 110–130 genes, with ~80 protein-coding genes, four rRNA-coding genes, and 30 tRNA-coding genes [21,22,23]. Several mutational hotspot regions, as well as some major and minor structural changes, were identified and utilized for molecular phylogenetic studies, providing insights into the molecular evolution of plastomes as well as taxonomic inferences [24,25,26,27]. Despite the taxonomic and biogeographic importance and the size of the Araceae family (117 genera and ca. 3790 species) [28], very few complete plastome sequences were assembled [29,30,31,32,33,34]. Furthermore, insufficient knowledge exists regarding the whole chloroplast genome sequences of the most basal lineage of Araceae, i.e., Proto-Araceae (including the two subfamilies Gymnostachydoideae and Orontioideae). One particular study of interest identified the complete cp genome sequence of S. renifolius sampled from Korea [35]. This study assembled the first cp genome of Symplocarpus and compared it to those of other Araceae species.
In the present study, we determined the complete plastome sequences of nonthermogenic eastern Asian S. nipponicus sampled from Japan and Korea and compared them with that of its thermogenic sister species S. renifolius, sampled from Korea. By comparing the thermogenic and nonthermogenic types of plastome sequences, we identified changes in the organization and structure of the cp genome between the two sister species, which diverged during the early Miocene and have drastically different life history traits and thermogenesis during flowering. In addition, we aimed to identify mutational hotspot regions and plastome-based simple sequence repeat (SSR) markers, which can be useful for improving the resolution of phylogenetic relationships at lower taxonomic levels.

2. Results and Discussion

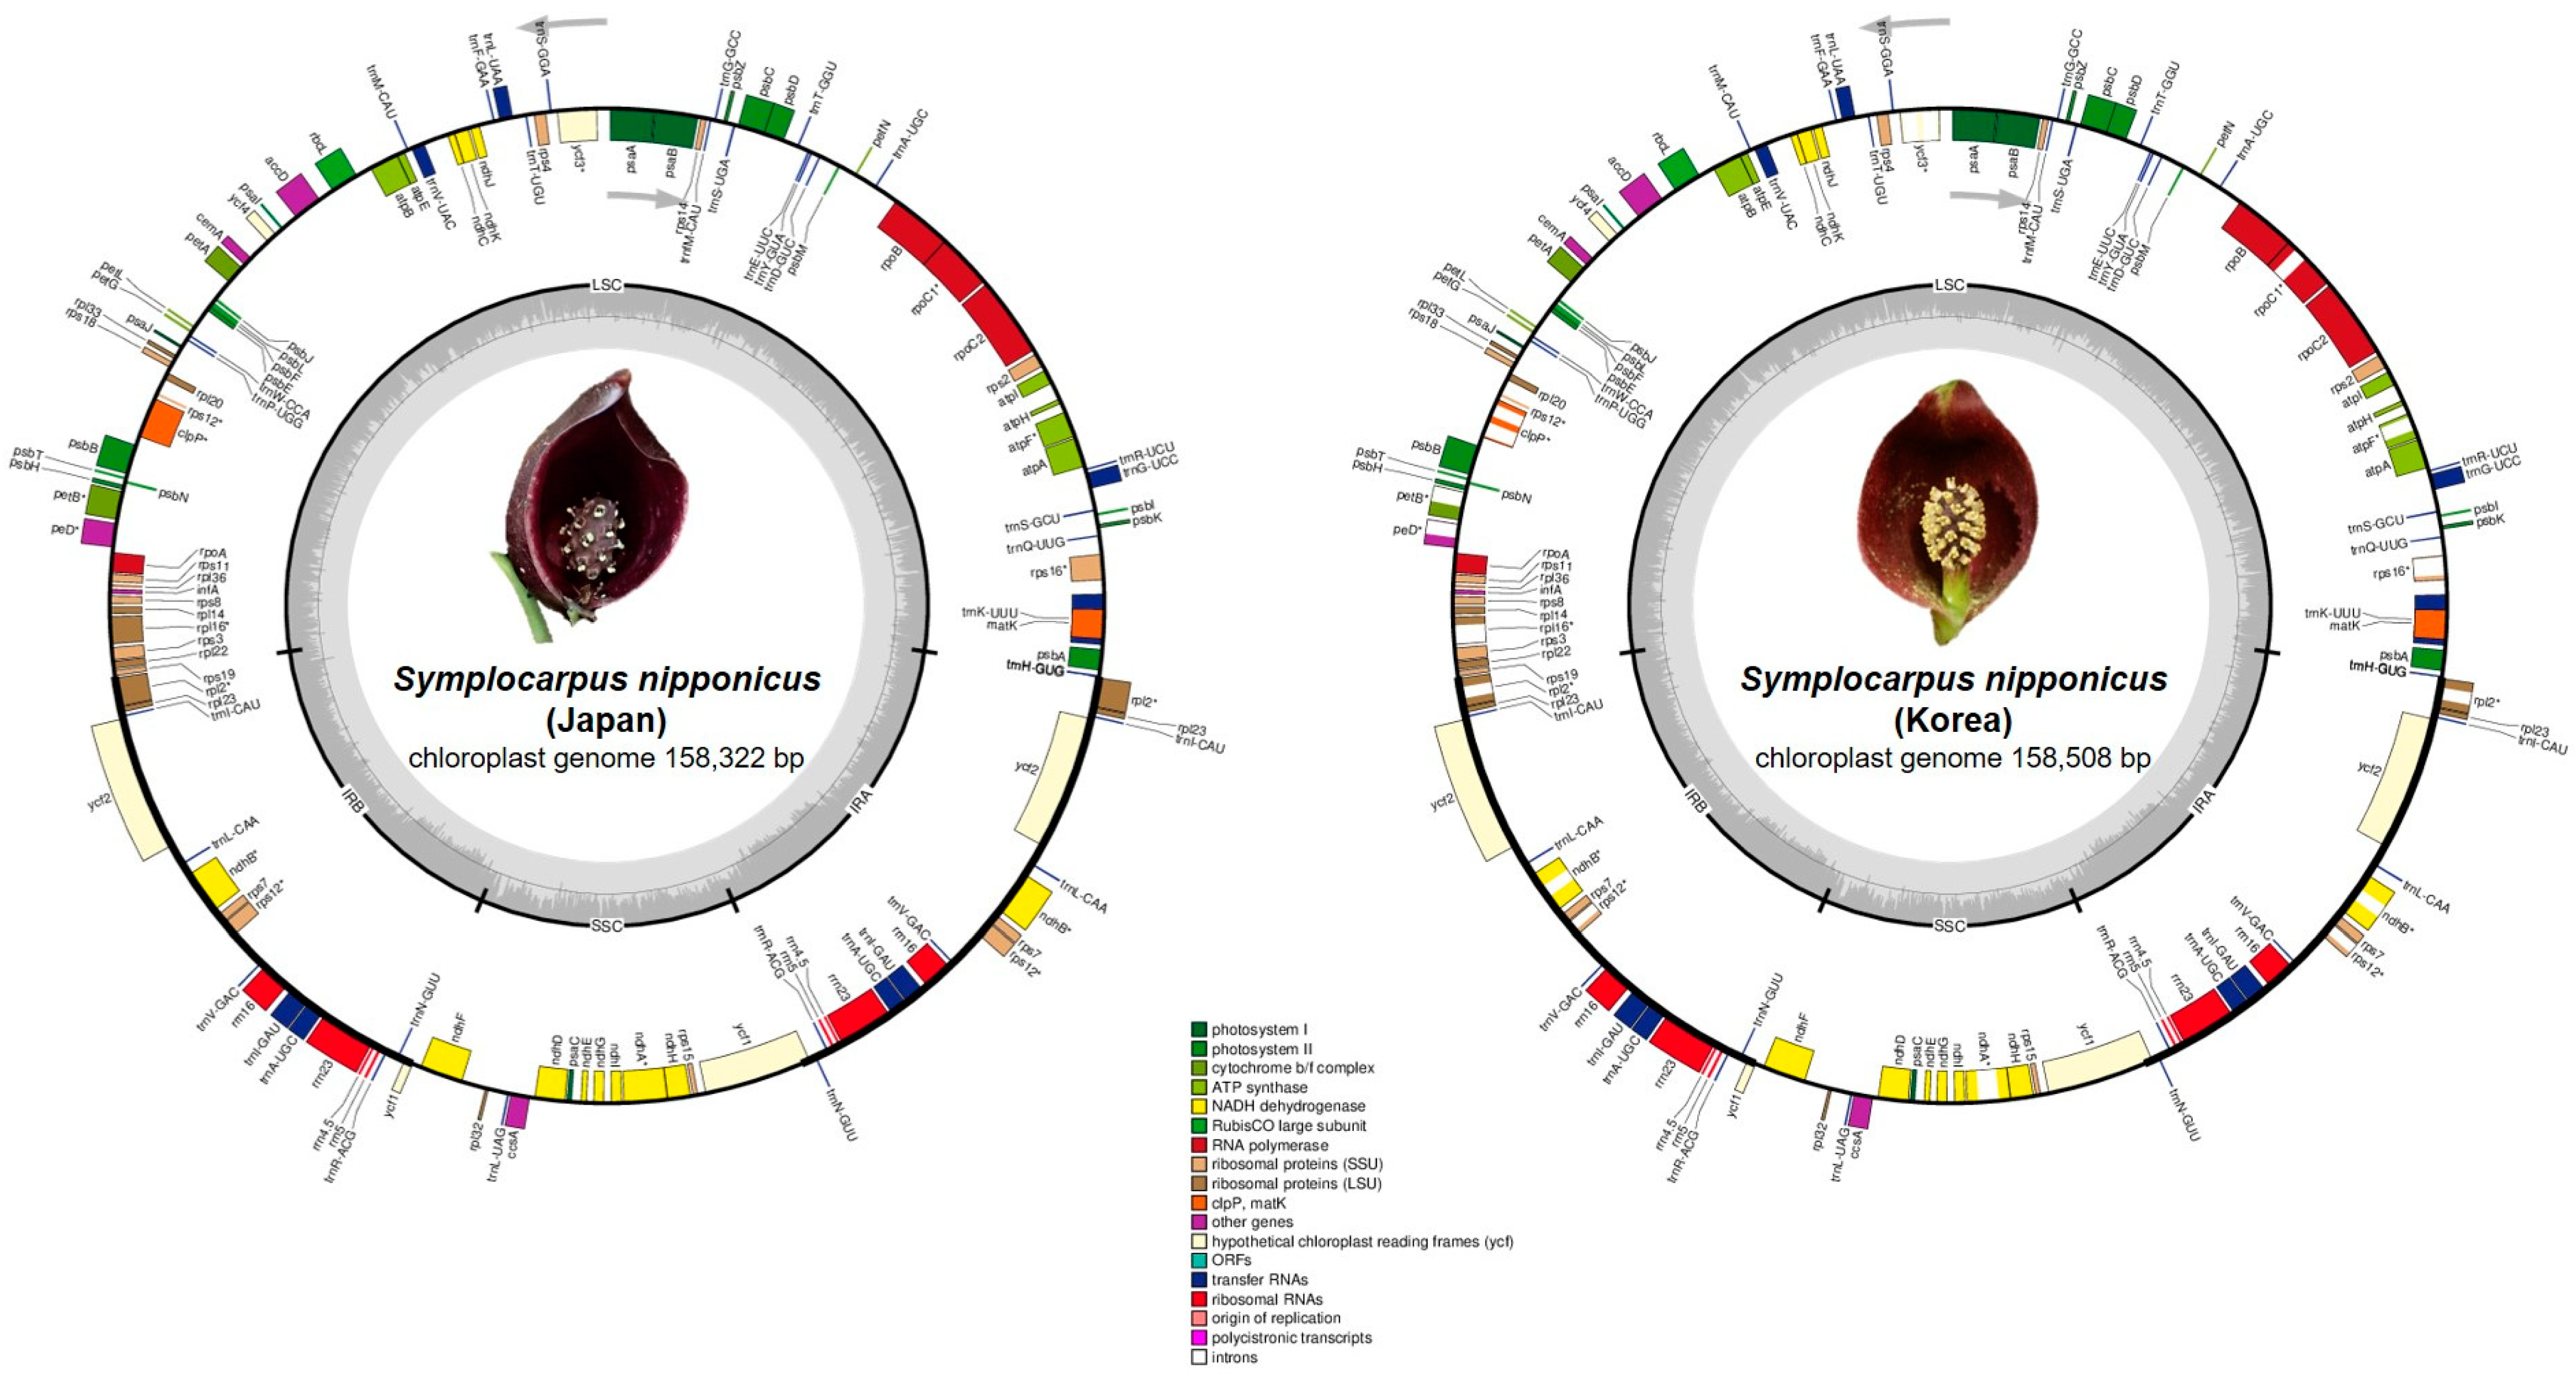
2.1. Genome Size and Features

The total plastome length of Symplocarpus nipponicus sampled from Japan was 158,322 base pairs (bp), with a large single copy (LSC) region of 86,433 bp, small single copy (SSC) region of 20,271 bp, and two inverted repeat (IR) regions (IRA and IRB) of 25,809 bp each. Symplocarpus nipponicus sampled from Korea was slightly longer, a total of 158,508 bp, with large single copy (LSC) region of 86,595bp, small single copy (SSC) region of 20,309 bp, and two inverted repeat (IR) regions of 25,802 bp (Figure 1, Table 1).
The two plastomes of S. nipponicus sampled from Japan and Korea contained an overall GC content of 37.4% (LSC, 34.9%; SSC, 31.0%; IRs, 43.8%) and 37.3% (LSC, 35.6%; SSC, 30.9; IR, 42.8%), respectively, and contained 130 genes, including 85 protein-coding, eight rRNA, and 37 tRNA genes (Figure 1). The complete plastome sequences of S. nipponicus sampled from Korea and Japan were nearly identical (a total of 158,104 bp identical sites; 99.7% similarity) and the S. nipponicus plastome sequence from Korea was 186 bp longer than that of S. nipponicus from Japan. The complete plastome sequences of S. nipponicus from Japan and S. renifolius from Korea showed 99.7% similarity (with a total of 158,130 bp identical sites) and the thermogenic S. renifolius plastome sequence from Korea was 199 bp longer than that of nonthermogenic S. nipponicus from Japan (Table 1).
A total of 17 genes were duplicated in the inverted repeat regions, including seven tRNA genes (trnN-GUU, trnR-ACG, trnA-UGC, trnI-UUC, trnV-GAC, trnL-CAA, and trnI-CAU), four rRNA genes (5S rRNA, 4.5S rRNA, 23S rRNA, and 16S rRNA), and six protein-coding genes (rps12, rps7, ndhB, ycf2, rpl23, and rpl2). Fifteen genes (ndhA, ndhB, petB, petD, rpl2, rpl16, rpoC1, rps12, rps16, trnA-UGC, trnG-UCC, trnI-UUC, trnK-UUU, trnL-UAA, and trnV-AUA) contained one intron, while clpP and ycf3 each contained two introns (Supplementary Table S1). In addition, the complete ycf1 gene was located in the IR region at the SSC/IRA junction.
The complete chloroplast genome of S. nipponicus was compared to ten available plastomes of Araceae (Colocasia, Dieffenbachia, Lemna, Spirodela, Wolffiella, Spathiphyllum, Zantedeschia, Pinellia, Epipremnum, and Wolffia) and S. nipponicus contained the smallest genome within the family [35]. The genus Symplocarpus represents the earliest diverged lineage within the family, i.e., the proto-Araceae, followed by sequential divergence of Lemnoideae (Spirodela, Lemna, and Wolffia) and Aroideae (Dieffenbachia and Colocasia) [28,36]. Given the cp genome size variations ranging from Symplocarpus nipponicus (158,322–158,508 bp) to Spirodela polyrhiza (168,788 bp) found in Araceae, any general trend in either an increase or decrease in genome size could not be postulated. Within proto-Araceae, genus Symplocarpus contained relatively smaller cp genome sizes compared to other members such as Gymnostachys and Orontium [37]. It is yet to be determined whether the plastome size is reduced relative to basic chromosome number in proto-Araceae. Furthermore, any plastome size differences and trends between diploids (2n = 2x = 30; S. nipponicus) and polyploids (2n = 4x = 60; S. renifolius, S. foetidus) within Symplocarpus require further study. Finally, it has been shown that the functional gene infA is highly variable as a pseudogene or missing gene within the family Araceae. However, like S. renifolius, infA of S. nipponicus was located in the LSC as an intact gene. In addition, psbZ was located between trnS-UGS and trnG-UCC in the LSC. When the two plastomes of thermogenic S. renifolius and nonthermogenic S. nipponicus were compared, the average value of nucleotide diversity (PI) was 0.00054, and six highly variable regions based on a significantly higher PI values of > 0.004 were identified. The regions that varied the most between S. nipponicus and S. renifolius were psbC/trnS and petA/psbJ intergenic regions, with a PI value of 0.0067 and 0.005 each, respectively. Four additional regions, including trnS/trnG, trnC/petN, ycf4/cemA, and rpl3/rpl22 intergenic regions were also highly variable, with a PI value of 0.00417. Future chloroplast-based phylogeographic studies would be greatly benefited by the application of these highly variable markers (Supplementary Figure S1).
The frequency of codon usage was calculated for the cp genome based on the sequences of protein coding genes and tRNA genes, which are summarized in Supplementary Table S2. The three plastomes of Symplocarpus (two accessions of S. nipponicus from Japan and Korea and one accession of S. renifolius from Korea) showed the same frequency of codon usage. The usage of AUG codon was especially shared with trnfM-CAU and trnI-CAU. The codon usage was biased toward a high representation of A and U at the third codon position, which was similar to the phenomenon observed in most land plant cp genes [38].
A total of 82 editing sites in 20 protein-coding genes were identified in S. nipponicus from Korea, while similar numbers (83 sites) were found in S. nipponicus from Japan (Supplementary Table S3). The ndhB gene had the highest number of potential editing sites (11), followed by the ndhD gene (8). In accordance with previous reports [39,40], we observed that most conversions at the codon positions changed from serine (S) to leucine (L) and most RNA editing sites led to amino acid changes from polar to apolar, which resulted in an increase in protein hydrophobicity. In addition, we found one more codon position changed from serine (S) to leucine (L) of petB gene in S. nipponicus from Japan than individual from Korea.
Overall, the average Ka/Ks ratio of the 71 common protein-coding genes analyzed in the 14 plastomes was 0.14. For each conserved gene, the total of nine (out of 71 genes) had an average Ka/Ks ratio below one for the 14 comparison groups, suggesting that these genes were subject to strong purifying selection pressures in Araceae chloroplasts. Those genes included one photosystem I subunit gene (psaI), two photosystem II subunit gene (psbB and psbM), three NADP dehydrogenase (ndhC, ndhF, and ndhG), one ribosome large subunit gene (rpl23), and one cytochrome c biogenesis maturase (matK). However, the majority (62 of 71 genes) had a Ka/Ks ratio of > 1, which suggests that these genes were positively selected within the Araceae family. Alocasia macrorhizos, Lemna minor, and Woffia australiana showed a high value of Ka/Ks > 1 in all 14 taxa comparison. In general, previous studies showed that Ka/Ks values are usually less than one [41] because synonymous nucleotide substitutions occur more frequently than nonsynonymous substitutions. Surprisingly, our results in the Araceae family suggested that most protein-coding genes underwent positive selection pressures (Figure 2).

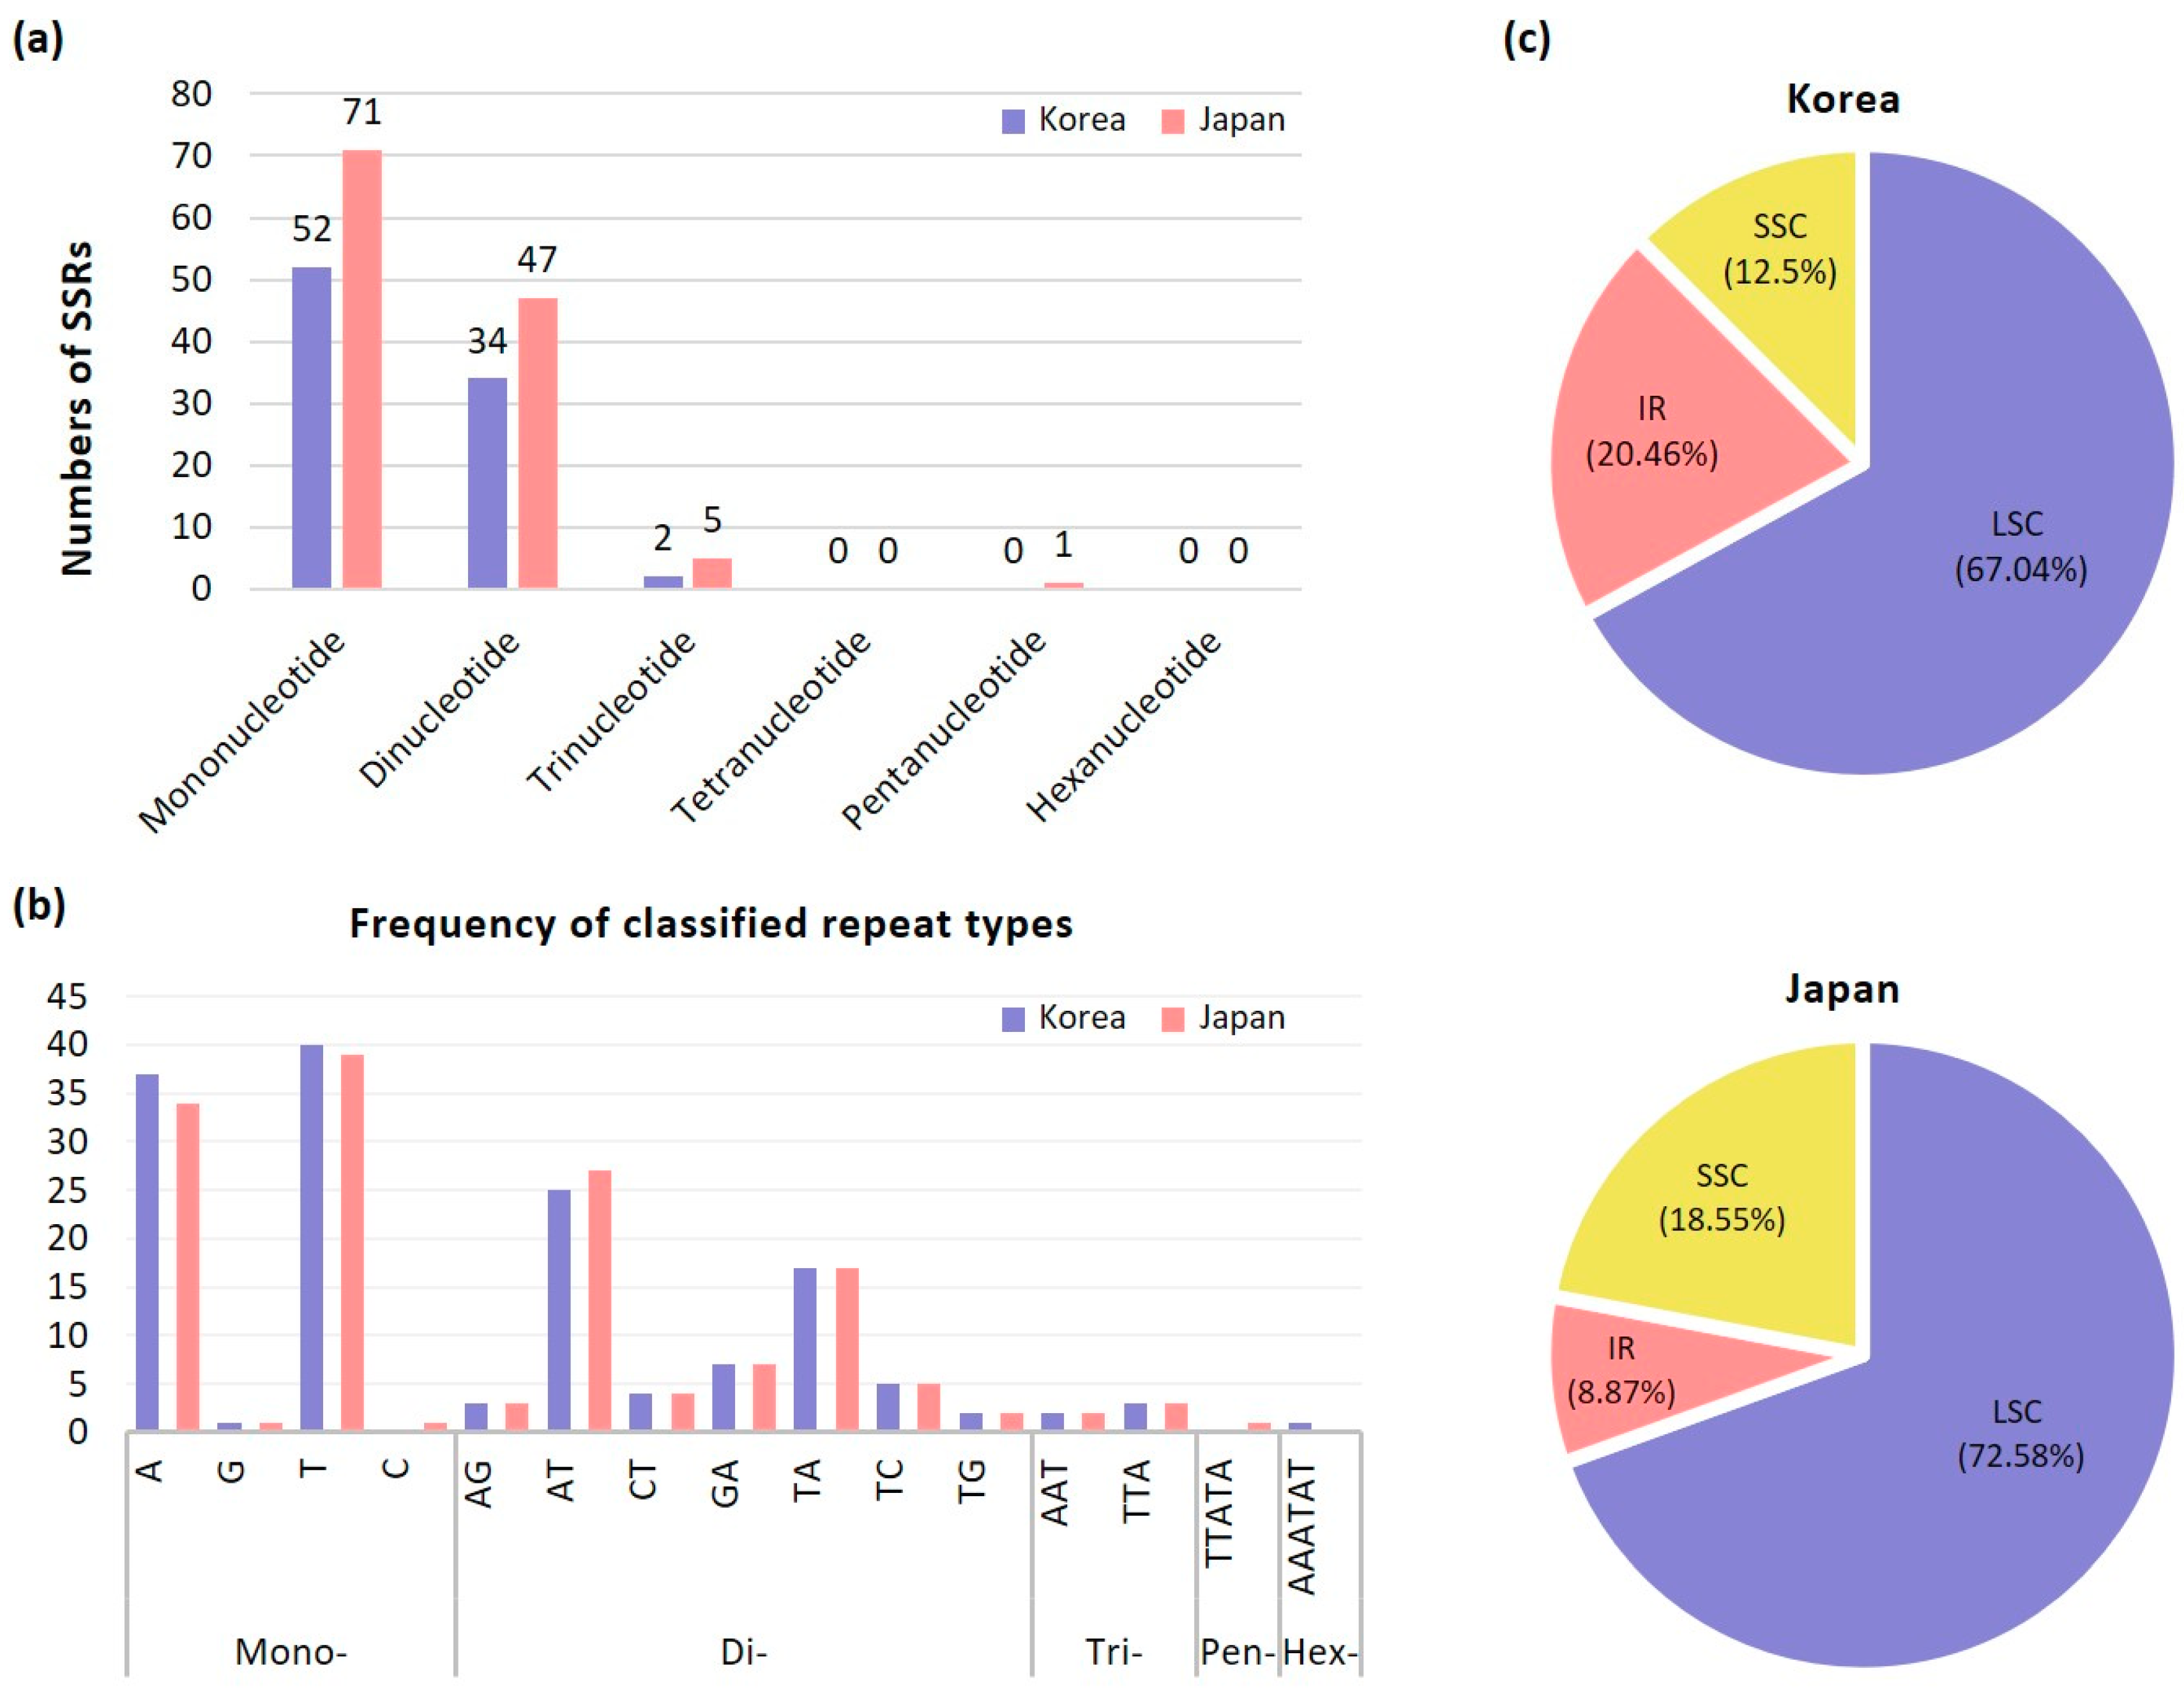
2.2. Microsatellites Analysis

We found similar number of SSR motifs between two accessions of S. nipponicus sampled from Japan and Korea. Of a total of 124 unique consensus SSRs identified from S. nipponicus in Japan (Supplementary Table S4), 90 (72.58%) were located in the LSC region, 23 (18.55%) in the SSC region, and 11 (8.87%) in the two IR regions (Figure 3). Most of the SSRs were located in intergenic regions (n = 71; 57.3%), whereas 22 (17.7%) were located in introns, 26 (21%) in protein coding genes, and 5 (4%) in tRNA and rRNA genes (trnI, trnS and 23S rRNA, respectively). Therefore, 75% of the SSRs were located in intergenic and intron regions, while only 25% were distributed in conserved genic regions. In addition, mononucleotide, dinucleotide, trinucleotide, and pentanucleotide repeats were detected in 71 (57.3%), 47 (37.9%), five (4%), and one (0.8%) unique consensus SSRs, respectively. No tetranucleotides and hexanucleotides were found. Of a total of 88 unique consensus SSRs identified from S. nipponicus in Korea (Supplementary Table S5), 59 (67.04%) were located in the LSC region, 11 (12.5%) in the SSC region, and 18 (20.46%) in the two IR regions.
Most of the SSRs were located in intergenic regions (n = 56; 63.6%), whereas 14 (15.9%) were located in introns, 15 (17.1%) in protein coding genes, and three (3.4%) in 23S rRNA genes. Therefore, 79.5% of the SSRs were located in intergenic and intron regions, while only 20.5% were distributed in conserved genic regions. In addition, mononucleotide, dinucleotide, and trinucleotide repeats were detected in 52 (59.09%), 34 (38.63%), and two (2.27%) unique consensus SSRs, respectively. No tetranucleotide, pentanucleotide, and hexanucleotides were found. Given the similar parameter settings of the MISA program to identify SSR motifs, we found slightly higher numbers of SSRs in the LSC region in S. nipponicus from Japan (90 SSRs; 72.58%) than in that of S. renifolius (85 SSRs; 70.25%), but significantly more than S. nipponicus from Korea (59 SSRs; 67.04%) [35]. However, we found slightly fewer numbers of SSR motifs in the SSC region of S. nipponicus (11 and 23 SSRs in accession from Korea and Japan, respectively) than in that of S. renifolius (30 SSRs), but significantly higher numbers in the IR regions (18 and 11 in accession of S. nipponicus from Korea and Japan, respectively and six in S. renifolius). The total number of SSR motifs found in these two congeneric species (Symplocarpus nipponicus and S. renifolius) was significantly higher than that in the members of Lemnoideae (66 in Wolffia, 77 in Wolffiella, 85 in Spirodela, and 71 in Lemna) [35]. It appears that there is no correlation between the plastome size and the total number of SSRs. In addition to highly variable cp markers for phylogeographic studies, cp SSR markers found in nonthermogenic S. nipponicus can be useful for future population-level studies of individual species or for comparative population genetic studies between intercontinental disjunct species pairs in eastern Asia (S. renifolius and S. nipponicus) and in eastern North America (S. foetidus).

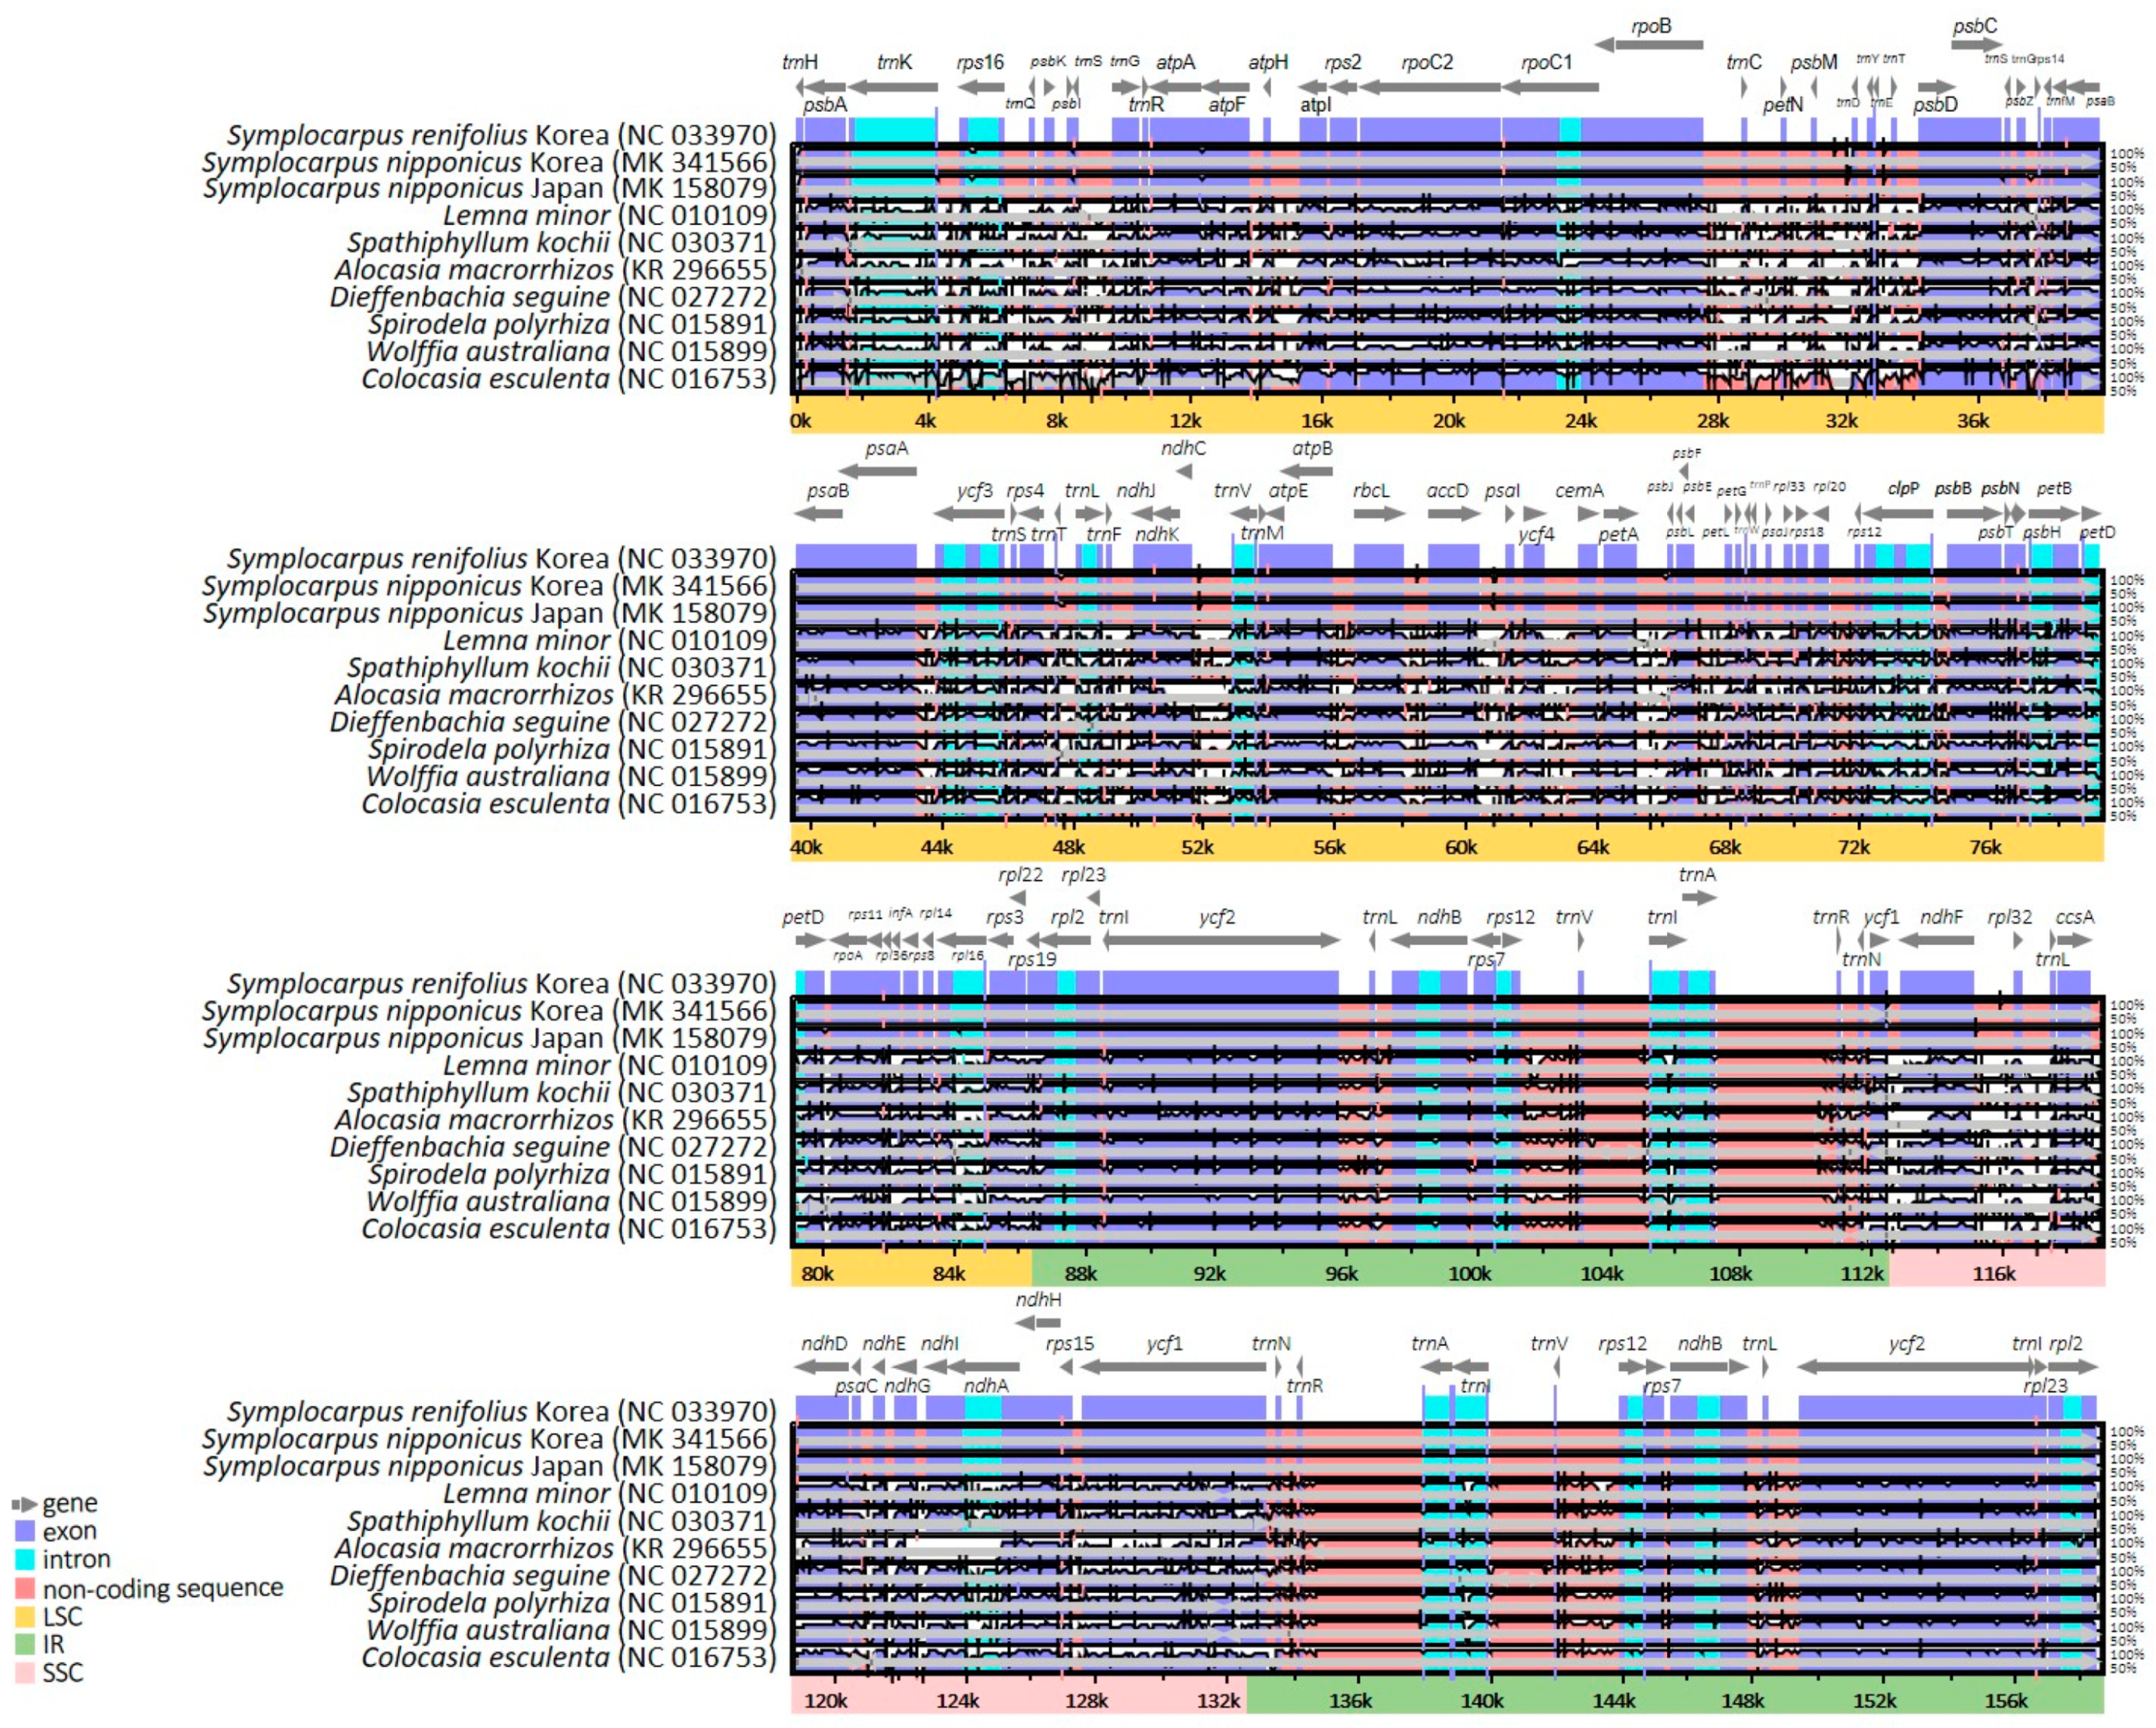
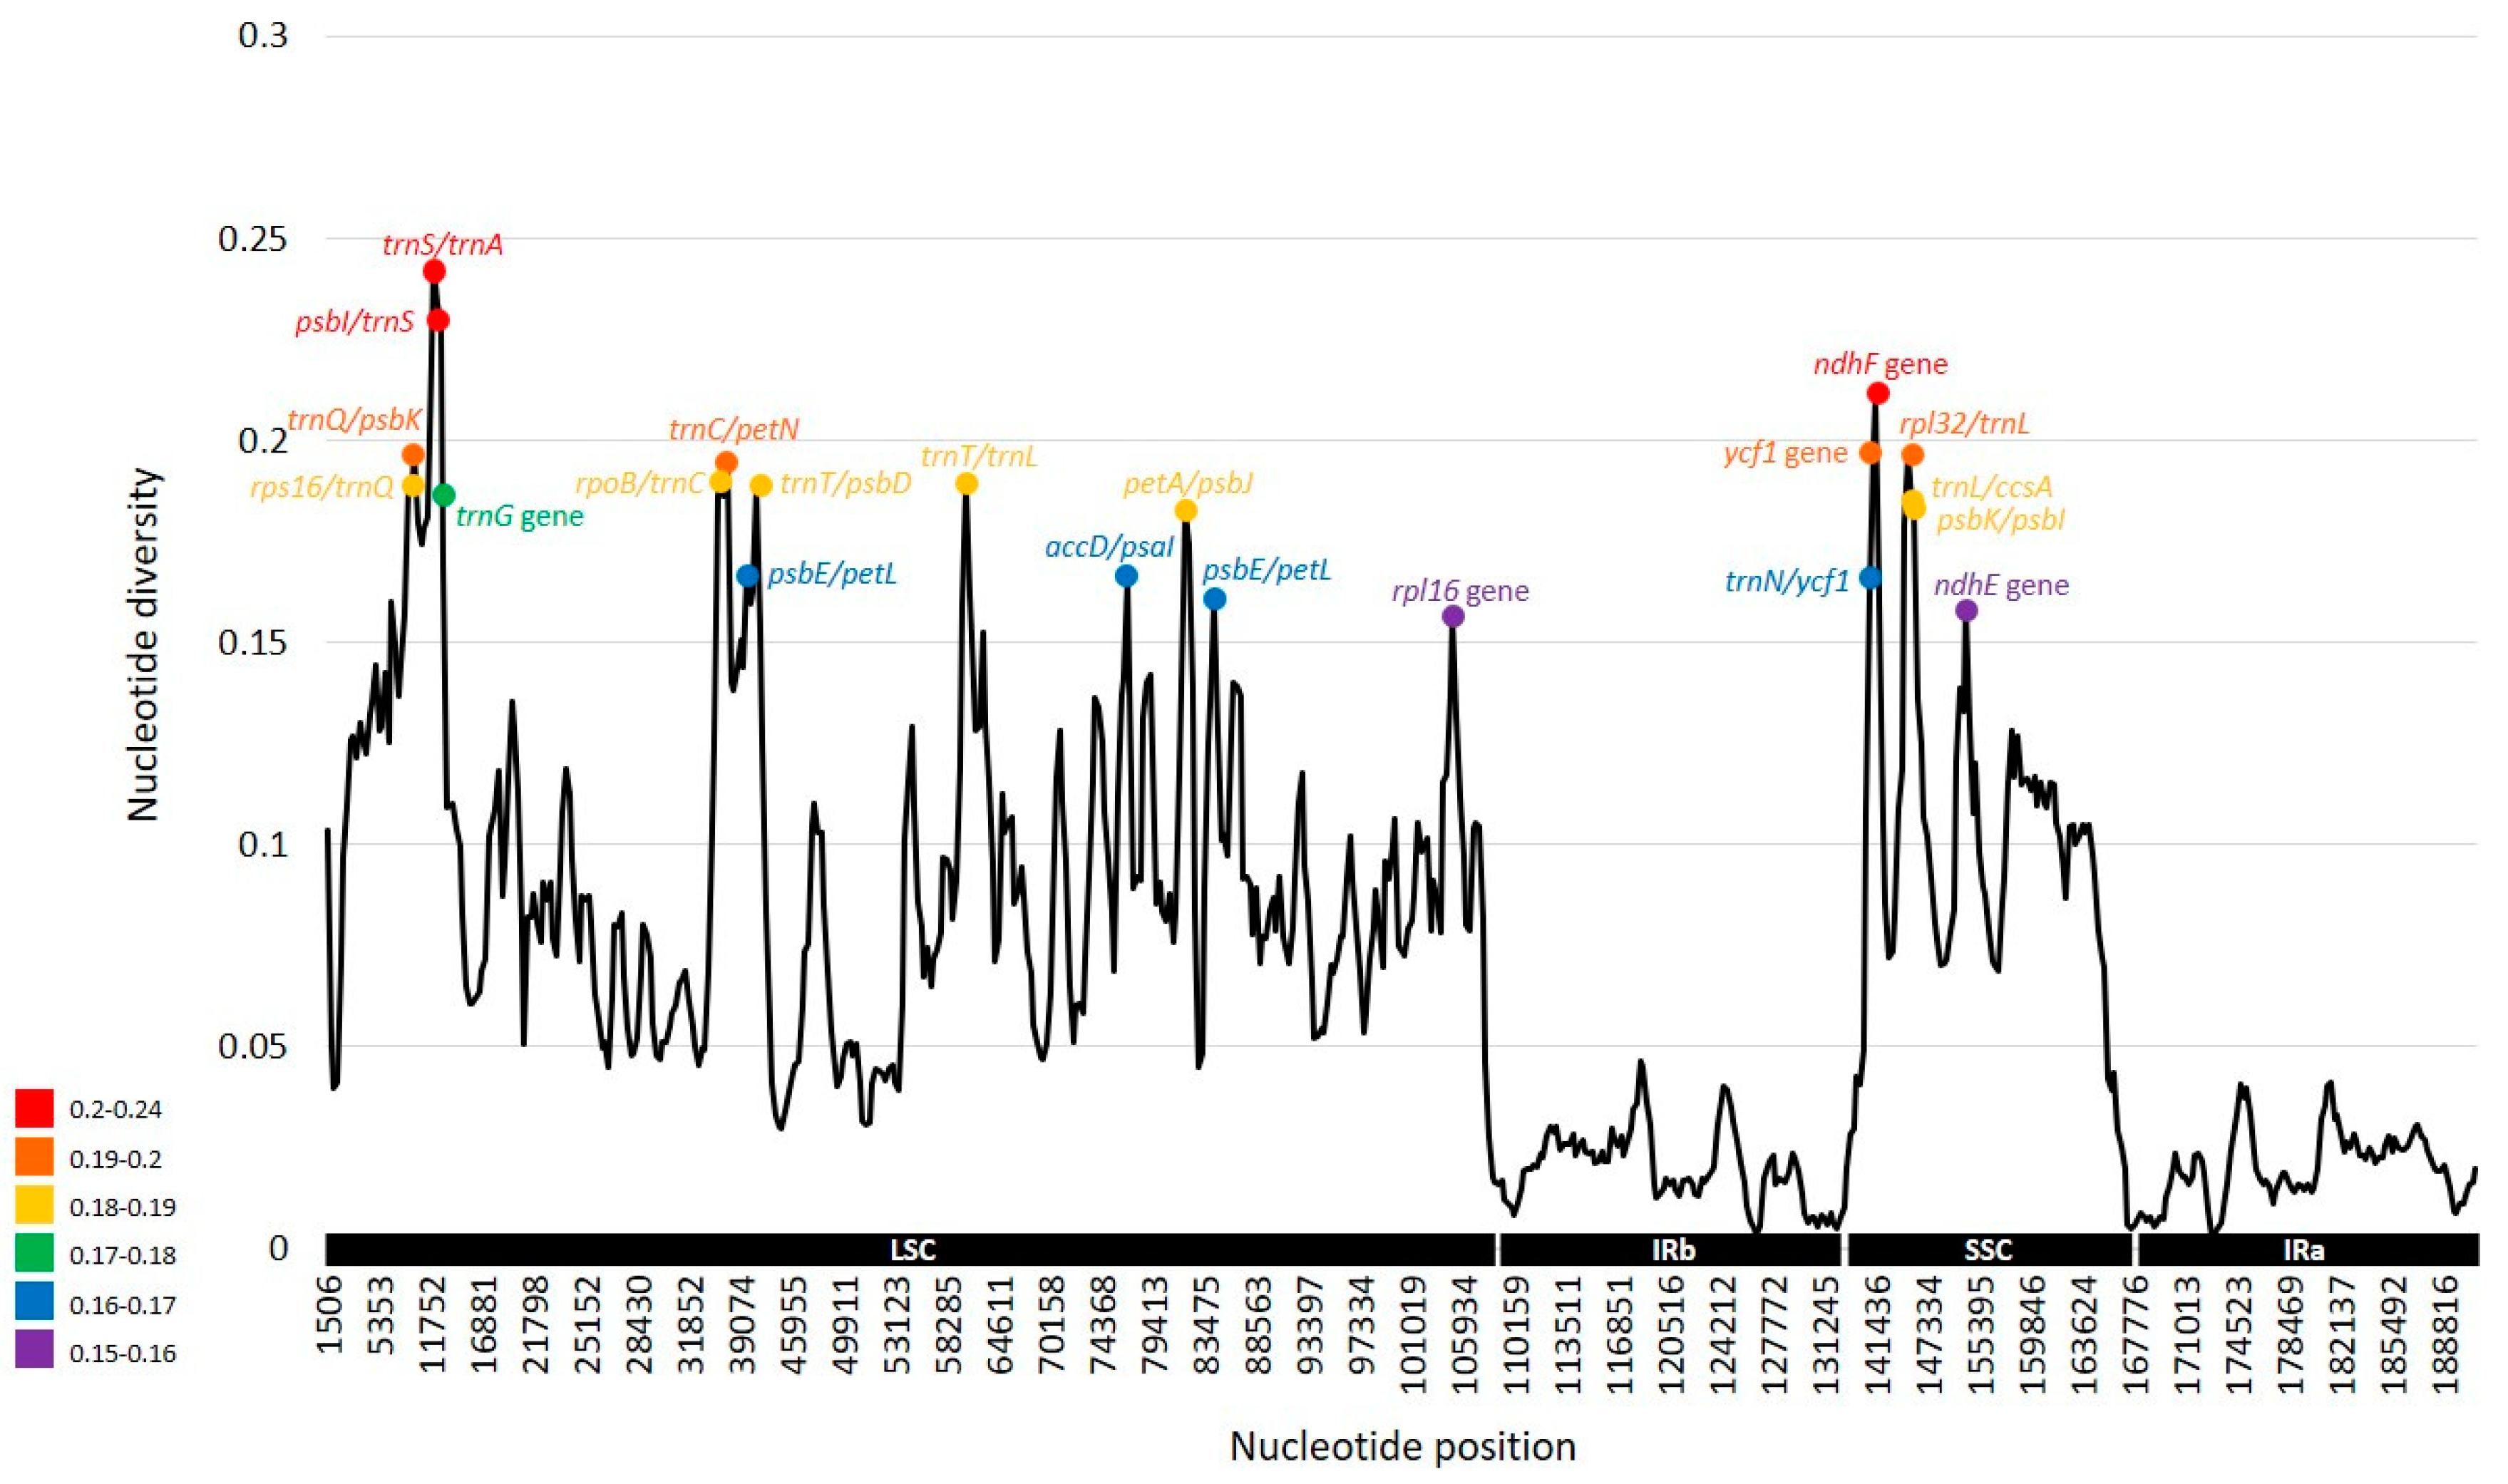
2.3. Comparative Analysis of Genome Structure

The complete plastome sequences of two accessions of Symplocarpus nipponicus, S. renifolius, Lemna minor, Spathiphyllum kochii, Alocasia macrorrhizos, Dieffenbachia seguine, Spirodela polyrhiza, Wolffia australiana, and Colocasia esculenta were plotted using mVISTA analysis, using annotated S. renifolius plastome as a reference (Figure 4). Based on the overall sequence identity, indicated by peaks and valleys among all nine species (ten accessions) of Araceae, the results indicated that the LSC region was most divergent, that the two IR regions were highly conserved, and that the non-coding regions were more divergent and variable than the coding regions.
Sliding window analysis revealed highly variable regions in the Araceae plastome (Figure 5). The average value of nucleotide diversity (PI) over the entire plastome was 0.07044 and 14 highly variable regions based on a significantly higher PI value of > 0.17 were identified. The most variable of these was the trnS/trnA intergenic region (PI = 0.24358), followed by the other two regions, psbI/trnS (PI = 0.21919) and ndhF gene (PI = 0.2105). Other variable regions were also identified, including ycf1 gene (PI = 0.19811) and ten intergenic regions (trnQ/psbK (PI = 0.19756), rpl32/trnL (PI = 0.19697), trnC/petN (PI = 0.19256), trnT/trnL (PI = 0.18911), rps16/trnQ (PI = 0.18875), trnT/psbD (PI = 0.18861), rpoB/trnC (PI = 0.18628), trnL/ccsA (PI = 0.18428), psbK/psbI (PI = 0.18322), and petA/psbJ (PI = 0.1825)). When these hotspot regions based on the representative lineages within the family Araceae were compared to those from two congeneric species of Symplocarpus, we found that highly variable regions based on the family level are not necessarily the same as those of within the genus level Symplocarpus, with the exception of petA/psbJ and trnC/petN regions. Compared to highly variable noncoding cp regions identified by Shaw et al. [42,43], we found that five regions (rpl32/trnL, trnT/trnL, rps16/trnQ, trnT/psbD, and petA/psbJ) in Araceae are consistently and highly variable regardless of taxonomic level. The remaining nine regions in Araceae were not identified as hotspot regions in angiosperms, suggesting no universal “best” region. Overall, we identified several highly variable plastome regions in Araceae, which may help resolve phylogenetic relationships and could potentially be used as effective markers for barcoding and phylogenetic studies of higher taxonomic levels.

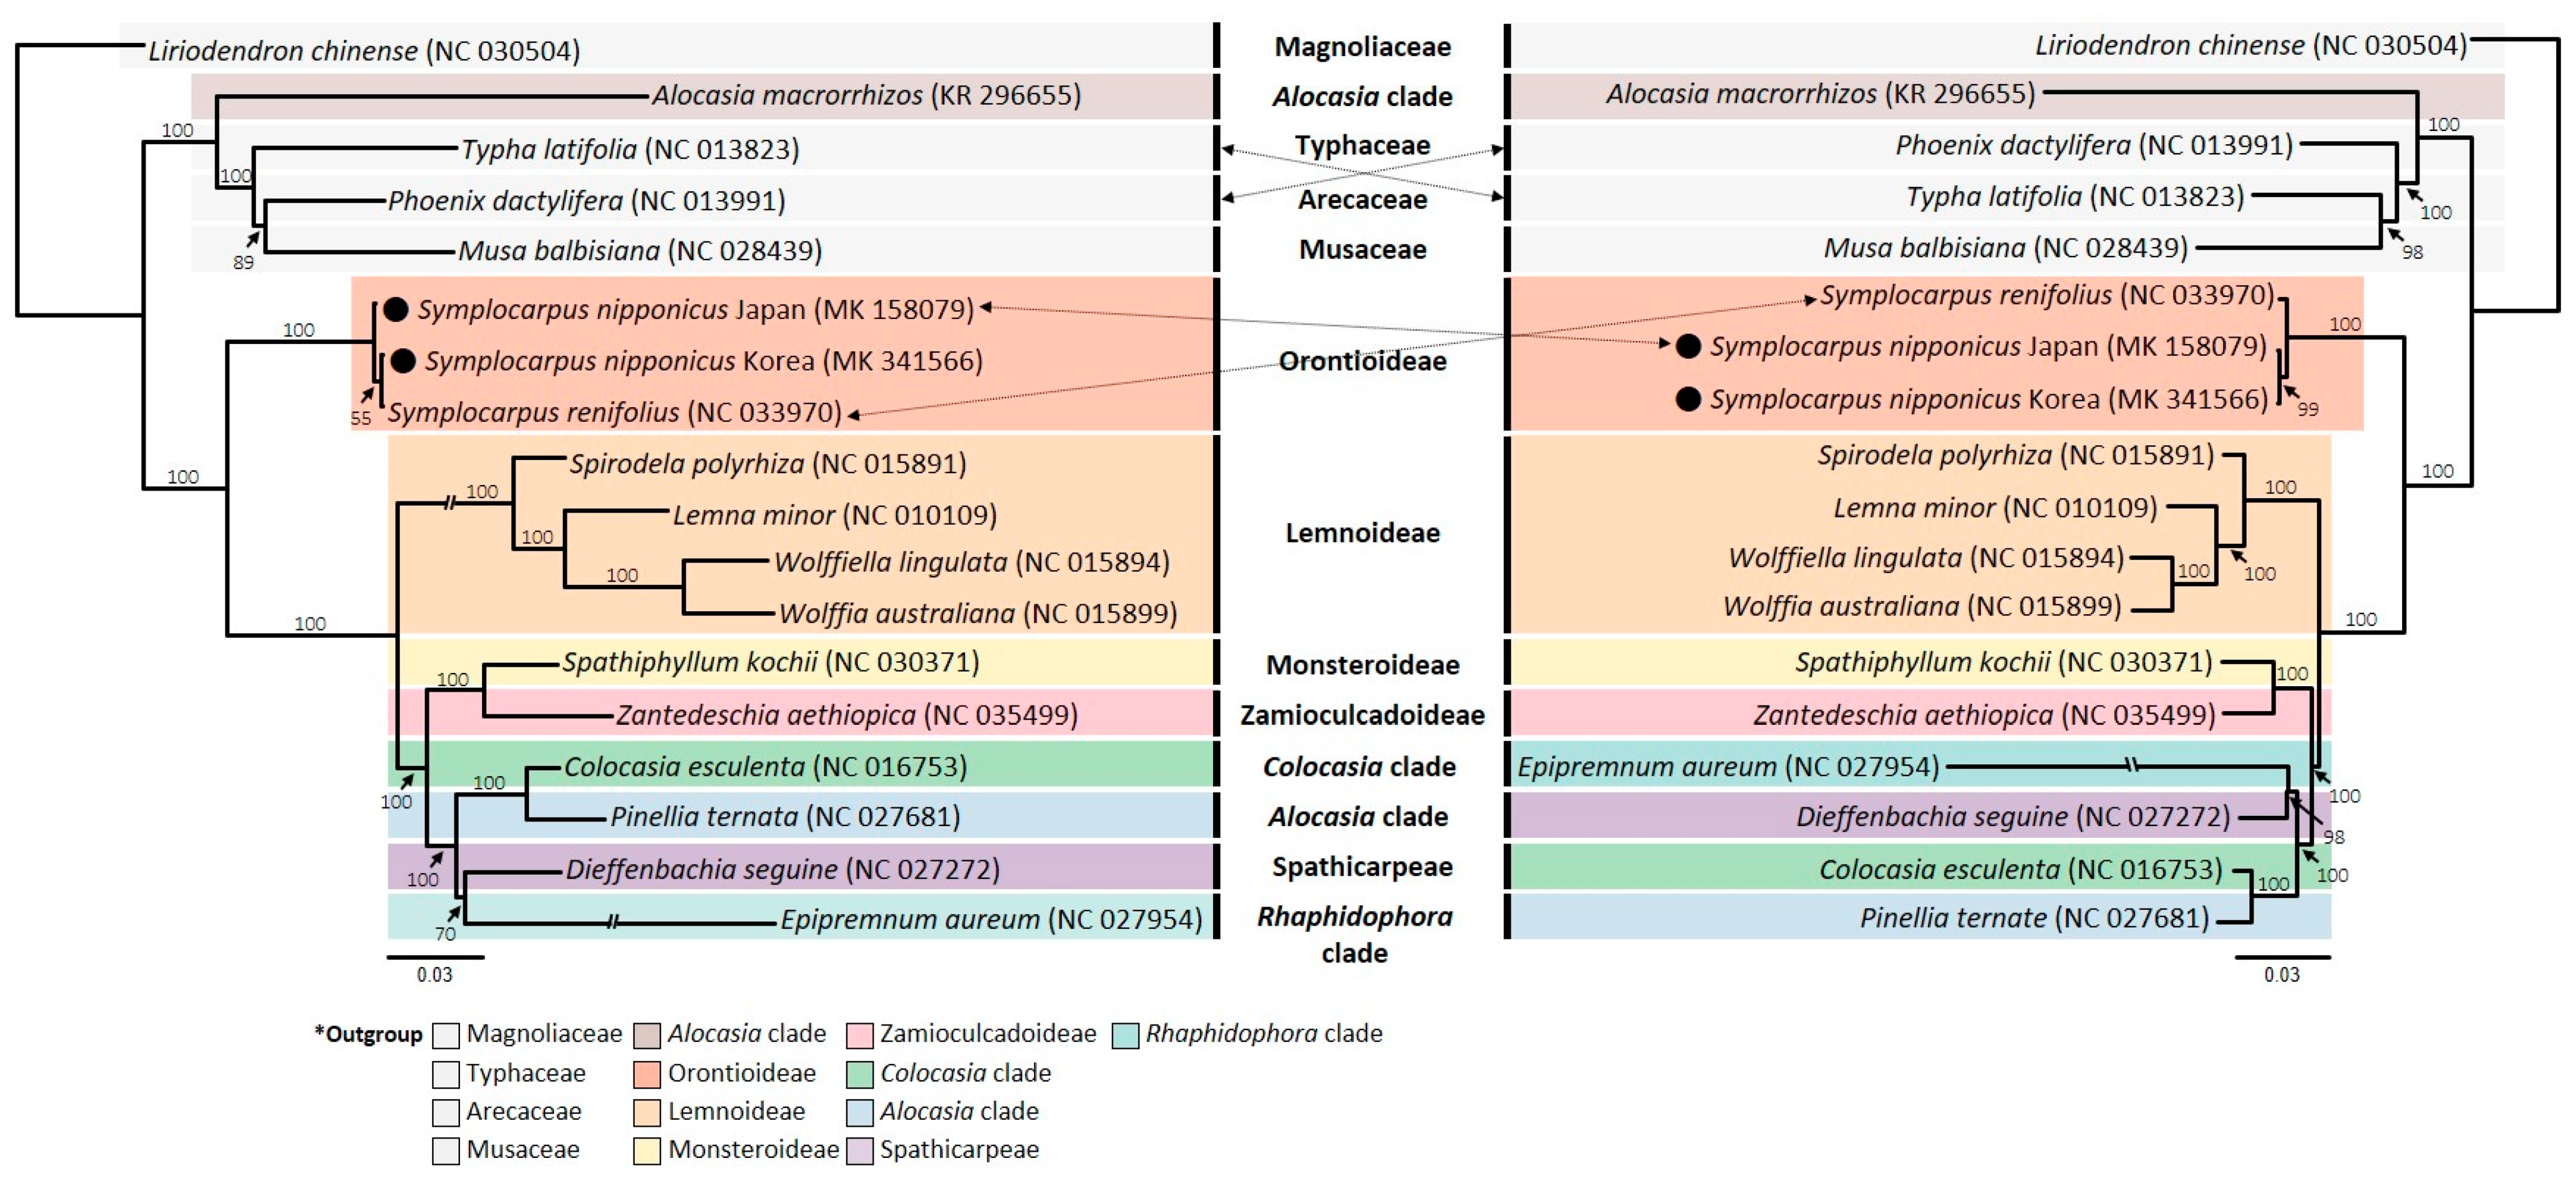
2.4. Phylogenetic Analysis

The ML (maximum likelihood) tree confirmed previously known phylogenetic relationships within the family Araceae based on earlier studies, while unexpected relationships and positions of certain taxa were also revealed in this study [28,36,44,45,46] (Figure 6). Furthermore, some topological incongruences were found between the entire plastome sequence data set and the 85 concatenated coding gene data set. Reconfirmation of previously known relationships included (1) early divergence of Symplocarpus (subfamily Orontioideae) within Araceae, (2) the monophyly of Lemnoideae and its sister relationship to the rest of Araceae, (3) relationships among four genera of Lemnoideae, and (4) the close relationship between Colocasia and Pinellia. Few unexpected relationships based on the current phylogeny included the position of Spathiphyllum, Zantedeschia, and Epipremnum. Within the subfamily Monsteroideae, the previous studies suggested that Epipremnum (Rhaphidophora clade) is related to Spathiphyllum (Monsteroideae). However, our phylogeny suggested that Epipremnum is closely related to Dieffenbachia (Spathicarpeae). The previous studies suggested that Dieffenbachia is more closely related to Zantedeschia (Zantedeschia clade) than it is to Epipremnum. One most surprising and unexpected finding in this study was the position of Alocasia macrorrhizos (KR 296655). Our phylogenetic tree based on the complete cp genome sequence and 85 concatenated coding genes suggested that Alocasia macrorrhizos is not closely related to other members of the same family Araceae. Rather, it came out as a sister to the clade containing Musaceae, Arecaceae, and Typhaceae (Figure 6). On the other hand, several previous studies suggested that, although Alocasia appears to be not monophyletic, members of this genus are closely related to Colocasia and Pinellia in Dracunculus clade [45,46], Pistia clade [28,44], or Ambrosina clade [36]. Therefore, the unusual position of Alocasia out of its typical position within Araceae was highly exceptional and unexpected. It has been well recognized that both analytical (e.g., the choice of optimality criterion, taxon sampling, specific assumptions in the modeling of sequence evolution, etc.) and biological factors (e.g., violations of the orthology due to lineage sorting, paralogy, and horizontal gene transfer, character sampling bias related to the length of the genes, systematic error due to the presence of a nonphylogenetic signal in the data, etc.) cause phylogenetic incongruence (see Reference [47] and references therein). With regard to the position of Alocasia macrorrhizos, complete plastid sequence (KR 296655) outside of its own family Araceae, it may be caused by either long branch attraction or simply a taxon misidentification issue. It appears that Alocasia macrorrhizos (KR 296655) shows somewhat longer branch length compared to that of other lineages, but other factors (e.g., optimality criteria, molecular model assumptions, chloroplast capture, etc.) also likely contributed to its unusual position. The optimality criteria as a contributing factor, however, can be ruled out given the same tree topology found between the ML and BI (Bayesian Inference) tree (with unspecified model selection) based on the complete plastid sequences of Alismatales [34]. It is also possible that misidentification of taxon or potential mistakes during sampling and sequencing acquisition processes likely caused its unusual position. Since only one species for the complete chloroplast genome of Alocasia has been sequenced and reported, we could not confirm any of these possibilities [32,34]. It remains to be confirmed as to what factors contributed to unusual position of Alocasia macrorrhizos by sampling additional species of Alocasia.
Within the genus Symplocarpus, we found that S. nipponicus is sister to the clade containing S. foetidus and S. renifolius, revealing overall phylogenetic relationships among the three common species [48,49]. As suggested previously in Lee et al. [48], one important phylogenetic incongruence based on the complete plastome and 85 coding genes data set is the differing position of the two nonthermogenic conspecific S. nipponicus accessions (Figure 6). In this study, we sequenced the two accessions of S. nipponicus sampled from Korea and Japan. The complete plastid sequence phylogeny showed that S. nipponicus sampled from Korea is more closely related to S. renifolius sampled from Korea than to its conspecific population sampled from Japan (55% BS support). On the other hand, the 85 concatenated coding genes data set suggested that two accessions of S. nipponicus are sister to each other (99% BS support). The complete plastid sequence-based phylogeny was unexpected given drastically different morphological, cytological, and life history traits between thermogenic S. renifolius and nonthermogenic S. nipponicus. However, our broader phylogenetic study based on extensive sampling of proto-Araceae found that S. renifolius in Korea is diploid, unlike known tetraploid conspecific populations in Japan, and that populations of S. renifolius in Korea are more closely related to S. nipponicus in Korea than to conspecific populations in Japan [48]. In addition, Korean populations of S. renifolius are morphologically distinctive from those of Japan, warranting new taxonomic recognition. Therefore, the relationship suggested based on the complete plastid sequence in this study is not completely unexpected, perhaps reflecting true evolutionary relationship among those taxa. It requires further confirmation based on different types of molecular markers, especially from nuclear single-copy or low-copy genes.

3. Materials and Methods

3.1. Plastome Sequencing, Assembly, and Annotation

Fresh Symplocarpus nipponicus leaves from a single plant were collected from the natural population in Japan (voucher specimen: SKKU_Kim 1608001) and Korea (voucher specimens: SKKU_Kim et al., 160711001). Total DNA was isolated using the DNeasy plant Mini Kit (Qiagen, Carlsbad, CA, USA) and sequenced using the Illumina HiSeq 4000 (Illumina, Inc., San Diego, CA, USA) at Macrogen Corporation (Seoul, Korea). The resulting paired-end reads were assembled de novo using Velvet v. 1.2.10 with multiple k-mers [50]. The tRNAs were confirmed using tRNAscan-SE [51]. Annotation was conducted using Geneious R10 [52] and the annotated plastome sequences were submitted to GenBank (accession number MK158079 from Japan and MK341566 from Korea). The annotated GenBank format sequence files were used to draw the circular maps using OGDRAW program v1.2 [53].

3.2. Comparative Plastome Analysis

The complete plastome of nonthermogenic Symplocarpus nipponicus sampled from Japan and Korea was compared to that of S. renifolius (NC 003970), a thermogenic sister species, using mVISTA [54] in Shuffle-LAGAN mode [55]. The two accessions of S. nipponicus and S. renifolius cp genome sequences and eight additionally related plastome (Lemna, Wolffia, Wolffiella, Spirodela, Spathiphyllum, Dieffenbachia, Alocasia, and Colocasia) sequences were aligned using MAFFT v. 7 [56] and adjusted manually using Geneious R10 [52]. DnaSP v. 6.10 software [57] using a sliding window analysis with a step size of 200 bp and a window length of 800 bp was carried out to determine the nucleotide diversity (PI) of the plastome. The codon usage frequency was calculated by using MEGA7 [58] with relative synonymous codon usage (RSCU) value, which is a simple measure of non-uniform usage of synonymous codons in a coding sequence [59]. To predict the possible RNA editing sites in S. nipponicus from Korea and Japan, protein-coding genes were conducted using the online program predictive RNA editor for plants (PREP) suite [60] with 22 genes as reference, based on cut off value of 0.8. Analyses based on the complete cp genomes and concatenated sequences of 71 common protein-coding genes among the studied species were conducted by MAFFT v. 7 [56], using Geneious R10 [52]. Using DnaSP v. 6.10 software [57], we calculated the Ka/Ks ratios of the three Symplocarpus cp genomes (S. renifolius and S. nipponicus from Korea and S. nipponicus from Japan) compared to 11 closely related species in the family of Araceae (i.e., Lemnoideae, Monsteroideae, Zamioculcadoideae, and Spathicarpeae).

3.3. Tandem Repeat and Microsatellite Analysis

Simple sequence repeat (SSR) markers were identified in the plastome sequence using MISA [61] with minimum repeat thresholds of 10 for mononucleotide repeats, four for dinucleotide repeats, four for trinucleotide repeats, four for tetranucleotide repeats, four for pentanucleotide repeats, and three for hexanucleotide repeats.

3.4. Phylogenetic Analysis

For the phylogenetic analysis, 17 representative species from the Mesangiospermae (13 species from Araceae in Alismatales of Monocots, three from representative orders of Monocots (one species from Musaceae of Zingiberales, one species from Arecaceae of Arecales, and one species from Typhaceae of Poales), and one species from Magnoliaceae in Magnoliids) were aligned using MAFFT v. 7 in Geneious [52]. Maximum likelihood (ML) analysis based on the best-fit model of GTR+F+R4 was conducted using IQ-TREE v. 1.4.2 [62]. Liriodendron chinense (Magnoliids) was used as the outgroup taxon and nonparametric bootstrap analysis was performed with 1000 replicates.

4. Conclusions

We determined the complete plastome sequence of nonthermogenic Symplocarpus nipponicus sampled from Japan and Korea and compared it to the plastomes of thermogenic sister species S. renifolius and several other representative species from two subfamilies (Lemnoideae and Aroideae) of Araceae. Comparative phylogenomic analysis between thermogenic and nonthermogenic Symplocarpus sister species revealed highly conserved plastomes despite drastically different life history traits and thermogenesis. We found six highly variable regions that could be used as powerful molecular markers for future phylogeographic and population genetic studies (e.g., Reference [49]). Moreover, comparative phylogenomic analysis with five additional species from Lemnoideae (Lemna), Aroideae (Colocasia), Mosteroideae, Zamioculcadoieae, and Spathicarpeae, revealed 14 highly variable regions with high PI values (trnS/trnA, psbI/trnS, ndhF gene, ycf1 gene, trnQ/psbK, rpl32/trnL, trnC/petN, trnT/trnL, rps16/trnQ, trnT/psbD, rpoB/trnC, trnL/ccsA, psbK/psbI, and petA/psbJ). These mutation hotspots could be used as useful markers to improve the resolution of unresolved phylogenetic relationships within Araceae as well as effective barcoding markers for the identification of species.

Supplementary Materials

The following are available online at https://www.mdpi.com/1422-0067/20/19/4678/s1, Figure S1. Sliding window analysis of the whole chloroplast genomes between Symplocarpus nipponicus and S. renifolius. Table S1. Genes with introns in the two accessions of Symplocarpus nipponicus chloroplast genome and the length of the exons and introns. Table S2. Codon-anticodon recognition pattern and codon usage for Symplocarpus chloroplast genomes (two accessions of S. nipponicus and one accession of S. renifolius). RSCU = relative synonymous codon usage. Table S3. Predicted RNA editing sites in the cp genome of two accessions of S. nipponicus from Japan and Korea. Table S4. Repeat sequences and their distribution in the Symplocarpus nipponicus chloroplast genome in Japan. Table S5. Repeat sequences and their distribution in the Symplocarpus nipponicus chloroplast genome in Korea. Supplementary Data S1. The data matrix of 12 representative plastomes of Mesangiospermae.

Author Contributions

M.M., J.P., and S.-C.K. conceived and designed the experiments. S.-H.K. and J.Y. generated and analyzed the data. T.Y. and M.M. collected the samples. S.-H.K. and J.Y. wrote the draft of manuscript and S.-C.K. revised it. All authors read and approved the final draft of the manuscript.

Acknowledgments

This work was supported in part by the National Research Foundation of Korea [NRF-2016R1D1A2B03934596].

Conflicts of Interest

The authors declare no conflict of interest.

References

  1. Nie, Z.-L.; Sun, H.; Li, H.; Wen, J. Intercontinental biogeography of subfamily Orontioideae (Symplocarpus, Lysichiton, and Orontium) of Araceae in eastern Asia and North America. Mol. Phylogenet. Evol. 2006, 40, 155–165. [Google Scholar] [CrossRef] [PubMed]
  2. Mayo, S.J.; Bogner, J.; Boyce, P.C. The Genera Araceae; Royal Botanic Gardens, Kew: Richmond, UK, 1997. [Google Scholar]
  3. Otsuka, K.; Ryuichi, W.; Inoue, K. A new species of Symplocarpus (Araceae) from Nagano Prefecture, Central Japan. J. Jpn. Bot. 2002, 77, 96–100. [Google Scholar]
  4. Pavlova, N.S.; Nechaev, V.A. A new species of the genus Symplocarpus (Araceae) from the southern Russian Far East. Bot. Zhurn. (Mosc. Leningr.) 2005, 90, 753–758. [Google Scholar]
  5. Knutson, R.M. Heat production and temperature regulation in eastern skunk cabbage. Science 1974, 186, 746–747. [Google Scholar] [CrossRef] [PubMed]
  6. Knutson, R.M. Plants in heat. Nat. Hist. 1979, 88, 42–47. [Google Scholar]
  7. Wada, N.; Uemura, S. Seed dispersal and predation by small rodents on the herbaceous understory plant Symplocarpus renifolius. Am. Midl. Nat. 1994, 132, 320–327. [Google Scholar] [CrossRef]
  8. Wada, N.; Uemura, S. Size-dependent flowering behavior and heat production of a sequential hermaphrodite, Symplocarpus renifolius (Araceae). Am. J. Bot. 2000, 87, 1489–1494. [Google Scholar] [CrossRef]
  9. Ito, K.; Ito, T.; Onda, Y.; Uemura, S. Temperature-triggered periodical thermogenic oscillations in skunk cabbage (Symplocarpus foetidus). Plant Cell Physiol. 2004, 45, 257–264. [Google Scholar] [CrossRef]
  10. Ito-Inaba, Y. Thermogenesis in skunk cabbage (Symplocarpus renifolius): New insights from the ultrastructure and gene expression profiles. Adv. Hortic. Sci. 2014, 28, 73–78. [Google Scholar]
  11. Seymour, R.S.; Schultze-Motel, P. Heat-producing flowers. Endeavour 1997, 21, 125–129. [Google Scholar] [CrossRef]
  12. Seymour, R.S.; White, C.R.; Gibernau, M. Heat reward for insect pollinators. Nature 2003, 426, 243–244. [Google Scholar] [CrossRef] [PubMed]
  13. Seymour, R.S.; Ito, Y.; Onda, Y.; Ito, K. Effects of floral theromogenesis on pollen function in Asian skunk cabbage Symplocarpus renifolius. Biol. Lett. 2009, 23, 568–570. [Google Scholar] [CrossRef] [PubMed]
  14. Takeda, S.; Onishi, Y.; Fukui, Y.; Ohsako, T.; Kubo, N. Life cycle and genetic diversity of Symplocarpus nipponicus (Araceae), an endangered species in Japan. Plants 2018, 7, 73. [Google Scholar] [CrossRef] [PubMed]
  15. Wen, J. Evolution of the eastern Asian and eastern North American disjunct genus Symplocarpus (Araceae): Insights from chloroplast DNA restriction site data. Biochem. Syst. Ecol. 1996, 24, 735–747. [Google Scholar] [CrossRef]
  16. Kitano, S.; Otsuka, K.; Uesugi, R.; Goka, K. Molecular phylogenetic analysis of the genus Symplocarpus (Araceae) from Japan based on chloroplast DNA sequences. J. Jpn. Bot. 2005, 80, 334–339. [Google Scholar]
  17. Iwatsubo, Y.; Otsuka, K. Chromosome numbers of Japanese Symplocarpus (Araceae). J. Phytogeogr. Taxon. 2005, 53, 203–205. [Google Scholar]
  18. Shinozaki, K.; Ohme, M.; Tanaka, M.; Wakasugi, T.; Hayashida, N.; Matsubayashi, T.; Zaita, N.; Chunwonse, J.; Obokata, J.; Yamaguchi-Shinozaki, K.; et al. The complete nucleotide sequence of the tobacco chloroplast genome: Its gene organization and expression. EMBO J. 1986, 5, 2043–2049. [Google Scholar] [CrossRef]
  19. Jansen, R.K.; Cai, Z.Q.; Raubeson, L.A.; Daniell, H.; de Pamphilis, C.W.; Leebeans-Mack, J.; Müller, K.F.; Guisinger-Bellian, M.; Haberle, R.C.; Hansen, A.K.; et al. Analysis of 81 genes from 64 plastid genomes resolves relationships in angiosperms and identifies genome-scale evolutionary patterns. Proc. Natl. Acad. Sci. USA 2007, 104, 19369–19374. [Google Scholar] [CrossRef] [Green Version]
  20. Hollingsworth, P.M.; Graham, S.W.; Little, D.P. Choosing and using a plant DNA barcode. PLoS ONE 2011, 6, e19254. [Google Scholar] [CrossRef]
  21. Bock, R. Structure, function, and inheritance of plastid genomes. In Cell and Molecular Biology of Plastids; Bock, R., Ed.; Springer: Berlin/Heidelberg, Germany, 2007; Volume 19, pp. 29–63. [Google Scholar]
  22. Jansen, R.K.; Ruhlman, T.A. Plastid genomes of seed plants. In Genomics of Chloroplasts and Mitochondria. Advances in Photosynthesis and Respiration; Bock, R., Knoop, V., Eds.; Springer: New York, NY, USA, 2012; pp. 103–126. [Google Scholar]
  23. Ruhlman, T.A.; Jansen, R.K. The plastid genomes of flowering plants. In Chloroplast Biotechnology: Methods and Protocols; Maliga, P., Ed.; Springer Science and Business Media, LLC.: New York, NY, USA, 2014; Volume 1132, pp. 3–38. [Google Scholar]
  24. Huang, Y.; Li, X.; Yang, Z.; Yang, C.; Yang, J.; Ji, Y. Analysis of complete chloroplast genome sequences improves phylogenetic resolution in Paris (Melanthiaceae). Front. Plant Sci. 2016, 7, 1797. [Google Scholar] [CrossRef]
  25. Niu, Z.; Zhu, S.; Pan, J.; Li, L.; Sun, J.; Ding, X. Comparative analysis of Dendrobium plastomes and utility of plastomic mutational hotspots. Sci. Rep. 2017, 7, 2073. [Google Scholar]
  26. Yang, J.Y.; Pak, J.H.; Kim, S.-C. The complete plastome sequence of Rubus takesimensis endemic to Ulleung Island, Korea: Insights into molecular evolution of anagenetically derived species in Rubus (Rosaceae). Gene 2018, 668, 221–228. [Google Scholar] [CrossRef] [PubMed]
  27. Lin, M.; Qi, X.; Chen, J.; Sun, L.; Zhong, Y.; Fang, J.; Hu, C. The complete chloroplast genome sequence of Actinidia arguta using the PacBio RS II platform. PLoS ONE 2018, 13, e0197393. [Google Scholar] [CrossRef] [PubMed]
  28. Nauheimer, L.; Metzler, D.; Senner, S.S. Global history of the ancient monocot family Araceae inferred with models accounting for past continental positions and previous ranges based on fossils. New Phytol. 2012, 195, 938–950. [Google Scholar] [CrossRef] [PubMed]
  29. Ahmed, I.; Biggs, P.G.; Mattews, P.J.; Collins, L.J.; Hendy, M.D.; Lockhart, P.J. Mutational dynamics of Aroid chloroplast genomes. Genome Biol. Evol. 2012, 4, 1316–1323. [Google Scholar] [CrossRef]
  30. Mardanov, A.V.; Ranin, N.V.; Kuznestsov, B.B.; Samigullin, T.H.; Antonov, A.S.; Kolganova, T.V.; Skyabin, K.G. Complete sequence of the Duckweed (Lemna minor) chloroplast genome: Structural organization and phylogenetic relationships to other Angiosperms. J. Mol. Evol. 2008, 66, 555–564. [Google Scholar] [CrossRef]
  31. Wang, W.; Messing, J. High-throughput sequencing of three Lemnoideae (Duckweeds) chloroplast genomes from total DNA. PLoS ONE 2011, 6, e24670. [Google Scholar] [CrossRef]
  32. Wang, B.; Han, L. The complete chloroplast genome sequence of Alocasia macrorrhizos. Mitochondrial DNA A DNA Mapp. Seq. Anal. 2016, 27, 3464–3465. [Google Scholar] [CrossRef]
  33. Wang, B.; Han, L.; Chen, C.; Wang, Z. The complete chloroplast genome sequence of Diffenbachia seguine (Araceae). Mitochondrial DNA A DNA Mapp. Seq. Anal. 2016, 27, 2913–2914. [Google Scholar]
  34. Liang, J.; Ma, Q.; Yang, Z. The first complete chloroplast genomes of two Alismataceae species, and the phylogenetic relationship under order Alismatales. Mitochondrial DNA B 2018, 4, 122–123. [Google Scholar] [CrossRef]
  35. Choi, K.S.; Park, K.T.; Park, S. The chloroplast genome of Symplocarpus renifolius: A comparison of chloroplast genome structure in Araceae. Genes 2017, 8, 324. [Google Scholar] [CrossRef] [PubMed]
  36. Cusimano, N.; Sousa, A.; Renner, S.S. Maximum likelihood inference implies a high, not a low, ancestral haploid chromosome number in Araceae, with a critique of the bias introduced by ‘x’. Ann. Bot. 2012, 109, 681–692. [Google Scholar] [CrossRef] [PubMed]
  37. Kim, S.-H.; Maki, M.; Lepschi, B.; Kim, S.-C. Highly conserved plastomes of the most basal lineage Proto-Araceae in the ancient monocot family Araceae. (unpublished; manuscript in preparation).
  38. Ravi, V.; Khurana, J.P.; Tyagi, A.K.; Khurana, P. An update on chloroplast genomes. Plant Syst. Evol. 2008, 271, 101–122. [Google Scholar] [CrossRef]
  39. Pinard, D.; Myburg, A.A.; Mizrachi, E. The plastid and mitochondrial genomes of Eucalyptus grandis. BMC Genom. 2019, 20, 132. [Google Scholar] [CrossRef] [PubMed]
  40. Rabah, S.O.; Lee, C.; Hajrah, N.H.; Makki, R.M.; Alharby, H.F.; Alhebshi, A.M.; Sabir, J.; Jansen, R.K.; Ruhlman, T.A. Plastome sequencing of ten nonmodel crop species uncovers a large insertion of mitochondrial DNA in cashew. Plant Genome 2017, 10. [Google Scholar] [CrossRef] [PubMed]
  41. Makałowski, W.; Boguski, M.S.; Hughes, A.L.; Yeager, M. Synonymous and nonsynonymous substitution distances are correlated in mouse and rat genes. J. Mol. Evol. 1998, 47, 119–121. [Google Scholar] [CrossRef] [PubMed]
  42. Shaw, J.; Lickey, E.B.; Schilling, E.E.; Small, R.L. Comparison of while chloroplast genome sequences to choose noncoding regions for phylogenetic studies in angiosperms: The tortoise and the hare III. Am. J. Bot. 2007, 94, 275–288. [Google Scholar] [CrossRef]
  43. Shaw, J.; Shafer, H.L.; Leonard, R.; Kovach, M.J.; Schorr, M.; Morris, A.B. Chloroplast DNA sequence utility for the lowest phylogenetic and phylogeographic inferences in angiosperms: The tortoise and the hare IV. Am. J. Bot. 2014, 101, 1987–2004. [Google Scholar] [CrossRef] [Green Version]
  44. Cusimano, N.; Bogner, J.; Mayo, S.J.; Boyce, P.C.; Wong, S.Y.; Hesse, M.; Hetterscheid, W.L.A.; Keating, R.C.; French, J. Relationships within the Araceae: Comparison of morphological patterns with molecular phylogenies. Am. J. Bot. 2011, 98, 654–668. [Google Scholar] [CrossRef]
  45. Henriquez, C.L.; Arias, T.; Pires, J.C.; Croat, T.B.; Schaal, B.A. Phylogenomics of the plant family Araceae. Mol. Phylogenet. Evol. 2014, 75, 91–102. [Google Scholar] [CrossRef] [PubMed]
  46. Cabrera, L.I.; Salazar, G.A.; Chase, M.W.; Mayo, S.J.; Bogner, J.; Dávila, P. Phylogenetic relationships of aroids and duckweeds (Araceae) inferred from coding and noncoding plastid DNA. Am. J. Bot. 2008, 95, 1153–1165. [Google Scholar] [CrossRef] [PubMed]
  47. Som, A. Causes, consequences and solutions of phylogenetic incongruence. Brief. Bioinform. 2015, 16, 536–548. [Google Scholar] [CrossRef] [PubMed]
  48. Lee, J.; Kim, S.-H.; Lee, S.; Maki, M.; Otsuka, K.; Kozhevnikov, A.E.; Kozhevnikova, Z.V.; Wen, J.; Kim, S.-C. New insights into the phylogeny and biogeography of subfamily Orontioideae (Araceae). J. Syst. Evol. 2019. [Google Scholar] [CrossRef]
  49. Kim, S.-H.; Cho, M.-S.; Li, P.; Kim, S.-C. Phylogeography and ecological niche modeling reveal reduced genetic diversity and colonization patterns of skunk cabbage (Symplocarpus foetidus; Araceae) from glacial refugia in eastern North America. Front. Plant Sci. 2018, 9, 648. [Google Scholar] [CrossRef] [PubMed]
  50. Zerbino, D.R.; Birney, E. Velvet: Algorithms for de novo short read assembly using de Bruijn graphs. Genome Res. 2008, 18, 821–829. [Google Scholar] [CrossRef] [PubMed] [Green Version]
  51. Lowe, T.M.; Eddy, S.R. tRNAscan-SE: A program for improved detection of transfer RNA genes in genomic sequence. Nucleic Acids Res. 1997, 25, 955–964. [Google Scholar] [CrossRef]
  52. Kearse, M.; Moir, R.; Wilson, A.; Stones-Havas, S.; Cheung, M.; Sturrock, S.; Buxton, S.; Cooper, A.; Markowitz, S.; Duran, C.; et al. Geneious Basic: An integrated and extendable desktop software platform for the organization and analysis of sequence data. Bioinformatics 2012, 28, 1647–1649. [Google Scholar] [CrossRef]
  53. Lohse, M.; Drechsel, O.; Bock, R. Organellar genome DRAW (OGDRAW): A tool for the easy generation of high-quality custom graphical maps of plastid and mitochondrial genomes. Curr. Genet. 2009, 25, 1451–1452. [Google Scholar]
  54. Frazer, K.A.; Pachter, L.; Poliakov, A.; Rubin, E.M.; Dubchak, I. VISTA: Computational tools for comparative genomics. Nucleic Acids Res. 2004, 32, W273–W279. [Google Scholar] [CrossRef]
  55. Brundo, M.; Malde, S.; Poliakov, A.; Do, C.B.; Couronne, O.; Dubchak, I.; Batzoglou, S. Global Alignment: Finding rearrangements during alignment. Bioinformatics (19S1) 2003, 19, i54–i62. [Google Scholar]
  56. Katoh, K.; Standley, D.M. MAFFT multiple sequence alignment software version 7: Improvements in performance and usability. Mol. Biol. Evol. 2013, 30, 772–780. [Google Scholar] [CrossRef] [PubMed]
  57. Rozas, J.; Ferrer-Mata, A.; Sánchez-DelBarrio, J.C.; Guirao-Rico, S.; Librado, P.; Ramos-Onsins, S.E.; Sánchez-Gracia, A. DnaSP v6: DNA sequence polymorphism analysis of large datasets. Mol. Biol. Evol. 2017, 34, 3299–3302. [Google Scholar] [CrossRef] [PubMed]
  58. Kumar, S.; Stecher, G.; Tamura, K. MEGA7: Molecular evolutionary genetics analysis version 7.0 for bigger datasets. Mol. Biol. Evol. 2016, 33, 1870–1874. [Google Scholar] [CrossRef] [PubMed]
  59. Sharp, P.M.; Li, W.H. The codon adaptation index–a measure of directional synonymous codon usage bias, and its potential applications. Nucleic Acids Res. 1987, 15, 1281–1295. [Google Scholar] [CrossRef]
  60. Mower, J.P. The PREP suite: Predictive RNA editors for plant mitochondrial genes, chloroplast genes and user-defined alignments. Nucleic Acids Res. 2009, 37, W253–W259. [Google Scholar] [CrossRef]
  61. Thiel, T.; Michalek, W.; Varshney, R.K.; Graner, A. Exploiting EST databases for the development and characterization of gene-derived SSR-markers in barley (Hordeum vulgare L.). Theor. Appl. Genet. 2003, 106, 411–422. [Google Scholar] [CrossRef]
  62. Nguyen, L.-T.; Schmidt, H.A.; von Haeseler, A.; Minh, B.Q. IQ-TREE: A fast and effective stochastic algorithm for estimating maximum-likelihood phylogenies. Mol. Biol. Evol. 2015, 32, 268–274. [Google Scholar] [CrossRef]
Figure 1. Complete plastome map of Symplocarpus nipponicus sampled from Korea and Japan. The genes inside and outside of the circle are transcribed in the clockwise and counterclockwise direction, repectively. Genes belonging to differenct functional groups are shown in different colors. The thick lines indicate the extent of the interted repeats (IRA and IRB) that separate the genomes into small single copy (SSC) and large single copy (LSC) regions.
Ijms 20 04678 g001
Figure 2. The Ka/Ks ratio of 71 protein-coding genes of cp genomes from 14 Araceae species.
Ijms 20 04678 g002
Figure 3. Analyses of repeated sequences in two accessions of Symplocarpus nipponicus plastome. (a) Numbers of different repeat types; (b) Numbers of identified SSRs motifs in different repeat class types; (c) Frequency of repeat types in LSC, SSC, and IR regions.
Ijms 20 04678 g003
Figure 4. Alignment visualization of chloroplast genome sequences from nine representative species of Araceae. VISTA-based identity plots revealed the sequence identity of ten chloroplast genomes relative to the reference Symplocarpus renifolius. Vertical scale indicates the percent identity, from 50 to 100%. Coding and noncoding regions are in blue and pink, respectively. Gray arrows above the alignment indicate the position and direction of each gene.
Ijms 20 04678 g004
Figure 5. Sliding window analysis of the whole chloroplast genomes of nine Araceae species.
Ijms 20 04678 g005
Figure 6. Phylogenetic tree reconstruction of 18 taxa using maximum likelihood based on datasets of the entire chloroplast genome sequences (left) and shared 85 coding genes only (right). ML topology was shown with ML bootstrap support (BS) value given at each node.
Ijms 20 04678 g006
Table 1. Summary statistics of two accessions of Symplocarpus nipponicus and S. renifolius plastomes.
TaxaS. nipponicus (Korea)S. nipponicus (Japan)S. renifolius (Korea)
Accession NumberMK341566MK158079KY039276
Total cpDNA size (bp)/GC content (%)158,508/37.3158,322/37.4158,521/37.3
LSC size (bp)/GC content (%)86,595/35.686,433/34.986,620/35.6
IR size (bp)/GC content (%)25,802/42.825,809/43.825,801/42.9
SSC size (bp)/GC content (%)20,309/30.920,271/31.020,299/31.0
Number of genes130130130
Number of protein-coding genes858585
Number of tRNA genes373737
Number of rRNA genes888
Number of duplicated genes171717

