Article

The miRNA–mRNA Networks Involving Abnormal Energy and Hormone Metabolisms Restrict Tillering in a Wheat Mutant dmc

1
National Centre of Engineering and Technological Research for Wheat/Key Laboratory of Physiological Ecology and Genetic Improvement of Food Crops in Henan Province, Henan Agricultural University, Zhengzhou 450046, China
2
Institute of Cotton Research, Chinese Academy of Agricultural Sciences, Anyang 455000, China
3
Shangqiu Academy of Agricultural and Forestry Sciences, Shangqiu 476000, China
*
Author to whom correspondence should be addressed.
Int. J. Mol. Sci. 2019, 20(18), 4586; https://doi.org/10.3390/ijms20184586
Submission received: 31 July 2019 / Revised: 14 September 2019 / Accepted: 15 September 2019 / Published: 17 September 2019
(This article belongs to the Section Molecular Plant Sciences)

Abstract

:
Tillers not only determine plant architecture but also influence crop yield. To explore the miRNA regulatory network restraining tiller development in a dwarf-monoculm wheat mutant (dmc) derived from Guomai 301 (wild type, WT), we employed miRNome and transcriptome integrative analysis, real-time qRT-PCR, histochemistry, and determinations of the key metabolites and photosynthesis parameters. A total of 91 differentially expressed miRNAs (DEMs) were identified between dmc and WT. Among them, 40 key DEMs targeted 45 differentially expressed genes (DEGs) including the key DEGs encode growth-regulating factors (GRF), auxin response factors (ARF), and other proteins involved in the metabolisms of hormones and carbohydrates, etc. Compared with WT, both the chlorophyll contents and the photosynthesis rate were lower in dmc. The contents of glucose, sucrose, fructose, and maltose were lower in dmc. The contents of auxin (IAA) and zeatin (ZA) were significantly lower, but gibberellin (GA) was significantly higher in the tiller tissues of dmc. This research demonstrated that the DEMs regulating hormone and carbohydrate metabolisms were important causes for dmc to not tiller. A primary miRNA–mRNA regulatory model for dmc tillering was established. The lower photosynthesis rate, insufficient energy, and abnormal hormone metabolisms restrict tillering in dmc.

1. Introduction

Tillers are special vegetative branches at the base of monocot plants. They are developed from the axillary meristems at the first several nodes of the monocot main culm, and their shape and height are similar to the main culm [1,2]. Tillering ability is one of the most important agricultural traits which significantly affect grain yield. Common wheat (Triticum aestivum L.) is one of the most valuable and widely planted monocot plants. Increasing productive tiller number generally enhances yield potential. However, wheat cultivars with too few or too many tillers do not have very high grain yield. Thus, optimal tiller number has always been the need for agricultural production [2,3].
Mutants with various tillering abilities are ideal materials for the studies of tiller developmental molecular mechanisms. Many rice (Oryza sativa) tiller mutants have been reported, such as moc1, which encodes a protein which can interact with MOC1 interacting protein and is the first characterized key gene controlling rice tillering [4,5]. Rice nal2 nal3 (nal2/3) double recessive mutant encodes WUSCHEL-relate homeobox 3A (OsWOX3A), which is involved in formation of tillers [6]. Several wheat tiller inhibition lines or mutants have been reported; they harbor genes tin1 [7], tin2 [8], tin3 [9], and ftin [10]. One wheat high tillering mutant NAUH167 harbors a major quantitative trait locus (QTLs) [11]. Wheat QSR.sicau-4D may be a pleiotropic QTL controlling maximum tiller number per unit area [3]. Although there are some reports about wheat tillering, the molecular mechanisms of wheat tillering are largely unknown. The regulatory signals, genes, and miRNAs involved in wheat tillering need to be investigated.
MiRNAs are ~22 nucleotide (nt)-long non-coding RNAs playing essential regulatory roles in eukaryotic genomes. They regulate gene expressions by silencing their target genes at the posttranscriptional level [12,13,14]. The first set of plant miRNAs were reported in Arabidopsis thaliana in 2002 [15,16]. In recent years, a number of plant miRNAs (18–25 nt) and their target genes have been reported to regulate various developmental processes, including branching or tillering [17,18,19]. For example, squamosa promoter binding protein-like genes (SPLs) were predicted as targets of miR156. Overexpressing miR156 inhibits the tiller or branch development in different plants, such as maize (Zea mays) [20], rice [21], Arabidopsis [22], and wheat [23]. In Arabidopsis, miR172 acts downstream of miR156, which regulates the expression of miR172 via SPL9 and promotes the juvenile-to-adult transition [24]. The expression of transcription factor (TF) RAP2.6L affects shoot apical meristems in Arabidopsis. RAP2.6L is under direct transcriptional control of miRNA-regulated class III homeodomain-leucine zipper (HD-ZIP III) proteins, key regulators of shoot meristem development [19]. In rice, the overexpression of OsmiR393 increases its tillering ability [17]. Rice plants overexpressing osa-miR171b have thicker tillers, but their number of tillers is the same as control [25]. Overexpression of miR156 causes lower miR172 expression in a maize Corngrass1 (Cg1) mutant, which is a neotenic mutation [20]. MiR167 determines the plant developmental process by regulating the expression of certain auxin response factor (ARF) genes involved in the auxin signaling pathway. Rice overexpressing miR167 decreases the expression of OsARF, and reduces tiller number [26]. Rice miR164b modulates the expression of OsNAC2 and affects its stem development [27]. In switchgrass (Panicum virgatum), overexpressing miR393 raises tillering capacity through regulation of auxin signaling transduction [28]. Although there is some literature on miRNA regulating plant branching, how miRNA networks regulate tillering in monocots is largely unknown.
Most miRNAs and their functions are conserved in various plant species, but some of them are divergent. Some families—such as miR165/6, miR156/7, miR159, miR170/1, miR319, miR390, miR396, etc.—are present in all vascular plants studied, but miR6300 and miR5077 may be conserved only in lycophytes and ferns, and miR168 and miR172 are not found in lycophytes [29]. In common wheat, a number of miRNAs have been reported [30,31,32,33,34,35], but their functions still need to be carefully investigated. Although wheat is a widely planted crop, how miRNA regulates its tillering is almost unknown. Up to now, we only know that miR156-Squamosa Promoter Binding Protein-Like (TaSPLs) and strigolactone (SL) signaling pathways may modulate bread wheat tillering [23].
Previously, we reported a dwarf-monoculm wheat mutant (dmc) mutant, which was obtained from ethylmethane sulfonate (EMS) treated winter wheat cultivar Guomai 301. The mutant, dmc, almost doesn’t tiller in certain field conditions. The down-regulated gene expressions related to phytohormone syntheses of auxin (IAA), zeatin (ZA), cytokinin (CTK), and some TF families of TALE and WOX are the major causes of the mutant dmc not tillering [36]. The mutant, dmc, provided an opportunity to design experiments to determine the miRNA networks regulating wheat tillering. Here we report the miRNA–mRNA networks regulating wheat tillering in dmc.

2. Results

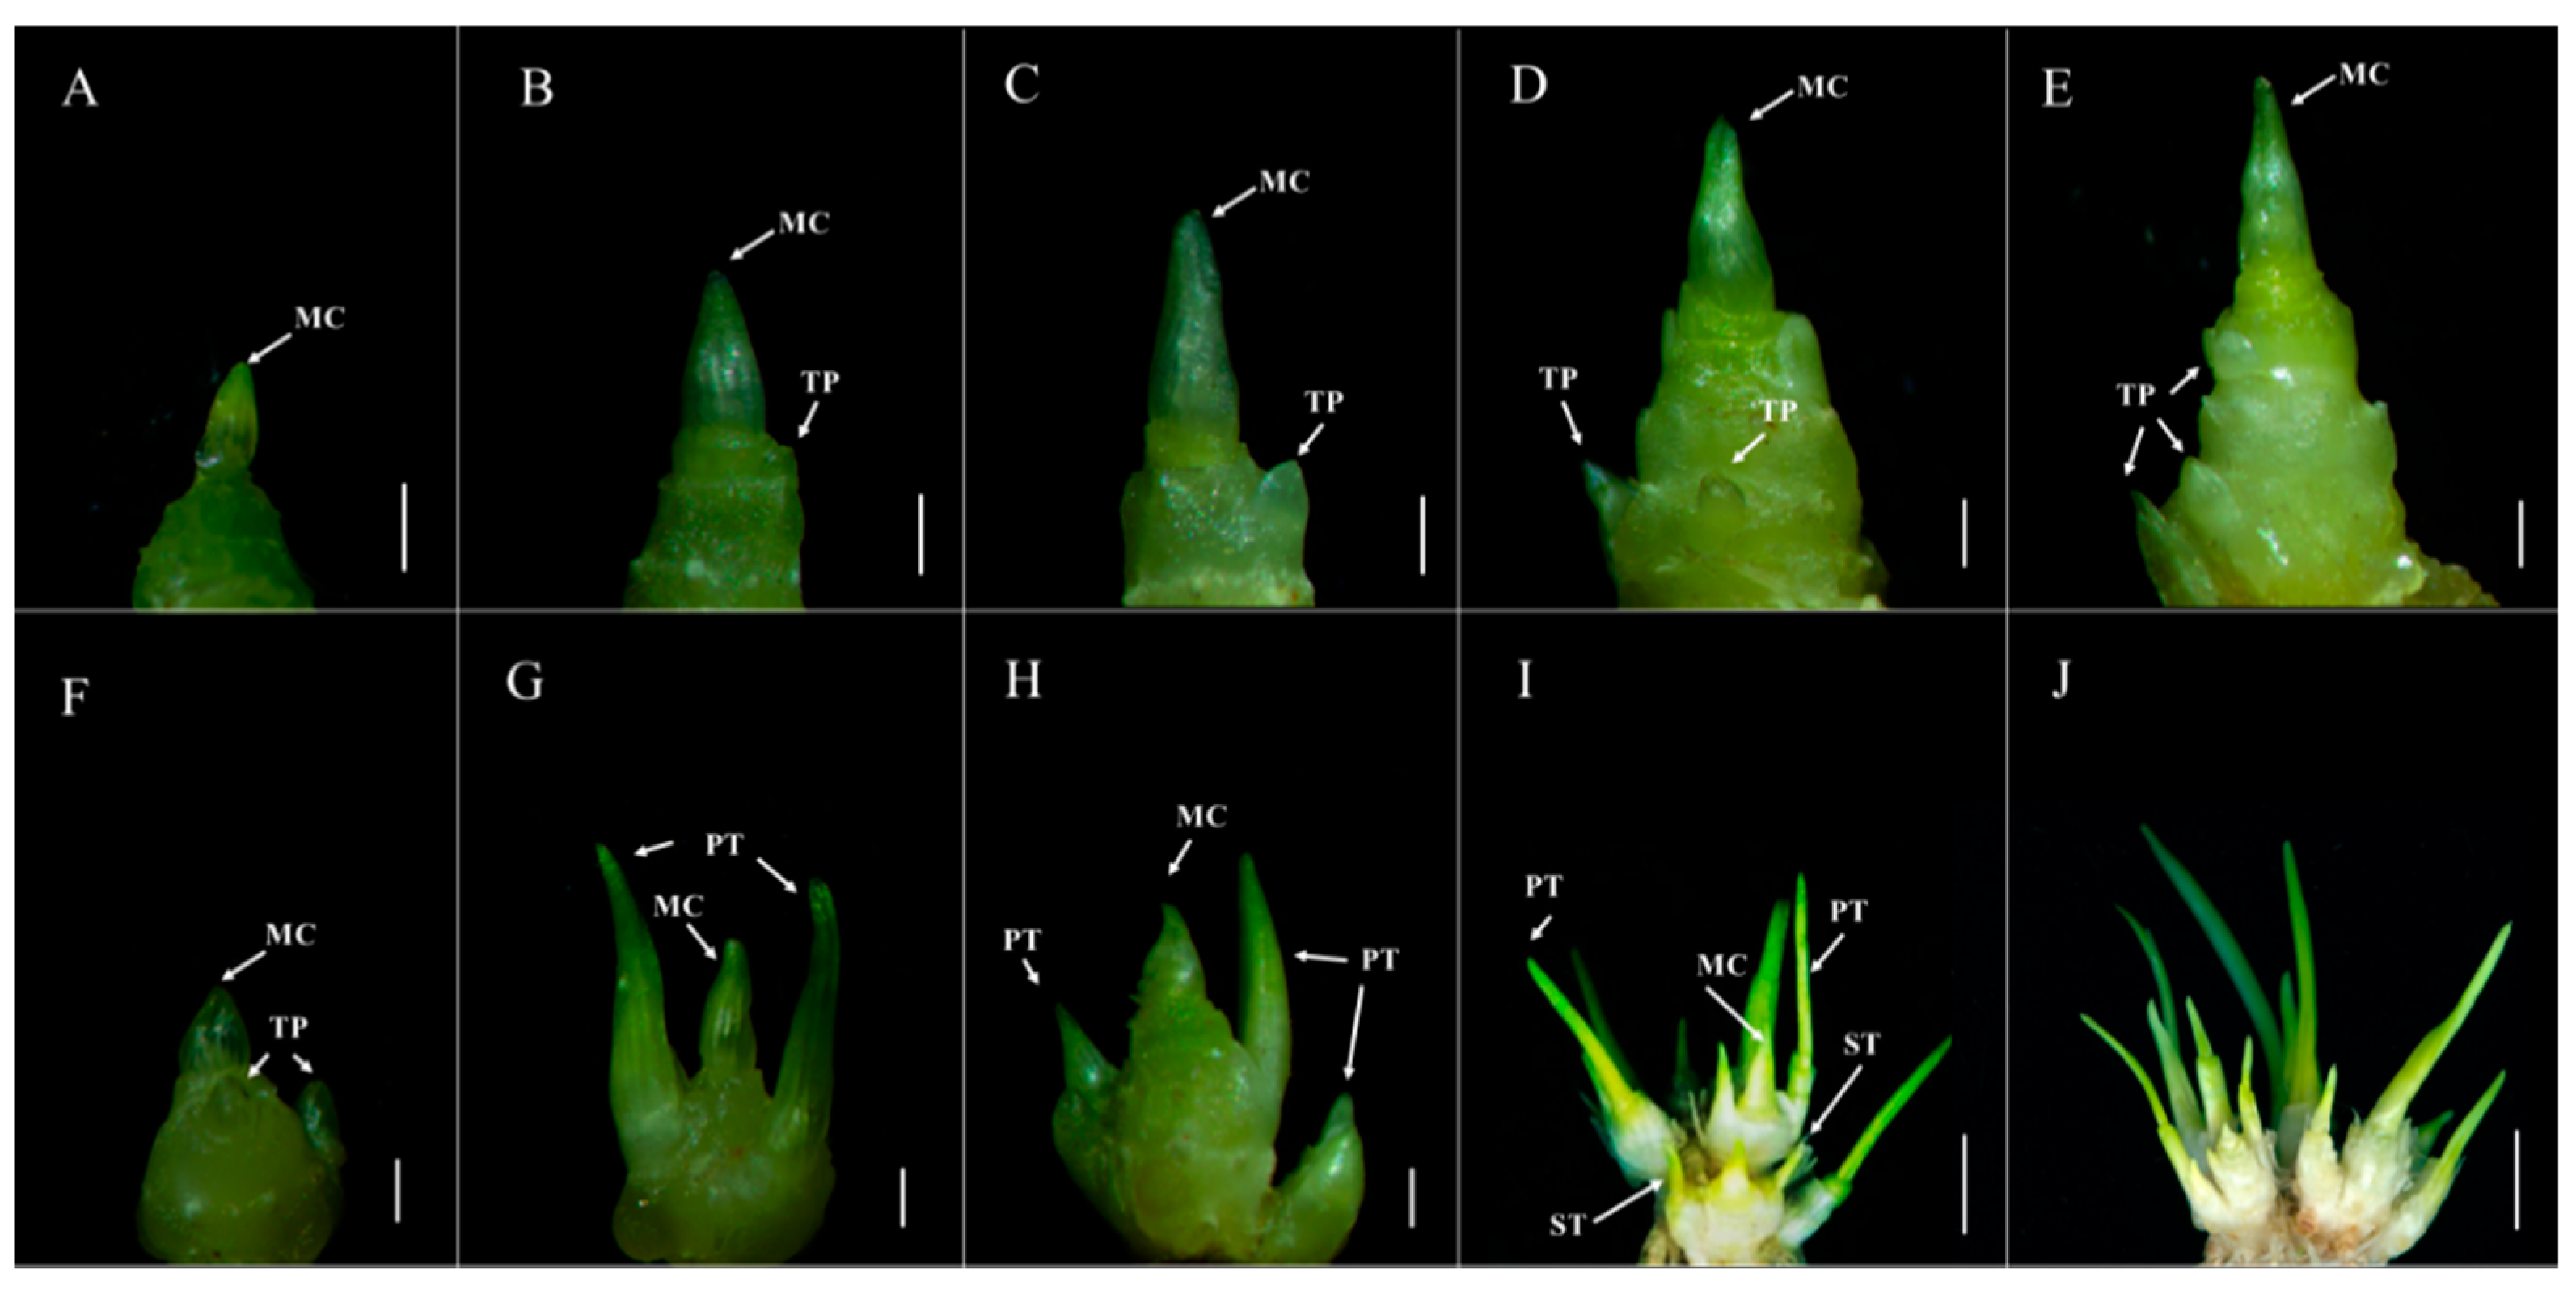
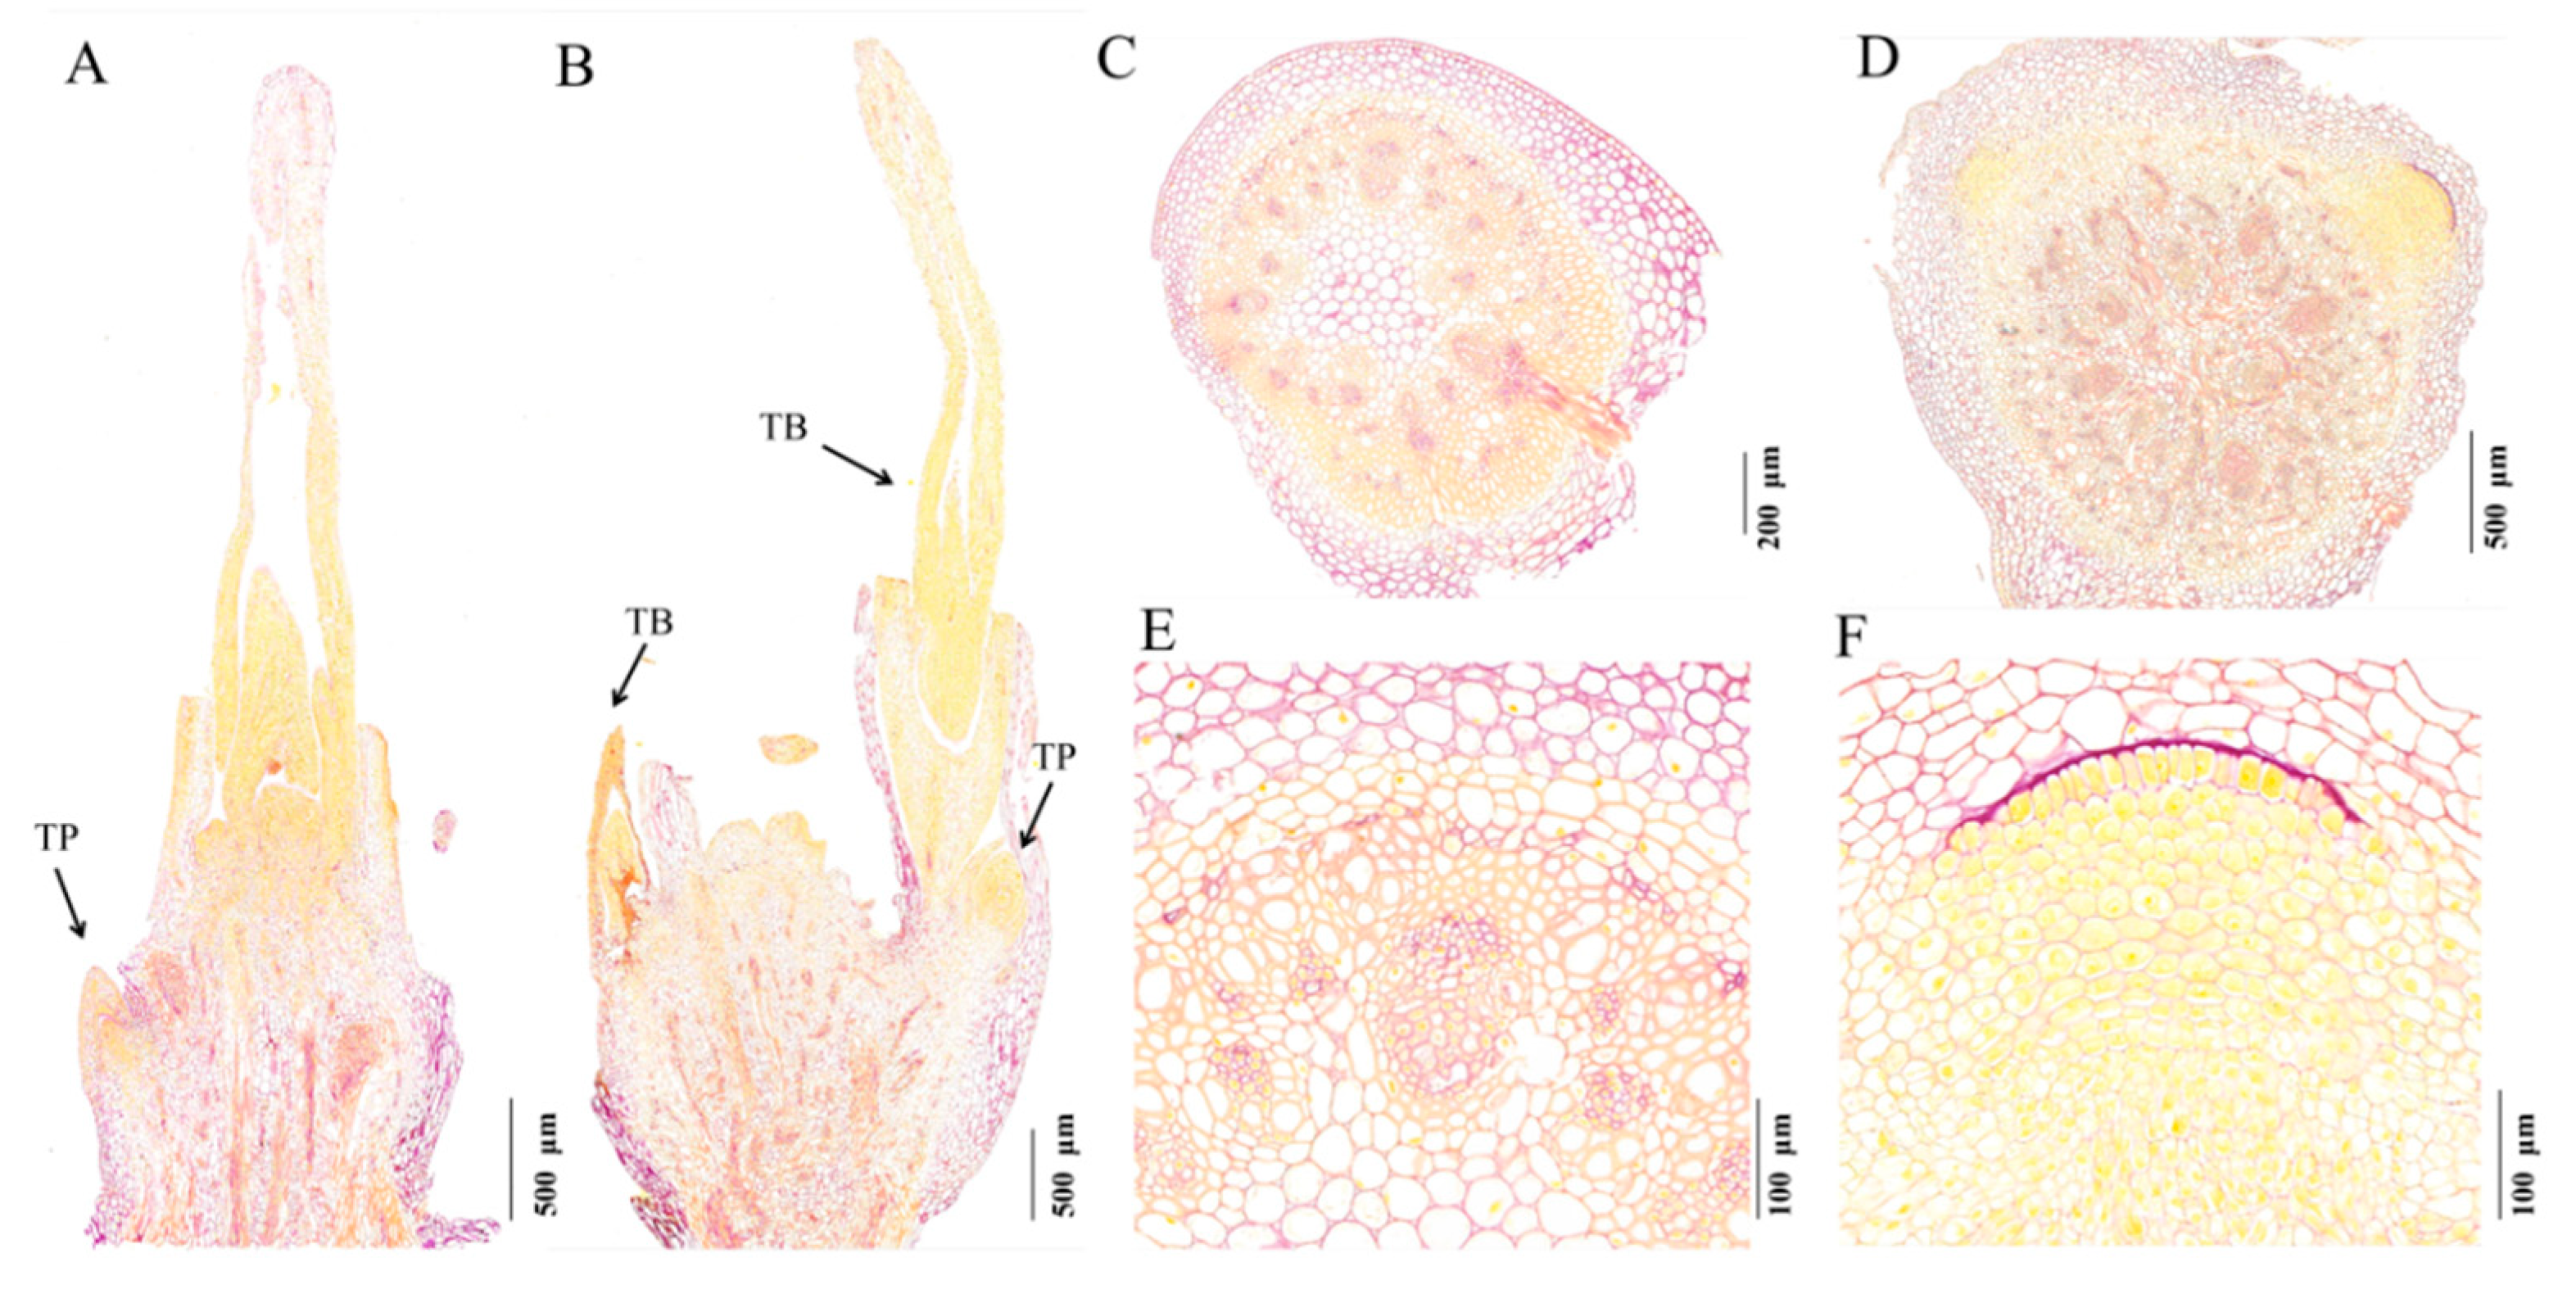
2.1. The Tiller Primordia of dmc Cannot Grow Out

The tiller morphology and microstructure of dmc and wild type (WT) were compared (Figure 1, Figure S1). In dmc, the tiller differentiation and development at the main culm (MC) base were severely inhibited (Figure 1A–E). At the two-leaf stage, there almost no difference between dmc and WT outside; however, the tiller primordia (TP) of WT already began to differentiate (Figure 1F), but no TP could be observed on dmc (Figure 1A). At the three-leaf stage, the tiller buds of WT began to grow and formed two primary tillers (PT) at the base of MC (Figure 1G); meanwhile, only one tiny protuberance formed at the MC base of dmc (Figure 1B). At the four-leaf stage, the MC of WT grew thick and long and grew more PTs (Figure 1H). Meanwhile, the MC of dmc also elongated, and one tiny TP at the base could be observed (Figure 1C). At the over-winter stage, the average plant height of the dmc was only 12 cm (the highest leaf to the ground in the natural state), which was half of the WT (Figure S1B). There were only two tiny TPs at the base of the dmc (Figure 1D), but WT was at the tiller exuberance stage; the number of tillers was about 12–14, which mainly consisted of PT and ST (Figure 1I). Between the rising to the jointing stage, the tiny TPs of dmc were very small, as before (Figure 1E); however, the tiller number of WT had reached its maximum (Figure 1J). Most of the dmc had only one MC in the end (Figure S1C).

2.2. The Protein Content of dmc Tiller Primordia Was Less

At the histological level, the tiller primordia of dmc were distinguishable from that of the WT at the three-leaf stage. The dmc usually had only one small tiller protuberance, which was stained very faint yellowish purple (Figure 2A); in contrast, the WT usually had two tillers, which were stained deep yellow (Figure 2B). These phenotypes indicated that the protein content in the tiller buds of WT were significantly more than that in dmc. Additionally, in the transverse sections of WT, there were two distinct yellow regions (Figure 2D), which were the primordia of exuberant tillers. However, there usually no tiller primordium could be observed in dmc (Figure 2C). The cells of the primordia were arranged orderly and closely, the cytoplasm was density and stained deep yellow in WT (Figure 2F) and exhibited the characteristics of the typical meristematic tissues. Contrarily, almost no tiny primordia meristematic tissues could be seen in dmc (Figure 2E). In summary, dmc had few tillers, and their tiller primordia had less protein than that of the WT.

2.3. Overview of the miRNome Data

We obtained a total of 115,402,489 raw reads, 53,485,942 and 61,913,378 clean reads with lengths of 18–30 bp from WT and dmc (Table S1). The rRNA, tRNA, snRNA, snoRNA, and repeat sequences were removed from the clean reads, and we obtained a total of 77,776,843 reads (Table S2). There were 47,283,166 (60.79%) reads which were mapped to the wheat reference genome. A total of 454 miRNAs belonging to 84 families were obtained from the two samples (Table S3)—among them, 78 were known miRNAs, and 376 were novel miRNAs (Table S4). The most miRNAs were 21–24 nt in the six miRNA libraries (Figure S2).

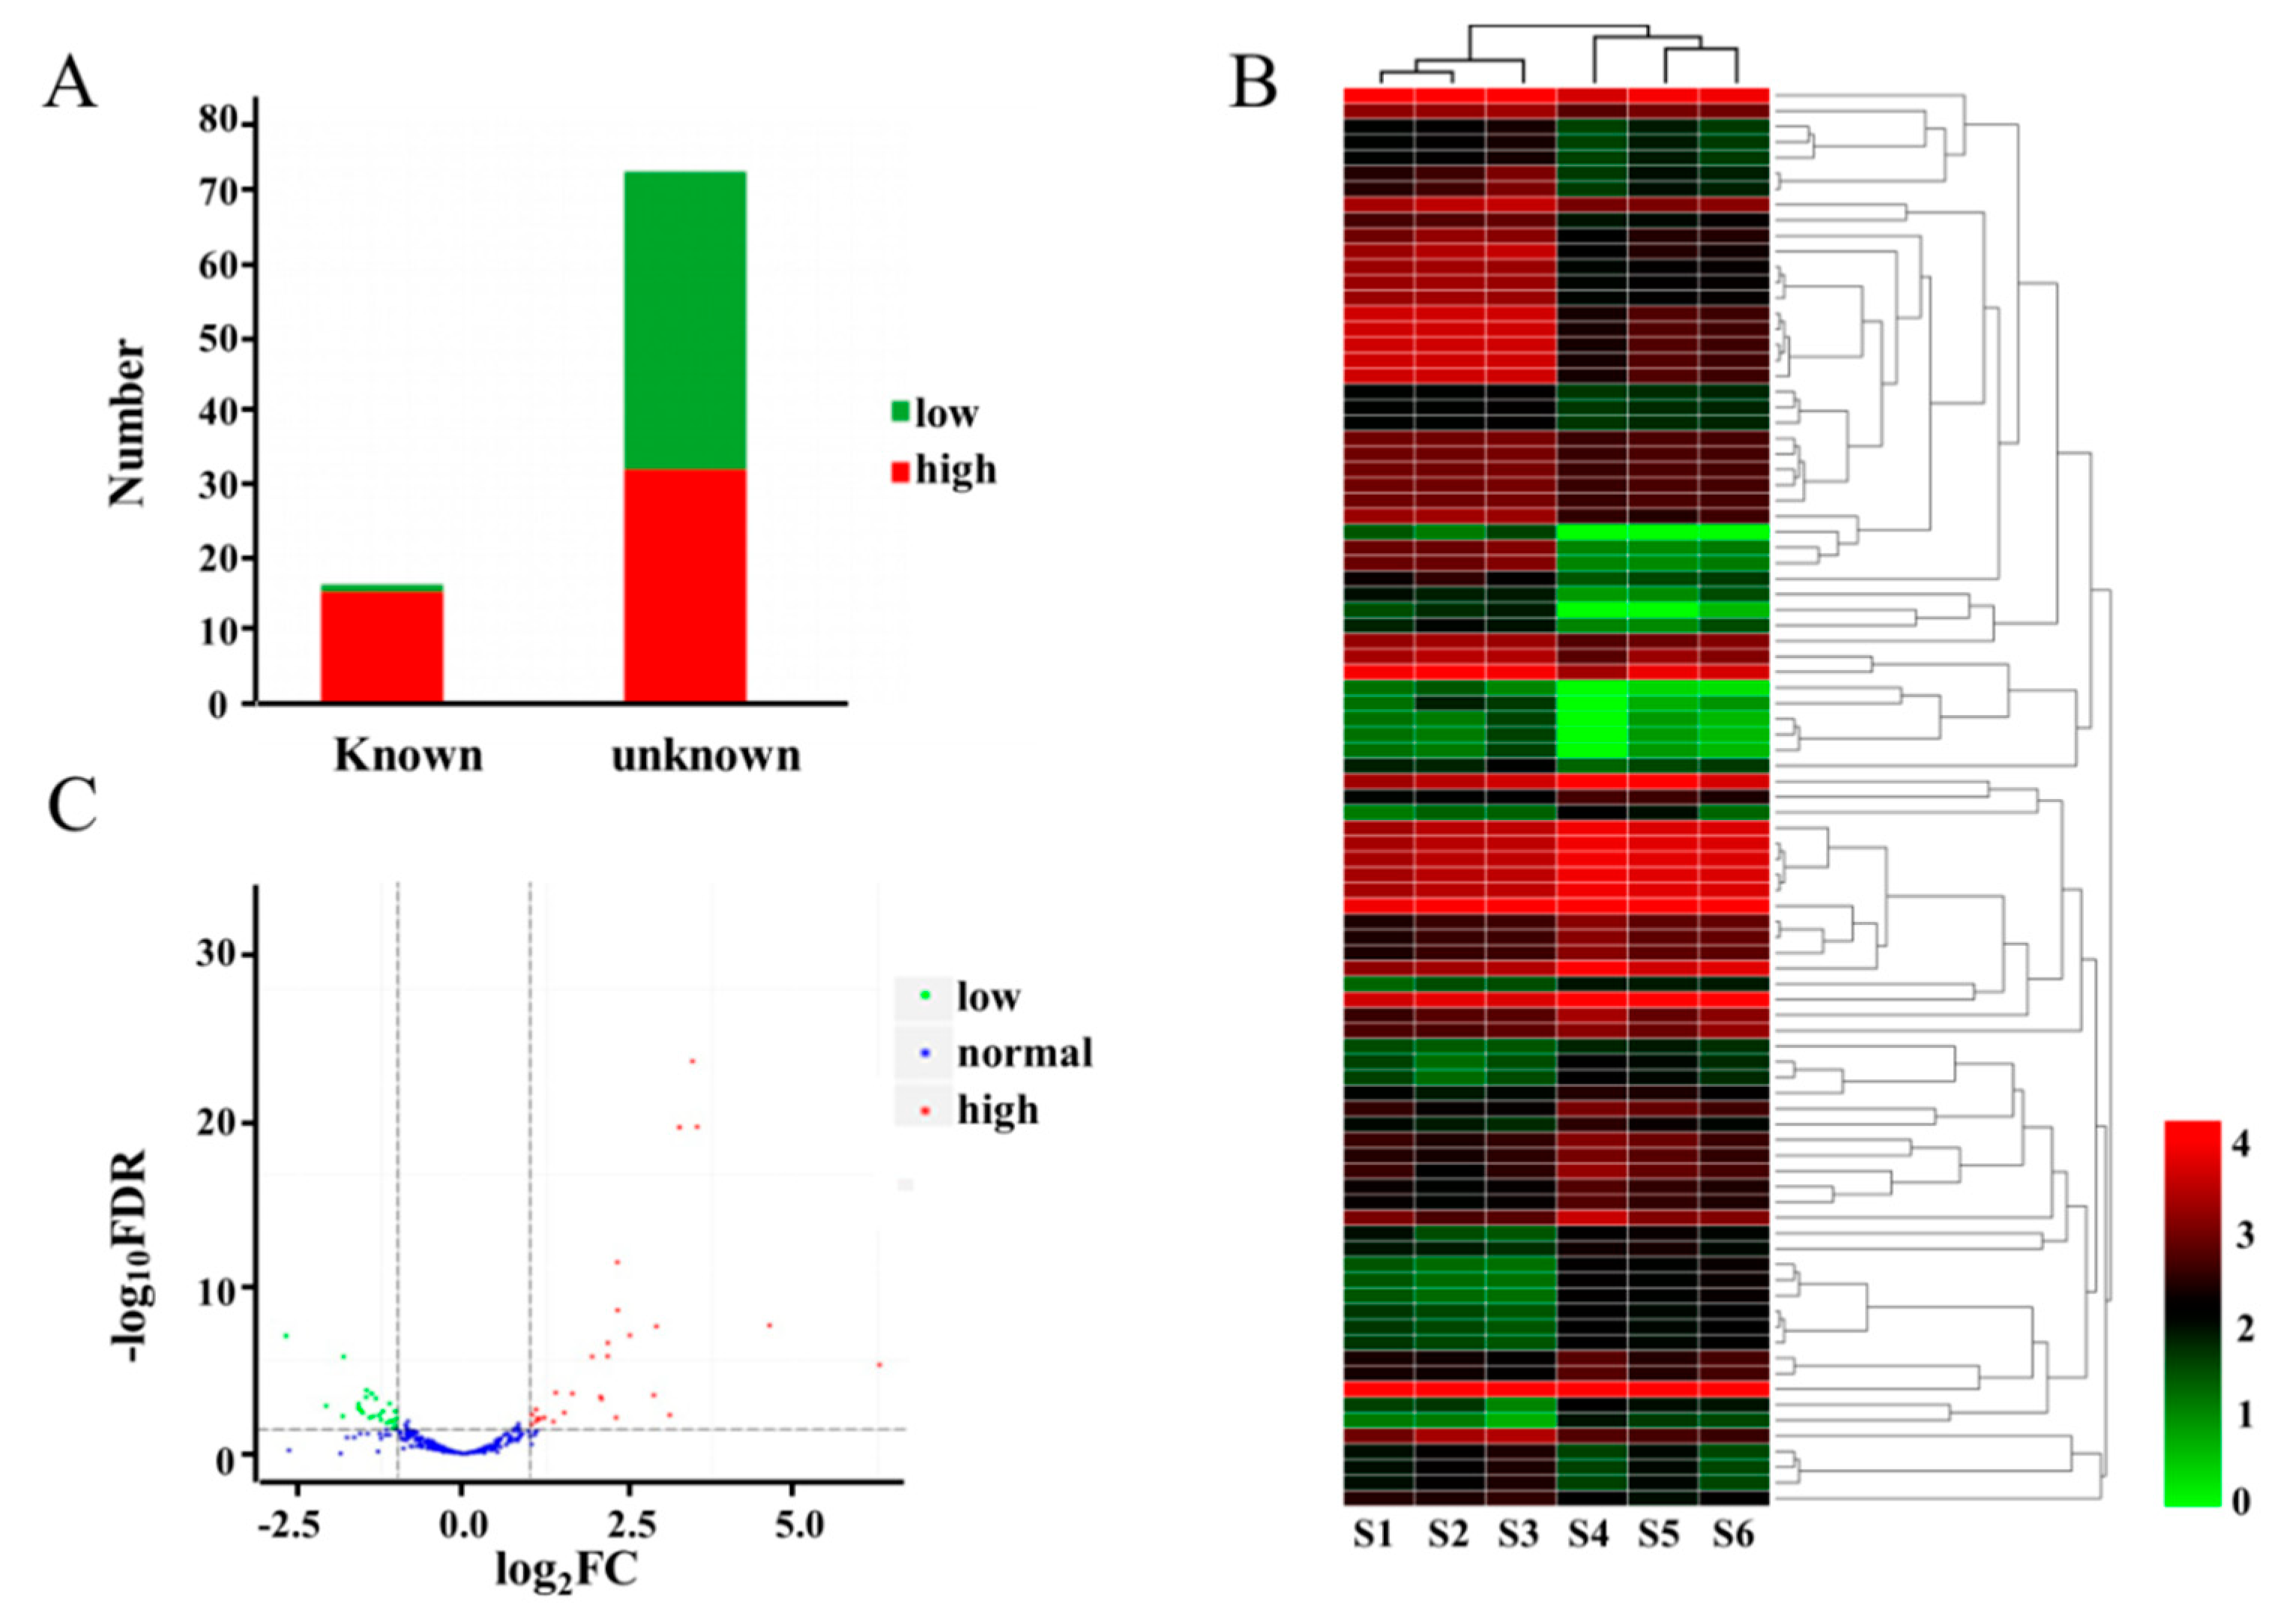
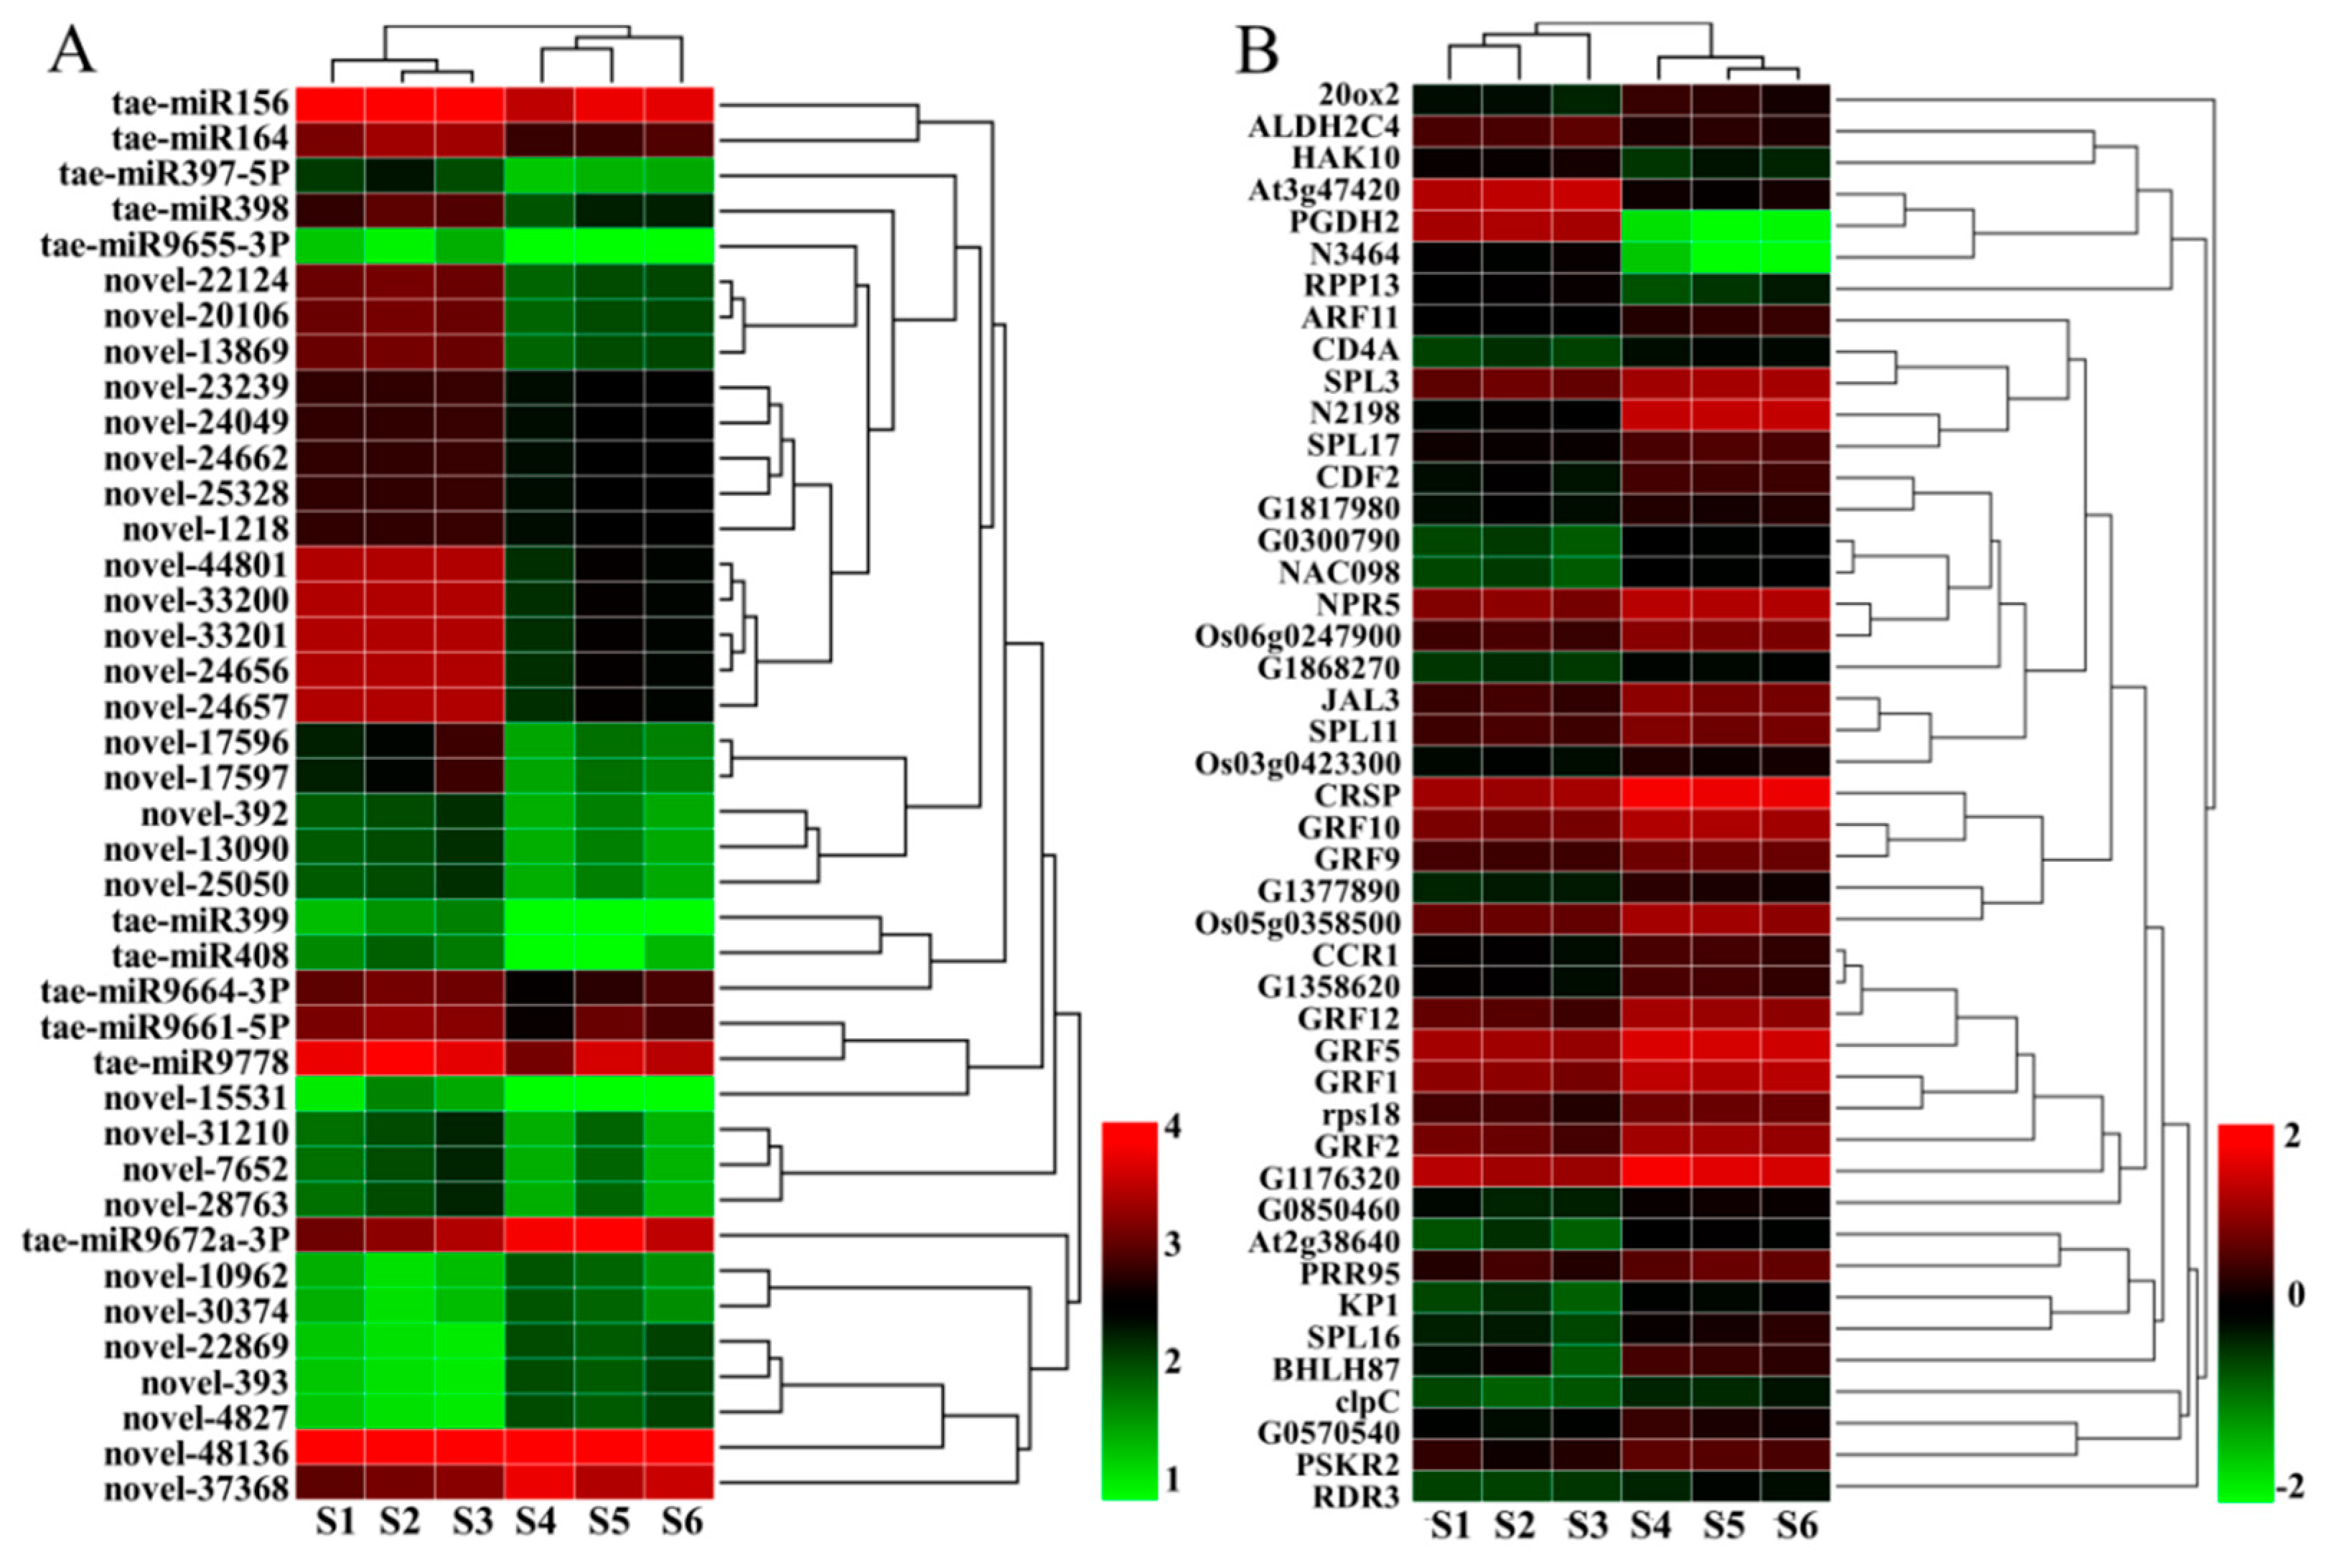
2.4. DEMs between WT and dmc

A total of 91 miRNAs (p < 0.05) were significantly differentially expressed between dmc and WT (Figure 3, Table S5). Among the 91 differentially expressed miRNAs (DEMs), 17 of the miRNAs were known, while 74 were novel, of which 49 were highly expressed, and 42 were lowly expressed in dmc compared to WT (Figure 3A, 3C). The expression levels of DEMs were also hierarchically clustered (Figure 3B). The top three miRNAs with the biggest expression difference were all highly expressed in dmc (FC > 60). Among the 17 known miRNAs, tae-mir9655-3p, tae-miR399, and tae-miR9675-3p were the top three highly expressed miRNAs in dmc (FC > 10). tae-miR156 was highly expressed in dmc (FC > 4) with more than 2900 Transcripts Per Million (TPM), and, of the known miRNAs, had the highest abundance. Among the 74 novel miRNAs, five miRNAs, novel-10992, novel-4704, novel-13869, novel-22124, and novel-20106, were highly expressed in dmc (FC > 10), whilst novel-22869, novel-393 and novel-4827 were highly expressed in WT (FC > 6). Novel-48136 was also highly expressed in WT (FC > 3) with more than 7000 TPM, and was the highest abundance novel miRNA, which suggested that it might be the major miRNA related to wheat tillering. These significant DEMs were the key regulatory miRNAs causing the phenotype of dmc.

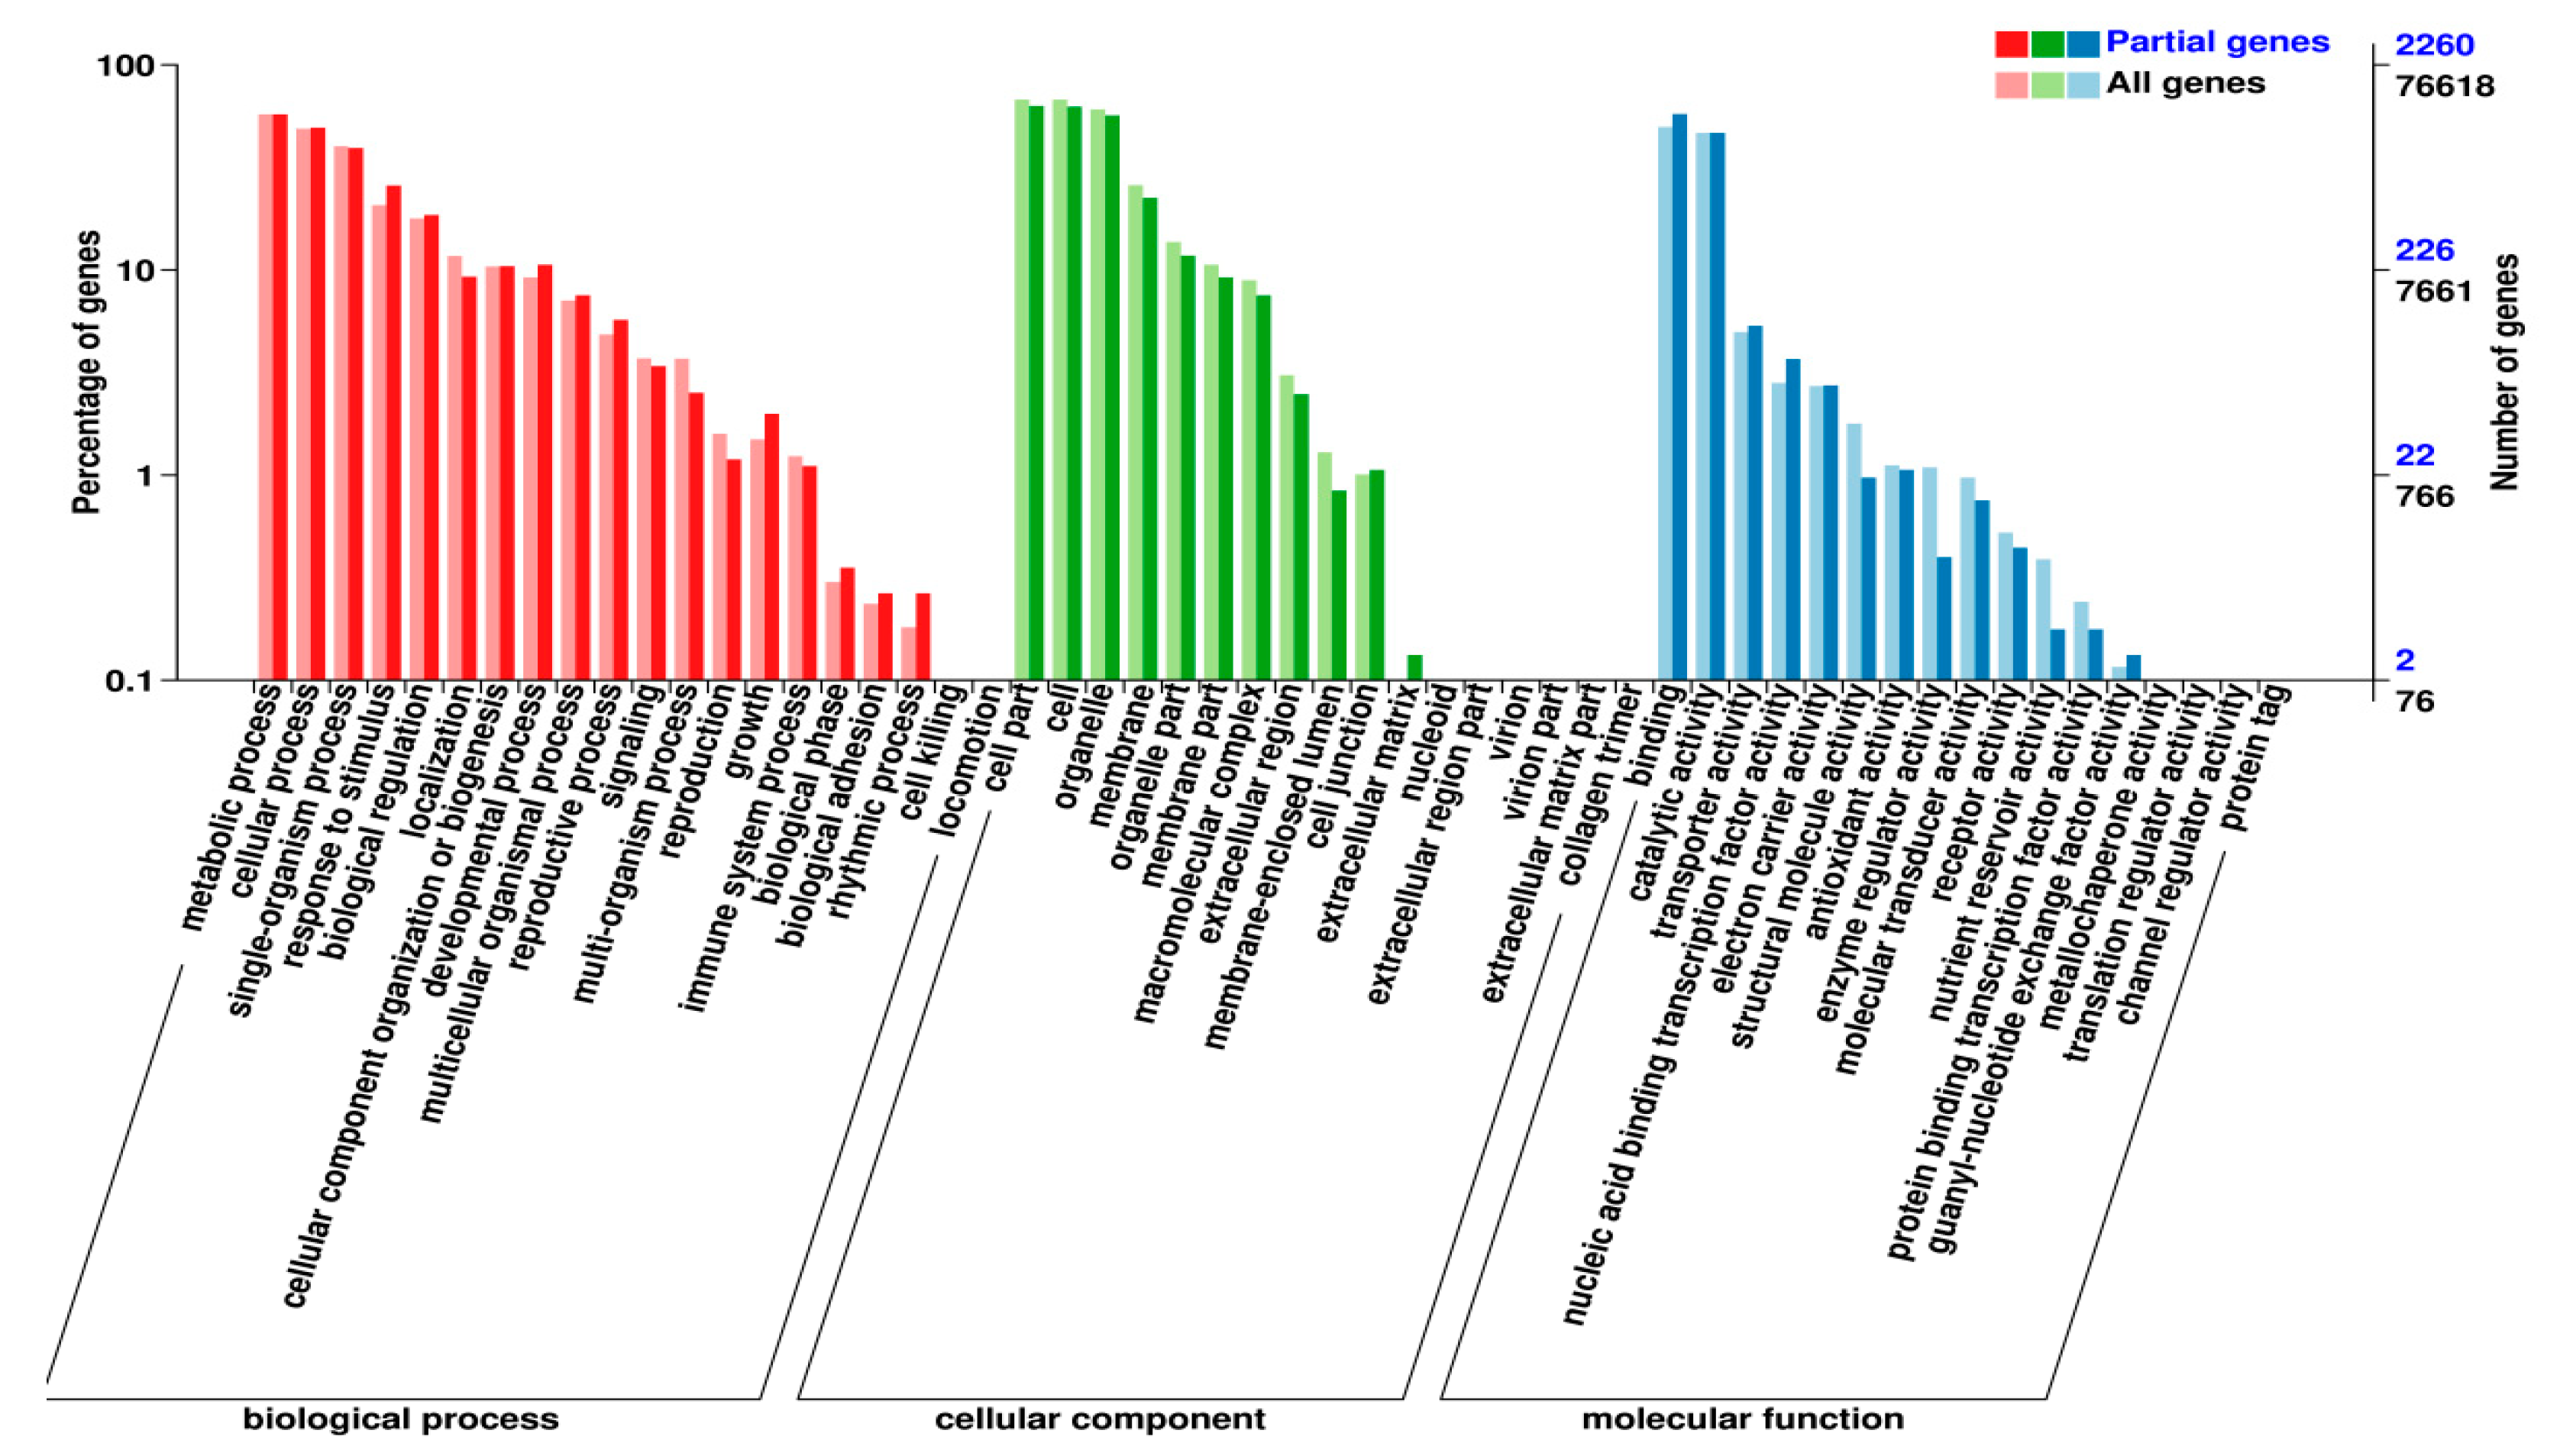
2.5. The DEMs’ Targets and Their Functions

To gain insight into the functions of the DEMs during wheat tillering, we predicted their potential target genes and annotated them, referring to the database Gene Ontology (GO). Functional classification showed that the following aspects were significantly different between mutant dmc and WT: (1) biological process: multi-organism process and rhythmic process; (2) cellular component: membrane-enclosed lumen and extracellular region; (3) biological process: structural molecule activity, enzyme regulator activity, and nutrient reservoir activity, which were closely related to the phenotype of dmc (Figure 4).
A total of 3254 mRNAs were targeted by the 91 DEMs, and 299 GO terms were selected at P < 0.05 (Table S6). The top three most enriched GO terms were the apoptotic process (GO:0006915), defense response (GO:0006952), and adenosine diphosphate (ADP) binding (GO:0043531).
The Kyoto Encyclopedia of Genes and Genomes (KEGG) annotation indicated that the DEMs and their targets belonged to 69 KEGG pathways. The enriched pathways (Table 1) were protein processing in the endoplasmic reticulum (ko04141), spliceosome (ko03040), and circadian rhythm-plant (ko04712), etc. By comparing the KEGG pathways of DEMs with the KEGG pathways of differentially expressed genes (DEGs) derived from the same samples [36], nine the same KEGG pathways were found, including arginine and proline metabolism (ko00330), butanoate metabolism (ko00650), carbon metabolism (ko01200), carotenoid biosynthesis (ko00906), fatty acid elongation (ko00062), fructose and mannose metabolism (ko00051), glycerophospholipid metabolism (ko00564), phenylpropanoid biosynthesis (ko00940), and starch and sucrose metabolism (ko00500), which were predicted to be related to tillering.

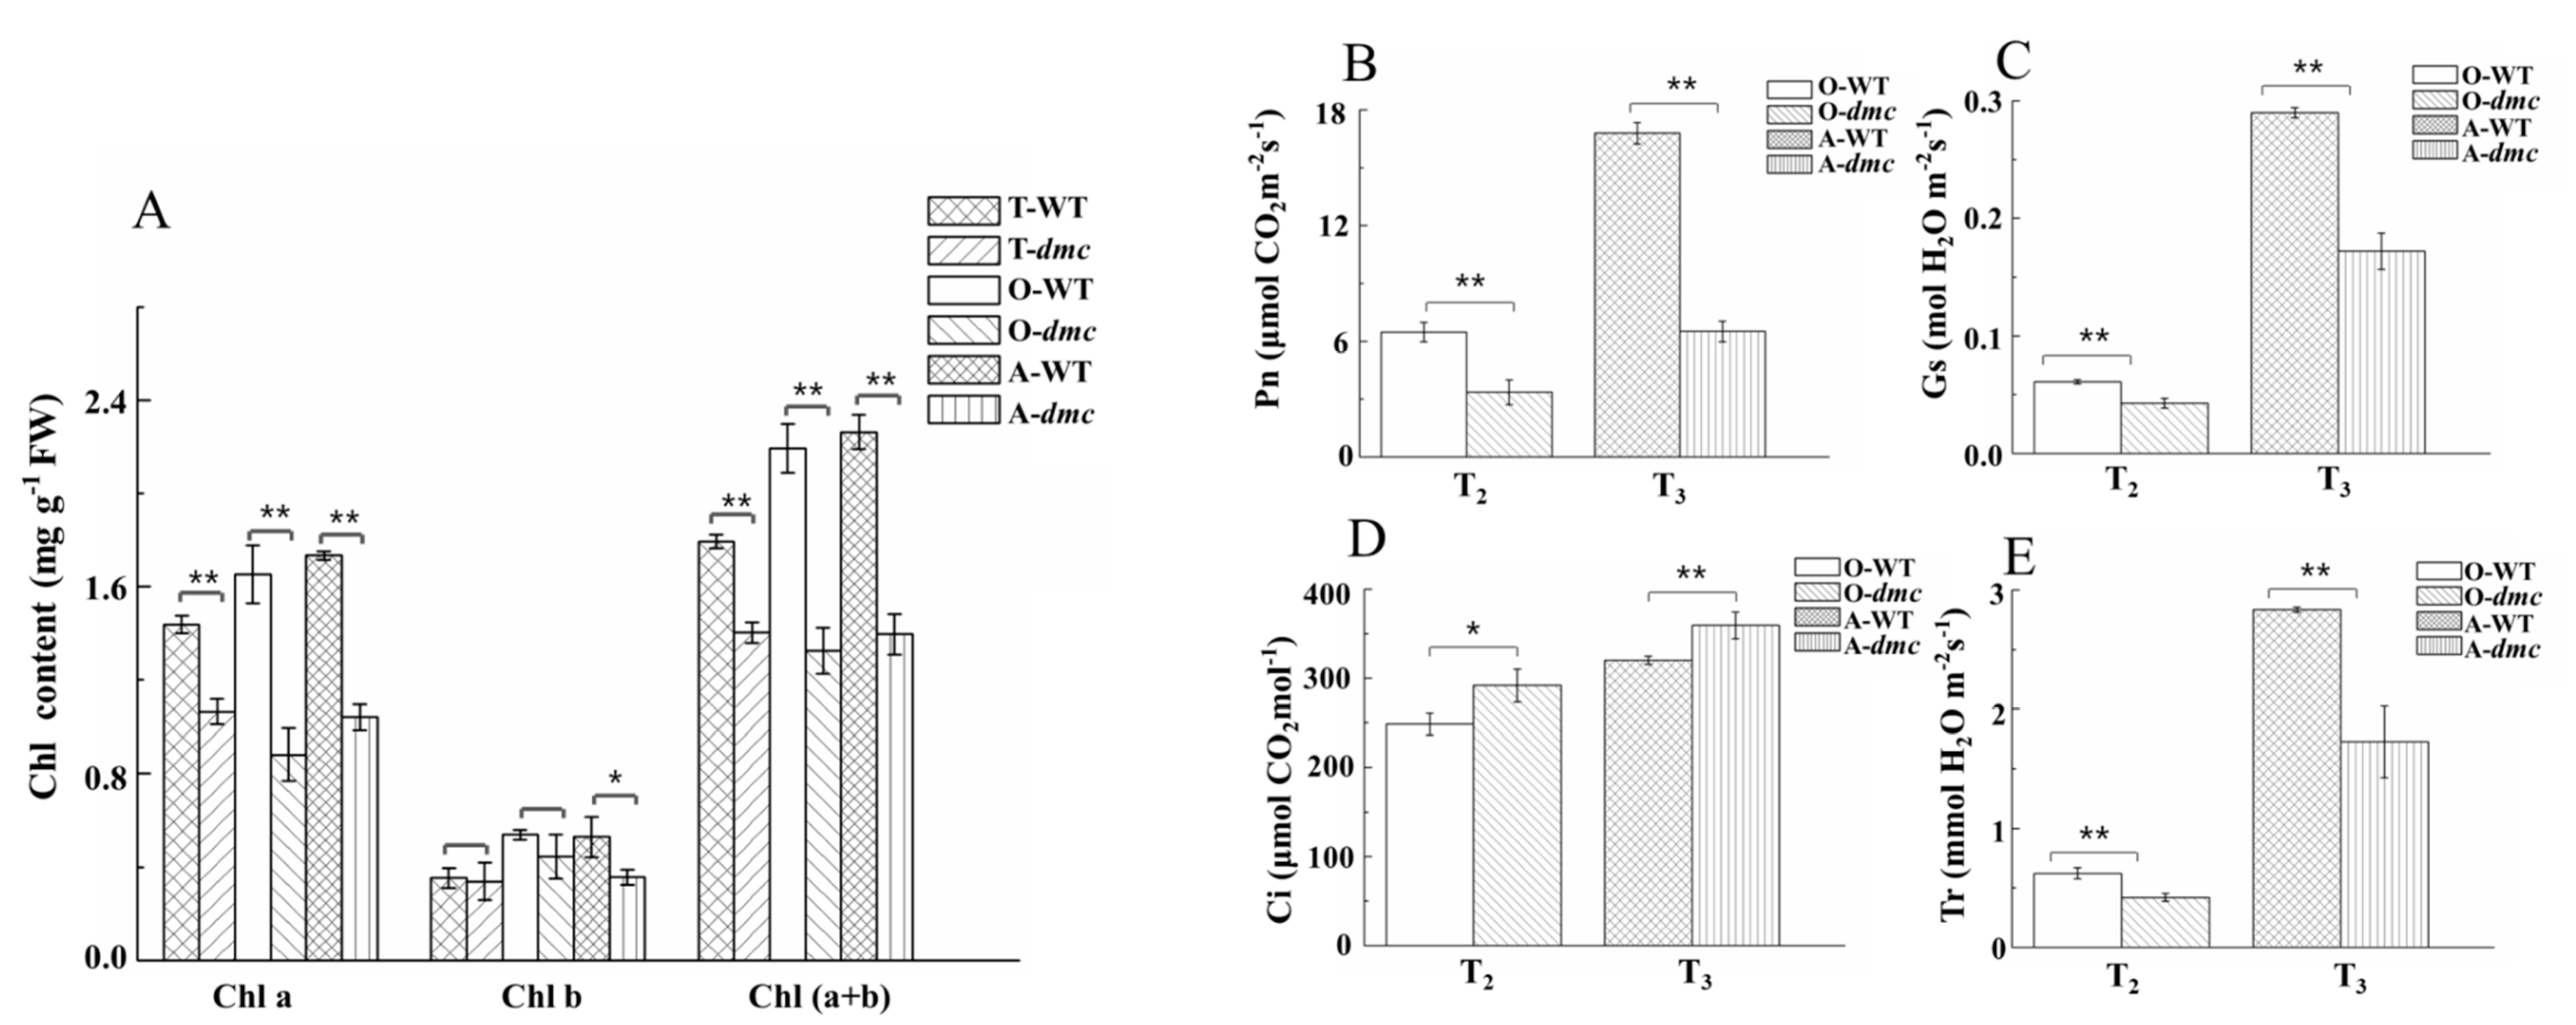
2.6. The Photosynthesis of dmc Was Weak at Tillering Stage

The leaf contents of chlorophyll a (Chl a), chlorophyll b (Chl b), chlorophyll (a + b) (Chl (a+b)) were significantly lower in dmc than that in WT at the three-leaf stage (T1), over-winter stage (T2), and the rising to jointing stage (T3) except the Chl b at T1 and T2 stages (Figure 5A, Table S7). The most significant difference was from Chl a. In dmc, the Chl a of the fully unfolded new leaves at the T2 and T3 stages had decreased by 17% and 2% compared to that at T1 stage. However, the Chl a of WT continuously increased during tillering, and they were 1.35, 1.88, and 1.67-fold of those in dmc at the same three stages. The contents of Chl b at the T3 stage and Chl (a + b) were also significantly different between dmc and WT, similar to that of Chl a (P ≤ 0.05).
Under natural conditions, the net photosynthetic rate (Pn), stomatal conductance (Gs), and transpiration rate (Tr) of dmc were significantly lower than that of WT at the T2 and T3 stages (Figure 5B–E, Table S7). The most significant difference was Pn. The average Pn value of WT was more than two times those of dmc at the T3 stage. In opposite, the internal CO2 concentration (Ci) was higher in dmc than that in WT, whether at the T2 or T3 stage. The Pn and Gs increased by about 49% and 75% in dmc, and 61% and 79% in WT; Ci and Tr increased by about 18% and 76% in dmc, and 22% and 78% in WT from the T2 to T3 stage. All the change rates of WT were higher than that of dmc. Obviously, the photosynthesis capacity of dmc was significantly lower than that of WT during tillering; this was an important cause for the lack of energy in dmc, which in turn affected its tillering.

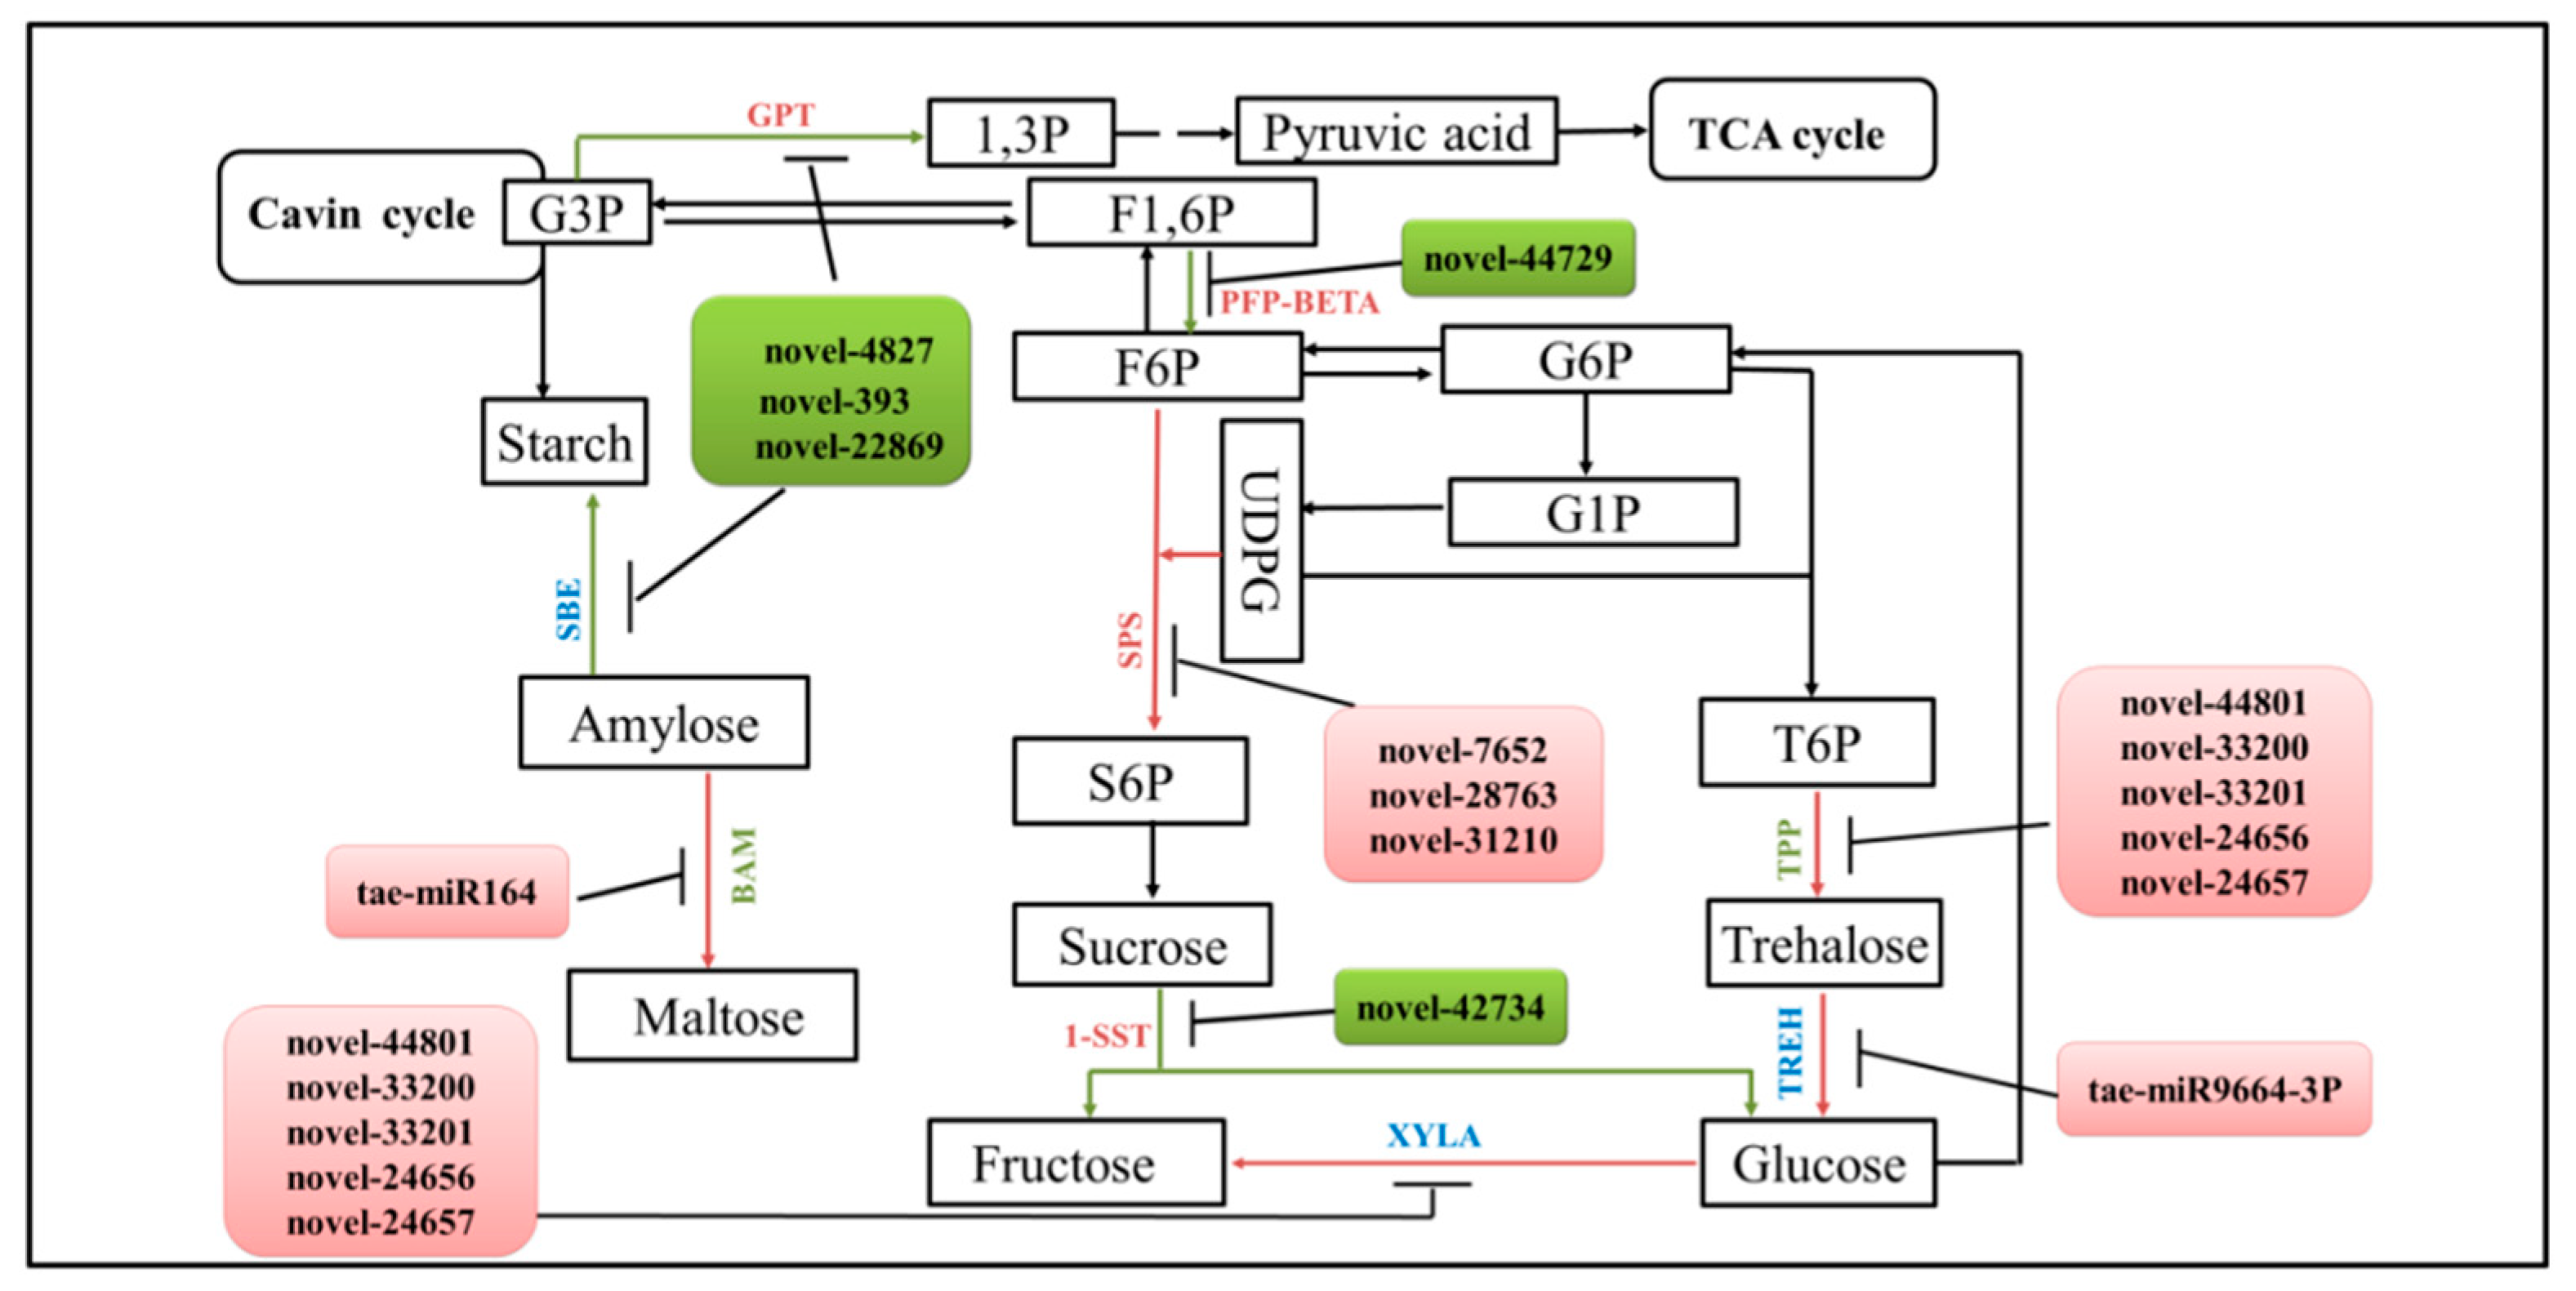
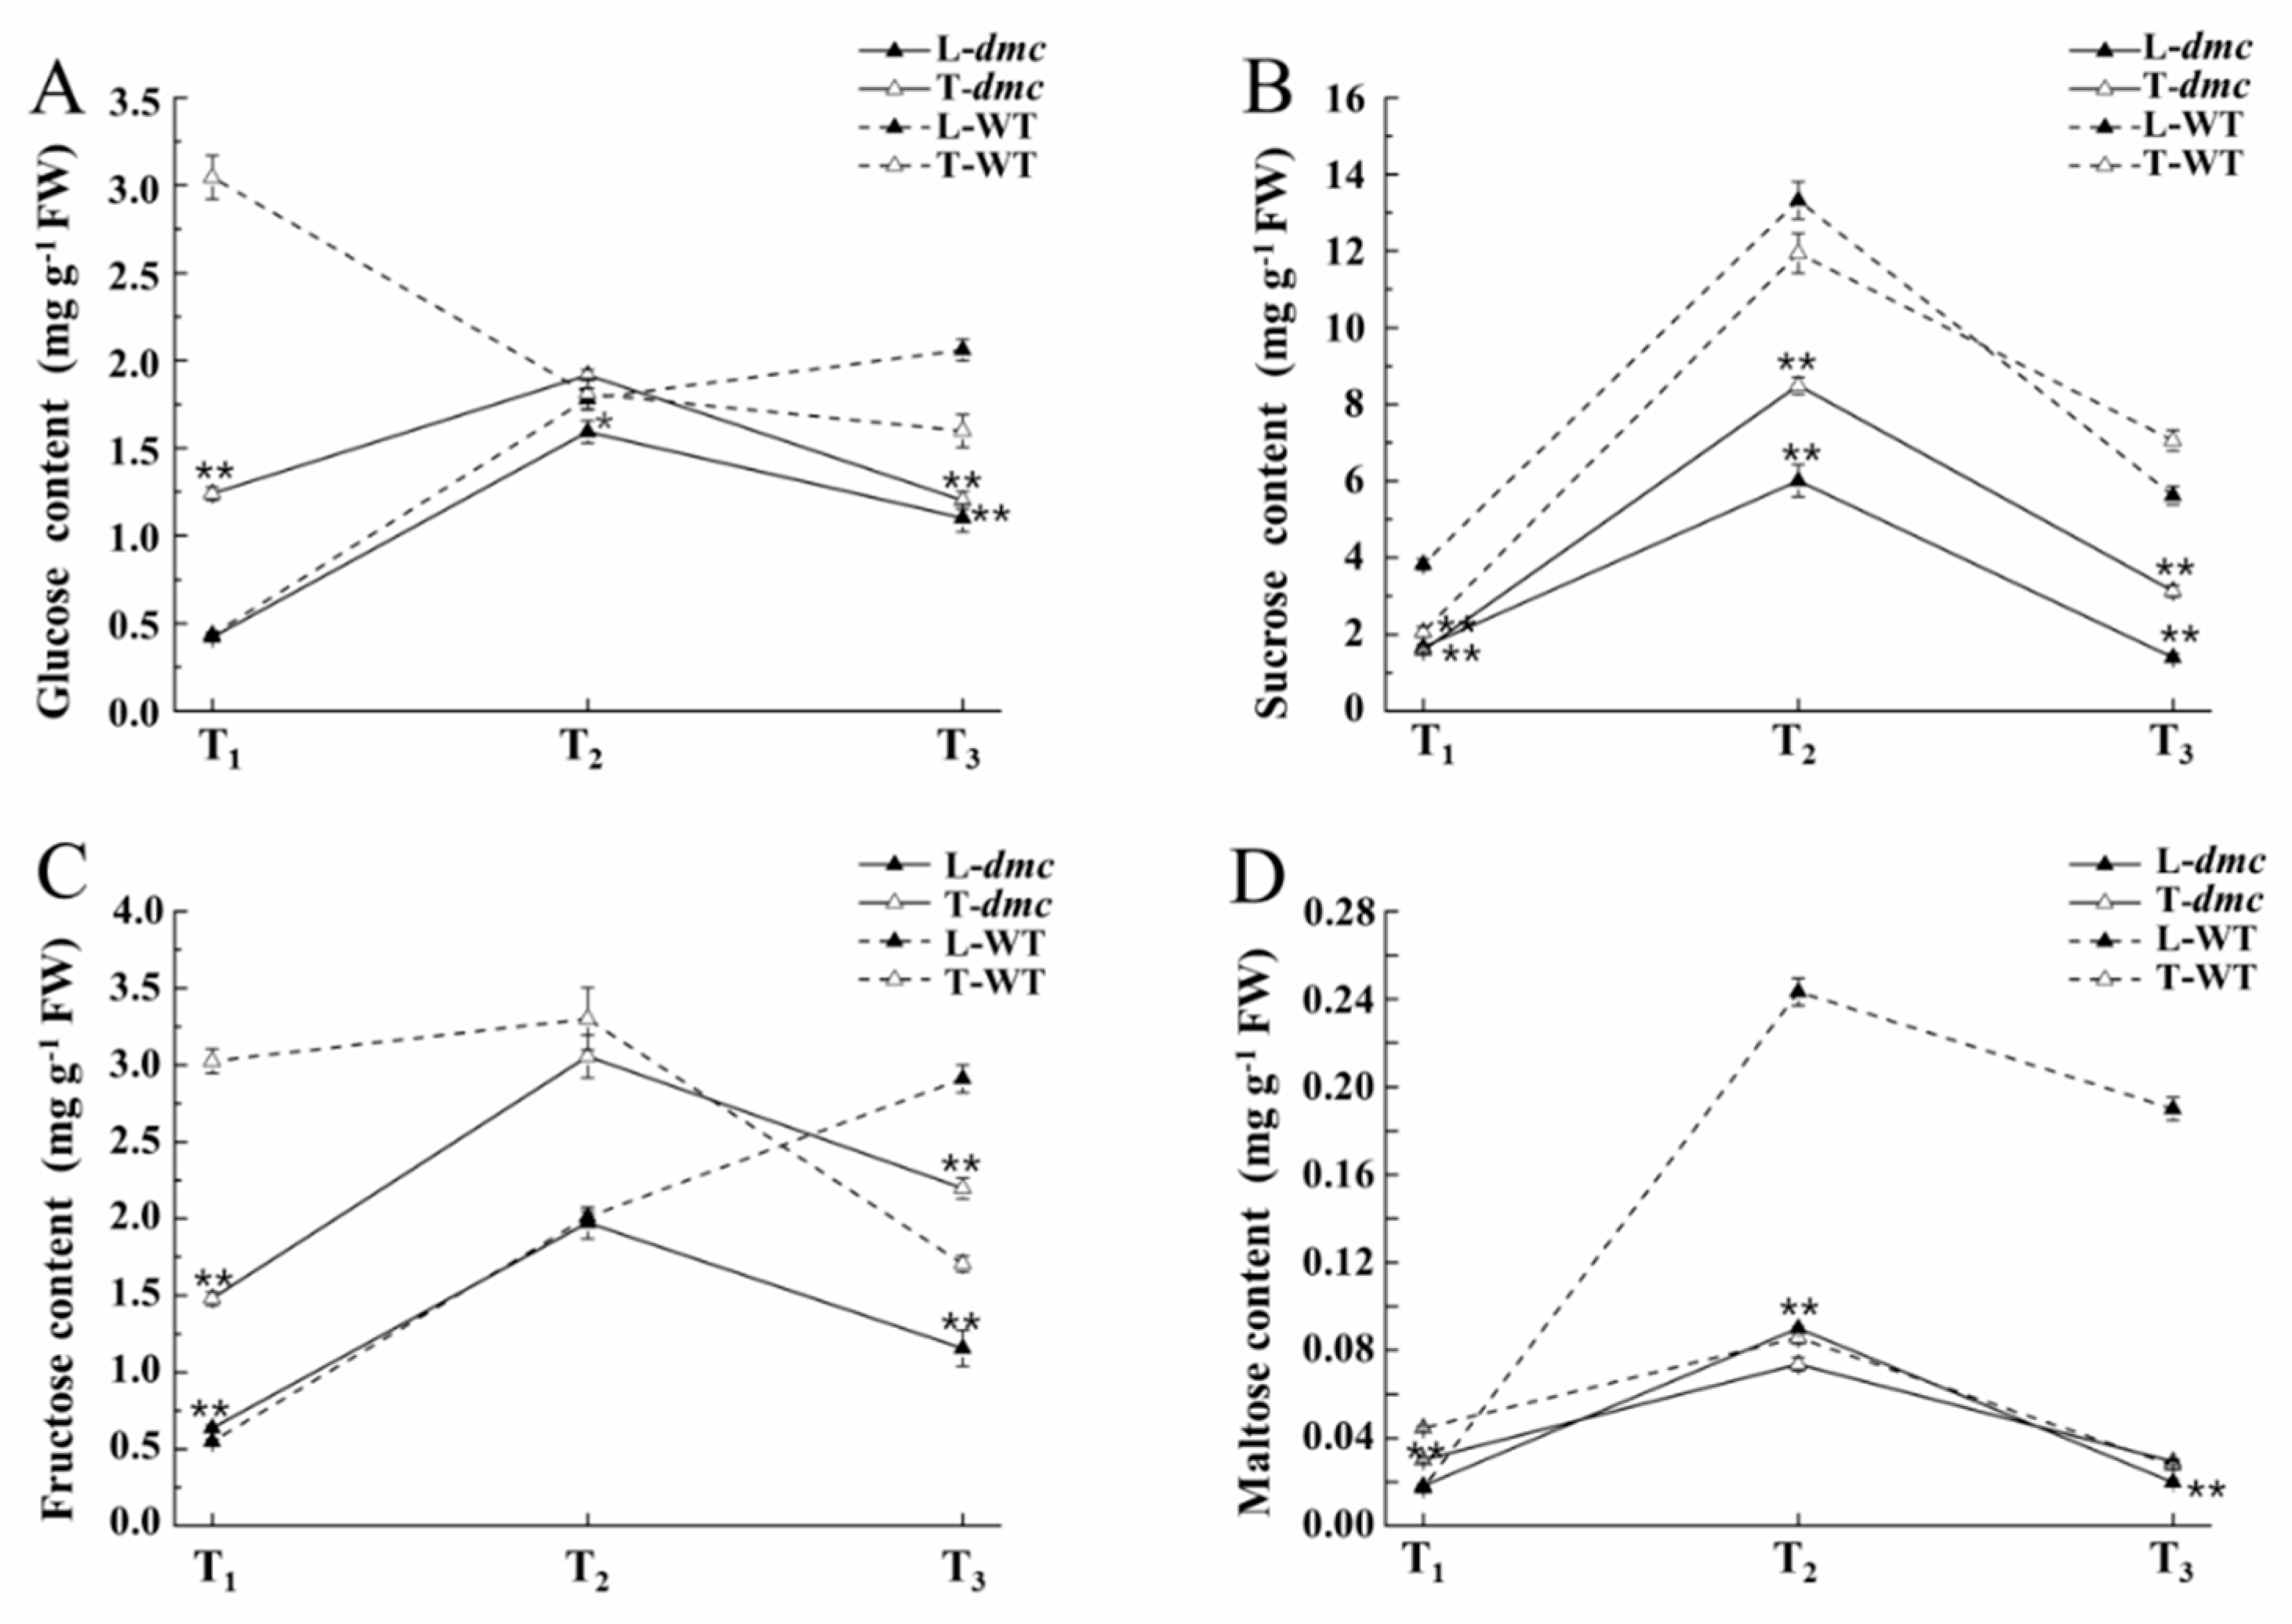
2.7. Carbohydrate Contents in Leaves and Tiller Nodes of dmc and WT During Tillering

Transcriptomic analysis indicated that the starch and sucrose metabolism (ko00500) was one of the top ten enhanced KEGG pathways. In this study, fourteen significant DEMs were found to target DEGs involved in carbohydrate metabolism (Figure 6). Among them, novel-44801, novel-33200, novel-33201, novel-24656, and novel-24657 were highly expressed in dmc; they regulate trehalose and fructose synthesis. miR9664-3P was highly expressed in dmc and regulates glucose synthesis; novel-42734 was lowly expressed in dmc and regulates sucrose hydrolysis; miR164 was highly expressed in dmc and regulates polysaccharide hydrolysis, and maltose synthesis; novel-4827, novel-393, and novel-22869 were lowly expressed in dmc and regulate starch biosynthesis.
In order to confirm the photosynthesis and carbohydrate metabolic results from the mRNA and miRNA analyses, the contents of four soluble sugars—glucose, sucrose, fructose and maltose—in leaves and tiller nodes of dmc and WT were determined (Figure 7; Table S8). Generally, the soluble sugar contents in tiller nodes of dmc were significantly lower. The glucose contents in the leaves and tiller nodes of dmc initially increased, then gradually decreased (Figure 7A). In contrast, the glucose contents in the leaves of WT increased gradually, but the glucose contents in the tiller nodes decreased gradually during tillering. The difference of glucose in tiller nodes at the T1 stage was the biggest; the glucose contents of WT were almost three times as that of dmc. Sucrose was the predominant soluble sugar in both dmc and WT (Figure 7B). All the contents were initially increased and then decreased in both leaves and tiller nodes. The sucrose contents in leaves and tiller nodes of dmc were less than those of the WT at the three stages. The decreased sucrose contents of dmc may be related to its low photosynthetic capacity and the decreased sucrose transport from leaves to tiller nodes. The fructose contents in the leaves of dmc—and tiller nodes both of dmc and WT—initially increased (Figure 7C), and then gradually decreased, but increased continuously in leaves of WT. At the T1 stage, fructose in tiller nodes of dmc was less than that in WT, but at the T2 stage, there was almost no difference between dmc and WT. At the T3 stage, the contents of fructose in tiller nodes of dmc were more than those in WT. Maltose contents were the least among the four determined soluble sugars (Figure 7D). At the T1 stage, there was no difference in maltose contents in leaves of dmc and WT, but the maltose contents in tiller nodes of dmc were less than those of WT. At the T2 and T3 stages, there was no difference in maltose contents in tiller nodes, but maltose contents in leaves of dmc were lower than those of WT.

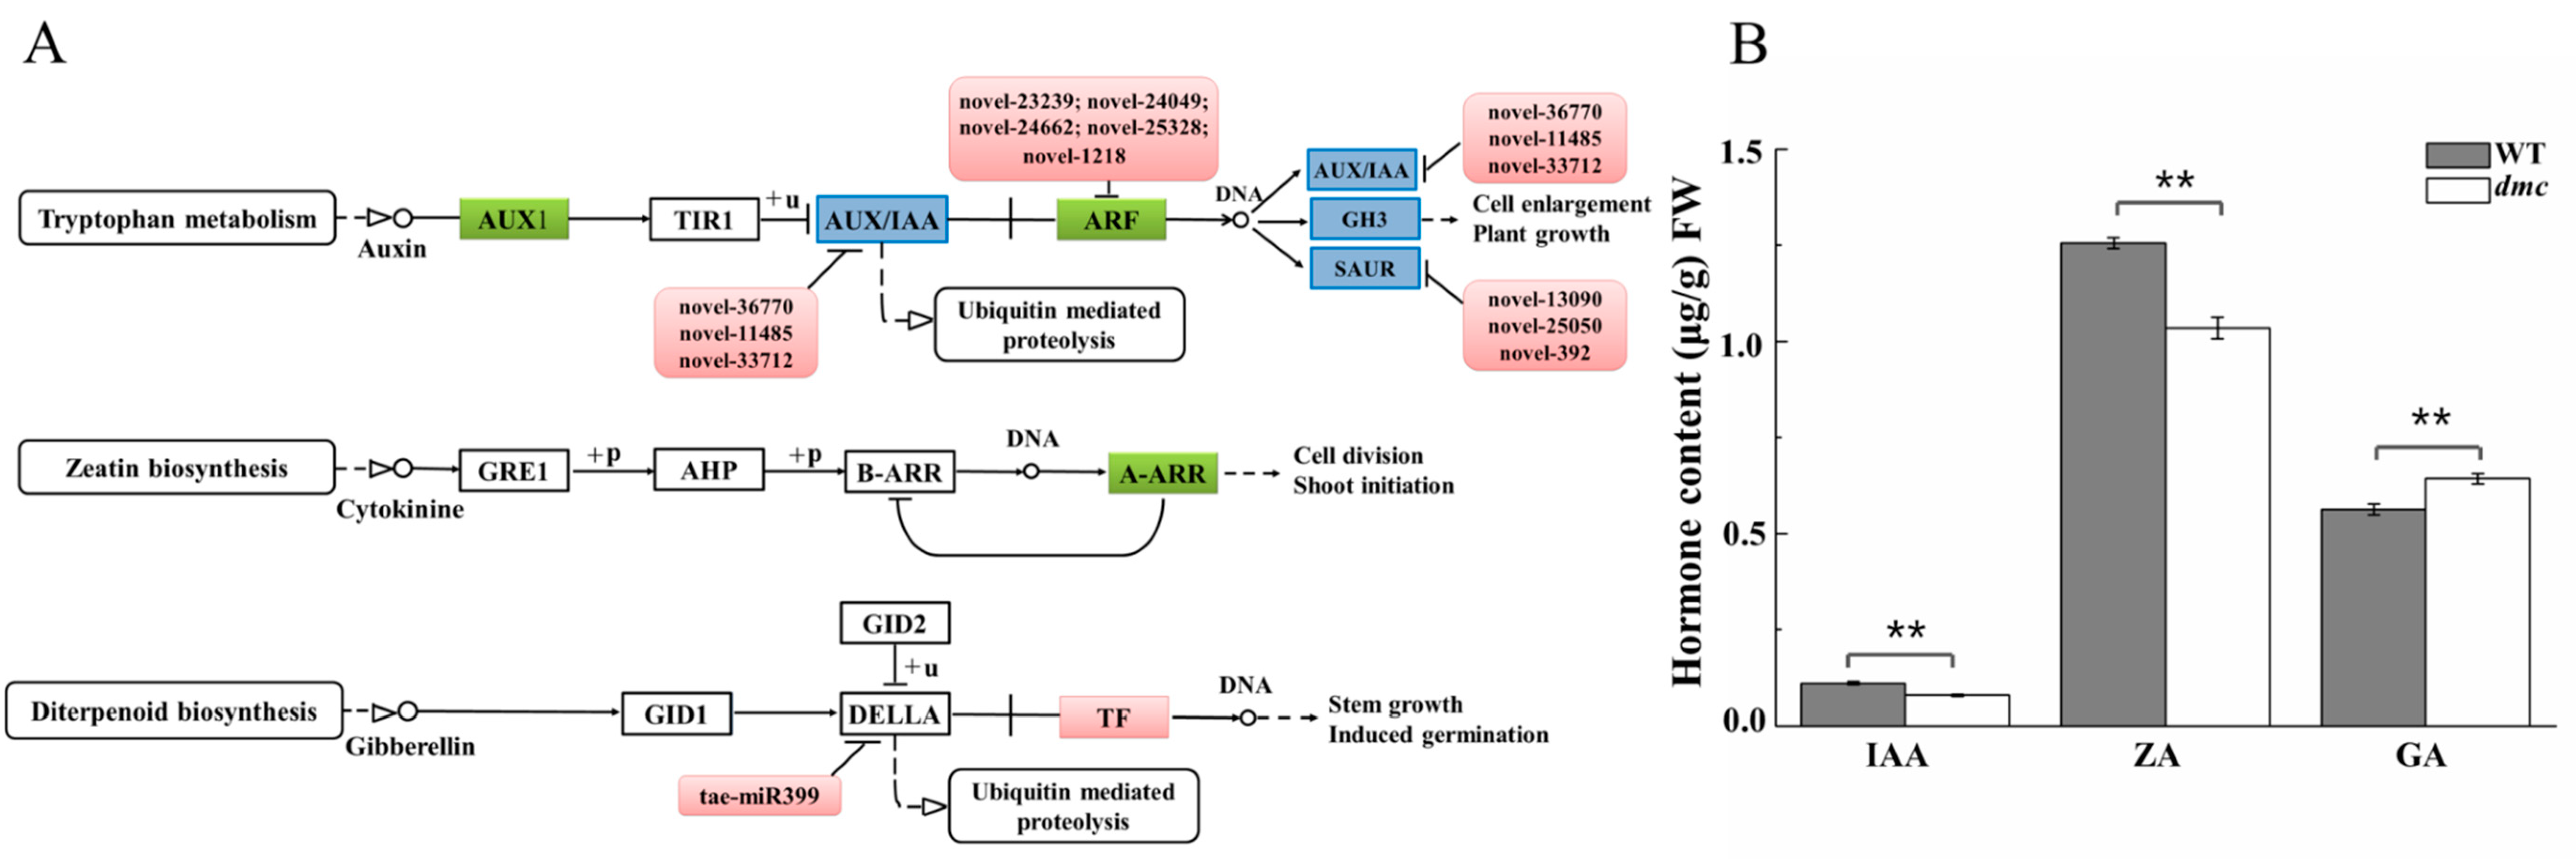
2.8. The IAA, ZA, GA Metabolism Pathways in dmc

Transcriptomic analysis indicated that there were 11 DEGs—IAA14, IAA31, IAA2, IAA27, IAA25, ARF11, ARF2, GH3.7, NPF2.3, GH3.11, and ARG7—involved in IAA metabolism; one down-regulated gene, ARR9, involved in ZA metabolism, and one up-regulated gene, PIF3, involved in GA metabolism (Figure S3) [36]. Based on the KEGG analysis of the miRNA target genes and the expression of miRNAs, the eleven miRNAs were all highly expressed in auxin metabolisms, and miR399 was highly expressed in gibberellin biosynthesis in dmc. No DEMs regulating cytokinin metabolism were found (Figure 8A). Integrative analysis of miRNA and mRNA interaction found that ARF was down-regulated by five novel miRNAs: novel-23239, novel-24049, novel-24662, novel-25328, and novel-1218. The gibberellin 20 oxidase 2 (20ox2) gene was down-regulated by tae-miR164 (Table S9).
By comparing the hormone contents of dmc and WT at the three-leaf stage (Figure 8B, Table S10), we found that IAA and ZA were significantly less in dmc than that in WT, while GA were significantly more in dmc than that in WT. Among them, IAA in WT was 1.4-fold of that in dmc, ZA in WT was 1.2-fold of that in dmc, and GA in dmc was 1.1-fold of that in WT. These results were consistent with the sequencing results.

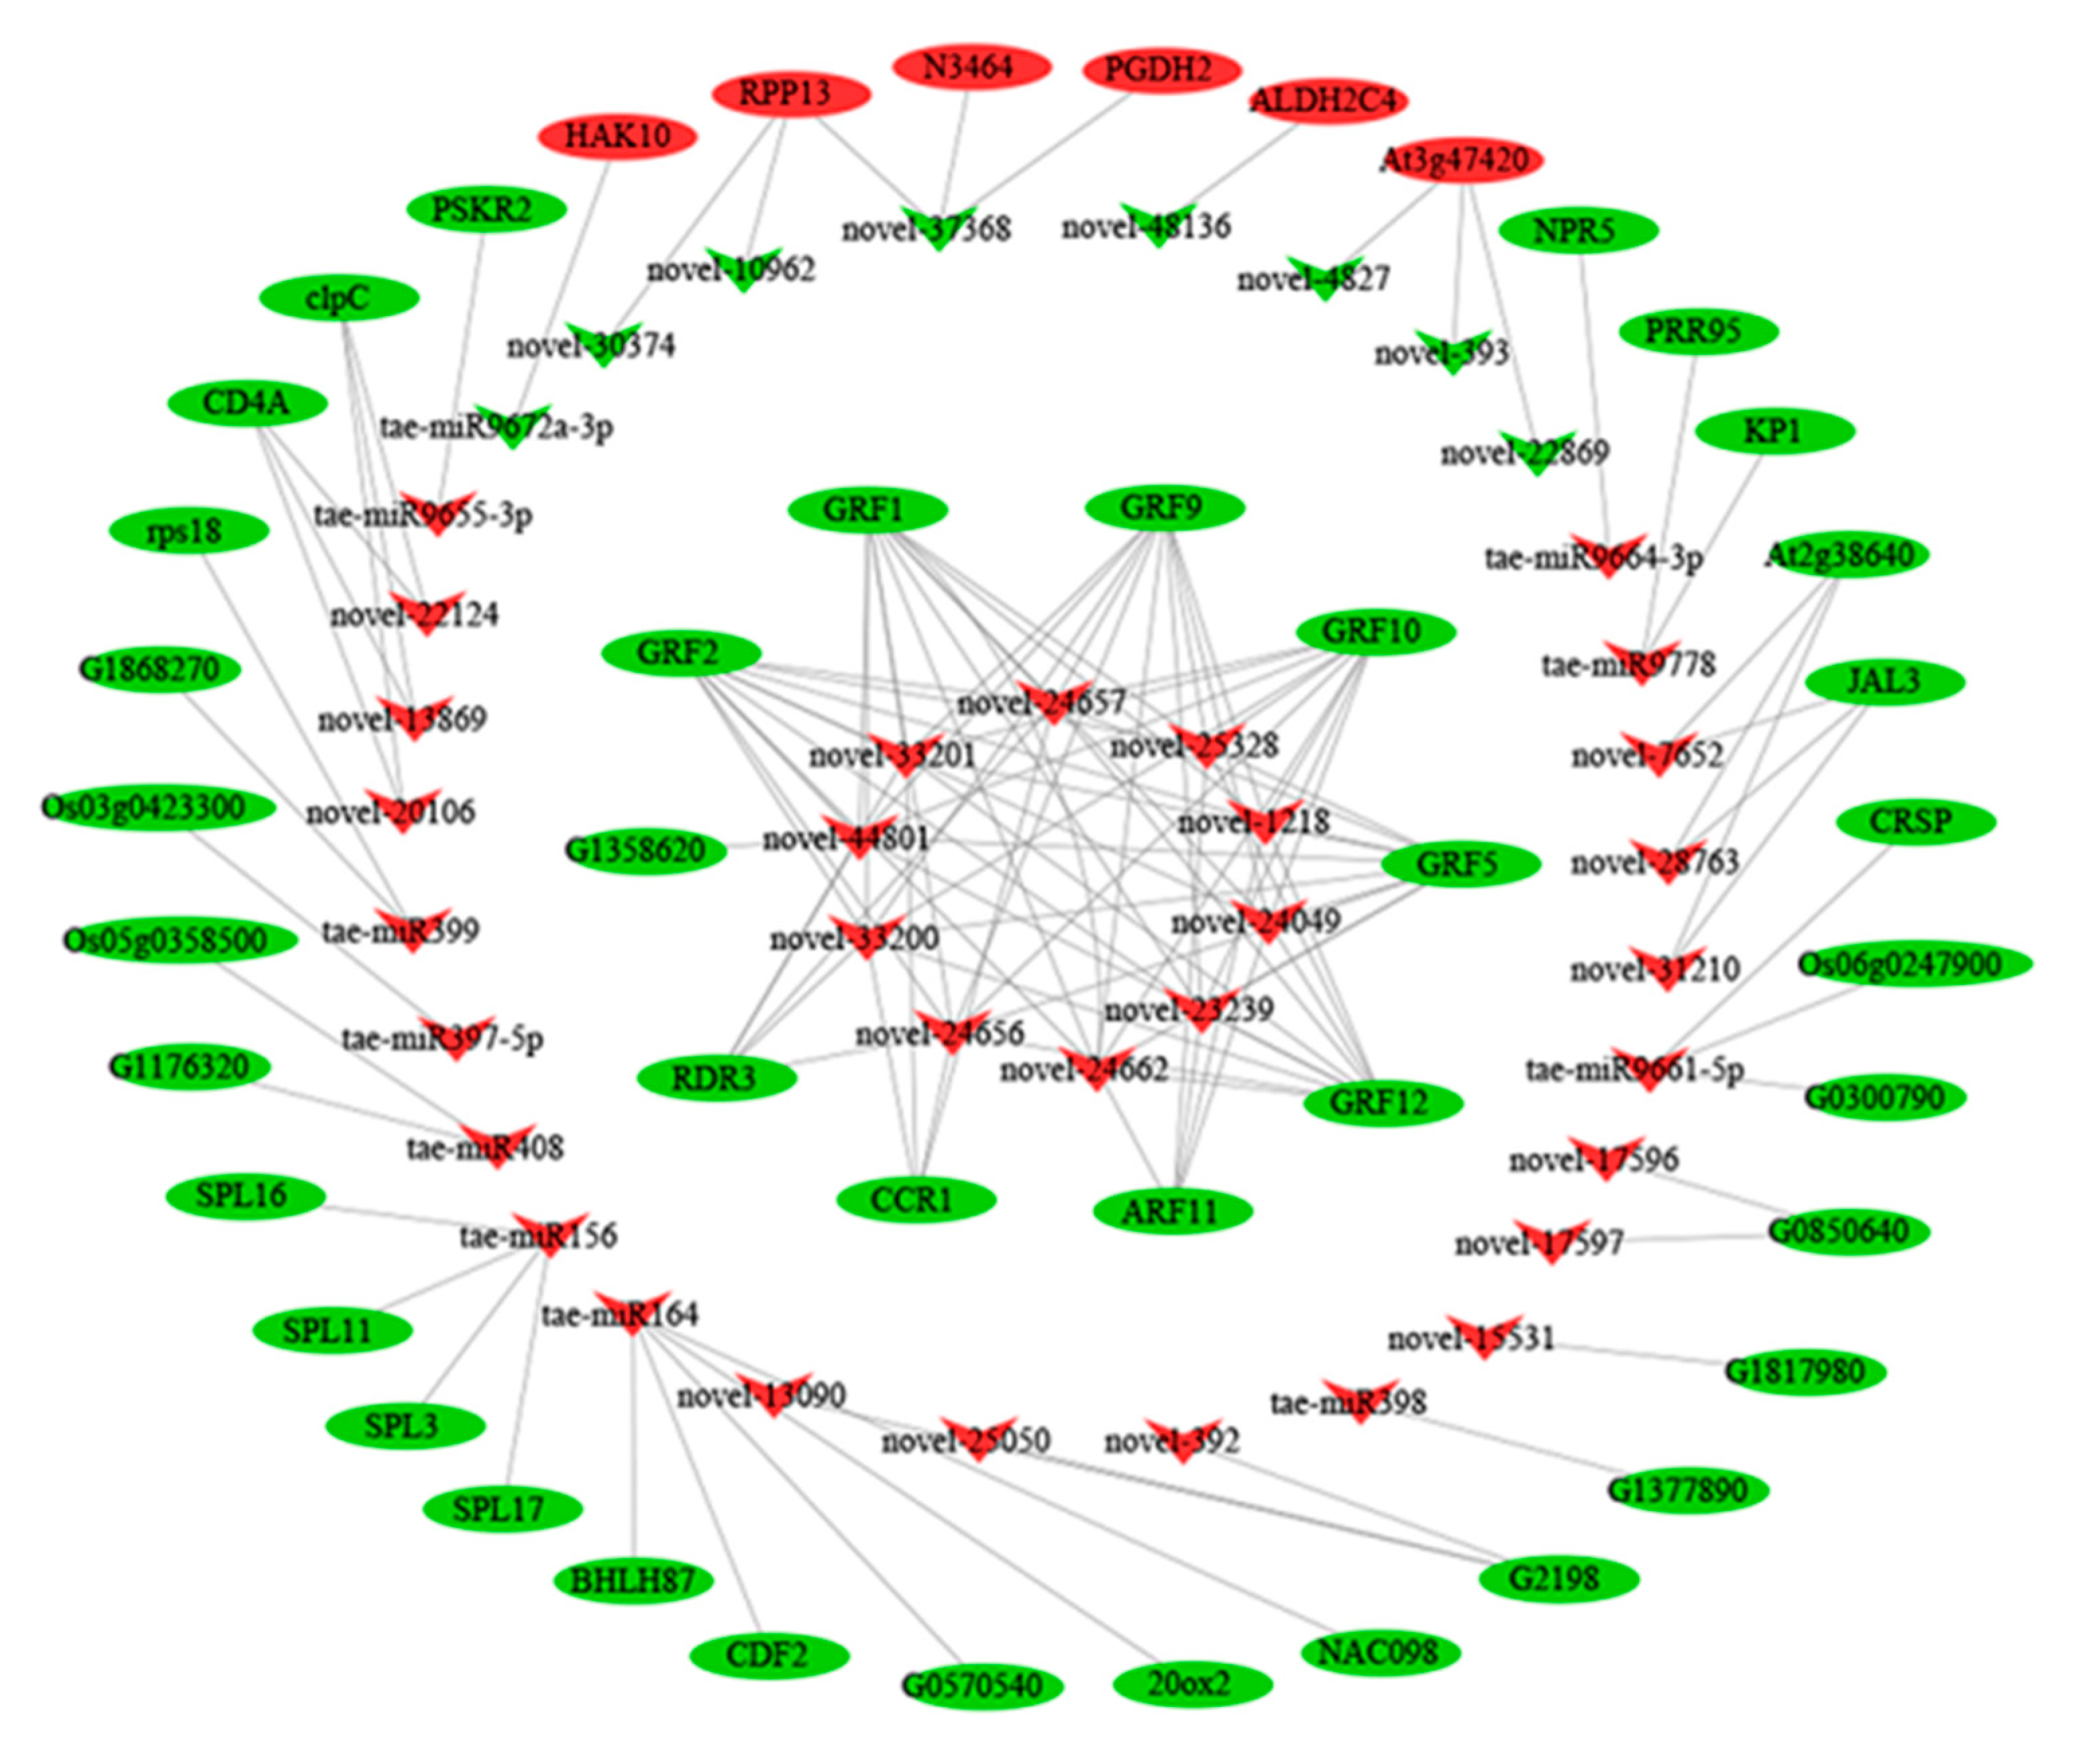
2.9. The miRNA–mRNA Networks Restricting dmc Tillering

The transcriptome and miRNome data were integrated and analyzed to find out the miRNA–mRNA networks restricting dmc tillering. Only the pairs of DEM–DEG with inverse expression profiles were selected for further functional analyses. Some DEMs only had one predicted target gene, but most DEMs had many target genes. Some target genes of the DEMs were also significant DEGs; the results here confirm that which are previously reported [36]. The data were shown in Table S11. In the end, 125 pairs of negative miRNA–mRNA interactions, including 40 DEMs, were identified. Thirty-four DEGs were known genes according to swiss-prot annotation. The expression patterns of DEMs and DEGs were hierarchically clustered (Figure 9). The regulation networks between the key DEMs and their target DEGs were displayed by Cytoscape (Figure 10, Figure S4, Table S9). Among the 40 miRNAs, 11 were known miRNAs, and 29 were novel miRNAs. One-third of the novel miRNAs belonged to the miR396 family, which mainly regulated GRF and ARF families and formed 65 pairs of miRNA–mRNA interactions. The novel-22869, novel-393, novel-4827, and tae-miR164 involved in carbohydrate and GA metabolism, respectively, were found.

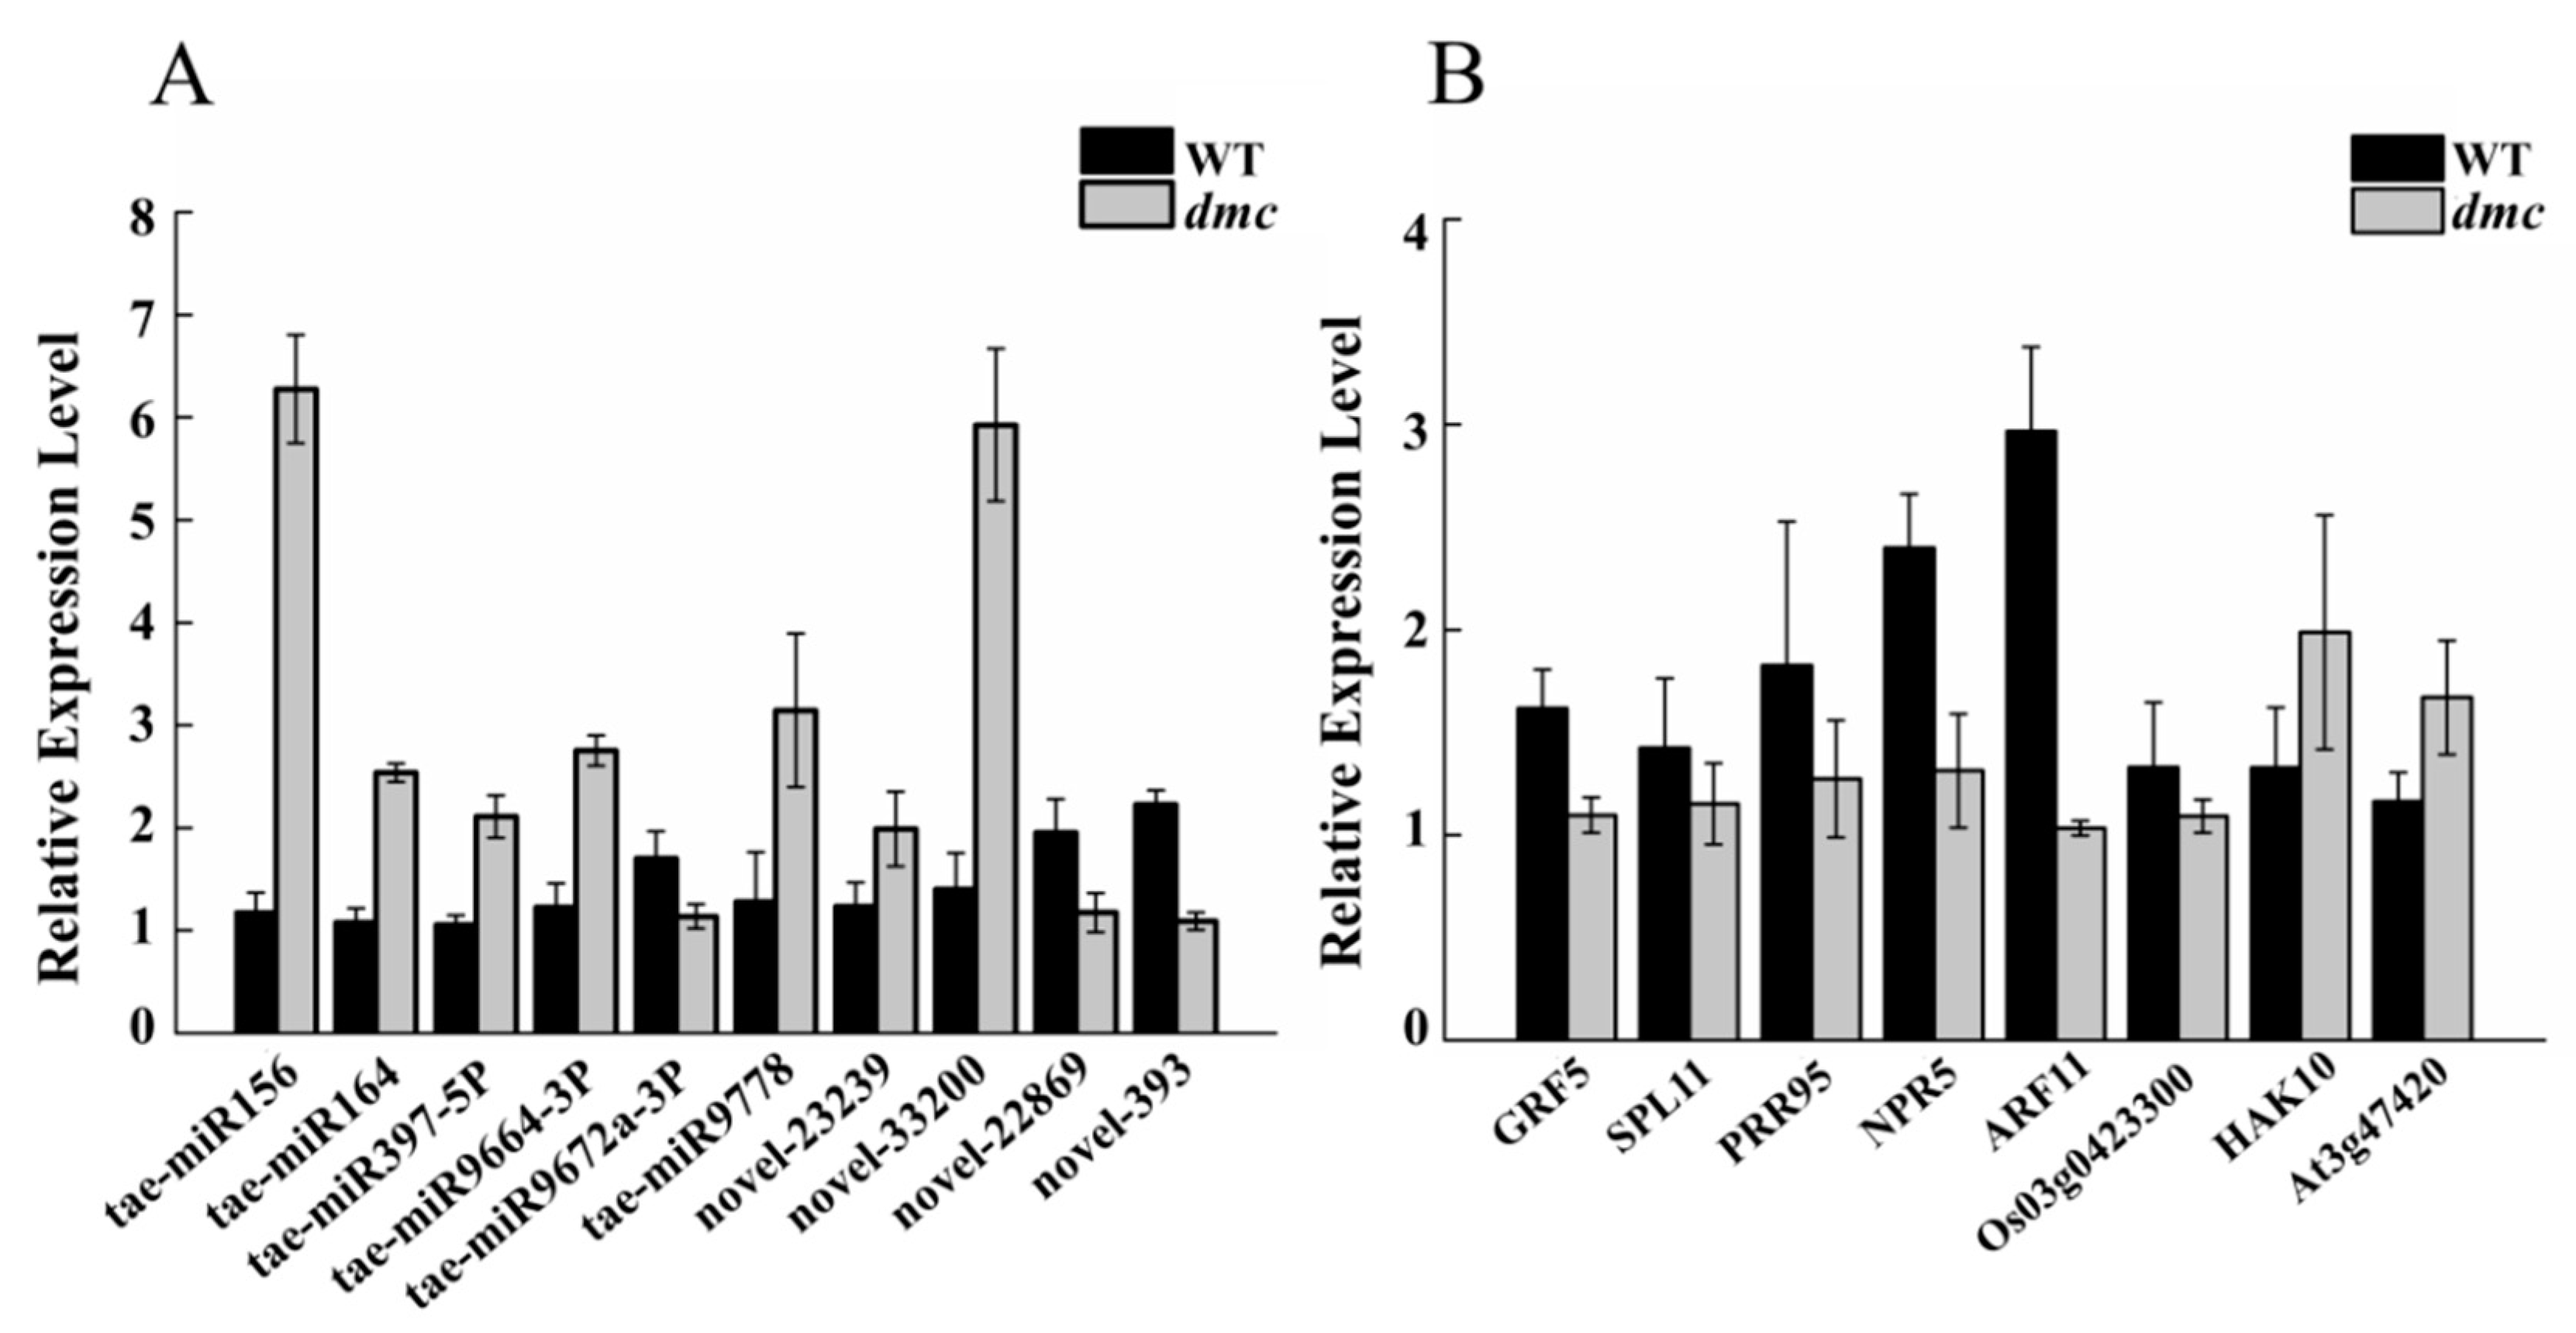
2.10. Expression Profiles of Ten DEMs and Their Eight Target DEGs

To confirm the reliability of the results derived from high-throughput miRNA sequencing and the miRNA–mRNA interaction analysis, we selected ten important DEMs and eight of their target genes to do real-time PCR (Figure 11A, Figure 11B, Table S9). Among them, six known miRNAs—miR156, miR164, miR397-5P, miR-9664-3p, and miR9778—and two novel miRNAs—novel-23239 and novel-33200—were highly expressed in dmc. Conversely, the novel-22869, novel-393, and miR-9672a-3p were lowly expressed in dmc.
The results indicated that all the target genes—including GRF5 (growth-regulating factor), SPL11 (squamosa promoter-binding-like protein), HAK10 (potassium transporter 10), PRR95 (two-component response regulator-like protein), NPR5 (regulatory protein), ARF11 (auxin response factor 11), Os03g0423300 (Acyl-[acyl-carrier-protein] desaturase 4), and At3g47420 (putative glycerol-3-phosphate transporter 1)—showed reverse expression profiles compared to their regulating miRNAs.

3. Discussion

3.1. The Tiller Primordia of dmc Lack Protein and Energy

Both wheat and rice tillers require exuberant meristems. Rice MOC1 acts to regulate the rice axillary meristem formation process [37]. In dmc, the tiller differentiation and development were severely inhibited. The chlorophyll contents and photosynthesis capacity of dmc plants were significantly lower (Figure 5). The tiller primordia had less protein content (Figure 2), less carbohydrate content (Figure 7), and lacked the viability of typical meristematic tissues (Figure 2). These factors led to a lack of enough energy and structural materials and caused the inability of the tiller primordia of dmc to grow out (Figure 1).

3.2. The Important miRNAs Regulate Wheat Tillering

A total of 91 important DEMs were identified in tiller primordia of dmc and WT, including 17 known and 74 novel miRNAs, which enriched wheat miRNA data. The predicted target genes of the DEMs, such as structural molecule activity, enzyme regulator activity, and nutrient reservoir activity, were significantly lowly expressed in dmc, which were consistent with its dwarf phenotype and almost no tillers. Similarly, other predicted target genes were involved in several important metabolic pathways such as arginine and proline metabolism, carbon metabolism, and starch and sucrose metabolism, etc.
Ten key known and thirty novel miRNAs were found to play important roles in tiller development in miRNA regulation network through comparison of the dmc and WT transcriptomes and miRNomes (Figure 10, Figure S4, Table S9). The tae-miR156, tae-miR9778, and novel-33200 genes were highly expressed in dmc. According to previous reports, miR156 mainly inhibits plant tillering or branching in many species such as maize, rice, Arabidopsis, and wheat [20,21,22,23]. For example, rice miR156 negatively targets OsSPL14, and the expression level of OsSPL14 and degree of tiller outgrowth suppression is clearly correlated [38]. These miRNAs reported here played important roles during wheat tillering.

3.3. The miRNAs Regulate Energy Metabolism in dmc

Previously we found that photosynthesis (ko00195) was the third most enhanced pathway in dmc, and carbohydrate-related metabolisms consisted of the largest highly expressed DEG group [36]. This result seemed to be inconsistent with the phenotype of dmc, so we investigated energy metabolism in this study. Our results here showed both the chlorophyll content and net photosynthetic rate were significantly lower in dmc during tillering (Figure 5). The soluble sugar contents in tiller nodes of dmc were significantly less at the beginning of tiller. When the plants grew up, the photosynthesis capacity was significantly lower, and no sufficient carbohydrate could be supplied, leading to significantly decreased sugar contents in dmc (Figure 7).
The circadian rhythm—plant (ko04712) miRNA was one of the most enriched pathways. CRSP (CO2 Response Secreted Protease) is the target gene of miR9661-5P, which cleaves the pro-peptide EPF2 (Epidermal Patterning Factor 2), in turn, repressing stomatal development [39]. TaCRSP was lowly expressed in dmc. The Gs was low, but Ci was high in dmc compared to WT; the relationship among the three parameters in dmc requires further study.
The miRNAs miR-164, miR9664-3P, novel-393, novel-4827, novel-7652, novel-22869, novel-24656, novel-24657, novel-28763, novel-31210, novel-33200, novel-33201, novel-42734, and novel-44801 regulated carbohydrate metabolic pathway. Among them, the three novel DEMs—novel-22869, novel-393, and novel-4827—and their target DEG, glycerol-3-phosphate transporter 1 (G3P), were most significantly differentially expressed in dmc and WT; they were clearly related to carbohydrate metabolism, and G3P directly connected with the Cavin cycle of photosynthesis (Figure 6).
Glycerol was reported to have important implications via glycerol-3-phosphate in not only lipid and carbohydrate metabolisms but also regulation of cellular energy homeostasis [40]. The circadian clock plays an important role in carbon partitioning and allocation [41]. Sugar sensing and signaling are involved in the control of growth and development during the entire plant life cycle [42]. High sugar accumulation during early seedling development may reflect undesirable growth conditions at a crucial developmental period [43], resulting in a reversible developmental arrest that acts as a protection mechanism. However, low sugar content can also inhibit normal development in plants. Several studies demonstrated that the targets of some miRNAs were involved in the metabolisms of carbon, sucrose, starch, etc. For example, overexpression of microRNA408 enhances photosynthesis, growth, and seed yield in diverse plants [44]. Rice overexpressing osa-miR171b extended vegetative growth and enhanced chlorophyll accumulation in leaves, and their tillers were thicker [25]. The glucose-induced repression of miR156 is dependent on the signaling activity of HEXOKINASE1. The defoliation-induced increase in miR156 levels can be suppressed by exogenous glucose [45]. Two miRNAs—miR394 and miR399—targeted APL2 and three sugar and carbohydrate metabolism-related genes (sugar transporter, invertase, and carbohydrate transmembrane transporter) [46]. Rice miR164b modulates the expression of OsNAC2 and affects its stem development [27]. Sugars are not only energy materials for plant development but are also signaling molecules regulating plant growth and development. In this study, we identified a group miRNAs regulating photosynthetic systems and carbohydrate metabolism during wheat tillering; however, the exquisite regulatory networks of miRNA–mRNA–sugar need to be studied further.

3.4. The miRNAs Regulate Hormone Metabolism and Signaling in dmc

The rice nal2/3 double recessive mutant encodes OsWOX3A, which acts as a positive regulator of ARF1 and ARF4 in leaves and is involved in the formation of tillers. OsWOX3A regulates the transcription of genes involved in auxin synthesis, signaling, and/or polar transport for lateral cell proliferation during vegetative [6]. The contents of IAA and ZA were less, but GA was more in dmc tiller primordia (Figure 8B). Accordingly, we speculated that some important miRNAs’ target genes were involved in plant hormone signal transduction pathway. A total of twelve DEMs were found in IAA and GA metabolism in this study (Figure 8A). 20OX2 was down-regulated by tae-miR164 in dmc, and ARF11 was found targeted by up-regulated miRNAs novel-23239, novel-24049, novel-24662, novel-25328, and novel-1218. ARF proteins have been postulated to have important functions in plant developmental processes through the control of auxin signaling [47]. In A. thaliana, miR160-regulates ARF10 and is involved in cell differentiation and proliferation [48]. OsmiR396d affects gibberellin and brassinosteroid signaling to regulate plant architecture in rice [49]. The miR393-TIR1/AFB2/AFB3 regulatory module was discovered to have multiple functions that manipulate the auxin response [50]. In Arabidopsis, auxin can induce the expression of the GA synthetic gene GA20 [51]. However, cytokinins can inhibit the expressions of GA20OX and GA3OX [52]. Our results demonstrated that the miRNAs regulated hormone metabolism and signaling in dmc by regulating the expression of 20OX2, and ARF11, etc. (Figure 8A; Table S9). In the end, the homeostasis of auxin, zeatin, and gibberellin was changed. The decrease in IAA and ZA content decreased cell proliferation and growth, whilst more gibberellin increased maturation.

3.5. The miRNAs Regulate GRF in dmc

The most differentially expressed miRNAs in the regulation network were novel. They formed 102 pairs of miRNA–mRNA interactions. One third of the novel miRNAs—including novel-1218, novel-23239, novel-24049, novel-24656, novel-24657, novel-24662, novel-25328, novel-33200, novel-33201, and novel-44801—belong to the miR396 family, which regulate GRF1, GRF2, GRF5, GRF 9, GRF10, and GRF12, and formed 60 pairs of miRNA–mRNA interactions. The miR396/GRF regulatory module plays an important role in plant growth, signal transduction, and the stress response [53,54,55,56,57,58]. Recent studies have shown that GRF might be related to the decrease in tillering in low-tillering wheat [59]. Similarly, the miR396/GRF regulatory module played an important role in dmc at tillering stage.

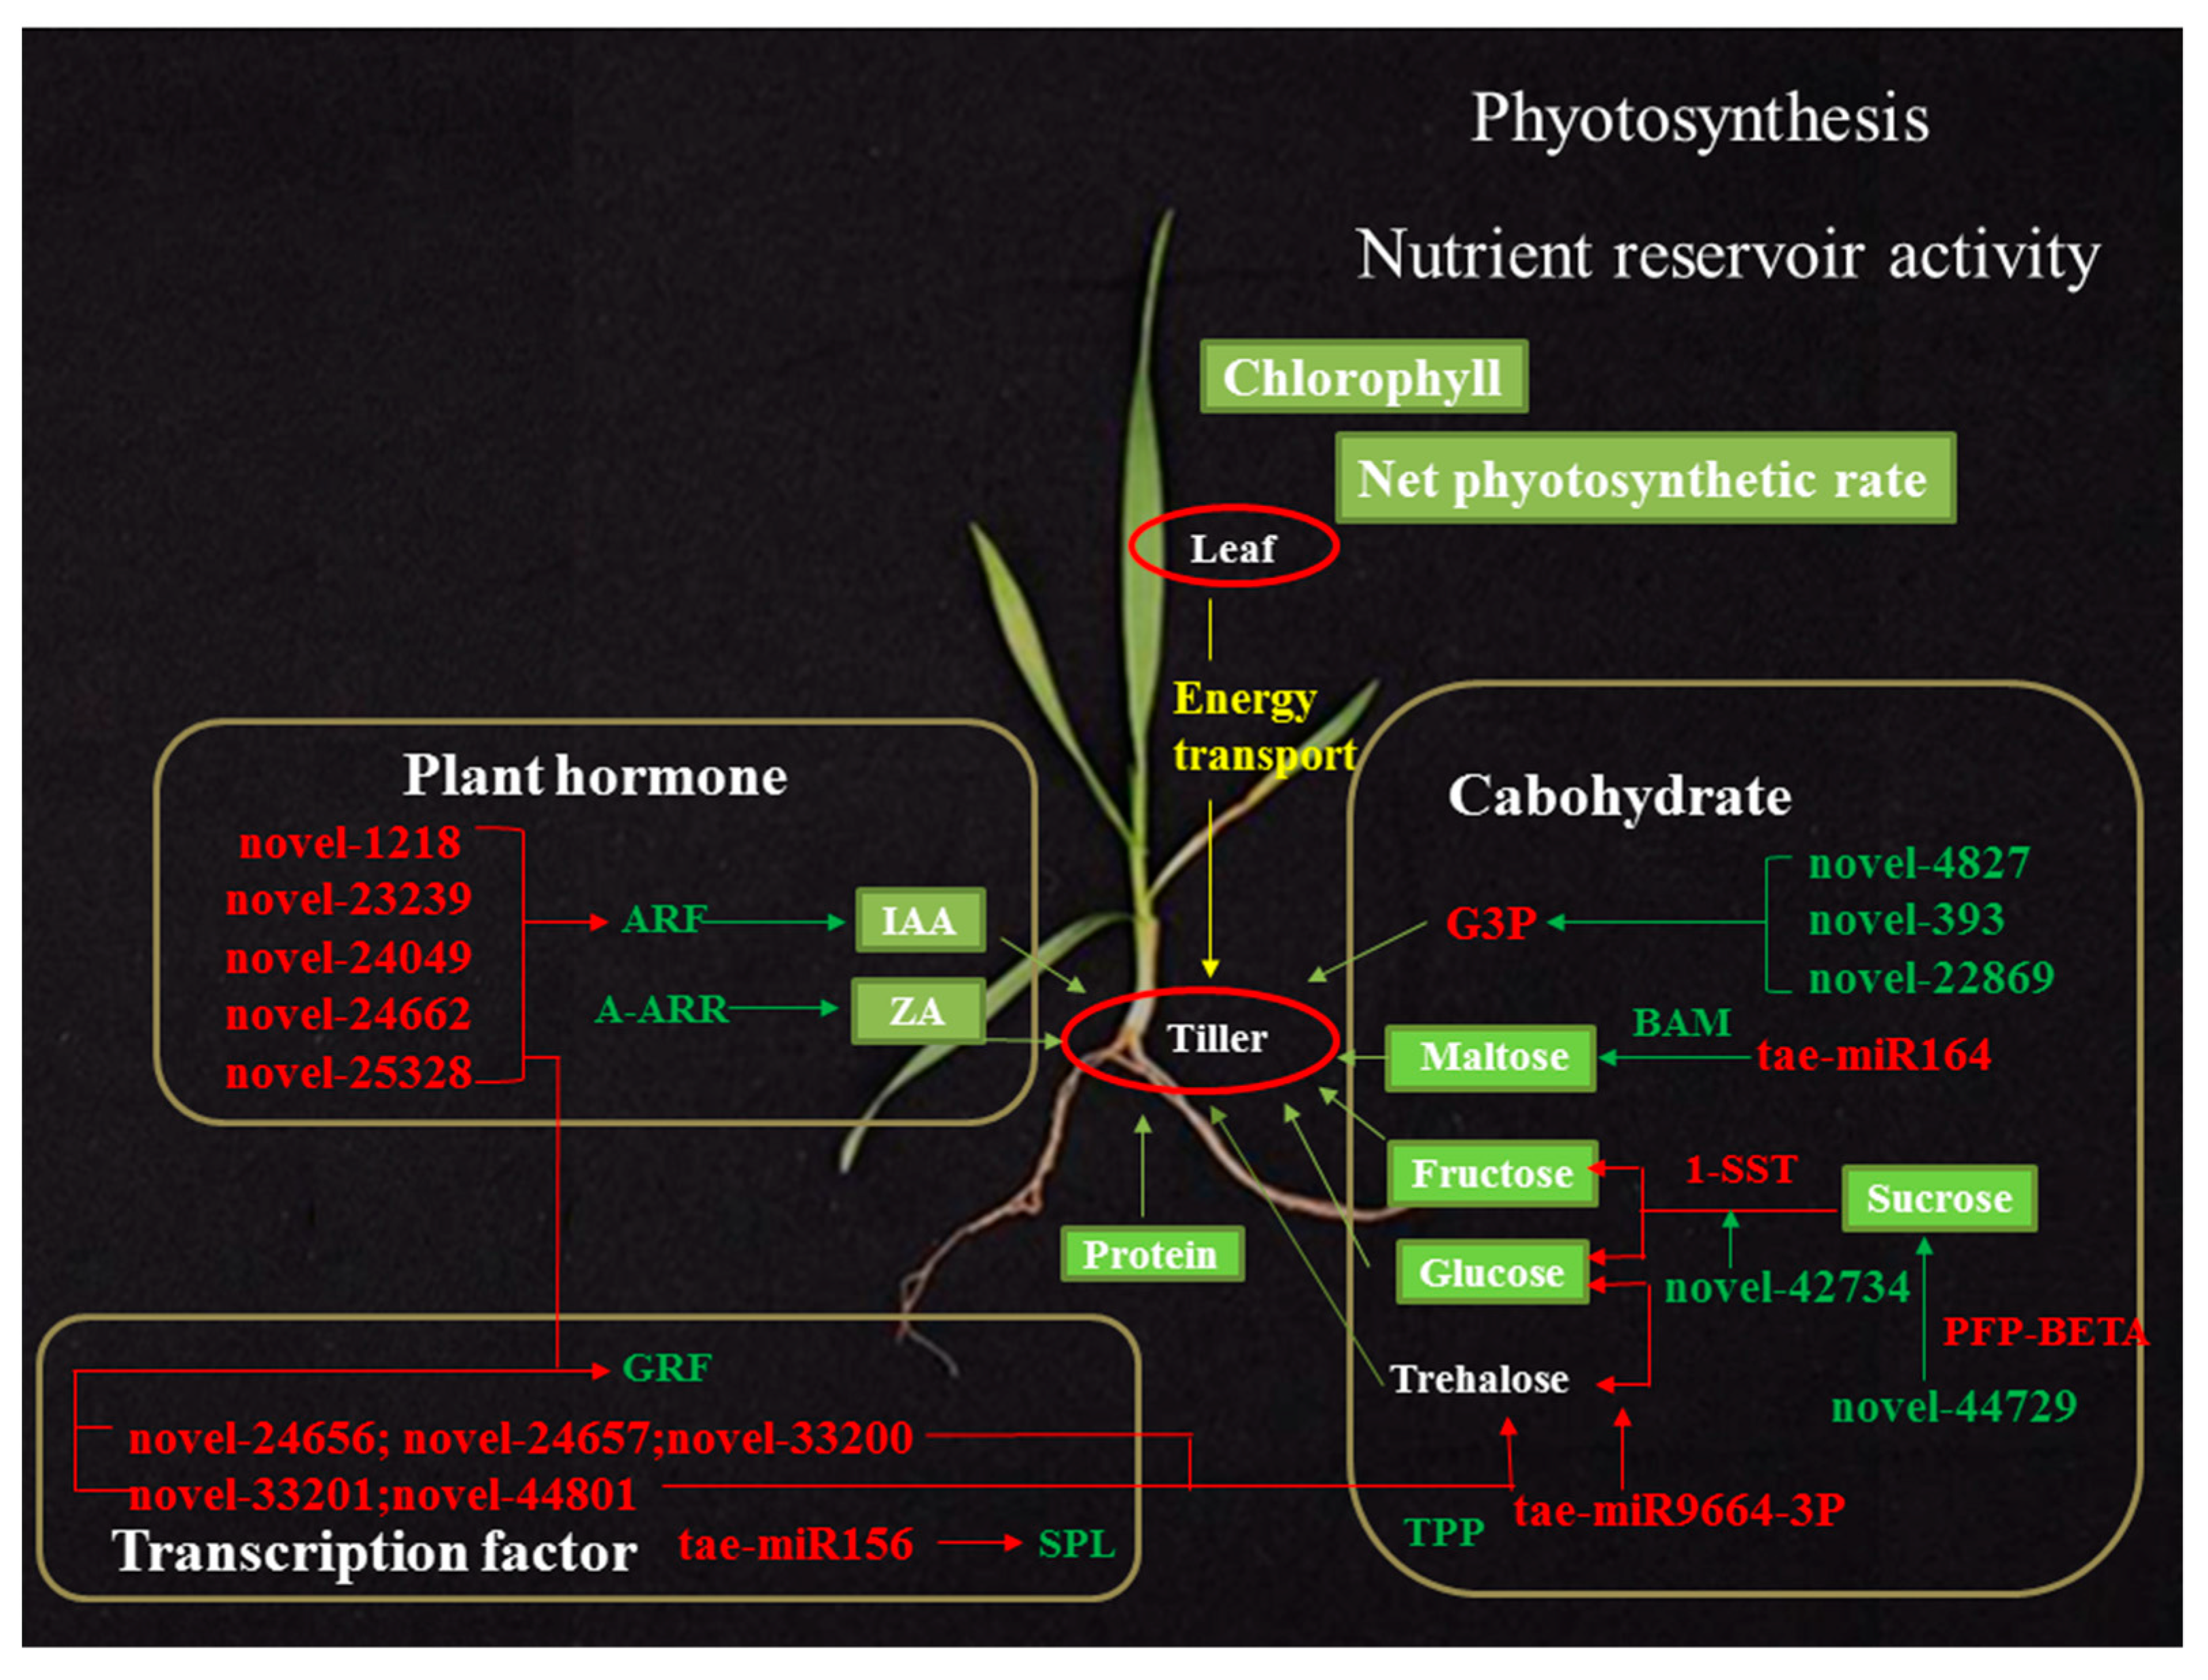
3.6. A miRNA–mRNA Regulatory Network in dmc

In summary, we put forward a molecular regulatory hypothesis in dmc (Figure 12). Carbohydrate is transported from photosynthesizing source leaves to tiller and root. We found a lack of coordination, with increased carbohydrate needs but lower photosynthesis in the early tillering stage. The significant DEMs targeting a number of DEGs played an important role in regulating the carbohydrate metabolic pathway and resulted in a sugar-limited condition in dmc which downregulates biosynthetic activity to conserve energy and protect cells against nutrient stress while upregulating starch and protein degradation to sustain respiration and metabolic activity. Furthermore, the endogenous hormones IAA and ZA were decreased by a number of regulatory DEMs and DEGs. GRF and SPL are down-regulated by a number of miRNAs from the miR396 and miR156 families, respectively. In brief, the most important factors defining the no tillering and dwarfing phenotype of dmc were predicted to be some key miRNAs related to abnormal energy and hormone metabolisms (Figure 12).

4. Materials and Methods

4.1. Plant Materials and Growth Conditions

The wild type ‘Guomai 301′ has medium tillers but a high percentage of earbearing tillers. Mutant dmc with plant architecture variation was obtained from ethylmethame sulfonate (EMS) treated wheat cultivar Guomai 301. Both ‘Guomai 301′ and dmc were planted in the Experimental Farm of Henan Agricultural University, Zhengzhou, Henan Province, China (34°51′N, 113°35′E, 95 m asl) from 2016 [36]. All the experiments were designed as a complete random block. The WT and dmc were sown in plots of 3.0 m in length, and 2.0 m in width, the distance between rows was 0.25 m, and 20 seeds were planted in each row [60].

4.2. Morphological Observation

The tiller samples of the mutant dmc and WT were prepared at five time points from the beginning to the end of tillering as described by He et al. [36]. The samples were observed with an inverted microscope (SRL-7045A, Beijing century science letter Scientific Instruments Co., Ltd., Beijing, China) and a scanner (MRS-9600TFU2L, China). All the images were captured by a camera (Nikon Coolpix 4500). Wheat developmental stages were described according to Zadoks [61].

4.3. RNA Preparation, small RNA Library Construction, and Sequencing

Two tiller bulk samples of dmc (S1, S2, and S3) and WT (S4, S5, and S6) were prepared at the three-leaf stage to four-leaf stage with three biological replicates. Each bulk sample included more than ten independent individuals. The total RNAs were extracted using Trizol reagent (TransGen Biotech, Beijing, China) according to the manufacturer’s protocol [36]. Each of the six miRNA libraries was constructed with 1.5 µg bulked total RNA using Small RNA Sample Pre Kit (NEB, Ipswich, MA, USA) following the manufacturer’s recommendations. T4 RNA ligase 1 and T4 RNA ligase 2 (truncated) were used to ligate adapters to the 3′ and 5ʹ terminals of the small RNAs. Then, the ligated small RNAs were reversely transcribed and amplified. Then the purified PCR products were sequenced on Illumina HiSeq2500 platform in BioMark Company (Beijing, China).

4.4. Analysis of the miRNA Data

The small RNA data were obtained by removing the low-quality reads and adapters from the raw data. The reads were trimmed and cleaned by removing the sequences smaller than 18 nt or longer than 30 nt. At the same time, Q30 of the clean data were also calculated. Then, the ribosomal RNA (rRNA), transfer RNA (tRNA), small nuclear RNA (snRNA), small nucleolar RNA (snoRNA), and other non-coding RNA (ncRNA) were filtered from the clean reads using the Rfam 11.0 (ftp://ftp.sanger.ac.uk/pub/databases/Rfam). The repeat sequences were filtered from the clean reads using the Repbase (http://www.girinst.org/). The remaining reads were used to identify known miRNAs and predict novel miRNAs by comparing with known miRNAs from miRBase 20 (http://www.mirbase.org). The clean reads were mapped to the reference genome (ftp://ftp.ensemblgenomes.org/pub/plants/release-32/fasta/triticum_aestivum/) using Tophat2 tool softs [62].

4.5. Analysis of the DEMs

The miRNA expression levels were normalized according to the expression of transcripts per million (TPM) [63]. The DESeq2 package in the statistics software R [64] was used to analyze DEMs between dmc and WT. DEMs between two samples were selected by setting the parameters of the fold change (|log2FC|) ≥ 1 and false discovery rate (FDR) ≤ 0.05.

4.6. MiRNA Target Gene Prediction, Interaction, and Functional Analysis

The targets of miRNAs were predicted using TargetFinder prediction software (http://www.bioinformatics.org/mirfinder) [65]. The predicted target genes of the DEMs were annotated referring to the databases Nr, Pfam, COG, Swiss-Prot, KO (KEGG Ortholog database), GO. Pathway and GO enrichment analyses were performed for target genes and target DEGs. The interaction networks between DEMs and their target DEGs were constructed using Cytoscape software [66].

4.7. Histochemical Observation

The small tillers of WT and mutant dmc were fixed in FAA solution (5 mL of formalin, 5 mL of acetic acid, and 90 mL of 70% ethyl alcohol). The samples were dehydrated, embedded in paraffin and sectioned with a rotary microtome as described by Geng et al. [67]. The distributions of starch and proteins were observed after the tissues were stained with Periodic Acid-Schiff 185 (PAS) and Naphthol Yellow S (NYS) (G1068, Servicebio). Photos were taken with a camera (Nikon Eclipse E100, Japan) and analyzed with CaseViewer software.

4.8. Determination of Chlorophyll Pigments and Photosynthesis

The chlorophyll mixture was extracted from fresh leaves (0.2 g) with three replicates using 95% alcohol at room temperature until the tissue was completely bleached. The Chl a, b, and ‘a + b’ were quantified spectrophotometrically at 470, 649, and 645 nm. Photosynthetic parameters of leaves were measured in the field from 9:00 to 11:00 a.m. using a Li-6400 portable photosynthesis system (Li-6400; LI-CORInc., Lincoln, NE, USA). The youngest fully expanded main-stem leaf was placed in light intensity of 1000 μmol m−2s−1, and the ambient CO2 concentration was approximately 400 μmol CO2 mol−1 air. All the experiments were repeated for three times.

4.9. Determination of Carbohydrate Contents

The leaves and tiller nodes of mutant dmc and WT at three time points of the three-leaf stage (T1), over-winter stage (T2), and between the rising to jointing stage (T3) were sampled. The sugars were extracted and quantified according to the protocol described by Wang et al. [68]. The sugars of each sample were extracted from 100 mg of freeze-dried meal. 700 μL 70% alcohol was added to each sample, heated in a water bath at 70 °C for 2 h, then the same amount ultrapure water was added, mixed by vortex, and centrifuged at 13,200 g for 10 min. The supernatant was purified with chloroform three times, and the re-collected supernatant was used for quantification of the soluble sugars.
Four kinds of soluble sugars—glucose, sucrose, fructose, and maltose—were quantitatively determined by high-performance anion-exchange chromatography (HPAEC, ICS 5000, Dionex) equipped with a Carbopac™ PA-20 column (3 × 150 mm, Dionex) and a guard PA-20 column (3 × 30 mm, Dionex) with a pulsed amperometric detection (PAD). The mobile phase composed of sodium hydroxide and water (10:90, V/V) at a flow rate of 0.5 mL/min.

4.10. Determination of Hormone Contents

The hormones of each tiller node sample were extracted from 150 mg freeze-dried meal in 1 mL mixed solution (carbinol:0.5% acetic acid = 80:20) at 4 °C overnight, centrifuged at 8000 g for 10 min, and nitrogen was blown at 40 °C until no organic phase remained. The sample was decolored by adding 0.5 mL petroleum ether at 60–90 °C three times, and the supernatant petroleum ether was discarded. The pH value was adjusted to 2.8 by adding 0.1 mol/L citric acid, then extracted with acetic ether three times. The supernatant organic phases were combined and blown dry with a nitrogen blower. The sample was readied for testing by adding 0.5 mL of the mobile phase solution and filtered with a needle filter.
IAA and ZA were determined by a high performance liquid chromatography (HPLC) (Agilent 1100) system with a Kromasil C18 (250 mm × 4.6 mm, 5 μm) reversion phase chromatography column at 35 °C. The mobile phase composed of carbinol and 1% acetic acid solution (4: 6, V/V) at a flow rate of 0.8 mL/min, and the UV absorbance was monitored at 254 nm. GA3 was determined by HPLC (Rigol L3000) system with an Kromasil C18 (250 mm × 4.6 mm, 5 μm) reversion phase chromatography column at 30 °C. The mobile phase composed of carbinol and 1% phosphate solution (35: 65, V/V) at a flow rate of 1 mL/min, and the UV absorbance was monitored at 210 nm.

4.11. Real-time qRT-PCR

Total RNA of the tiller primordia of mutant dmc and Guomai 301 at three-leaf stage to four-leaf stage were extracted using Trizol reagent (TransGen Biotech, Beijing, China). For the expression patterns of DEMs, reverse transcription was carried out using TransScript® miRNA First-Strand cDNA Synthesis SuperMix (TransGen Biotech, Beijing, China). The qPCR was performed using TransStart® Tip Green qPCR SuperMix (TransGen Biotech, Beijing, China). For the target genes, reverse transcription was performed using TransScript® All-in-One First-Strand cDNA Synthesis SuperMix for qPCR (TransGen Biotech, Beijing, China). Real-time qRT-PCR was performed using TransStart® Top Green Qpcr SuperMix (2×) (TransGen Biotech, Beijing, China) according to the manufacturer’s protocol on the CFX ConnectTM Real-Time System (Bio-Rad, Hercules, CA, USA). The data were normalized by comparing to the expression of U6 for miRNAs and to the wheat actin gene for the target genes based on calculations of 2−ΔΔCT. All the primer sequences of miRNAs/target genes were listed in Table S12.

5. Conclusions

We identified a set of miRNAs from dmc and WT and established a miRNA–mRNA regulatory network for tiller development in dmc. There are 91 DEMs between dmc and WT; 40 significant DEMs played important roles during wheat tillering. Many DEMs belong to the miR396 family and regulate the expression of the key developmental regulation genes, ARF11, GRF1, GRF2, GRF5, GRF9, GRF10, and GRF12. There are 26 important DEMs regulating carbohydrate and hormone metabolisms. The miRNAs novel-22869, novel-393, and novel-4827—involved in carbohydrate metabolisms—and novel-23239, novel-24049, novel-24662, novel-25328, novel-1218—involved in hormone metabolisms—are supposed to be essential regulators for tillering in dmc. Many other biological functions are likely being modified by decreased photosynthetic capabilities. The lower photosynthesis, insufficient energy, and abnormal hormone homeostasis are the major factors which restrict tillering in wheat mutant dmc.

Supplementary Materials

Supplementary Materials can be found at https://www.mdpi.com/1422-0067/20/18/4586/s1.

Author Contributions

J.A. performed all the experiments, analyzed the data, and drafted the manuscript. H.N. helped with data analysis and drafted the manuscript. Y.N. treated Guomai 301 with EMS and found the mutant. Y.Z., R.H., J.L., Z.J., J.Z., and H.L. helped with sowing, sample preparation, and figure drawing. Y.J. and Q.L. contributed to the field experiments and maintenance of the wheat accessions. J.N. designed the whole study, drafted the manuscript, and gave the final approval to the version of the manuscript that is being sent for consideration for publication.

Funding

This study was supported by the National Natural Science Foundation of China (NSFC, 31571646), Science and Technology Project in Henan Province (No. 182102110147) and the Special Fund for Key Agricultural Projects in Henan Province, China (No. 161100110400).

Conflicts of Interest

The authors declare that the research was conducted in the absence of any commercial or financial relationships that could be construed as a potential conflict of interest.

References

  1. Doust, A.N. Grass architecture: Genetic and environmental control of branching. Curr. Opin. Plant Biol. 2007, 10, 21–25. [Google Scholar] [CrossRef] [PubMed]
  2. Kebrom, T.H.; Chandler, P.M.; Swain, S.M.; King, R.W.; Richards, R.A.; Spielmeyer, W. Inhibition of tiller bud outgrowth in the tin mutant of wheat is associated with precocious internode development. Plant Physiol. 2012, 160, 308–318. [Google Scholar] [CrossRef] [PubMed]
  3. Hu, Y.S.; Ren, T.H.; Li, Z.; Tang, Y.Z.; Ren, Z.L.; Yan, B.J. Molecular mapping and genetic analysis of a QTL controlling spike formation rate and tiller number in wheat. Gene 2017, 634, 15–21. [Google Scholar] [CrossRef] [PubMed]
  4. Li, X.; Qian, Q.; Fu, Z.; Wang, Y.; Xiong, G.; Zeng, D.; Wang, X.; Liu, X.; Teng, S.; Hiroshi, F.; et al. Control of tillering in rice. Nature 2003, 422, 618–621. [Google Scholar] [CrossRef] [PubMed]
  5. Sun, F.; Zhang, W.; Xiong, G.; Yan, M.; Qian, Q.; Li, J.; Wang, Y. Identification and functional analysis of the MOC1 interacting protein 1. J. Genet. Genom. 2010, 37, 69–77. [Google Scholar] [CrossRef]
  6. Cho, S.H.; Yoo, S.C.; Zhang, H.; Pandeva, D.; Koh, H.J.; Hwang, J.Y.; Kim, G.T.; PaeK, N.C. The rice narrow leaf2 and narrow leaf3 loci encode WUSCHEL-related homeobox 3A (OsWOX3A) and function in leaf, spikelet, tiller and lateral root development. New Phytol. 2013, 198, 1071–1084. [Google Scholar] [CrossRef] [PubMed]
  7. Spielmeyer, W.; Richards, R.A. Comparative mapping of wheat chromosome 1AS which contains the tiller inhibition gene (tin) with rice chromosome 5S. Theor. Appl. Genet. 2004, 109, 1303–1310. [Google Scholar] [CrossRef]
  8. Peng, Z.S.; Yen, C.; Yang, J.L. Genetic control of oligo-culms character in common wheat. Wheat Inf. Serv. 1998, 86, 19–24. [Google Scholar]
  9. Kuraparthy, V.; Sood, S.; Dhaliwal, H.S.; Chhuneja, P.; Gill, B.S. Identification and mapping of a tiller inhibition gene (tin3) in wheat. Theor. Appl. Genet. 2007, 114, 285–294. [Google Scholar] [CrossRef]
  10. Zhang, J.; Wu, J.; Liu, W.; Lu, X.; Yang, X.; Gao, A.; Li, X.; Lu, Y.; Li, L. Genetic mapping of a fertile tiller inhibition gene, ftin, in wheat. Mol. Breed. 2013, 31, 441–449. [Google Scholar] [CrossRef]
  11. Xu, T.; Bian, N.; Wen, M.; Xiao, J.; Yuan, C.; Cao, A.; Zhang, S.; Wang, X.; Wang, H. Characterization of a common wheat (Triticum aestivum L.) high-tillering dwarf mutant. Theor. Appl. Genet. 2017, 130, 483–494. [Google Scholar] [CrossRef] [PubMed]
  12. Voinnet, O. Origin, biogenesis, and activity of plant microRNAs. Cell 2009, 136, 669–687. [Google Scholar] [CrossRef] [PubMed]
  13. Bartel, D.P. MicroRNAs: Genomics, biogenesis, mechanism, and function. Cell 2004, 116, 281–297. [Google Scholar] [CrossRef]
  14. Zhang, X.; Liu, X.; Liu, C.; Wei, J.; Yu, H.; Dong, B. Identification and characterization of microRNAs involved in ascidian larval metamorphosis. BMC Genom. 2018, 19, 168. [Google Scholar] [CrossRef] [PubMed]
  15. Llave, C.; Xie, Z.; Kasschau, K.D.; Carrington, J.C. Cleavage of scarecrow-like mRNA targets directed by a class of arabidopsis miRNA. Science 2002, 297, 2053–2056. [Google Scholar] [CrossRef] [PubMed]
  16. Reinhart, B.J.; Weinstein, E.G.; Rhoades, M.W.; Bartel, B.; Bartel, D.P. MicroRNAs in plants. Genes Dev. 2002, 16, 1616–1626. [Google Scholar] [CrossRef] [PubMed] [Green Version]
  17. Xia, K.; Wang, R.; Ou, X.; Fang, Z.; Tian, C.; Duan, J.; Wang, Y.; Zhang, M. OsTIR1 and OsAFB2 downregulation via OsmiR393 overexpression leads to more tillers, early flowering and less tolerance to salt and drought in rice. PLoS ONE 2012, 7, e30039. [Google Scholar] [CrossRef] [PubMed]
  18. Cheng, H.; Hao, M.; Wang, W.; Mei, D.; Wells, R.; Liu, J.; Wang, H.; Sang, S.; Tang, M.; Zhou, R.; et al. Integrative RNA- and miRNA-profile analysis reveals a likely role of BR and auxin signaling in branch angle regulation of B. napus. Int. J. Mol. Sci. 2017, 18, 887. [Google Scholar] [CrossRef]
  19. Yang, S.; Poretska, O.; Sieberer, T. Altered Meristem Program1 restricts shoot meristem proliferation and regeneration by limiting HD-ZIP III-mediated expression of RAP2.6L. Plant Physiol. 2018, 177, 1580–1594. [Google Scholar] [CrossRef]
  20. Chuck, G.; Cigan, A.M.; Saeteurn, K.; Hake, S. The heterochronic maize mutant Corngrass1 results from overexpression of a tandem microRNA. Nat. Genet. 2007, 39, 544–549. [Google Scholar] [CrossRef]
  21. Xie, K.; Wu, C.; Xiong, L. Genomic organization, differential expression, and interaction of SQUA-MOSA promoter-binding-like transcription factors and microRNA156 in rice. Plant Physiol. 2006, 142, 280–293. [Google Scholar] [CrossRef]
  22. Schwab, R.; Palatnik, J.F.; Riester, M.; Schommer, C.; Schmid, M.; Weigel, D. Specific effects of microRNAs on the plant transcriptome. Dev. Cell 2005, 8, 517–527. [Google Scholar] [CrossRef] [PubMed]
  23. Liu, J.; Cheng, X.; Liu, P.; Sun, J. miR156-targeted SBP-box transcription factors interact with DWARF53 to regulate Teosinte Branched1 and Barren Stalk1 expression in bread wheat. Plant Physiol. 2017, 174, 1931–1948. [Google Scholar] [CrossRef] [PubMed]
  24. Wu, G.; Park, M.Y.; Conway, S.R.; Wang, J.W.; Weigel, D.; Poethig, R.S. The sequential action of miR156 and miR172 regulates developmental timing in Arabidopsis. Cell 2009, 138, 750–759. [Google Scholar] [CrossRef] [PubMed]
  25. Tong, A.; Yuan, Q.; Wang, S.; Peng, J.; Lu, Y.; Zheng, H.; Lin, L.; Chen, H.; Gong, Y.; Chen, J.; et al. Altered accumulation of osa-miR171b contributes to rice stripe virus infection by regulating disease symptoms. J. Exp. Bot. 2017, 68, 4357–4367. [Google Scholar] [CrossRef] [PubMed]
  26. Liu, H.; Jia, S.; Shen, D.; Liu, J.; Li, J.; Li, J.; Zhao, H.; Han, S.; Wang, Y. Four AUXIN RESPONSE FACTOR genes downregulated by microRNA167 are associated with growth and development in Oryza sativa. Funct. Plant Biol. 2012, 39, 736–744. [Google Scholar] [CrossRef]
  27. Jiang, D.; Chen, W.; Dong, J.; Li, J.; Yang, F.; Wu, Z.; Zhou, H.; Wang, W.; Zhuang, C. Overexpression of miR164b-resistant OsNAC2 improves plant architecture and grain yield in rice. J. Exp. Bot. 2017, 69, 1533–1543. [Google Scholar] [CrossRef]
  28. Liu, Y.; Wang, K.; Li, D.; Yan, J.; Zhang, W. Enhanced cold tolerance and tillering in switchgrass (Panicum virgatum L.) by heterologous expression of Osa-miR393a. Plant Cell Physiol. 2017, 58, 2226–2240. [Google Scholar] [CrossRef]
  29. You, C.; Cui, J.; Wang, H.; Qi, X.; Kuo, L.Y.; Ma, H.; Gao, L.; Mo, B.; Chen, X. Conservation and divergence of small RNA pathways and microRNAs in land plants. Genome Biol. 2017, 18, 158. [Google Scholar] [CrossRef]
  30. Yao, Y.; Guo, G.; Ni, Z.; Sunkar, R.; Du, J.; Zhu, J.K.; Sun, Q. Cloning and characterization of microRNAs from wheat (Triticum aestivum L.). Genome Biol. 2007, 8, R96. [Google Scholar] [CrossRef]
  31. Jin, W.; Li, N.; Zhang, B.; Wu, F.; Li, W.; Guo, A.; Deng, Z. Identification and verification of microRNA in wheat (Triticum aestivum). J. Plant Res. 2008, 121, 351–355. [Google Scholar] [CrossRef]
  32. Cantu, D.; Vanzetti, L.S.; Sumner, A.; Dubcovsky, M.; Matvienko, M.; Distelfeld, A.; Michelmore, R.W.; Dubcovsky, J. Small RNAs, DNA methylation and transposable elements in wheat. BMC Genom. 2010, 11, 408. [Google Scholar] [CrossRef] [PubMed]
  33. Sun, F.; Guo, G.; Du, J.; Guo, W.; Peng, H.; Ni, Z.; Sun, Q.; Yao, Y. Whole-genome discovery of miRNAs and their targets in wheat (Triticum aestivum L.). BMC Plant Biol. 2014, 14, 142. [Google Scholar] [CrossRef] [PubMed]
  34. Pandey, R.; Bhardwaj, A.R.; Agarwal, M.; Katiyar-Agarwal, S. Discovery of small RNAs in wheat: A survey. Indian J. Plant. Physiol. 2017, 22, 411–421. [Google Scholar] [CrossRef]
  35. Kumar, D.; Dutta, S.; Singh, D.; Prabhu, K.V.; Kumar, M.; Mukhopadhyay, K. Uncovering leaf rust responsive miRNAs in wheat (Triticum aestivum L.) using high-throughput sequencing and prediction of their targets through degradome analysis. Planta 2016, 245, 161–182. [Google Scholar] [CrossRef]
  36. He, R.; Ni, Y.; Li, J.; Jiao, Z.; Zhu, X.; Jiang, Y.; Li, Q.; Niu, J. Quantitative changes in the transcription of phytohormone-related genes: Some transcription factors are major causes of the wheat mutant dmc not tillering. Int. J. Mol. Sci. 2018, 19, 1324. [Google Scholar] [CrossRef] [PubMed]
  37. Li, Y.; Zeng, X.F.; Zhao, Y.C.; Li, J.R.; Zhao, D.G. Identification of a new rice low-tiller mutant and association analyses based on the SLAF-seq method. Plant Mol. Biol. Rep. 2017, 35, 72–82. [Google Scholar] [CrossRef]
  38. Luo, L.; Li, W.; Miura, K.; Ashikari, M.; Kyozuka, J. Control of tiller growth of rice by OsSPL14 and strigolactones, which work in two independent pathways. Plant Cell Physiol. 2012, 53, 1793–1801. [Google Scholar] [CrossRef]
  39. Engineer, C.B.; Ghassemian, M.; Anderson, J.C.; Peck, S.C.; Hu, H.; Schroeder, J.I. Carbonic anhydrases, EPF2 and a novel protease mediate CO2 control of stomatal development. Nature 2014, 513, 246–250. [Google Scholar] [CrossRef]
  40. Taleux, N.; Guigas, B.; Dubouchaud, H.; Moreno, M.; Weitzel, J.M.; Goglia, F.; Favier, R.; Leverve, X.M. High expression of thyroid hormone receptors and mitochondrial glycerol-3-phosphate dehydrogenase in the liver is linked to enhanced fatty acid oxidation in Lou/C, a rat strain resistant to obesity. J. Biol. Chem. 2009, 284, 4308–4316. [Google Scholar] [CrossRef]
  41. Harmer, S.L.; Hogenesch, J.B.; Straume, M.; Chang, H.S.; Han, B.; Zhu, T.; Wang, X.; Kreps, J.A.; Kay, S.A. Orchestrated transcription of key pathways in Arabidopsis by the circadian clock. Science 2000, 290, 2110–2113. [Google Scholar] [CrossRef]
  42. Rolland, F.; Moore, B.; Sheen, J. Sugar Sensing and Signaling in Plants. Plant Cell 2002, 14 (Suppl. 1), S185–S205. [Google Scholar] [CrossRef] [Green Version]
  43. Lopez-Molina, L.; Mongrand, S.; Chua, N.H. A postgermination developmental arrest checkpoInt. is mediated by abscisic acid and requires the ABI5 transcription factor in Arabidopsis. Proc. Natl. Acad. Sci. USA 2001, 98, 4782–4787. [Google Scholar] [CrossRef]
  44. Pan, J.; Huang, D.; Guo, Z.; Kuang, Z.; Zhang, H.; Xie, X.; Ma, Z.; Gao, S.; Lerdau, M.T.; Chu, C.; et al. Overexpression of microRNA408 enhances photosynthesis, growth, and seed yield in diverse plants. J. Integr. Plant Biol. 2018, 60, 323–340. [Google Scholar] [CrossRef]
  45. Yang, L.; Xu, M.; Koo, Y.; He, J.; Poethig, R.S. Sugar promotes vegetative phase change in Arabidopsis thaliana by repressing the expression of MIR156A and MIR156C. Elife 2013, 2, e00260. [Google Scholar] [CrossRef]
  46. Chen, X.; Xia, J.; Xia, Z.; Zhang, H.; Zeng, C.; Lu, C.; Zhang, W.; Wang, W. Potential functions of microRNAs in starch metabolism and development revealed by miRNA transcriptome profiling of cassava cultivars and their wild progenitor. BMC Plant Biol. 2015, 15, 33. [Google Scholar] [CrossRef]
  47. Sato, Y.; Nishimura, A.; Ito, M.; Ashikari, M.; Hirano, H.Y.; Matsuoka, M. Auxin response factor family in rice. Genes Genet. Syst. 2001, 76, 373–380. [Google Scholar] [CrossRef]
  48. Qiao, M.; Zhao, Z.; Song, Y.; Liu, Z.; Cao, L.; Yu, Y.; Li, S.; Xiang, F. Proper regeneration from in vitro cultured Arabidopsis thaliana requires the microRNA-directed action of an auxin response factor. Plant J. 2012, 71, 14–22. [Google Scholar] [CrossRef]
  49. Tang, Y.; Liu, H.; Guo, S.; Wang, B.; Li, Z.; Chong, K.; Xu, Y. OsmiR396d miRNA affects gibberellin and brassinosteroid signaling to regulate plant architecture in rice. Plant Physiol. 2018, 176, 946–959. [Google Scholar] [CrossRef]
  50. Chen, Z.; Hu, L.; Han, N.; Hu, J.; Yang, Y.; Xiang, T.; Zhang, X.; Wang, L. Overexpression of a miR393-resistant form of Transport. Inhibitor Response Protein 1 (mTIR1) enhances salt tolerance by increased osmo regulation and Na+ exclusion in Arabidopsis thaliana. Plant Cell Physiol. 2015, 56, 73–83. [Google Scholar] [CrossRef]
  51. Frigerio, M.; Alabadí, D.; Pérez-Gómez, J.; García-Cárcel, L.; Phillips, A.L.; Hedden, P.; Blázquez, M.A. Transcriptional regulation of gibberellin metabolism genes by auxin signaling in Arabidopsis. Plant Physiol. 2007, 142, 553–563. [Google Scholar] [CrossRef]
  52. Brenner, W.G.; Romanov, G.A.; Köllmer, I.; Bürkle, L.; Schmülling, T. Immediate-early and delayed cytokinin response genes of Arabidopsis thaliana identified by genome-wide expression profiling reveal novel cytokinin-sensitive processes and suggest cytokinin action through transcriptional cascades. Plant J. 2005, 44, 314–333. [Google Scholar] [CrossRef]
  53. Liu, H.H.; Tian, X.; Li, Y.J.; Wu, C.A.; Zheng, C.C. Microarray-based analysis of stress-regulated microRNAs in Arabidopsis thaliana. RNA 2008, 14, 836–843. [Google Scholar] [CrossRef]
  54. Hewezi, T.; Baum, T.J. Complex feedback regulations govern the expression of miRNA396 and its GRF target genes. Plant Signal. Behav. 2012, 7, 749–751. [Google Scholar] [CrossRef] [Green Version]
  55. Kim, J.S.; Mizoi, J.; Kidokoro, S.; Maruyama, K.; Nakajima, J.; Nakashima, K.; Mitsuda, N.; Takiguchi, Y.; Ohme-Takagi, M.; Kondou, Y.; et al. Arabidopsis growth-regulating factor7 functions as a transcriptional repressor of abscisic acid- and osmotic stress-responsive genes, including DREB2A. Plant Cell 2012, 24, 3393–3405. [Google Scholar] [CrossRef]
  56. Casadevall, R.; Rodriguez, R.E.; Debernardi, J.M.; Palatnik, J.F.; Casati, P. Repression of growth regulating factors by the microRNA396 inhibits cell proliferation by UV-B radiation in Arabidopsis leaves. Plant Cell 2013, 25, 3570–3583. [Google Scholar] [CrossRef]
  57. Casati, P. Analysis of UV-B regulated miRNAs and their targets in maize leaves. Plant Signal. Behav. 2013, 8, e26758. [Google Scholar] [CrossRef] [Green Version]
  58. Liu, J.; Rice, J.H.; Chen, N.; Baum, T.J.; Hewezi, T. Synchronization of developmental processes and defense signaling by growth regulating transcription factors. PLoS ONE 2014, 9, e98477. [Google Scholar] [CrossRef]
  59. Wang, Z.; Shi, H.; Yu, S.; Zhou, W.; Li, J.; Liu, S.; Deng, M.; Ma, J.; Wei, Y.; Zheng, Y.; et al. Comprehensive transcriptomics, proteomics, and metabolomics analyses of the mechanisms regulating tiller production in low-tillering wheat. Theor. Appl. Genet. 2019, 1–13. [Google Scholar] [CrossRef]
  60. Duan, Z.; Shen, C.; Li, Q.; Lü, G.; Ni, Y.; Yu, D.; Niu, J. Identification of a novel male sterile wheat mutant dms conferring dwarf status and multi-pistils. J. Integr. Agric. 2015, 14, 1706–1714. [Google Scholar] [CrossRef]
  61. Zadoks, J.C. A decimal code for the growth stages of cereals. Weed Res. 1974, 14, 415–421. [Google Scholar] [CrossRef]
  62. Kim, D.; Pertea, G.; Trapnell, C.; Pimentel, H.; Kelley, R.; Salzberg, S.L. TopHat2: Accurate alignment of transcriptomes in the presence of insertions, deletions and gene fusions. Genome Biol. 2013, 14, R36. [Google Scholar] [CrossRef]
  63. Fahlgren, N.; Howell, M.D.; Kasschau, K.D.; Chapman, E.J.; Sullivan, C.M.; Cumbie, J.S.; Givan, S.A.; Law, T.F.; Grant, S.R.; Dangl, J.L.; et al. High-throughput sequencing of Arabidopsis microRNAs: Evidence for frequent birth and death of MIRNA genes. PLoS ONE 2007, 2, e219. [Google Scholar] [CrossRef]
  64. Anders, S.; Huber, W. Differential expression analysis for sequence count data. Genome Biol. 2010, 11, R106. [Google Scholar] [CrossRef]
  65. Allen, E.; Xie, Z.; Gustafson, A.M.; Carrington, J.C. MicroRNA-directed phasing during trans-acting siRNA biogenesis in plants. Cell 2005, 121, 207–221. [Google Scholar] [CrossRef]
  66. Smoot, M.E.; Ono, K.; Ruscheinski, J.; Wang, P.L.; Ideker, T. Cytoscape 2.8: New features for data integration and network visualization. Bioinformatics 2011, 27, 431–432. [Google Scholar] [CrossRef]
  67. Geng, D.; Chen, P.; Shen, X.; Zhang, Y.; Li, X.; Jiang, L.; Xie, Y.; Niu, C.; Zhang, J.; Huang, X.; et al. MdMYB88 and MdMYB124 enhance drought tolerance by modulating root vessels and cell walls in apple. Plant Physiol. 2018, 178, 1296–1309. [Google Scholar] [CrossRef]
  68. Wang, L.; Liu, H.M.; Xie, A.J.; Wang, X.D.; Zhu, C.Y.; Qin, G.Y. Chinese quince (Chaenomeles sinensis) seed gum: Structural characterization. Food Hydrocoll. 2018, 75, 237–245. [Google Scholar] [CrossRef]
Figure 1. The tiller micromorphology of dwarf-monoculm wheat mutant (dmc) (AE) and WT (FJ). A, B, C, D, E: dmc at the two-leaf stage, three-leaf stage, four-leaf stage, over-winter stage, and between the rising and jointing stage. F, G, H, I: WT at the two-leaf stage, three-leaf stage, four-leaf stage, and over-winter stage. J: some tillers of WT at between the rising and jointing stage. MC: main culm; TP: tiller primordium; PT: primary tiller; ST: secondary tiller. A-H, scale bar = 1 mm; I and J, scale bar = 1 cm.
Ijms 20 04586 g001
Figure 2. The distribution of starch (purple) and protein (yellow) in wheat tillers of WT and dmc at the three-leaf stage. Tiller histological section micrographs of WT (B,D,F) and mutant dmc (A,C,E). (A) Longitudinal section of the tiller bud of dmc (arrowhead); (B) Longitudinal section of tillers of WT (arrowheads); (C) Transection of the tiller base of dmc; (D) Transection of the tiller base of WT; (E) An enlarged view of C; (F) An enlarged view of D. TP: tiller primordium; TB: tiller bud.
Ijms 20 04586 g002
Figure 3. Expression profiles of the differentially expressed miRNAs (DEMs) between dmc and WT. (A) Stacking bar diagram of the DEMs; (B) Heatmap of the DEMs. S1, S2, S3: mutant dmc; S4, S5, S6: WT. The color scale indicates the values of LgFPKM; FPKM: fragments per kilobase of transcript per million. (C) Volcano plots of the DEMs. The red dots represent the highly expressed DEMs in dmc, green dots represent the lowly expressed DEMs in dmc, and blue dots represent no difference in DEM expression between dmc and WT; FC: fold change; FDR; false discovery rate.
Ijms 20 04586 g003
Figure 4. Functional classification of the target genes of the DEMs, referring to the GO database.
Ijms 20 04586 g004
Figure 5. The chlorophyII contents and photosynthetic parameters of the fully expanded main-stem leaves of dmc and WT during tillering. (A) Leaf chlorophyII content. Chl a, the content of chlorophyII a; Chl b, the content of chlorophyII b; Chl (a + b), the content of chlorophy II a + b. (BE) Leaf photosynthesis parameters. Each bar represents the mean ± SD of three biological replicates. Asterisks indicate a statistically significant difference between dmc and WT at the same stage (*: P ≤ 0.05, **: P ≤ 0.01). T-WT: WT at the three-leaf stage; T-dmc: dmc at the three-leaf stage; O-WT: WT at the over-winter stage; O-dmc: dmc at the over-winter stage; A-WT: WT between the rising to jointing stage; A-dmc: dmc between the rising to jointing stage.
Ijms 20 04586 g005
Figure 6. The key carbohydrate metabolic pathway and the miRNA–mRNA interactions in dmc. Pink: highly expressed in dmc; green: lowly expressed in dmc; blue: no difference in expression between dmc and WT. G3P: glycerol-3-phosphate transporter 1 (At3g47420); SBE: 1,4-alpha-glucan-branching enzyme (SBE1); Beta-amylase (BAM); PEP-BETA: pyrophosphate-fructose 6-phosphate 1-phosphotransferase subunit alpha (PEP-BETA); SPS: sucrose-phosphate synthase 4/5 (SPS4/SPS5); 1-SST: sucrose 1-fructosyltransferase (1-SST); XYLA: xylose isomerase (XYLA); TPP: trehalose-phosphate phosphatase 2 (TPP2); TREH: trehalase (TREH); F6P: fructose-6 -phosphate; G6P: glucose-6-phophate; F1,6P: 1,6-fructose diphosphate; S6P: sucrose-6-posphate; T6P: trehalose-6-phosphate; G1P: glucose-1-phosphate; 1,3P: 1,3-diphosphoglycerate; UDPG: uridine diphosphate glucose.
Ijms 20 04586 g006
Figure 7. The carbohydrate contents in leaves and tiller nodes of dmc and WT. (A) Glucose content; (B) Sucrose content; (C) Fructose content; (D) Maltose content; L-WT: WT leaves; T-WT: WT tiller nodes; L-dmc: dmc leaves; T-dmc: dmc tiller nodes; T1: three-leaf stage; T2: over-winter stage; T3: between the rising to jointing stage (*: P ≤ 0.05, **: P ≤ 0.01).
Ijms 20 04586 g007
Figure 8. The auxin (IAA), zeatin (ZA) and gibberellin (GA) contents and the metabolism pathways. (A)The phytohormone metabolism pathways referenced to ko04075 in the KEGG database. (B) The contents of IAA, ZA, and GA in tiller nodes of dmc and WT. Pink: highly expressed in dmc; green: lowly expressed in dmc; blue: no difference in expression between dmc and WT (**: P ≤ 0.01).
Ijms 20 04586 g008
Figure 9. Heat maps of the differentially expressed miRNAs and mRNA between dmc and WT. (A) Heat map of the DEMs. (B) Heat map of the DEGs. S1, S2, S3: mutant dmc; S4, S5, S6: WT. The color scales indicate the values of LgFPKM.
Ijms 20 04586 g009
Figure 10. Negative regulation networks between the key DEMs and their target DEGs in dmc. The red indicates highly expressed in dmc, the green indicates lowly expressed in dmc, ellipses indicate DEGs, arrowheads indicate DEMs, the lines indicate the regulation relationship.
Ijms 20 04586 g010
Figure 11. The expression profiles of ten DEMs and eight of their target DEGs. (A) The expression profiles of ten DEMs; (B) The expression profiles of eight target DEGs. GRF5 was targeted by novel-23239, novel-33200; SPL11 was targeted by tae-miR156; PRR95 was targeted by tae-miR9778; NPR5 was targeted by tae-miR9664-3P; ARF11 was targeted by novel-23239; Os03g0423300 was targeted by tae-miR397-5P; HAK10 was targeted by tae-miR9672a-3P; At3g47420 was targeted by novel-22869 and novel-393.
Ijms 20 04586 g011
Figure 12. A molecular regulatory hypothesis of the dmc. Red: up-regulated; green: down-regulated compared to WT. Lower photosynthesis from the leaves produces fewer energy substances for transport to tiller nodes (Figure 5). Differentially expressed miRNAs regulated their target genes in the carbohydrate metabolism pathway and resulted in lower sugar content in tiller nodes (Figure 6 and Figure 7). Differentially expressed miRNAs also regulate transcription factor genes such as SPL, GRF, and plant hormone metabolism genes, such as ARF and A-ARR (Figure 8). Transcription factors, in turn, regulate other metabolisms such as carbohydrate and plant hormone metabolism pathways. In the end, the key substances that guarantee normal wheat tillering are in significant deficit, such as plant hormones IAA and ZA, soluble sugars, and proteins. These are the major factors restraining tillering in dmc.
Ijms 20 04586 g012
Table 1. Major metabolic pathways related to wheat tillering (P < 0.05).
Kegg PathwayKo IdP ValueCorrected P Value
Protein processing in endoplasmic reticulumko041416.01 × 10−103.54 × 10⁻⁸
Spliceosomeko030401.20 × 10−57.05 × 10⁻⁴
Circadian rhythm—plantko047123.20 × 10−41.89 × 10⁻²
Degradation of aromatic compoundsko012201.01 × 10−25.97 × 10⁻¹
Plant-pathogen interactionko046261.17 × 10−26.88 × 10⁻¹
Homologous recombinationko034401.61 × 10−29.50 × 10⁻¹
Fructose and mannose metabolismko000511.69 × 10−21.00 × 100
Butanoate metabolismko006502.52 × 10−21.00 × 100
Arginine and proline metabolismko003303.04 × 10−21.00 × 100

