Novel Heat Shock Protein 90 Inhibitors Suppress P-Glycoprotein Activity and Overcome Multidrug Resistance in Cancer Cells

 , , ,
, , , 
Abstract
:
1. Introduction
2. Results and Discussion
2.1. Structure–Activity Relationship Analysis in Relation to Cell Growth Inhibition of Cancer and Normal Cells
2.2. Comparison of Hsp90 Inhibitors’ Cell Growth Inhibition with HSP90 mRNA Expression Profile in Cancer Cells and Hsp90 Affinity Binding
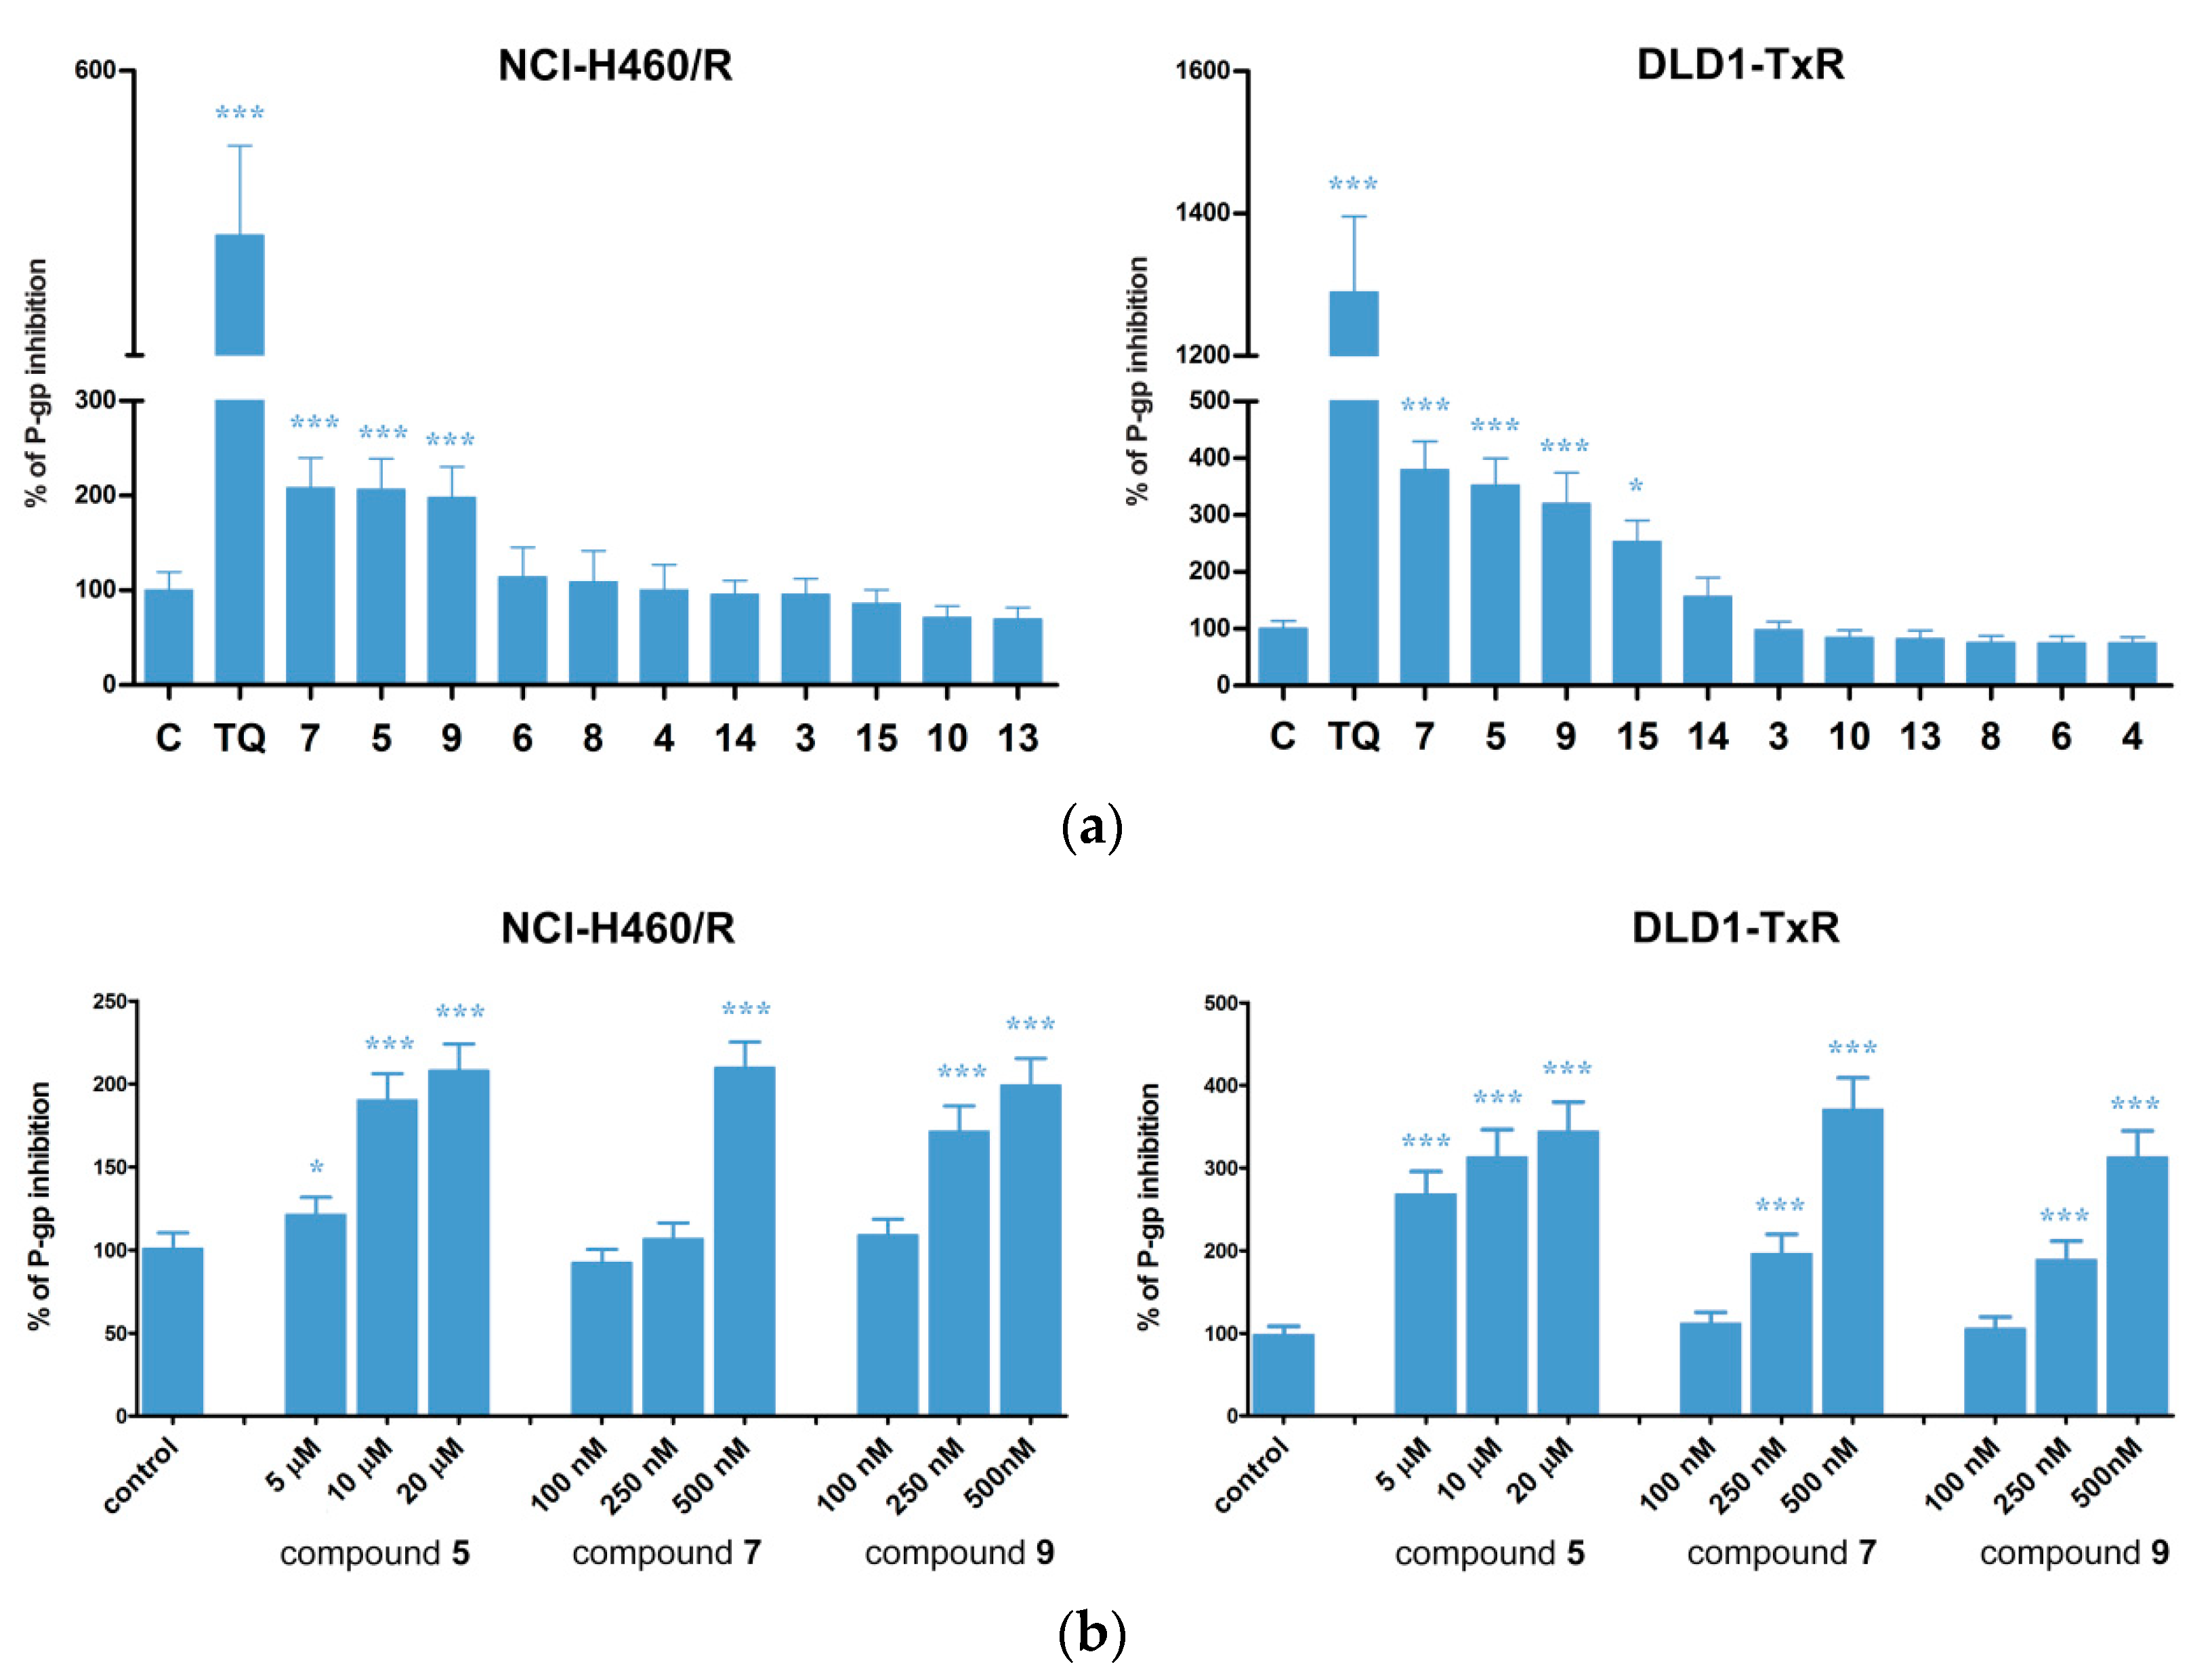
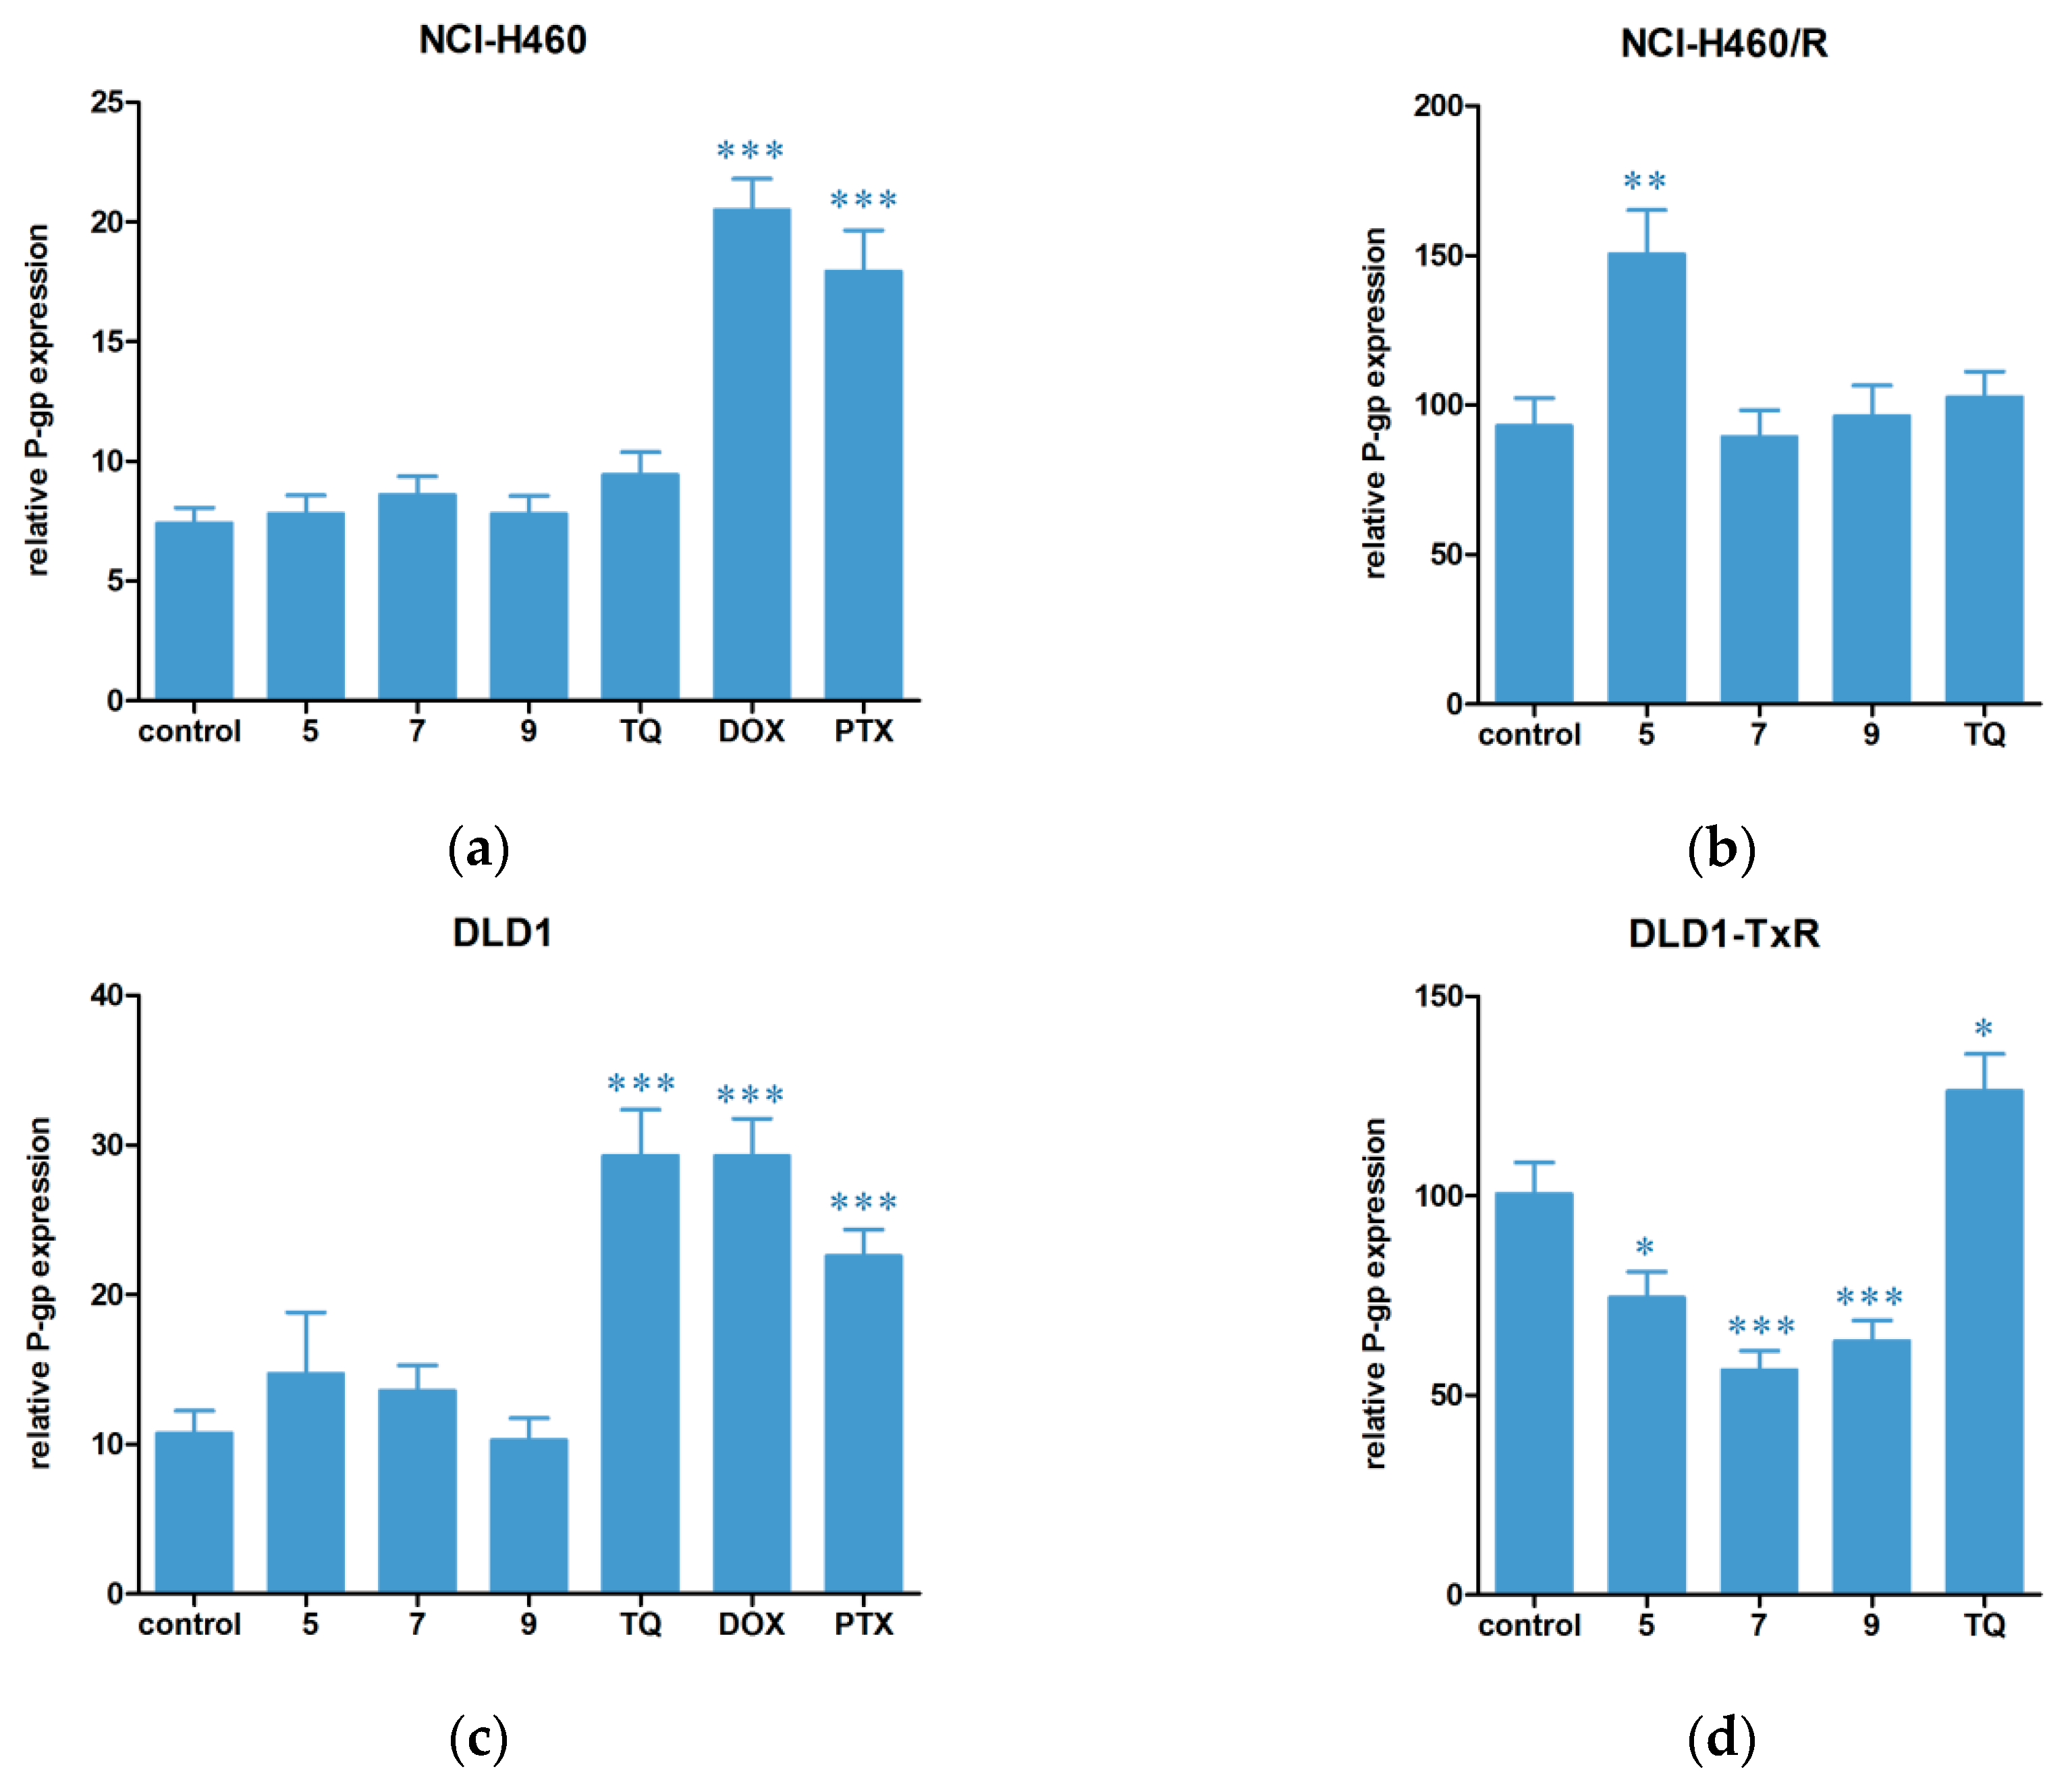
2.3. Hsp90 Inhibitors Influence P-gp Activity and Expression
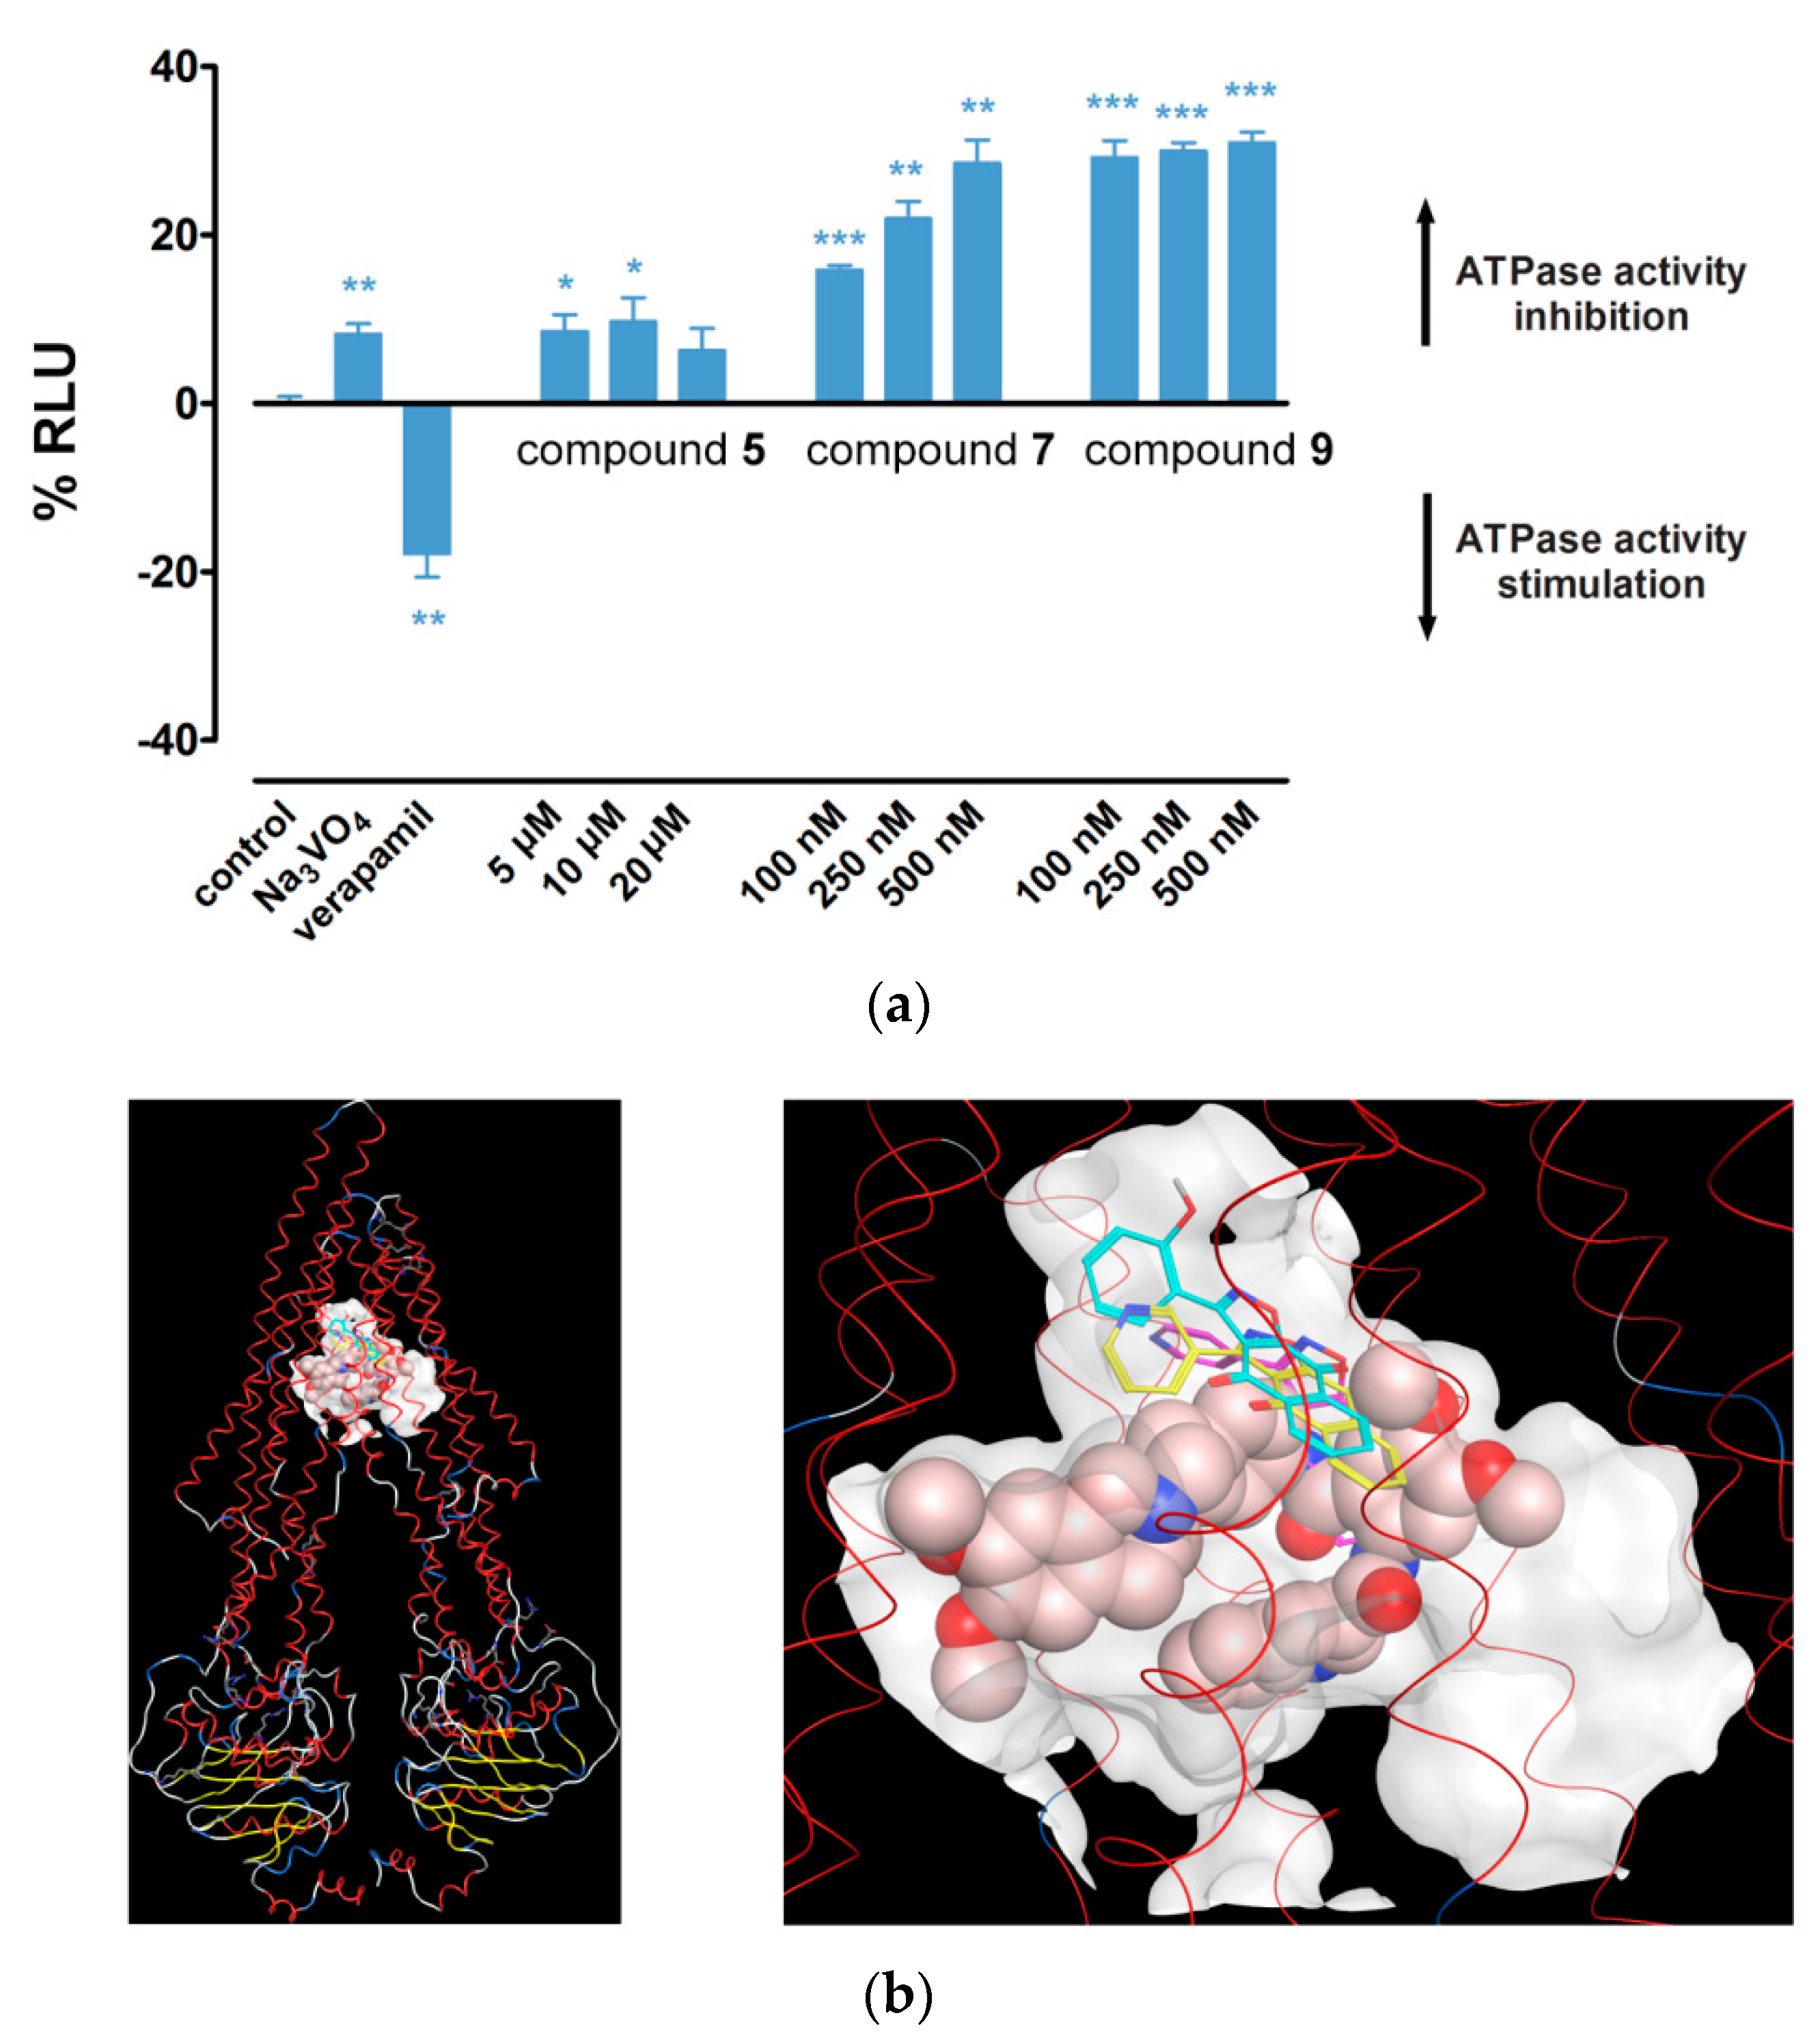
2.4. Hsp90 Inhibitors have Potential to Modulate P-gp Activity via Direct Binding
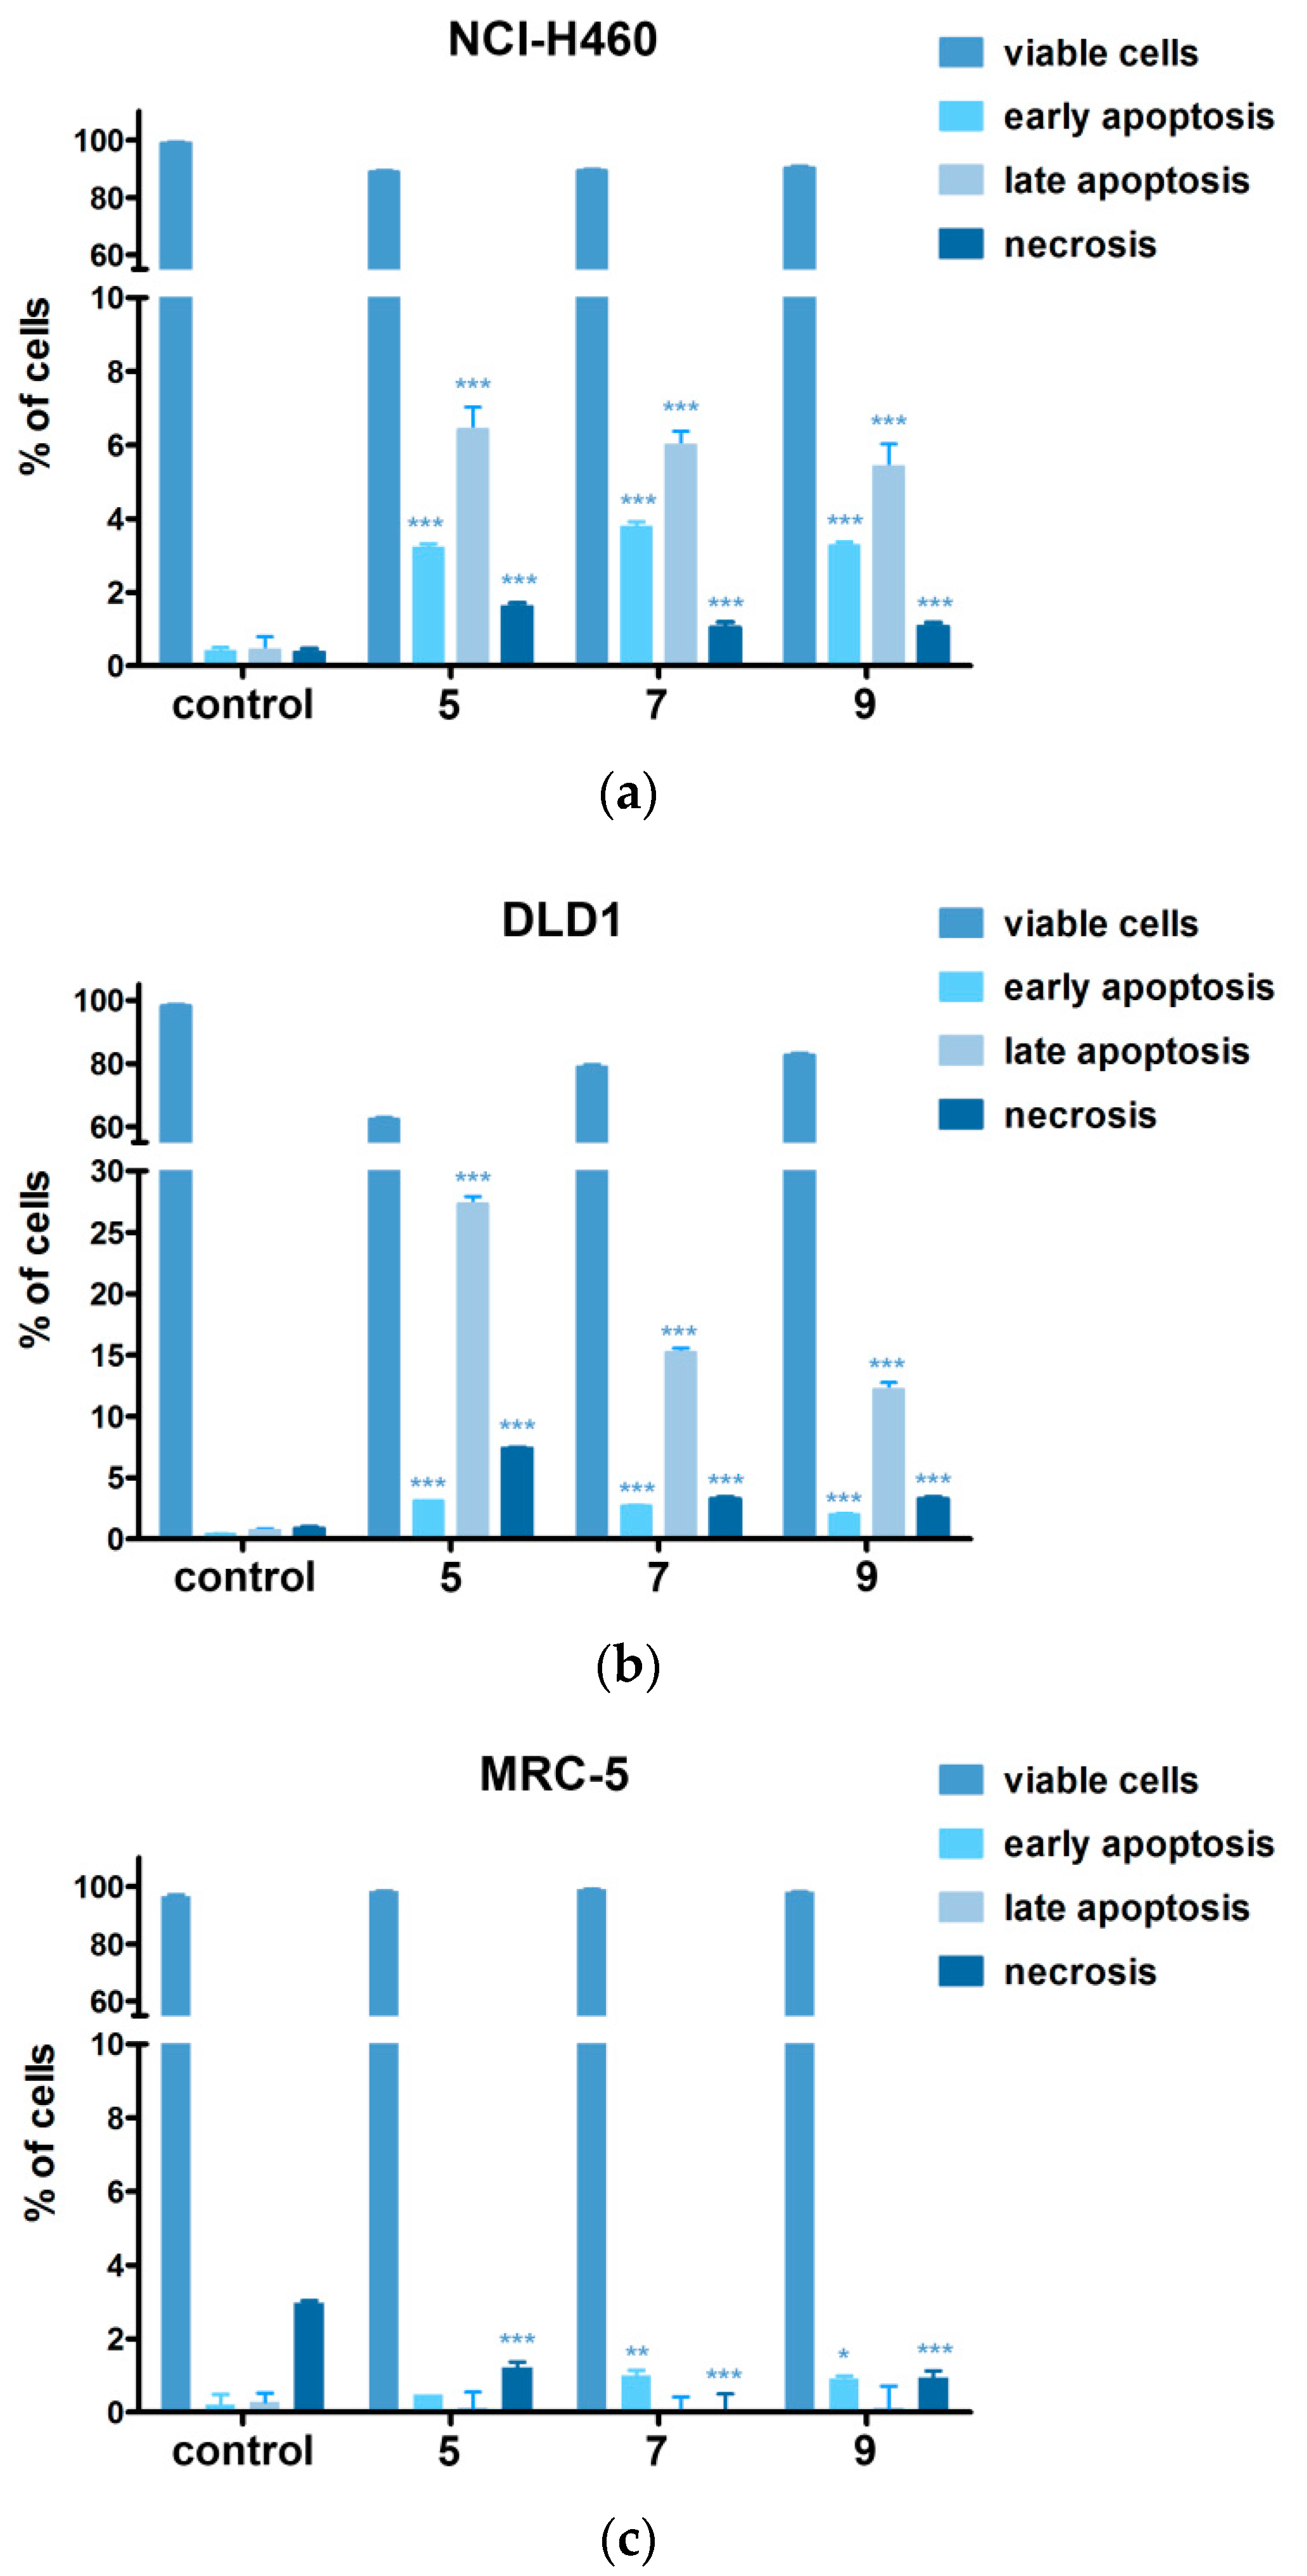
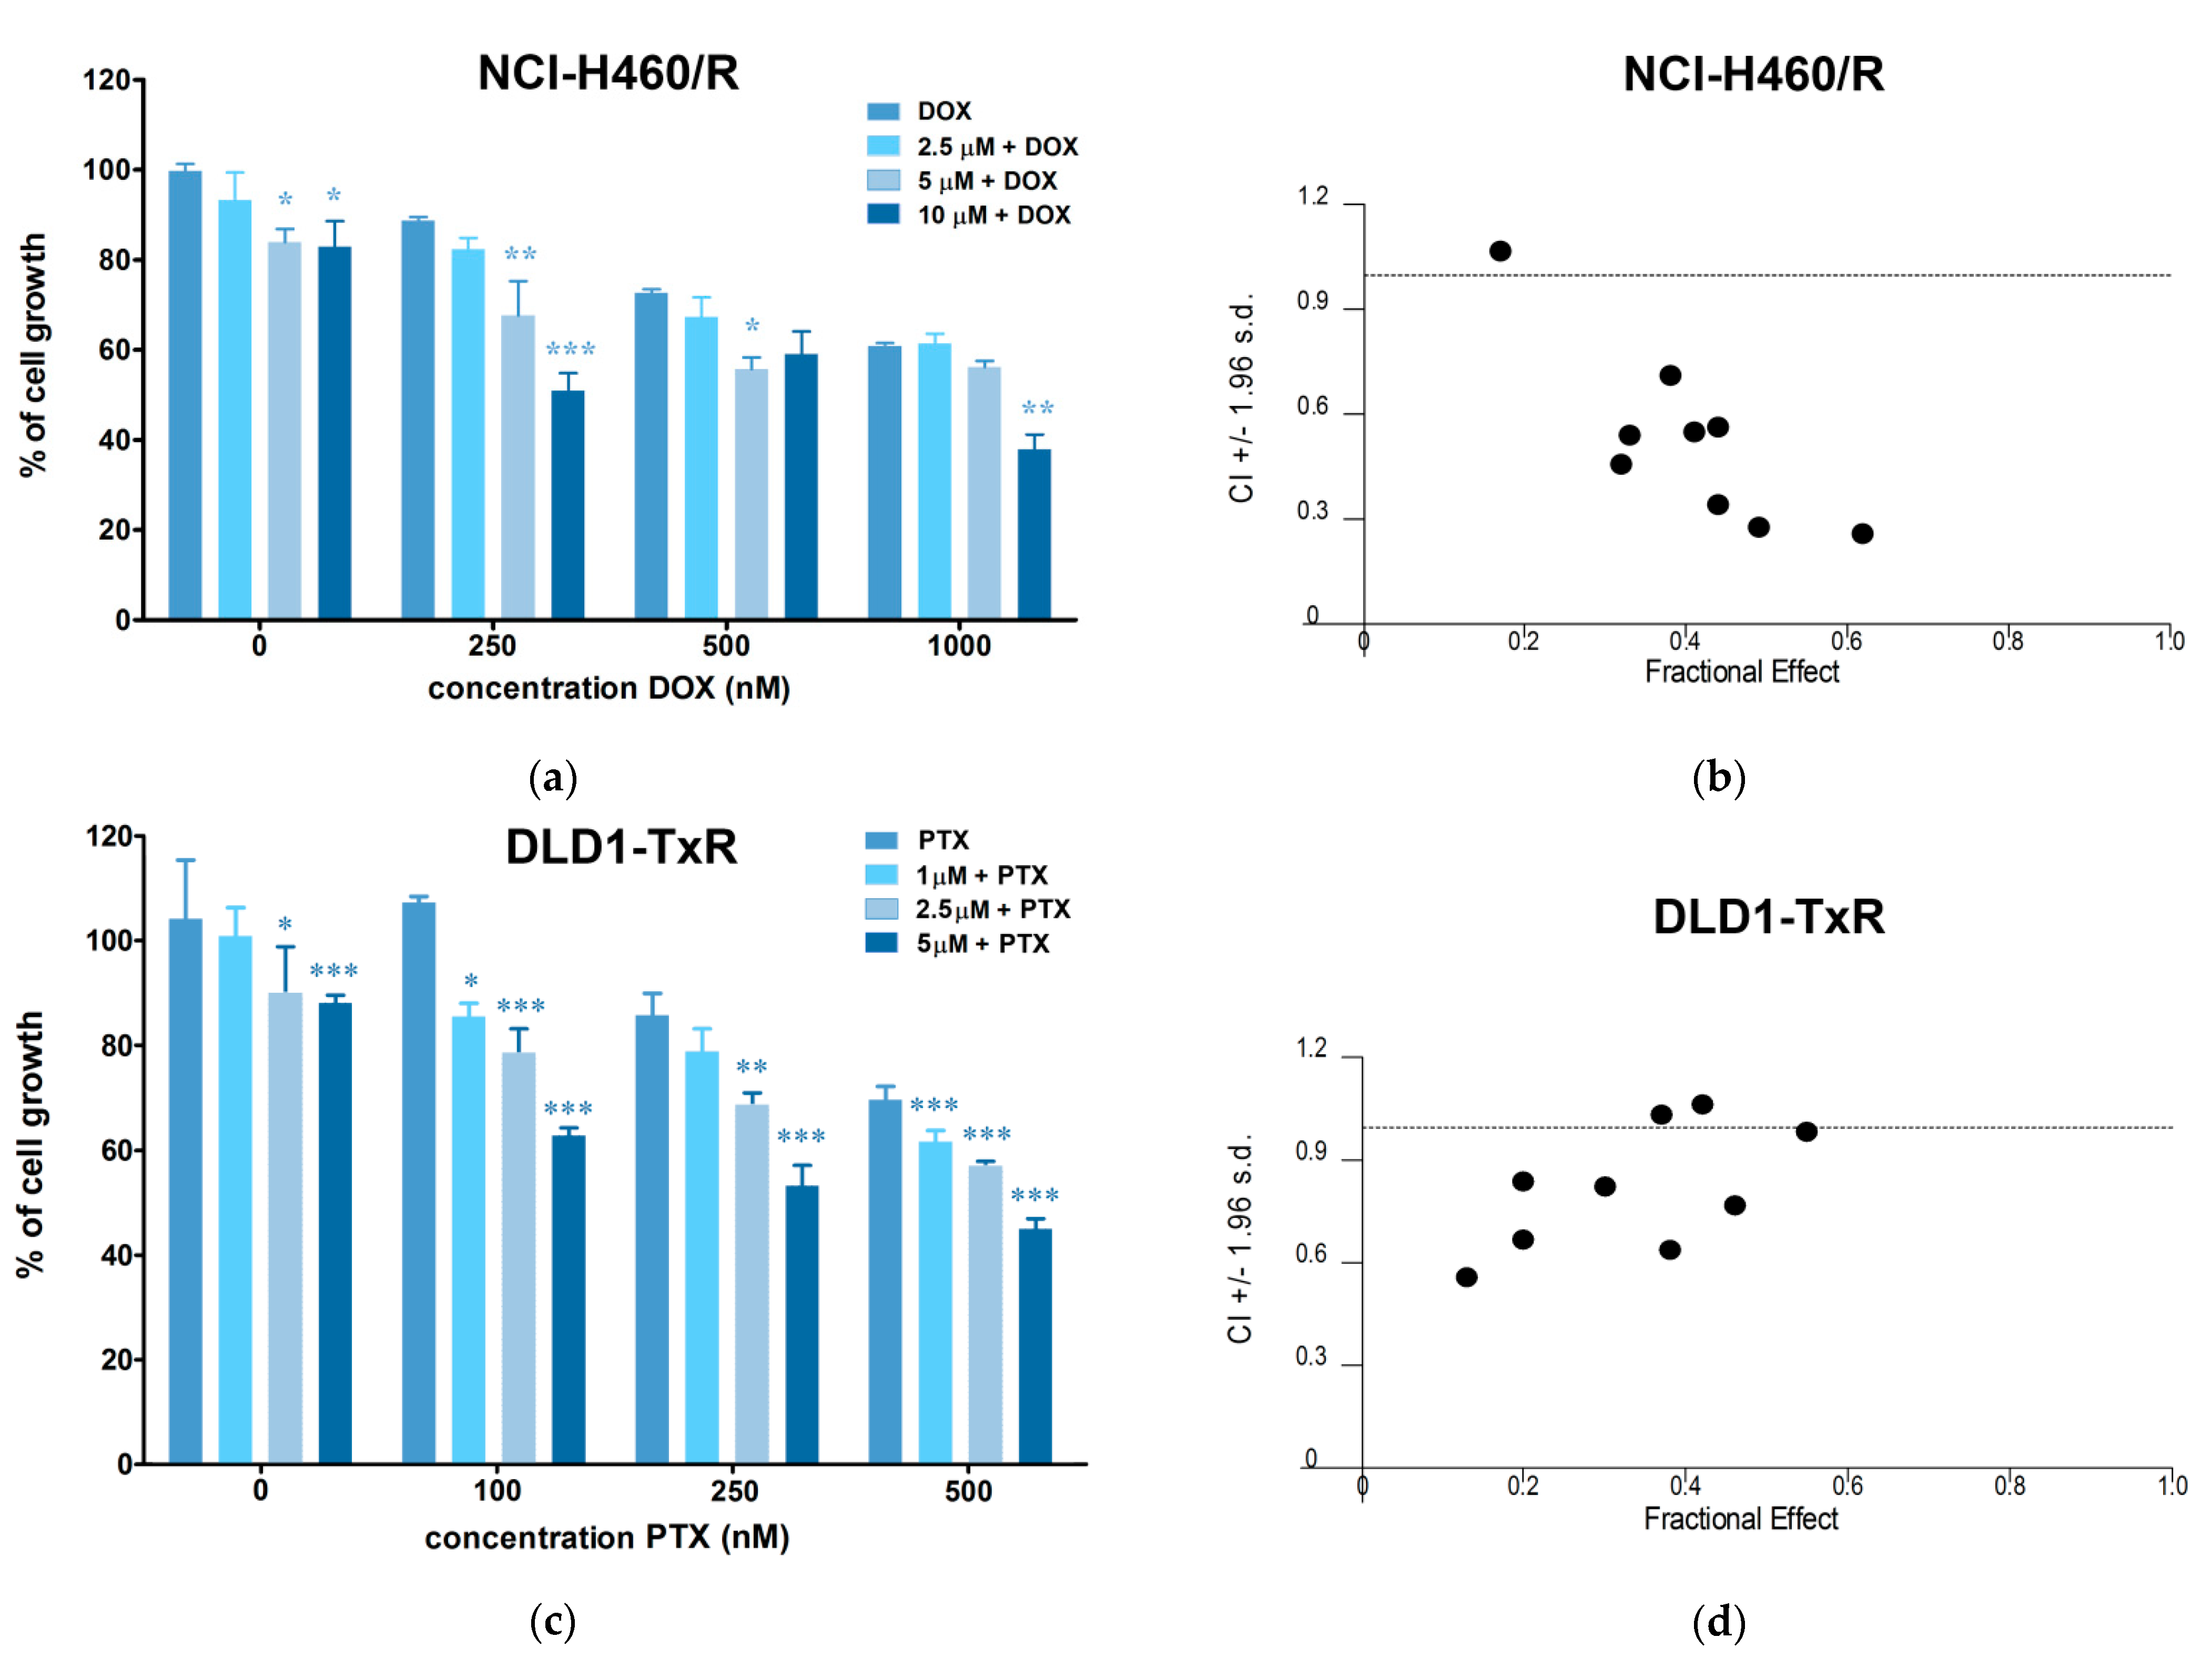
2.5. Hsp90 Inhibitors Sensitizes MDR Cancer Cells to DOX and PTX
3. Materials and Methods
3.1. Drugs
3.2. Reagents
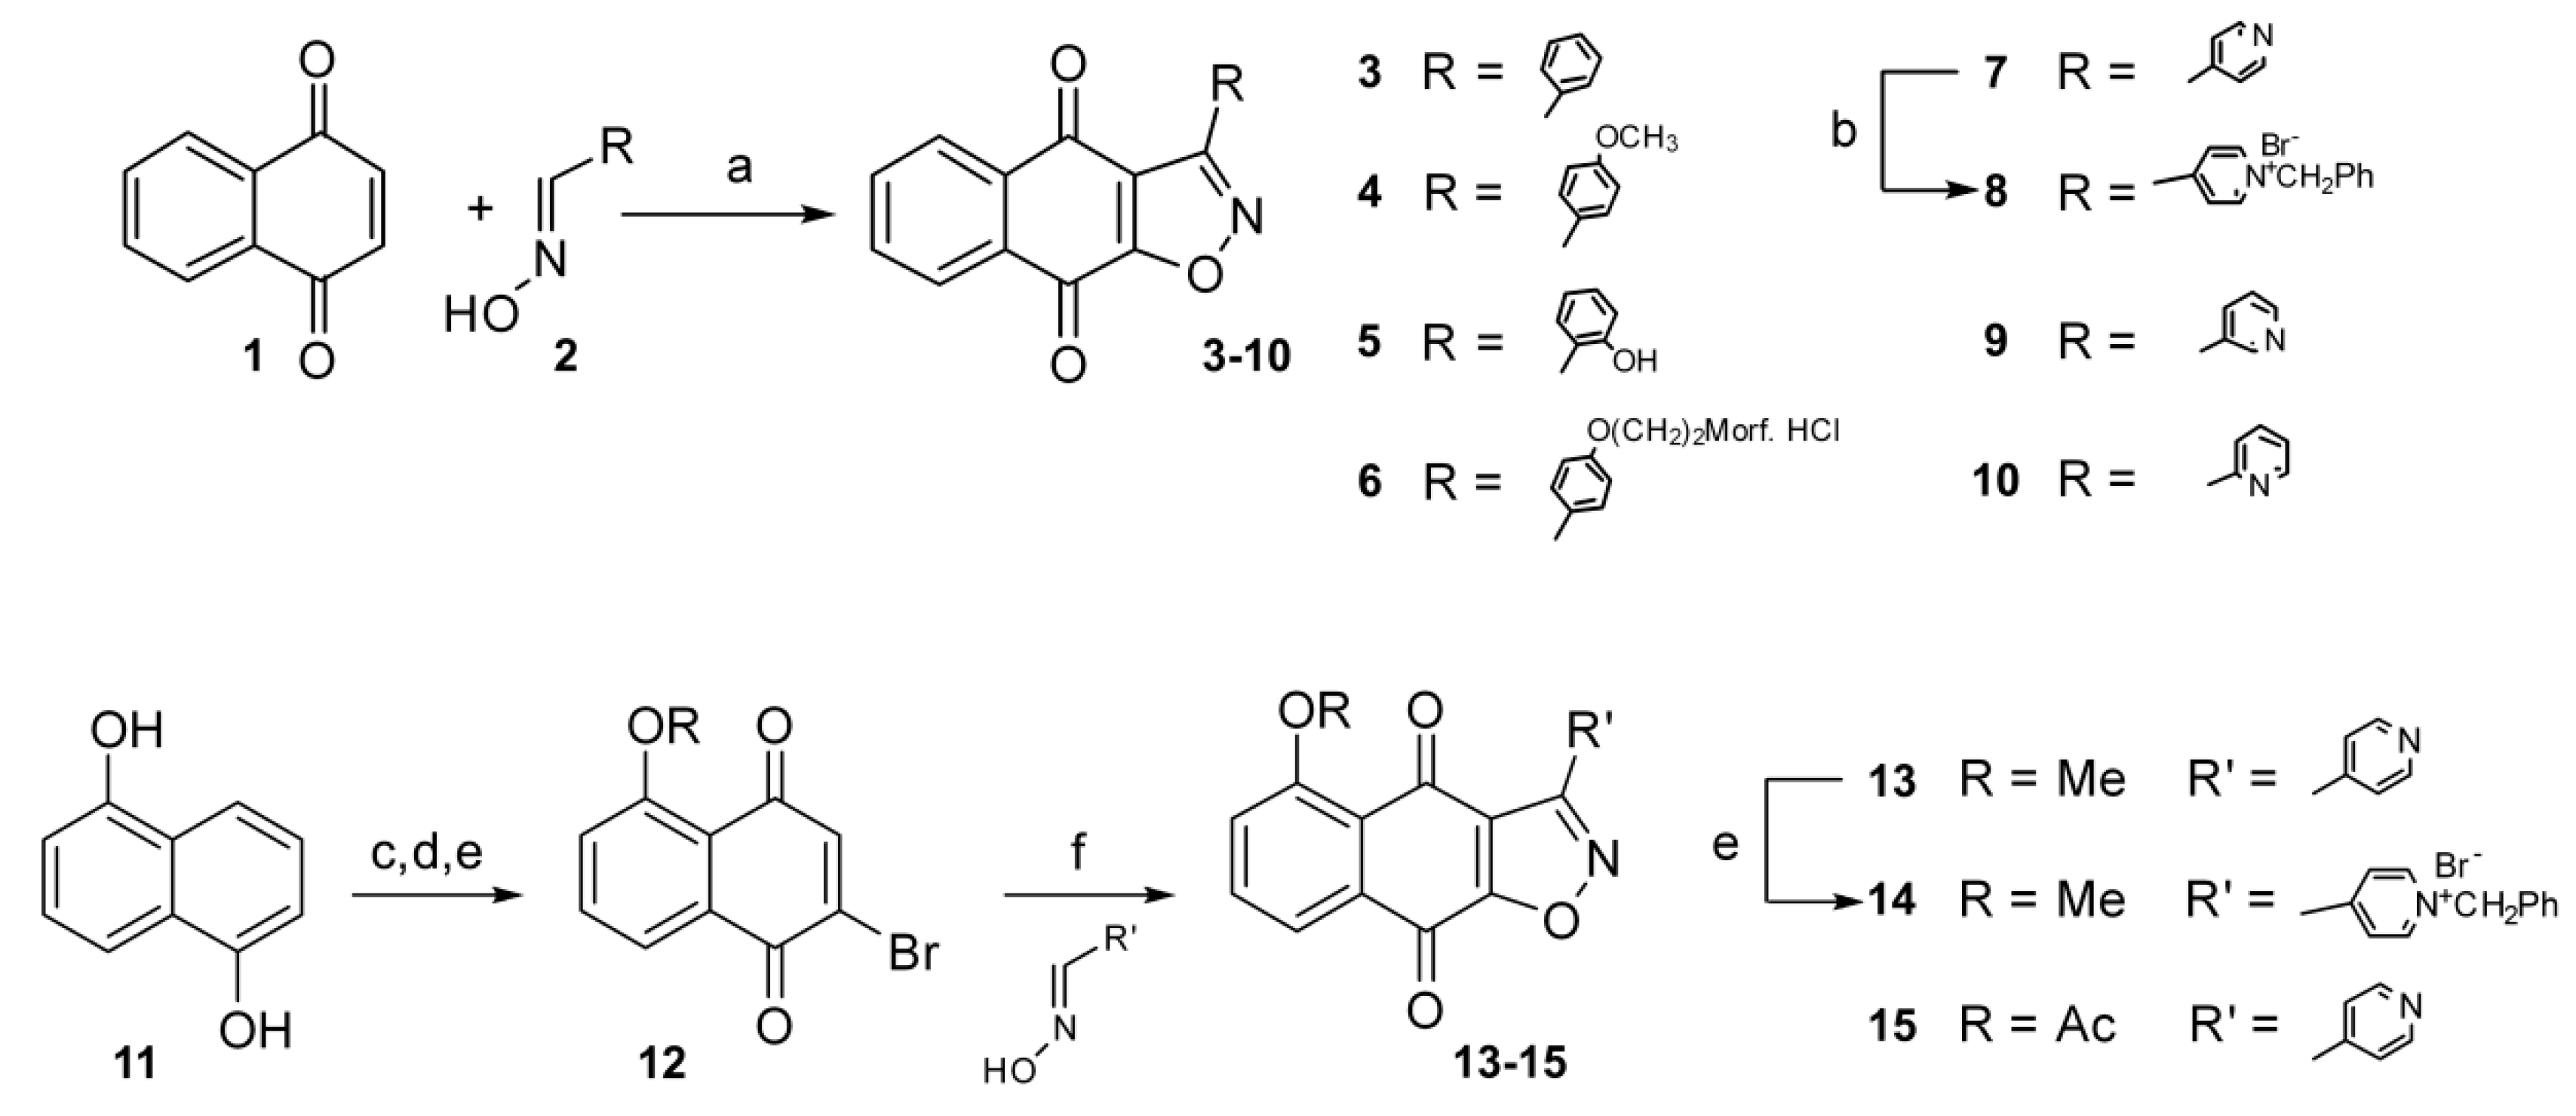
3.3. Chemistry
3.4. Cell Culture
3.5. MTT Assay
3.6. RNA Extraction and Reverse Transcription Reaction
3.7. Quantitative Real-Time PCR
3.8. Flow Cytometric Analysis of P-gp Expression
3.9. Rhodamine 123 Accumulation Assay
3.10. P-gp ATPase Activity Assay
3.11. Cell Death Analysis
3.12. Median Effect Analysis
3.13. In Silico Studies
3.14. Statistical Methods
4. Conclusions
Author Contributions
Funding
Acknowledgments
Conflicts of Interest
Abbreviations
| HSPs | Heat shock proteins |
| ABC | ATP Binding Cassette |
| MDR | multidrug resistance |
| P-gp | P-glycoprotein |
| DOX | doxorubicin |
| PTX | paclitaxel |
| Rho 123 | rhodamine 123 |
| TQ | tariquidar |
| CI | Combination Index |
| DMSO | dimethyl sulfoxide |
| FBS | fetal bovine serum |
| MTT | thiazolyl blue tetrazolium bromide |
References
- World Health Organization. Cancer. Available online: http://www.who.int/en/news-room/fact-sheets/detail/cancer (accessed on 28 May 2019).
- Mazaira, G.I.; Daneri-Becerra, C.; Zgajnar, N.R.; Lotufo, C.M.; Galigniana, M.D. Gene expression regulation by heat-shock proteins: The cardinal roles of HSF1 and Hsp90. Biochem. Soc. Trans. 2018, 46, 51–65. [Google Scholar] [CrossRef] [PubMed]
- Morrow, G.; Hightower, L.E.; Tanguay, R.M. Small heat shock proteins: Big folding machines. Cell Stress Chaperones 2015, 20, 207–212. [Google Scholar] [CrossRef] [PubMed]
- Vidyasagar, A.; Wilson, N.A.; Djamali, A. Heat shock protein 27 (HSP27): Biomarker of disease and therapeutic target. Fibrogenesis Tissue Repair 2012, 5, 7. [Google Scholar] [CrossRef] [PubMed]
- Jego, G.; Hazoume, A.; Seigneuric, R.; Garrido, C. Targeting heat shock proteins in cancer. Cancer Lett. 2013, 332, 275–285. [Google Scholar] [CrossRef] [PubMed]
- Lianos, G.D.; Alexiou, G.A.; Mangano, A.; Mangano, A.; Rausei, S.; Boni, L.; Dionigi, G.; Roukos, D.H. The role of heat shock proteins in cancer. Cancer Lett. 2015, 360, 114–118. [Google Scholar] [CrossRef] [PubMed]
- Shrestha, L.; Bolaender, A.; Patel, H.J.; Taldone, T. Heat Shock Protein (HSP) Drug Discovery and Development: Targeting Heat Shock Proteins in Disease. Curr. Top. Med. Chem. 2016, 16, 2753–2764. [Google Scholar] [CrossRef] [Green Version]
- Garcia-Carbonero, R.; Carnero, A.; Paz-Ares, L. Inhibition of HSP90 molecular chaperones: Moving into the clinic. Lancet. Oncol. 2013, 14, e358–e369. [Google Scholar] [CrossRef]
- Neckers, L.; Workman, P. Hsp90 molecular chaperone inhibitors: Are we there yet? Clin. Cancer Res. Off. J. Am. Assoc. Cancer Res. 2012, 18, 64–76. [Google Scholar] [CrossRef]
- Easwaran, H.; Tsai, H.C.; Baylin, S.B. Cancer epigenetics: Tumor heterogeneity, plasticity of stem-like states, and drug resistance. Mol. Cell 2014, 54, 716–727. [Google Scholar] [CrossRef]
- Groenendijk, F.H.; Bernards, R. Drug resistance to targeted therapies: Deja vu all over again. Mol. Oncol. 2014, 8, 1067–1083. [Google Scholar] [CrossRef]
- Bugde, P.; Biswas, R.; Merien, F.; Lu, J.; Liu, D.X.; Chen, M.; Zhou, S.; Li, Y. The therapeutic potential of targeting ABC transporters to combat multi-drug resistance. Expert Opin. Ther. Targets 2017, 21, 511–530. [Google Scholar] [CrossRef]
- Montanari, F.; Ecker, G.F. Prediction of drug-ABC-transporter interaction--Recent advances and future challenges. Adv. Drug Deliv. Rev. 2015, 86, 17–26. [Google Scholar] [CrossRef] [PubMed]
- Piper, P.W.; Millson, S.H. Mechanisms of Resistance to Hsp90 Inhibitor Drugs: A Complex Mosaic Emerges. Pharmaceuticals 2011, 4, 1400–1422. [Google Scholar] [CrossRef]
- Bargiotti, A.; Musso, L.; Dallavalle, S.; Merlini, L.; Gallo, G.; Ciacci, A.; Giannini, G.; Cabri, W.; Penco, S.; Vesci, L.; et al. Isoxazolo(aza)naphthoquinones: A new class of cytotoxic Hsp90 inhibitors. Eur. J. Med. Chem. 2012, 53, 64–75. [Google Scholar] [CrossRef] [PubMed]
- Pesic, M.; Markovic, J.Z.; Jankovic, D.; Kanazir, S.; Markovic, I.D.; Rakic, L.; Ruzdijic, S. Induced resistance in the human non small cell lung carcinoma (NCI-H460) cell line in vitro by anticancer drugs. J. Chemother. 2006, 18, 66–73. [Google Scholar] [CrossRef] [PubMed]
- Podolski-Renic, A.; Andelkovic, T.; Bankovic, J.; Tanic, N.; Ruzdijic, S.; Pesic, M. The role of paclitaxel in the development and treatment of multidrug resistant cancer cell lines. Biomed. Pharmacother. 2011, 65, 345–353. [Google Scholar] [CrossRef]
- Hadden, M.K.; Hill, S.A.; Davenport, J.; Matts, R.L.; Blagg, B.S. Synthesis and evaluation of Hsp90 inhibitors that contain the 1,4-naphthoquinone scaffold. Bioorganic Med. Chem. 2009, 17, 634–640. [Google Scholar] [CrossRef] [PubMed] [Green Version]
- Rios, D.; Benites, J.; Valderrama, J.A.; Farias, M.; Pedrosa, R.C.; Verrax, J.; Buc Calderon, P. Biological evaluation of 3-acyl-2-arylamino-1,4-naphthoquinones as inhibitors of Hsp90 chaperoning function. Curr. Top. Med. Chem. 2012, 12, 2094–2102. [Google Scholar] [CrossRef]
- Davenport, J.; Balch, M.; Galam, L.; Girgis, A.; Hall, J.; Blagg, B.S.; Matts, R.L. High-throughput screen of natural product libraries for hsp90 inhibitors. Biology 2014, 3, 101–138. [Google Scholar] [CrossRef]
- Hall, M.D.; Handley, M.D.; Gottesman, M.M. Is resistance useless? Multidrug resistance and collateral sensitivity. Trends Pharmacol. Sci. 2009, 30, 546–556. [Google Scholar] [CrossRef] [Green Version]
- Gopalsamy, A.; Shi, M.; Golas, J.; Vogan, E.; Jacob, J.; Johnson, M.; Lee, F.; Nilakantan, R.; Petersen, R.; Svenson, K.; et al. Discovery of benzisoxazoles as potent inhibitors of chaperone heat shock protein 90. J. Med. Chem. 2008, 51, 373–375. [Google Scholar] [CrossRef] [PubMed]
- Brough, P.A.; Aherne, W.; Barril, X.; Borgognoni, J.; Boxall, K.; Cansfield, J.E.; Cheung, K.M.; Collins, I.; Davies, N.G.; Drysdale, M.J.; et al. 4,5-diarylisoxazole Hsp90 chaperone inhibitors: Potential therapeutic agents for the treatment of cancer. J. Med. Chem. 2008, 51, 196–218. [Google Scholar] [CrossRef]
- Baruchello, R.; Simoni, D.; Grisolia, G.; Barbato, G.; Marchetti, P.; Rondanin, R.; Mangiola, S.; Giannini, G.; Brunetti, T.; Alloatti, D.; et al. Novel 3,4-isoxazolediamides as potent inhibitors of chaperone heat shock protein 90. J. Med. Chem. 2011, 54, 8592–8604. [Google Scholar] [CrossRef] [PubMed]
- Callaghan, R.; Luk, F.; Bebawy, M. Inhibition of the multidrug resistance P-glycoprotein: Time for a change of strategy? Drug Metab. Dispos. Biol. Fate Chem. 2014, 42, 623–631. [Google Scholar] [CrossRef] [PubMed]
- Wang, Z.; Chen, Y.; Liang, H.; Bender, A.; Glen, R.C.; Yan, A. P-glycoprotein substrate models using support vector machines based on a comprehensive data set. J. Chem. Inf. Modeling 2011, 51, 1447–1456. [Google Scholar] [CrossRef] [PubMed]
- Chen, L.; Li, Y.; Yu, H.; Zhang, L.; Hou, T. Computational models for predicting substrates or inhibitors of P-glycoprotein. Drug Discov. Today 2012, 17, 343–351. [Google Scholar] [CrossRef] [PubMed]
- McCollum, A.K.; TenEyck, C.J.; Stensgard, B.; Morlan, B.W.; Ballman, K.V.; Jenkins, R.B.; Toft, D.O.; Erlichman, C. P-Glycoprotein-mediated resistance to Hsp90-directed therapy is eclipsed by the heat shock response. Cancer Res. 2008, 68, 7419–7427. [Google Scholar] [CrossRef] [PubMed]
- Benchekroun, M.N.; Schneider, E.; Safa, A.R.; Townsend, A.J.; Sinha, B.K. Mechanisms of resistance to ansamycin antibiotics in human breast cancer cell lines. Mol. Pharmacol. 1994, 46, 677–684. [Google Scholar] [PubMed]
- Kelland, L.R.; Sharp, S.Y.; Rogers, P.M.; Myers, T.G.; Workman, P. DT-Diaphorase expression and tumor cell sensitivity to 17-allylamino, 17-demethoxygeldanamycin, an inhibitor of heat shock protein 90. J. Natl. Cancer Inst. 1999, 91, 1940–1949. [Google Scholar] [CrossRef]
- Taldone, T.; Gozman, A.; Maharaj, R.; Chiosis, G. Targeting Hsp90: Small-molecule inhibitors and their clinical development. Curr. Opin. Pharmacol. 2008, 8, 370–374. [Google Scholar] [CrossRef]
- Zhang, H.; Neely, L.; Lundgren, K.; Yang, Y.C.; Lough, R.; Timple, N.; Burrows, F. BIIB021, a synthetic Hsp90 inhibitor, has broad application against tumors with acquired multidrug resistance. Int. J. Cancer 2010, 126, 1226–1234. [Google Scholar] [CrossRef] [PubMed]
- Sharp, S.Y.; Prodromou, C.; Boxall, K.; Powers, M.V.; Holmes, J.L.; Box, G.; Matthews, T.P.; Cheung, K.M.; Kalusa, A.; James, K.; et al. Inhibition of the heat shock protein 90 molecular chaperone in vitro and in vivo by novel, synthetic, potent resorcinylic pyrazole/isoxazole amide analogues. Mol. Cancer Ther. 2007, 6, 1198–1211. [Google Scholar] [CrossRef] [PubMed]
- Schopf, F.H.; Biebl, M.M.; Buchner, J. The HSP90 chaperone machinery. Nat. Rev. Mol. Cell Biol. 2017, 18, 345. [Google Scholar] [CrossRef] [PubMed]
- Katayama, K.; Yoshioka, S.; Tsukahara, S.; Mitsuhashi, J.; Sugimoto, Y. Inhibition of the mitogen-activated protein kinase pathway results in the down-regulation of P-glycoprotein. Mol. Cancer Ther. 2007, 6, 2092–2102. [Google Scholar] [CrossRef] [PubMed] [Green Version]
- Maitra, R.; Hamilton, J.W. Arsenite regulates Cystic Fibrosis Transmembrane Conductance Regulator and P-glycoprotein: Evidence of pathway independence. Cell. Physiol. Biochem. Int. J. Exp. Cell. Physiol. Biochem. Pharmacol. 2005, 16, 109–118. [Google Scholar] [CrossRef] [PubMed]
- Katayama, K.; Noguchi, K.; Sugimoto, Y. Regulations of P-Glycoprotein/ABCB1/MDR1 in Human Cancer Cells. New J. Sci. 2014, 2014, 476974. [Google Scholar] [CrossRef]
- Moser, C.; Lang, S.A.; Stoeltzing, O. Heat-shock protein 90 (Hsp90) as a molecular target for therapy of gastrointestinal cancer. Anticancer Res. 2009, 29, 2031–2042. [Google Scholar]
- Andreyev, H.J.; Norman, A.R.; Cunningham, D.; Oates, J.R.; Clarke, P.A. Kirsten ras mutations in patients with colorectal cancer: The multicenter “RASCAL” study. J. Natl. Cancer Inst. 1998, 90, 675–684. [Google Scholar] [CrossRef]
- Hoshino, R.; Chatani, Y.; Yamori, T.; Tsuruo, T.; Oka, H.; Yoshida, O.; Shimada, Y.; Ari-i, S.; Wada, H.; Fujimoto, J.; et al. Constitutive activation of the 41-/43-kDa mitogen-activated protein kinase signaling pathway in human tumors. Oncogene 1999, 18, 813–822. [Google Scholar] [CrossRef] [Green Version]
- Sebolt-Leopold, J.S.; Dudley, D.T.; Herrera, R.; Van Becelaere, K.; Wiland, A.; Gowan, R.C.; Tecle, H.; Barrett, S.D.; Bridges, A.; Przybranowski, S.; et al. Blockade of the MAP kinase pathway suppresses growth of colon tumors in vivo. Nat. Med. 1999, 5, 810–816. [Google Scholar] [CrossRef]
- Hostein, I.; Robertson, D.; DiStefano, F.; Workman, P.; Clarke, P.A. Inhibition of signal transduction by the Hsp90 inhibitor 17-allylamino-17-demethoxygeldanamycin results in cytostasis and apoptosis. Cancer Res. 2001, 61, 4003–4009. [Google Scholar] [PubMed]
- Moser, C.; Lang, S.A.; Kainz, S.; Gaumann, A.; Fichtner-Feigl, S.; Koehl, G.E.; Schlitt, H.J.; Geissler, E.K.; Stoeltzing, O. Blocking heat shock protein-90 inhibits the invasive properties and hepatic growth of human colon cancer cells and improves the efficacy of oxaliplatin in p53-deficient colon cancer tumors in vivo. Mol. Cancer Ther. 2007, 6, 2868–2878. [Google Scholar] [CrossRef] [PubMed] [Green Version]
- Berman, H.M.; Westbrook, J.; Feng, Z.; Gilliland, G.; Bhat, T.N.; Weissig, H.; Shindyalov, I.N.; Bourne, P.E. The Protein Data Bank. Nucleic Acids Res. 2000, 28, 235–242. [Google Scholar] [CrossRef] [PubMed] [Green Version]
- Alam, A.; Kowal, J.; Broude, E.; Roninson, I.; Locher, K.P. Structural insight into substrate and inhibitor discrimination by human P-glycoprotein. Science 2019, 363, 753–756. [Google Scholar] [CrossRef] [PubMed] [Green Version]
- Pajeva, I.K.; Hanl, M.; Wiese, M. Protein contacts and ligand binding in the inward-facing model of human P-glycoprotein. ChemMedChem 2013, 8, 748–762. [Google Scholar] [CrossRef] [PubMed]
- Loo, T.W.; Clarke, D.M. Location of the rhodamine-binding site in the human multidrug resistance P-glycoprotein. J. Biol. Chem. 2002, 277, 44332–44338. [Google Scholar] [CrossRef] [PubMed]
- Pajeva, I.K.; Sterz, K.; Christlieb, M.; Steggemann, K.; Marighetti, F.; Wiese, M. Interactions of the multidrug resistance modulators tariquidar and elacridar and their analogues with P-glycoprotein. ChemMedChem 2013, 8, 1701–1713. [Google Scholar] [CrossRef] [PubMed]
- Bosch, S.; Siavoshian, S.; Jacquot, C.; Tomasoni, C.; Dabouis, G.; Elanbaloussi, Y.; Leneel, T.; More, M.T.; Roussakis, C. Correlation between multidrug resistance and the degree of differentiation of non-small-cell bronchopulmonary carcinoma (NSCLC) in vitro and in vivo. Anticancer Res. 1997, 17, 4595–4598. [Google Scholar] [PubMed]
- Ghalhar, M.G.; Akbarzadeh, A.; Rahmati, M.; Mellatyar, H.; Dariushnejad, H.; Zarghami, N.; Barkhordari, A. Comparison of inhibitory effects of 17-AAG nanoparticles and free 17-AAG on HSP90 gene expression in breast cancer. Asian Pac. J. Cancer Prev. 2014, 15, 7113–7118. [Google Scholar] [CrossRef]
- NicAmhlaoibh, R.; Heenan, M.; Cleary, I.; Touhey, S.; O’Loughlin, C.; Daly, C.; Nunez, G.; Scanlon, K.J.; Clynes, M. Altered expression of mRNAs for apoptosis-modulating proteins in a low level multidrug resistant variant of a human lung carcinoma cell line that also expresses mdr1 mRNA. Int. J. Cancer 1999, 82, 368–376. [Google Scholar] [CrossRef]
- Livak, K.J.; Schmittgen, T.D. Analysis of relative gene expression data using real-time quantitative PCR and the 2(-Delta Delta C(T)) Method. Methods 2001, 25, 402–408. [Google Scholar] [CrossRef] [PubMed]
- Ambudkar, S.V.; Dey, S.; Hrycyna, C.A.; Ramachandra, M.; Pastan, I.; Gottesman, M.M. Biochemical, cellular, and pharmacological aspects of the multidrug transporter. Annu. Rev. Pharmacol. Toxicol. 1999, 39, 361–398. [Google Scholar] [CrossRef] [PubMed]
- Chou, T.C.; Talalay, P. Quantitative analysis of dose-effect relationships: The combined effects of multiple drugs or enzyme inhibitors. Adv. Enzym. Regul. 1984, 22, 27–55. [Google Scholar] [CrossRef]


| Compound | NCI-H460 | NCI-H460/R | DLD1 | DLD1-TxR | MRC-5 # | Relative Selectivity RS | Hsp90 Affinity binding (μM) [15] | LogP |
|---|---|---|---|---|---|---|---|---|
| 3 | 0.785 ± 0.032 * | 0.599 ± 0.020 CS | 0.925 ± 0.032 | 0.644 ± 0.020 CS | 0.636 ± 0.023 | NO | 7.850 | 3.24 |
| 4 | 0.935 ± 0.048 | 0.579 ± 0.018 CS | 1.523 ± 0.054 | 1.059 ± 0.025 CS | 1.747 ± 0.083 | 1.71 | 5.840 | 3.08 |
| 5 | 5.722 ± 0.073 | 25.496 ± 0.925 R | 5.683 ± 0.163 | 11.060 ± 0.304 R | 127.677 ± 38.976 | 10.64 | 1.550 | 2.93 |
| 6 | 0.807 ± 0.035 | 0.472 ± 0.018 CS | 0.439 ± 0.006 | 0.439 ± 0.010 E | 4.737 ± 0.473 | 8.79 | 1.200 | 2.88 |
| 7 | 0.199 ± 0.005 | 0.231 ± 0.006 E | 0.156 ± 0.004 | 0.138 ± 0.003 E | 0.599 ± 0.015 | 3.31 | 0.390 | 2.02 |
| 8 | 0.159 ± 0.003 | 0.351 ± 0.005 R | 0.251 ± 0.003 | 3.364 ± 0.049 R | 11.021 ± 0.366 | 10.69 | 0.034 | -0.20 |
| 9 | 0.096 ± 0.002 | 0.172 ± 0.005 R | 0.045 ± 0.001 | 0.050 ± 0.001 E | 0.302 ± 0.008 | 3.33 | 0.540 | 2.02 |
| 10 | 1.269 ± 0.014 | 1.375 ± 0.012 E | 2.645 ± 0.035 | 1.787 ± 0.036 CS | 0.257 ± 0.004 | NO | 1.060 | 2.40 |
| 13 | 1.250 ± 0.028 | 1.060 ± 0.012 E | 1.895 ± 0.036 | 1.004 ± 0.016 CS | 0.174 ± 0.004 | NO | 1.900 | 1.86 |
| 14 | 0.978 ± 0.018 | 23.597 ± 0.470 R | 7.449 ± 0.212 | 10.632 ± 0.270 R | 53.283 ± 1.729 | 5.00 | 0.340 | –0.36 |
| 15 | 0.052 ± 0.002 | 0.039 ± 0.001 E | 0.044 ± 0.001 | 0.193 ± 0.007 R | 0.250 ± 0.014 | 3.05 | 0.084 | 1.63 |
| Cell Lines | NCI-H460 | NCI-H460/R | DLD1 | DLD1-TxR |
|---|---|---|---|---|
| Relative mRNA HSP90 expression | 1.000 ± 0.001 | 0.240 ± 0.034 * | 0.477 ± 0.018 # | 0.356 ± 0.016 # |
| Compound | DOX IC50 (nM) | Relative Reversal |
|---|---|---|
| DOX | 2265.6 ± 42.4 | |
| 5 | ||
| 2.5 µM | 1731.4 ± 30.9 | 1.31 |
| 5 µM | 863.9 ± 25.6 | 2.62 |
| 10 µM | 429 ± 13.3 | 5.28 |
| PTX | 1528.5 ± 48.6 | |
| 5 | ||
| 1 µM | 850.4 ± 13.1 | 1.80 |
| 2.5 µM | 588.3 ± 12.0 | 2.60 |
| 5 µM | 290.0 ± 5.0 | 5.27 |
© 2019 by the authors. Licensee MDPI, Basel, Switzerland. This article is an open access article distributed under the terms and conditions of the Creative Commons Attribution (CC BY) license (http://creativecommons.org/licenses/by/4.0/).
Share and Cite
Dinić, J.; Podolski-Renić, A.; Jovanović, M.; Musso, L.; Tsakovska, I.; Pajeva, I.; Dallavalle, S.; Pešić, M. Novel Heat Shock Protein 90 Inhibitors Suppress P-Glycoprotein Activity and Overcome Multidrug Resistance in Cancer Cells. Int. J. Mol. Sci. 2019, 20, 4575. https://doi.org/10.3390/ijms20184575
Dinić J, Podolski-Renić A, Jovanović M, Musso L, Tsakovska I, Pajeva I, Dallavalle S, Pešić M. Novel Heat Shock Protein 90 Inhibitors Suppress P-Glycoprotein Activity and Overcome Multidrug Resistance in Cancer Cells. International Journal of Molecular Sciences. 2019; 20(18):4575. https://doi.org/10.3390/ijms20184575
Chicago/Turabian StyleDinić, Jelena, Ana Podolski-Renić, Mirna Jovanović, Loana Musso, Ivanka Tsakovska, Ilza Pajeva, Sabrina Dallavalle, and Milica Pešić. 2019. "Novel Heat Shock Protein 90 Inhibitors Suppress P-Glycoprotein Activity and Overcome Multidrug Resistance in Cancer Cells" International Journal of Molecular Sciences 20, no. 18: 4575. https://doi.org/10.3390/ijms20184575