Article

A Model for the Homotypic Interaction between Na+,K+-ATPase β1 Subunits Reveals the Role of Extracellular Residues 221–229 in Its Ig-Like Domain

by
Omar Páez
1,
Marlet Martínez-Archundia
2,
Nicolás Villegas-Sepúlveda
3,
María Luisa Roldan
1,
José Correa-Basurto
2 and
Liora Shoshani
1,*
1
Department of Physiology Biophysics and Neurosciences, Center for Research and Advanced Studies, CINVESTAV-IPN, Mexico City 07360, Mexico
2
Laboratorio de Diseño y Desarrollo de Nuevos Fármacos e Innovación Biotécnológica, Sección de Estudios de Posgrado e Investigación, Escuela Superior de Medicina, Instituto Politécnico Nacional, Mexico City 11340, Mexico
3
Department of Molecular Biomedicine, Center for Research and Advanced Studies, CINVESTAV-IPN, Mexico City 07360, Mexico
*
Author to whom correspondence should be addressed.
Int. J. Mol. Sci. 2019, 20(18), 4538; https://doi.org/10.3390/ijms20184538
Submission received: 9 July 2019 / Revised: 13 August 2019 / Accepted: 16 August 2019 / Published: 13 September 2019
(This article belongs to the Section Molecular Informatics)

Abstract

:
The Na+, K+-ATPase transports Na+ and K+ across the membrane of all animal cells. In addition to its ion transporting function, the Na+, K+-ATPase acts as a homotypic epithelial cell adhesion molecule via its β1 subunit. The extracellular region of the Na+, K+-ATPase β1 subunit includes a single globular immunoglobulin-like domain. We performed Molecular Dynamics simulations of the ectodomain of the β1 subunit and a refined protein-protein docking prediction. Our results show that the β1 subunit Ig-like domain maintains an independent structure and dimerizes in an antiparallel fashion. Analysis of the putative interface identified segment Lys221-Tyr229. We generated triple mutations on YFP-β1 subunit fusion proteins to assess the contribution of these residues. CHO fibroblasts transfected with mutant β1 subunits showed a significantly decreased cell-cell adhesion. Association of β1 subunits in vitro was also reduced, as determined by pull-down assays. Altogether, we conclude that two Na+, K+-ATPase molecules recognize each other by a large interface spanning residues 221–229 and 198–207 on their β1 subunits.

Graphical Abstract

1. Introduction

The Na+, K+-ATPase or sodium pump (Na+-K+) is a multimeric protein responsible for the electrochemical gradient of all animal cells. It is composed of α, β and γ subunits. The α-subunits transport the cations and couple them to the hydrolysis of ATP and it is thus considered to be the catalytic subunit of the enzyme [1,2]. Four isoforms of the catalytic subunit are known, α1–α4 [3]. The β subunit is a glycosylated type II membrane protein. It is necessary for the proper folding, traffic, and insertion of the Na+, K+-ATPase into the plasma membrane. Also, the β subunit has an influence on the kinetics of K+ transport of the α subunit. Three isoforms of β (β1–β3) of NaK are known [4].
Cell Adhesion Molecules (CAMs) are transmembrane proteins responsible for cell-matrix or cell-cell recognition. Intercellular adhesion via CAMs is a characteristic of epithelial cells [5,6]. The β1 subunit of the Na+, K+-ATPase (NaK β1) is a CAM that interacts with another NaK β1 on the lateral membrane of epithelial cells. The direct interaction in trans of the β1 isoform (NaK β11) in epithelia has been confirmed by co-immunoprecipitation and FRET studies [7,8,9]. This interaction contributes to the polarized expression of the Na+, K+-ATPase and in turn, to the transporting phenotype of epithelia [10]. The neuronal isoform of the NaK β subunit, β2, also acts as an adhesion molecule on glia (AMOG) [11]. However, the interacting partner of β2 in trans has not been identified but it is probably not a homotypic CAM [12].
The β1 subunit of the Na+, K+-ATPase has a direct role in the formation and stabilization of intercellular junctions in epithelia. It co-localizes with adherens junction proteins since the formation of cellular contacts [13]. In confluent MDCK cells, NaK β11 interaction increases the stability of adherens junction proteins [8]. The expression of NaK β1 subunit is drastically reduced in carcinoma cells. Furthermore, the transfection of NaK β1 plus E-cadherin re-establishes the epithelial phenotype of transformed MDCK–MSV cells [14,15,16]. The β1 subunit might regulate the γ subunit of NaK (FXYD) and mediate the progression of cancer [17]. The β1 subunit is also needed for the correct localization of the Na+, K+-ATPase and tight junction proteins during blastocyst formation [18]. Even in invertebrates, the β subunit homologue of NaK is essential for the integrity of cellular junctions [19].
The extracellular domain of NaK β1 has several N-glycosilation sites [20] and a β-sandwich secondary structure. These are features of CAMs at cell-cell junctions such as cadherins or the immunoglobulin superfamily. Another characteristic of these CAMs is the presence of repeated extracellular domains [21,22,23]. These repeated domains play a key role in the regulation of adhesion in trans [24]. In contrast, the extracellular domain of both NaK β1 and β2 subunits consists of a single globular domain. Several studies have investigated how NaK β11 interaction occurs at the molecular level. It is known that recognition takes place between amino acid residues and that N-glycans play an important role in its stabilization [8,13]. One study found that segment 198–207 is crucial for the recognition. This was demonstrated through residue substitution by point mutations [25]. Another study identified hotspot residues within the 198–207 region, especially Y199 [26].
Nevertheless, a nine-residue segment might not be sufficient for explaining NaK β11 interaction. Homophilic dimers of classical CAMs with known crystal structures form larger interfaces. For example, the canonical interface of nectins is formed by more than twenty residues per interacting protein whereas the interface of Type-II cadherins is formed by more than thirty residues per protein [27,28]. In fact, interfaces of around fifty residues are average for weak dimers [29]. In agreement with this idea, mutations in loop 198–207 do not completely abolish NaK β11 association in vivo [25].
Here, we have used bioinformatics tools to identify potential residues involved in the NaK β11 interaction. First, we performed Molecular Dynamics (MD) simulations and protein-protein docking of the NaK β1 extracellular domain. The resulting dimer models consistently included region 221–229 at the interface. Site-directed mutagenesis and adhesion assays suggest that residues along the 221–229 segment are crucial to the recognition between NaK β1 subunits. We propose that the Na+, K+-ATPase associates in trans mainly through residues 198–207 and 221–229 in its β1 subunit.

2. Results

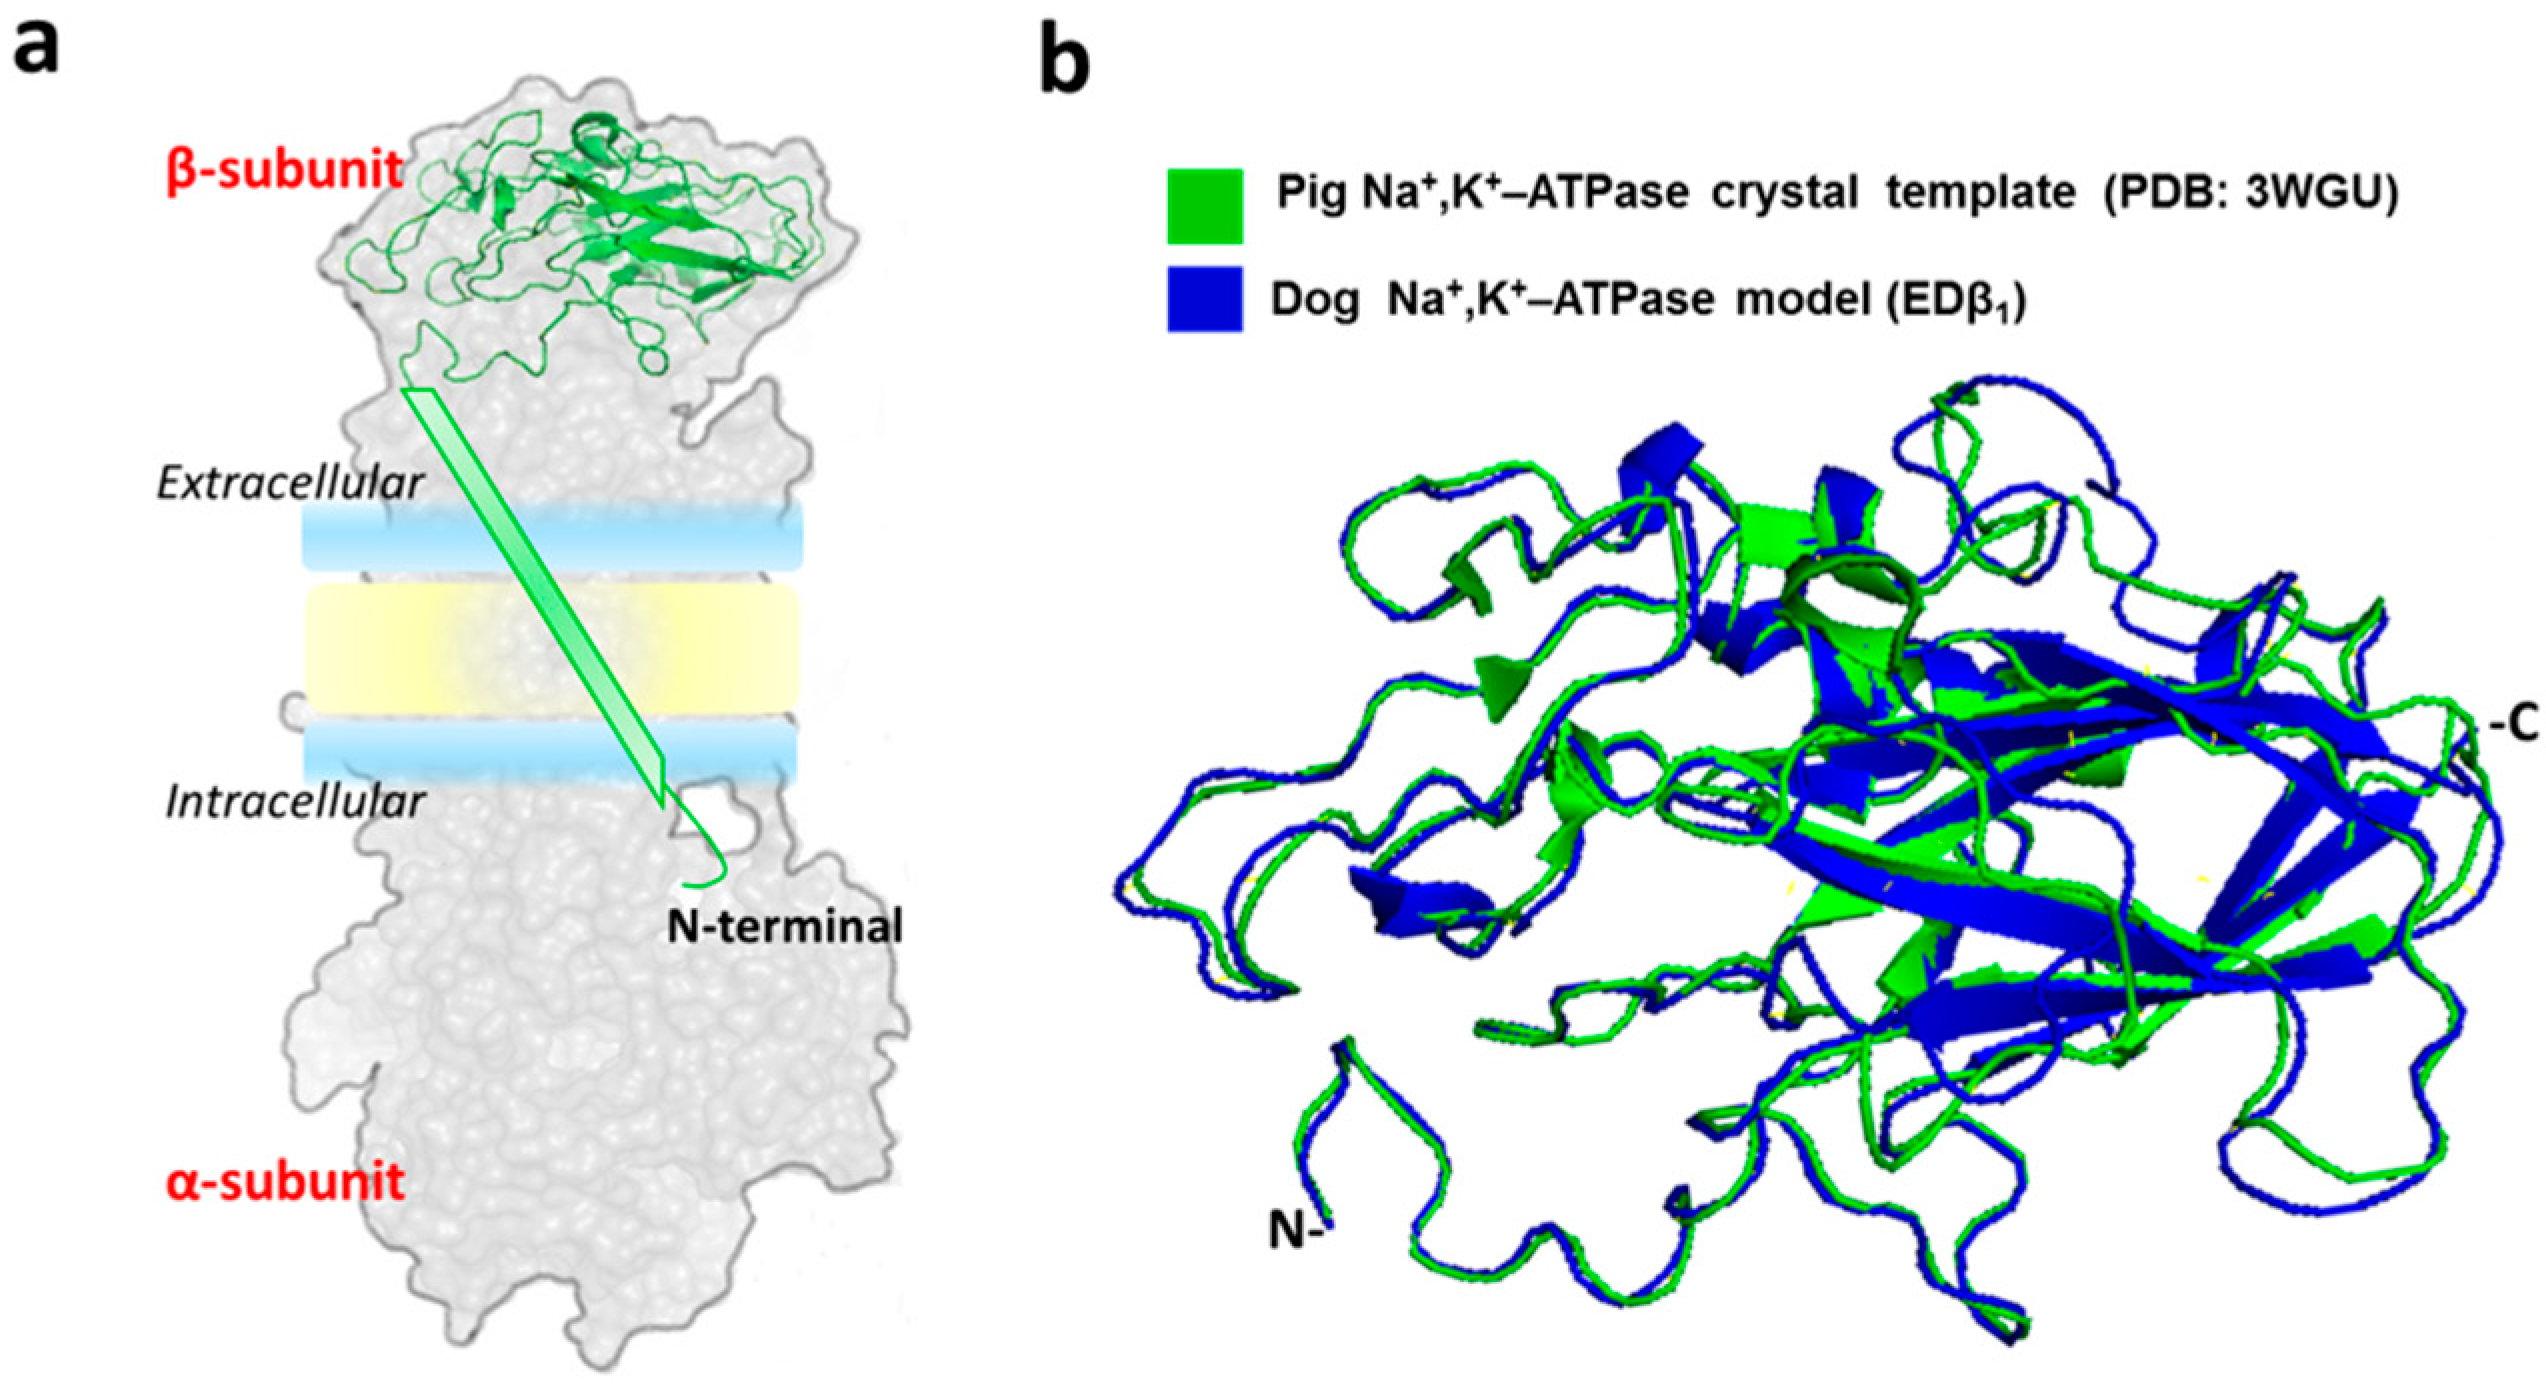
2.1. Generation of the Dog Β1 Subunit Extracellular Domain Model

In our laboratory, we have studied the adhesive function of NaK β1 subunit in the epithelial MDCK cell line derived from dog kidney [7,8,10,13]. We decided to model a β1 subunit with the canine sequence to be able to use our experimental tools for validation of any prediction in silico. Several high-quality X-ray structures of the Na+, K+-ATPase are available at the PDB. We chose the crystal structure of the pig Na+, K+-ATPase with bound Na+ as a template (PDB code 3WGU) because of its high resolution (2.8 Å) and high identity to the canine sequence (92%) [30]. We considered only the extracellular region of NaK β1 subunit so we omitted the transmembrane and cytoplasmic domains. The resulting model was designated EDβ1 (Figure 1). Validation criteria such as Ramachandran plot showed that the EDβ1 model is of very high quality (Supplementary Figure S1). We proceeded to perform MD simulations of the EDβ1 model to evaluate its structural stability.

2.2. Molecular Dynamics Simulations of the EDβ1

The stability of the system during MDS was assessed by plotting root mean square deviation (RMSD). Protein flexibility was evaluated by plotting root mean square fluctuation (RMSF). The RMSD plot shows that EDβ1 reached equilibrium at about 50 ns of MDS (Figure 2a). The backbone is stabilized from 10 ns to 50 ns (0.2–0.7 nm) suggesting that conformational changes take place from 0 ns to 10 ns as the system equilibrates. The RMSF plot shows that the most stable segments correspond to the β-sheet secondary structure that forms the β-sandwich core of the ectodomain (Figure 2b, black arrows). The most flexible regions of the ectodomain correspond to N and C terminal ends, as expected. Also, loop residues Arg136–Glu141 and Ile163–Gly171 showed high flexibility of around 5.5 to 8.5 Å (Figure 2b). For comparison, we took a sample of five conformers from the MDS trajectory. These structures corresponded to 10 ns, 20 ns, 30 ns, 40 ns and 50 ns of simulation. The structural alignment of the conformers shows that the globular structure of the ectodomain is preserved (Figure 2c,d). These results validated our model and suggested that a ‘soluble’ ectodomain of NaK β1 is structurally stable. We then designed a refined protein-protein docking prediction using the different EDβ1 conformers. Protein conformers from MD simulations are used to improve docking predictions [31,32].

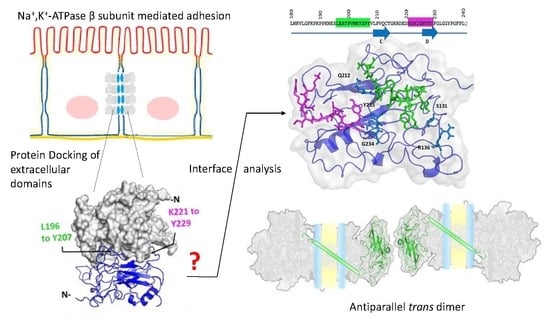
2.3. Protein-Protein Docking Predicts that Na+, K+-Atpase Β1 Subunit Dimer Is Formed by Regions Leu196–Tyr207 and Lys221–Tyr229

We chose the ClusPro server because it has been the best predictor in the last rounds of the CAPRI (Critical Assessment of PRediction of Interactions) experiment. This server groups the best 1000 protein complexes in clusters and the size of each cluster is proportional to its probability [33,34]. Prior to docking, we masked residues 61–120 since these are continuous to the TM domain and are facing the plasma membrane in the complete Na+, K+-ATPase. The six largest clusters are shown in Figure 3a. Computational docking is unable to identify the protein complex closest to the native structure in most cases. Thus, the selection of the best models cannot be based on scoring functions only [34]. In our case, we based the selection on the fact that residues 198–207 must appear at the interface [25]. We analyzed the interface of each of the selected top six complexes to identify residues lying in this segment. We selected four out of the top six models and named these A, B, C and D. Two clusters corresponded to the 10 ns conformer (129 and 98 out of 1000 complexes) and two clusters corresponded to the 50 ns conformer (127 and 86 out of 1000 complexes) (Figure 3a).
The best dimer model, model A, shows that β1 subunits interact in an antiparallel fashion. In the other models, β1 subunits display a varying orientation. In addition to the 196–207 segment, we identified residues from the region 221–229 at the interface of the four final models. (Figure 3b). This consistency in the docking results suggests that region 221–229 might include potential residues for NaK β11 interaction. Figure 3c shows the interface of model A in detail. This interface has a buried surface area of 1600 Å2. As in the other models, segments Leu196–Tyr207 and Lys221–Tyr229 from both NaK β1 subunits form the interface. Residues Ser131, Arg136, Gln212, Tyr235, and Pro236 are also part of the interface but are non-continuous in sequence. We submitted model A to MD simulations to refine and validate the complex. The RMSF plot shows that the C-terminal ends greatly reduced their flexibility in comparison to the monomer (from 7.5 to 4.5–5.0 Å) (Figure 3d). This was expected since β1 subunits associate via their C-terminal domains. The same amino acids (136–141 and 163–171) with high deviation in the RMSF of the monomer (see Figure 2b) are highly flexible in the ‘receptor’ β1 subunit in the complex (Figure 3d). Supplementary Figure S2 shows the radius of gyration and RMSD plots.

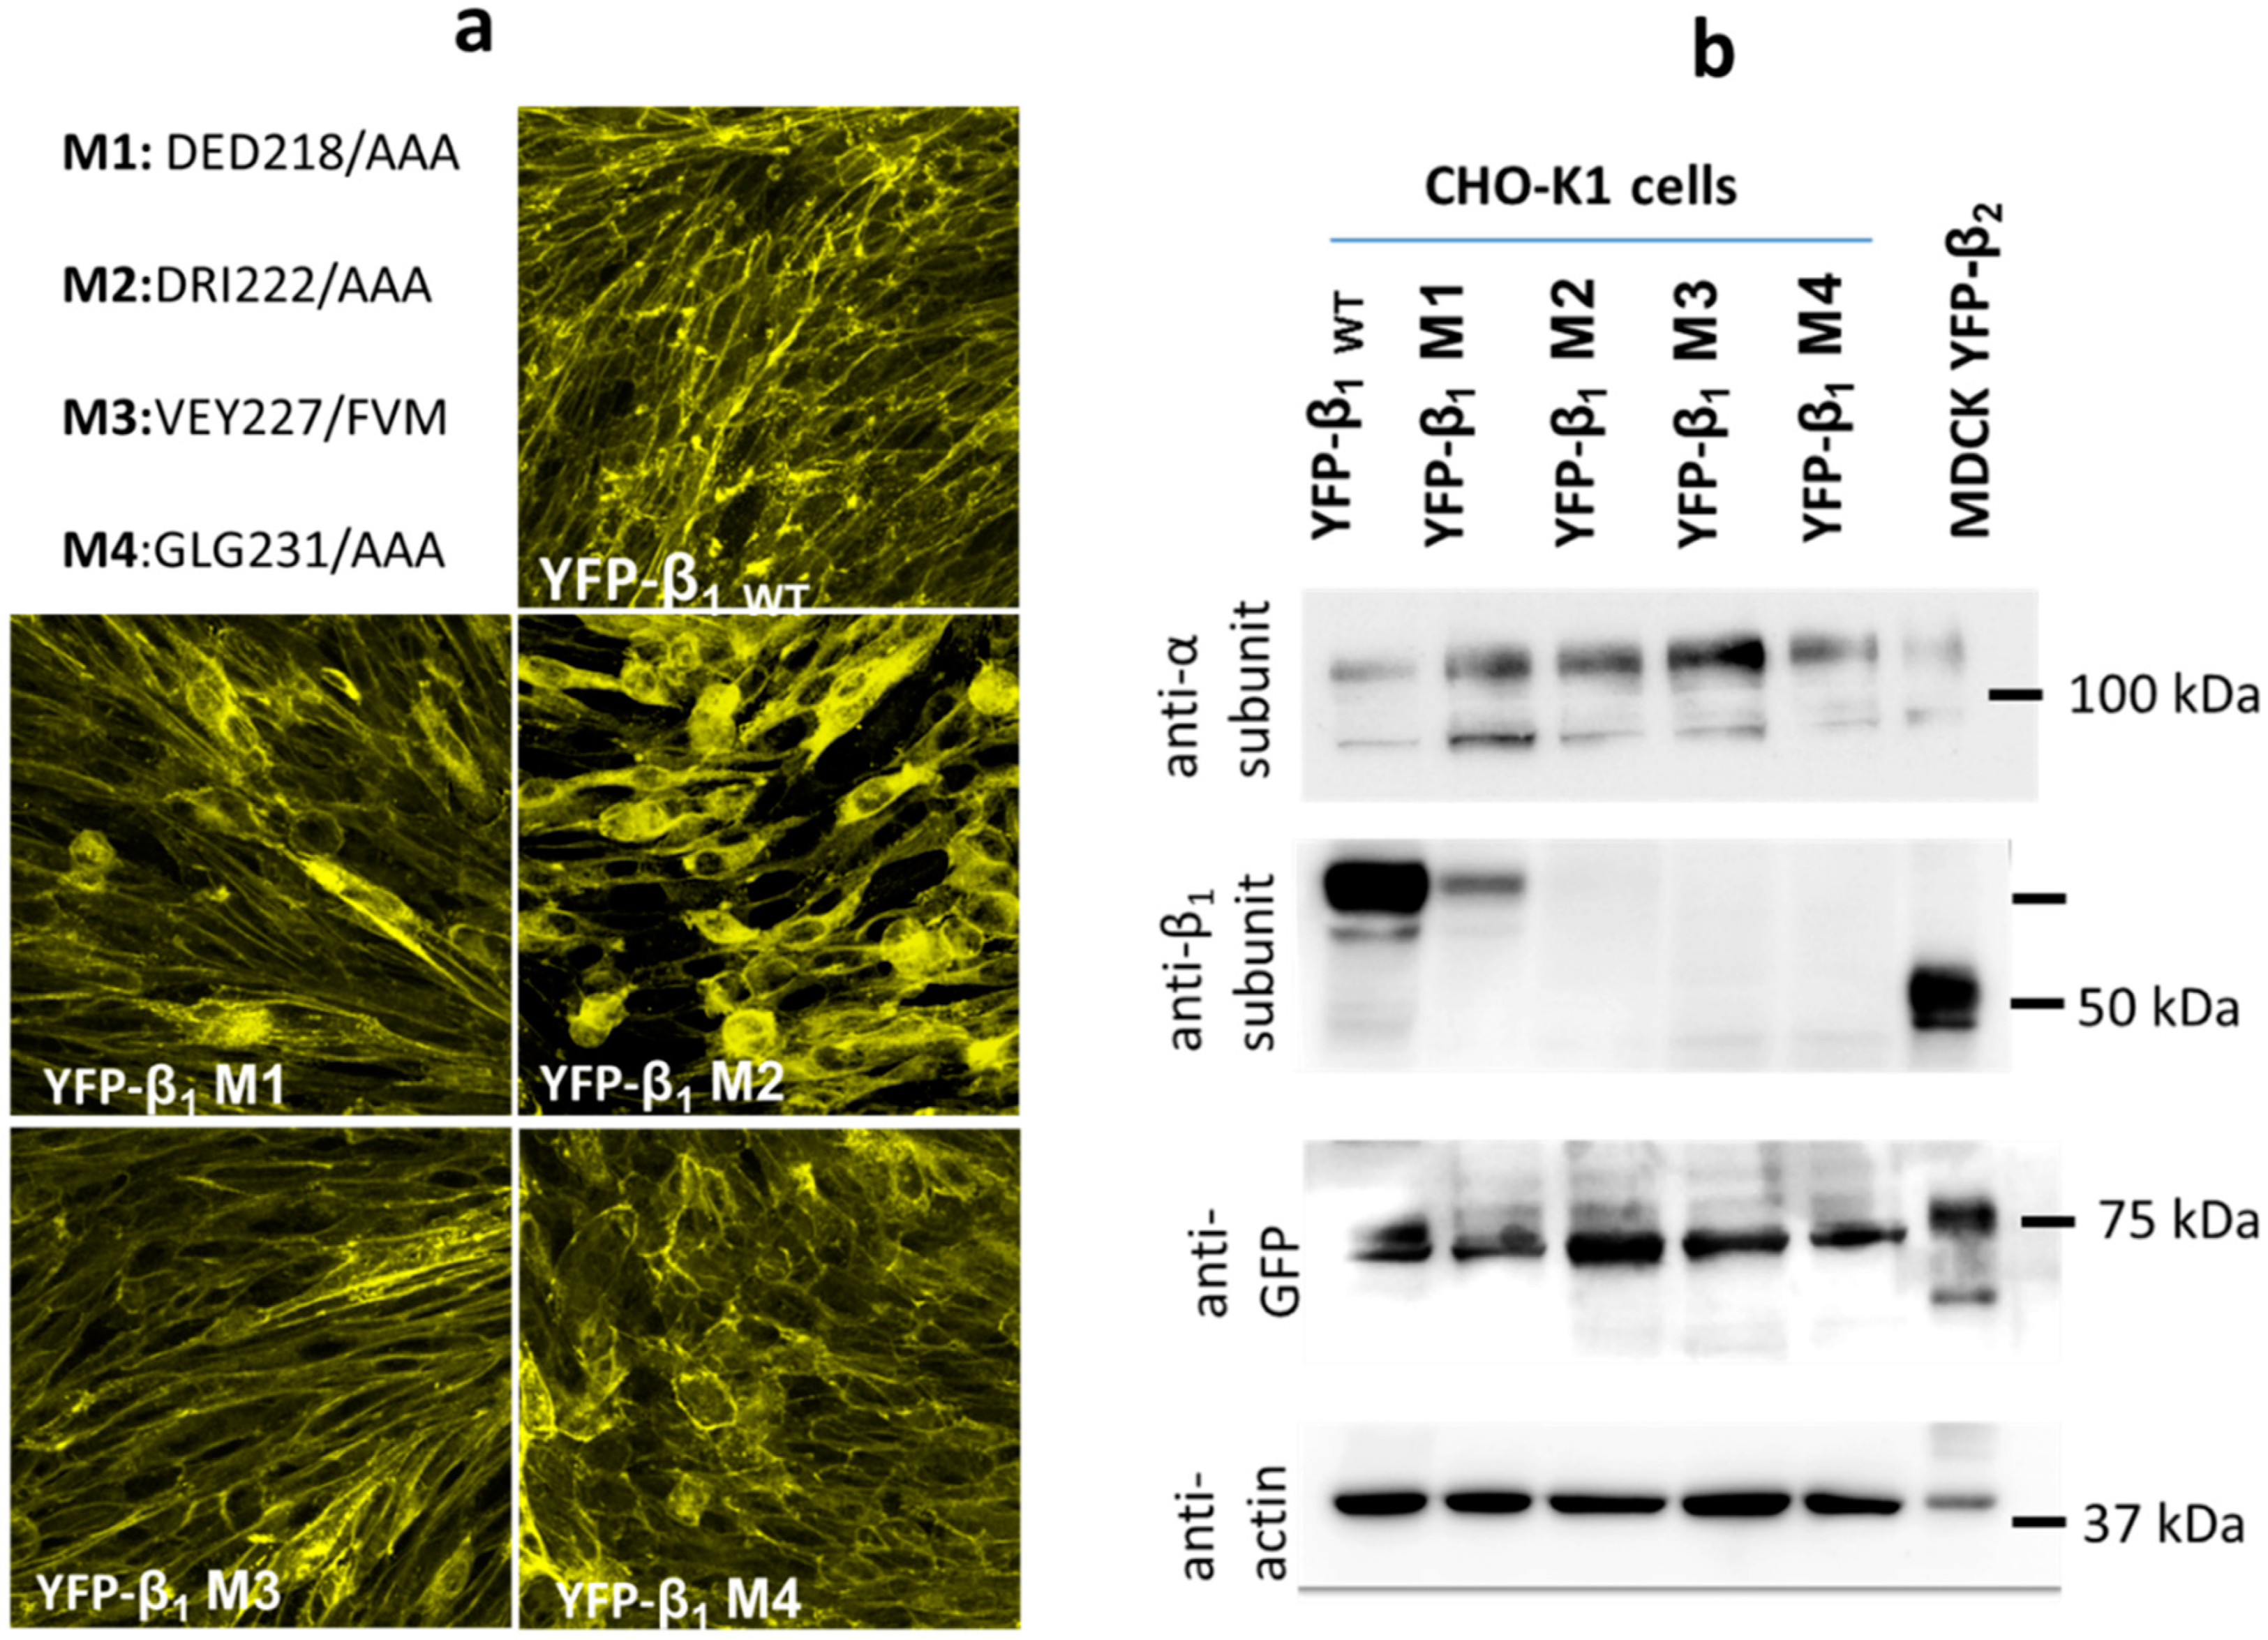
2.4. Expression of YFP-β1 Mutants in CHO Fibroblasts

We decided to use a directed mutagenesis strategy to assess the involvement of the novel region 221–229 in the NaK β11 interaction. We generated several triple mutations on a fusion protein YFP-β1. The YFP protein allows for identification of the transfected protein in vivo. We mutated residues 218–220 (M1), 222–224 (M2) and 231–233 (M4), to alanine. Changing residues 227–229 (M3) for alanine was predicted to disrupt the β-sheet structure in this region. We decided to replace these residues for their equivalent residues in the dog β2 subunit isoform (Figure 4a).
Fibroblast cells are an excellent model to study cell-cell adhesion since they do not form cellular junctions. We transfected the wild-type (WT) and the four YFP-β1 mutants (M1 to M4) into CHO-K1 fibroblasts. We obtained stable clones expressing each exogenous fusion protein at the plasma membrane (Figure 4a). These results show that none of the NaK β1 subunit mutations resulted in synthesis or folding impairments in vivo. WT and mutant (M1 to M4) fusion proteins were also detected by Western blot from cell lysates. For this assay, we used antibodies against the α1-subunit, YFP and the β1 subunit. Interestingly, the anti-β1 antibody detects only the WT and M1 proteins but does not detect mutants M2, M3, and M4. This indicates that the epitope recognized by this monoclonal antibody starts in residue 221 and extends at least to residue 233. However, an anti-YFP antibody detects a 75 kDa band in all cell lines (WT and M1–M4), corresponding to a β1 subunit fused with YFP (Figure 4b). We proceeded to perform cell adhesion assays with mutants M1–M4.

2.5. Cho Cells Expressing Yfp-β1 m2 and m3 Show Decreased Na+,K+-Atpase β1 Subunit- Mediated Intercellular Adhesion In Vivo

As previously shown, transfection of canine NaK β1 subunit in CHO fibroblast increases cell adhesion [10,35]. We performed Dispase assays to assess cell-cell adhesion in the stably transfected cell lines. These consist of incubation with the enzyme Dispase to detach the cell monolayer. Resistance to mechanical stress after detachment of the cells can be quantified by measuring the size of the aggregates. After suspension, non-transfected cells (CHO WT) formed many small aggregates. In addition to small aggregates, CHO YFP-β1 WT formed cell aggregates of a larger area (Figure 5a). Distribution of cell aggregates is shown in Figure 5b. Aggregates with an area smaller than 5000 µm2 showed the same frequency between cell lines, so only those above this value were quantified. Cell lines expressing mutants M1 and M4 showed similar aggregate areas compared to those expressing the non-mutated YFP-β1 WT. Cell lines expressing mutants M2 and M3 form aggregates of a smaller area in comparison to cells expressing the non-mutated YFP-β1 WT. Nevertheless, none of the four mutant cell lines showed a decrease in adhesion to a comparable level of non-transfected cells. These results suggest that residues mutated in M2 and M3 are involved in the β1 subunit-mediated cell adhesion in CHO fibroblasts (Figure 5b).

2.6. Cho Cells Expressing Yfp-Β1 M2, M3 And M4 Show Decreased Na+,K+-Atpase Β11 Interaction In Vitro

We have previously reported the use of a canine β1 subunit tagged with a hexahistidine tail (β1His6) in its N-terminal end [7]. The β1His6 protein immobilized in a Ni-NTA matrix interacts in vitro with the soluble ectodomain of the canine Na+, K+-ATPase β1 subunit (sec β1). The protein complex is eluted and analyzed for the presence of the two interacting proteins. This ‘pull-down’ experiment is suitable for analyzing the association of β1 subunits of different molecular weight.
We wondered whether the fusion protein YFP-β1 WT (75 kDa) was capable of interacting with β1His6 (50 kDa). Representative results are shown in Figure 6a. Incubation of YFP-β1 WT with immobilized β1His6 resulted in the detection of both proteins in the eluate fraction. This indicates a positive association in vitro (lane 5, upper panel). In contrast, incubation of non-transfected CHO WT cell lysates with immobilized β1His6 resulted in the detection of only β1His6 in the eluate fraction (lane 4, upper panel). We incubated lysates from each of the YFP-β1 mutant expressing cell lines (M1 to M4) with immobilized β1His6. As expected, eluates blotted with the antibody against the NaK β1 subunits detected a 75 kDa band only for M1 (lane 6, upper panel). As shown in Figure 4b this antibody does not detect M2 to M4. (lanes 7 to 9, upper panel). However, a 75 kDa band was detected for the YFP-β1 WT and the four mutant cell lines (M1 to M4) when eluates were blotted with an anti-GFP antibody (lanes 6 to 9, lower panel). We detected different signal intensity for each of the four mutants. The bar graph in Figure 6b shows the densitometry quantification of immunoblots of each YFP-β1 mutant in relation to that of YFP-β1 WT. YFP-β1 M1 showed no difference from non-mutated YFP-β1 WT. In contrast, YFP-β1 M2 showed a very low signal, a 25% of that of YFP-β1 WT. YFP-β1 M3 and YFP-β1 M4 showed similar levels of approximately 50% decrease in the signal compared to the non-mutated YFP-β1 WT.
These results suggest that residues mutated in M2 and M3 are most probably involved in the association between Na+, K+-ATPase β1 subunits. The residues mutated in M4 could also play a role in the recognition between NaK β1 subunits, although to a lesser extent.

3. Discussion

The β1 subunit of the Na+, K+-ATPase is a homotypic cell adhesion protein in epithelia. The structural basis for NaK β11 interaction has not been fully described. To our knowledge, this is the first report of MD simulations focused on the Na+, K+-ATPase β1 subunit. Studies of cation selectivity of the Na+, K+-ATPase have analyzed the structural behavior of the β1 subunit transmembrane domain only [36,37]. Our results confirmed that the ectodomain of the β1 subunit is a stable structure that remains folded independently of the rest of the Na+, K+-ATPase. This is consistent with results showing that the ectodomain is resistant to proteolytic cleavage [38]. We also know that a soluble version of the NaK β1 ectodomain, named secβ1, maintains its adhesive property [8,26,27]. In our present study, we observed high flexibility in loops Arg136–Glu142 and Ile162–Gly171 during monomer simulation (Figure 2b,d) and dimer simulation (Figure 3d). As already reported, the main residues of the β1 subunit responsible for the association with the α subunit are Tyr69 to Tyr83 and Asn182–Ile185 [39]. Thus, this instability is probably due to the fact that our model lacks the structural restrictions imposed by the associated α-subunit. Therefore, the C-terminal half of the ectodomain is more stable than the N-terminal half, which lacks the contact with the α-subunit, and it is in that region that two β1 subunits interact to form a trans dimer.
Our docking results identified residues Glu194-Tyr207 and residues Lys221-Tyr229, at the interface of the best models of the dimer (Figure 3b,c). The first zone had already been described by Tokhtaeva et al. [25]. Our docking strategy was trustworthy for several reasons: (1) we used a template with a 92% identity. Sequence identity is a reliable indicator of the quality of docking predictions [40]. (2) We used several conformational states as input proteins. This strategy also increases performance [41], and (3) we selected the top models according to experimental evidence.
We assessed the effect of mutations along the segment Lys221–Tyr229 in adhesion assays both in vivo and in vitro. Substitution of residues 218–220 in YFP-β1 M1 did not affect NaK β11 interaction in any experiment. This is consistent with our model since none of the three residues (Glu218, Asp219 and Glu220) is predicted to form the interface. Nevertheless, mutants YFP-β1 M2 and YFP-β1 M3 (residues 222–224 and 227–229, respectively) showed a significant decrease in adhesion in both assays. These results support the notion that segment 222–229 plays an important role in the recognition, in agreement with our model. Interestingly, the cytoplasmic localization of YFP-β1 M2 was higher than all other transfected cell lines (Figure 4a). This might indicate that the membrane stability of the Na+, K+-ATPase composed of YFP-β1 M2 is weakened, but this remains to be investigated. Substitution of residues 231–233 in YFP-β1 M4 significantly affected the interaction in vitro but not in vivo. In the second case, only a tendency to decrease was observed (Figure 5 and Figure 6). We propose that mutation of these residues to alanine might have destabilized adjacent residues. In agreement with this idea, adjacent residues Gly234 and Tyr235 both appear at the core of the putative interface (Figure 3c, blue residues). To our surprise, mutation of three consecutive residues did not result in an absolute loss of adhesion neither in vivo nor in vitro. Mutants YFP-β1 M2 and YFP-β1 M3 both resulted in a decrease in adhesion that was not equivalent to non-adhesive control CHO cells (Figure 5 and Figure 6). However, mutants only targeted half of the putative interface. On this basis, we conclude that residues 222–229 are critical but not sufficient for Na+, K+-ATPase β1 subunit association. Supplementary Figure S3 shows polar and hydrophobic interactions between receptor and ligand proteins. Residues Asp222, Arg223, Ile224, Gly225 and Asn226 bind residues along the Val201–Tyr207 sequence, on the homologous β1 subunit. This is consistent with Tokhtaeva et al., who identified Leu196, Glu197 Tyr199, and Tyr204 (Tyr 205 in the rat sequence) as hotspot residues [25,26].
In classical CAMs, such as cadherins and nectins, recognition takes place mainly via residues in a β-sheet secondary structure [27,28]. This is to be expected since their extracellular domains are primarily a β-sandwich structure. In contrast, the β1 subunit of the Na+, K+-ATPase has a single globular extracellular domain. According to our model, the adhesive interface of NaK β1 is mainly formed by loop residues. It is important to mention that the NaK β11 interaction is stabilized by the N-glycans on the ectodomain [8,13]. In our model, we did not include any N-glycan moieties; nonetheless, we identified Asn193 as the N-glycosylated residue closest to the interface. It is possible that this particular N-glycan contributes the most to the binding process. Lastly, unlike other CAMs, the β1 subunit of the Na+, K+-ATPase forms an obliged dimer with the catalytic α-subunit. It is expected that the β1 subunit suffers conformational changes in response to changes in α-subunit, during the catalytic cycle [42]. There are reports of MD simulations of the complete Na+, K+-ATPase [43,44]. However, they offer no description of the structural relationship between α and β subunits. Taken together, the results of this study complement our understanding of Na+, K+-ATPase recognition at the intercellular space. Current work in our laboratory is aimed at characterizing the kinetic properties of dimer formation.

4. Materials and Methods

4.1. Na+, K+-Atpase Β1-Subunit Modeling

Sequences of Na+, K+-ATPase β1 subunit were retrieved from UniProt database (UniProtKB, ID: P06583) and aligned using BLAST (https://blast.ncbi.nlm.nih.gov/Blast.cgi). The X-ray diffraction structure of Na+, K+-ATPase was downloaded from the Protein Data Bank. Based on identity and crystal resolution, the pig Na+, K+-ATPase in the E1 state Na+ bound was chosen (PDB code 3WGU) [30]. To build the β1 subunit model with the dog sequence the SWISS-MODEL server [45] (Web: https://swissmodel.expasy.org/) was used. To study the protein extracellular surface, the resulting model (polypeptide chain only) was edited. The final PDB file included the extracellular domain of β1 subunit from residues 61 to 303. Model quality assessment is described in Figure S1.

4.2. Molecular Dynamics Simulations

We performed MD simulations of the model using GROMACS package, by employing the OPLS force field for GROMOS (GROMACS 96) [46]. The box dimension was settled at least 2.0 nm away from the wall of the dodecahedral box with periodic boundary condition, solvated with TIP3 water molecules. The system was neutralized up to 0.15 NaCl. Energy minimization was carried out using the steepest descent method. Berendsen temperature coupling and isotropic pressure coupling were established in order to reach a stable environment (300 K 1 bar). To treat electrostatic and Van der Waals interactions, the particle mesh Ewald (PME) algorithm was applied, using the following values, the cut-off for the short-range VdW (rvdw) was set to 1.0 nm and Coulomb cut-off (r coulomb) at 1.0 nm. All the bond lengths were constrained using the LINCS algorithm [47] and the time step was set to 0.002 ps. The complex was equilibrated for 10 ns, and the MD simulation was run for 50 ns. All structural analyses were carried out by means of the program GROMACS [48]. Snapshots of different MD simulations (10 ns, 20 ns, 30 ns, 40 ns and 50 ns) of the trajectory were retrieved for the analysis of the conformational structure of the protein.

4.3. Protein-Protein Docking

The ClusPro Server was used to perform protein-protein docking analysis. ClusPro is based on a three-step algorithm. First, it runs PIPER, a rigid body docking program, based on Fast Fourier Transform (FFT) docking method with pair wise potentials. Then, by using a clustering technique for the detection of near-native conformations [33] and by eliminating some of the non-native clusters, the 1000 best energy conformations are clustered and the 30 largest clusters are retained for refinement. Finally, through Monte Carlo simulations, the stability of each complex is analyzed and finally, structures are refined through SDU (Semi-definite programming based underestimation). Snapshots at different MD simulations (10 ns, 20 ns, 30 ns, 40 ns, and 50 ns) of the trajectory were retrieved and submitted them to molecular docking using the ClusPro server (https://cluspro.bu.edu/login.php) [34]. Output files are grouped into 4 categories: (1) Balanced, (2) Electrostatic-favored, (3) hydrophobic-favored and (4) VdW+Elec. As suggested by the server, we chose complex in the balanced (1) category. All conformers were submitted to a directed docking by masking residues Ile61 to Ser115.

4.4. Interface Analysis and Molecular Visualization

We used the server SPPIDER (Solvent Accessibility based Protein-Protein Interface identification and Recognition) for the protein-protein interface analysis. Default settings were at least a 4% change in solvent accessibility (RSA). The dimer was also submitted to InterProSurf (UTMB Health, Galveston, TX, USA), which generates values for solvent accessibility change for each residue in monomeric and dimeric states. Visualization and structural analysis of the models for image design were performed with the package Pymol Molecular Graphics System version 1.7.4.5 (Schrödinger, LLC., New York, NY, USA), academic version.

4.5. Site-Directed Mutagenesis

For directed mutagenesis, the plasmid pEYP-C1 (Clontech, Mountain View, CA, USA) with the inserted dog NaK β1 sequence (Gene ID: 403966) was used as a template. This plasmid expresses the YFP protein fused to the intracellular N terminal of β1 subunit. Plasmid preparation including PCR, restriction assays and selection was as previously reported for the analog pEYP-N1 [7]. The following mutated oligonucleotides were used for triple mutations:
  • 5′-CAGTGCACTGGCAAGCGAGCTGCTGCCAAGGATAGAATTGGGAAC-3′,
  • 5′-CAAGCGAGACGAAGACAAGGCTGCAGCTGGGAACGTGGAGTATTTTG-3′,
  • 5′-CAAGGATAGAATTGGGAACTTCGTGATGTTTGGCCTGGGCGGCTACCC-3′
  • 5′-GGAACGTGGAGTATTTTGCTGCTGCTGGCTACCCGGGCTTTCCTC-3′.
The Quick Site Mutagenesis kit (Stratagene, La Jolla, CA, USA) was used according to instructions. Resulting DNA was transformed into competent E. coli cells and DNA sequencing was performed in order to confirm mutations.

4.6. Cell Culture, Transfection, and Imaging

CHO-K1 fibroblasts (ATCC CCL-61) were cultured in a mixture of F12\DMEM media (1:1) complemented with a mixture of 100 U/mL penicillin, 100 µg/mL streptomycin and 10% fetal calf serum (GIBCO). For transfection, cells were harvested using trypsin-EDTA and cultured in a serum-free medium on dishes with coverslips at a confluence of 70%; 3 µg of plasmid DNA was transfected according to the lipofectamin 2000 (Invitrogen, Carlsbad, CA, USA) protocol. Cells expressing the transfected protein were selected using G-418 (GIBCO) for the generation of stable clones. For stable clone imaging, cells cultured on coverslips were fixed with cold methanol and blocked with 3% BSA in PBS buffer. After washing, the coverslips were mounted with VECTASHIELD medium (Vector laboratories, Burlingame, CA, USA) and observed with a TCS SP2 confocal microscope (Leica, Hiena, Germany).

4.7. Western Blot

CHO cells were washed with PBS and solubilized with radio immune-precipitation assay (RIPA) buffer (RIPA Lysis Buffer System 24948A, Santa Cruz, Dallas, TX, USA). The amount of protein obtained in the resulting lysate was measured (BCA protein assay reagent; Pierce Chemical, Dallas, TX, USA) and then boiled in sample buffer for the subsequent SDS-polyacrylamide gel electrophoresis (PAGE). Proteins were then transferred to a PVDF membrane (Hybond-P; GE Healthcare, Chicago, IL, USA). The proteins of interest were then detected with the specific polyclonal or monoclonal antibodies, followed by species-appropriate peroxidase-conjugated secondary antibodies (Zymed Laboratories, South San Francisco, CA, USA). For detection of the NaK β1 subunit, the antibody kindly donated by Dr. Caplan was used as reported in previous works (Padilla et al. 2010). The other primary antibodies used in this study were: anti-GFP rabbit polyclonal antibody sc-8334 (Santa Cruz, Dallas, TX, USA). Anti NaK α1 subunit (Abcam, Cambridge, UK) and anti-actin antibody (hybridoma supernatant were donated by Dr. Hernández Hernández, Cinvestav, Mexico City, Mexico). Immobilon Western Chemiluminescent HRP Substrate (Sigma-Aldrich, St. Louis, MO, USA) was used for chemiluminescent detection and the signal was captured with the ChemiDoc™ XRS+ System (BioRad, Hercules, CA, USA).

4.8. Dispase Adhesion Assay

Fibroblasts were cultured in 12-well plates and 24 h after reaching confluency, they were washed with PBS three times and incubated with 200 µL dispase I (2.4 U/mL; Sigma-Aldrich) for 40 min. Released monolayer fragments were subjected to mild mechanical stress by pipetting up and down only three times. A 30 µL duplicate sample was taken from each well and mounted for visualization in an Axiovert 200M Fluorescence/Live cell Imaging Microscope (Zeiss, Oberkochen, Germany). A total of 5 random images from each coverslip were taken, and the experiment was performed four times, amounting to forty snapshots per cell line. The number and area of each aggregate were quantified for each snapshot using the program ImageJ. Cell clumps with an area greater than 1000 µm2 were considered for data analyses.

4.9. Pull-Down Assay

We performed a batch version of the Pull-down assay employed by Padilla-Benavides et al. [7]. Cell lines stably expressing the dog β1 subunit with an N-terminal 6His-tag (β1His6) were cultured and lysed with RIPA buffer complemented with protease inhibitors; 300 µL of Ni-NTA His•Bind® Resin (Sigma-Aldrich,) previously equilibrated with RIPA buffer, was used to immobilize the β1His6 protein from the lysates. Then, 4 mg of total protein extract was loaded and left to interact for at least 12 h at 4 °C with gentle shaking. After three washes with 500 µL of a 20 mM imidazole solution, 10 mg protein from the different lysates was loaded as prey and left to interact overnight at 4 °C with gentle shaking. After the three washes with 20 mM imidazole, the bound β1His6 was eluted with 200 µL of a 500 mM imidazole solution. Eluates were loaded on a 10% SDS-PAGE gel and analyzed by immunoblotting.

Supplementary Materials

Supplementary Materials can be found at https://www.mdpi.com/1422-0067/20/18/4538/s1. Figure S1: Quality assessment of the dog ED β1 model, Figure S2: MD simulations of model A, Figure S3: The putative interface in detail.

Author Contributions

Conceptualization, O.P., M.M.-A., N.V.-S., J.C.-B. and L.S.; methodology, O.P. and M.L.R.; software, M.M.-A. and J.C.-B.; validation, O.P., M.M.-A. and L.S.; formal analysis, O.P. and M.M.-A.; investigation, O.P.; resources, M.M.-A., N.V.-S., J.C.-B. and L.S.; data curation, O.P. and M.M.-A.; writing—original draft preparation, O.P., M.M.-A. and L.S.; writing—review and editing, O.P., M.M.-A., N.V.-S., J.C.-B. and L.S.; visualization, O.P.; supervision. M.M.-A., N.V.-S., J.C.-B. and L.S.; project administration, L.S.; funding acquisition, M.M.-A., J.C.-B. and L.S.

Funding

This work was supported by a research grant (L.S., N.V.-S. and J.C.-B.) and research fellowship (OP) from CONACYT (National Research Council of México), Proyecto Insignia IPN2015 and ECOS NORD FRANCIA (JCB and MMA).

Acknowledgments

The authors thank Raul Bonilla-Moreno and Rosalia Aguirre for their dedicated technical assistance.

Conflicts of Interest

The authors declare no conflict of interest.

References

  1. Cereijido, M.; Shoshani, L.; Contreras, R.G. The Polarized Distribution of Na+, K+-ATPase and Active Transport across Epithelia. J. Membr. Biol. 2001, 184, 299–304. [Google Scholar] [CrossRef] [PubMed]
  2. Lobato Álvarez, J.A.; López Murillo, T.D.C.; Vilchis Nestor, C.A.; Roldán Gutierrez, M.L.; Páez Gómez, O.; Shoshani, L. Epithelial Na+,K+-ATPase—A Sticky Pump. In Cell Biology-New Insights; InTechOpen: London, UK, 2016. [Google Scholar] [CrossRef]
  3. Sweadner, K.J. Isozymes of the Na+/K+-ATPase. Biohim. Biophys. Acta 1989, 2, 185–220. [Google Scholar] [CrossRef]
  4. Geering, K. Functional Roles of Na,K-ATPase Subunits. In Current Opinion in Nephrology and Hypertension; Springer: New York, NY, USA, 2008; pp. 526–532. [Google Scholar] [CrossRef]
  5. Cereijido, M.; Larre, I.; Paez, O.; Shoshani, L.; Ponce, A. Na+/K+-ATPase Drives Most Asymmetric Transports and Modulates the Phenotype of Epithelial Cells. In Ion Channels and Transporters of Epithelia in Health and Disease; Springer: New York, NY, USA, 2015; pp. 351–374. [Google Scholar] [CrossRef]
  6. Campbell, H.K.; Maiers, J.L.; DeMali, K.A. Interplay between Tight Junctions & Adherens Junctions. In Experimental Cell Research; Elsevier: Amsterdam, The Netherlands, 2017; pp. 39–44. [Google Scholar] [CrossRef]
  7. Padilla-Benavides, T.; Roldan, M.L.; Larre, I.; Flores-Benitez, D.; Nicolas, V.-S.; Contreras, R.G.; Marcelino, C.; Liora, S. The Polarized Distribution of Na+,K+-ATPase: Role of the Interaction between Beta Subunits. Mol. Biol. Cell 2010, 21, 4325–4337. [Google Scholar] [CrossRef] [PubMed]
  8. Tokhtaeva, E.; Sachs, G.; Souda, P.; Bassilian, S.; Whitelegge, J.P.; Shoshani, L.; Vagin, O. Epithelial Junctions Depend on Intercellular Trans-Interactions between the Na,K-ATPase β1subunits. J. Biol. Chem. 2011, 286, 25801–25812. [Google Scholar] [CrossRef] [PubMed]
  9. Cereijido, M.; Contreras, R.G.; Shoshani, L.; Larre, I. The Na+-K+-ATPase as Self-Adhesion Molecule and Hormone Receptor. AJP Cell Physiol. 2012, 302, C473–C481. [Google Scholar] [CrossRef] [PubMed]
  10. Shoshani, L.; Contreras, R.G.; Roldán, M.L.; Moreno, J.; Lázaro, A.; Balda, M.S.; Matter, K.; Cereijido, M. The Polarized Expression of Na+,K+-ATPase in Epithelia Depends on the Association between Beta-Subunits Located in Neighboring Cells. Mol. Biol. Cell 2005, 16, 1071–1081. [Google Scholar] [CrossRef] [PubMed]
  11. Gloor, S.; Antonicek, H.; Sweadner, K.J.; Pagliusi, S.; Frank, R.; Moos, M.; Schachner, M. The Adhesion Molecule on Glia (AMOG) Is a Homologue of the β Subunit of the Na, K-ATPase. J. Cell Biol. 1990, 110, 165–174. [Google Scholar] [CrossRef] [PubMed]
  12. Antonicek, H.; Schachner, M. The Adhesion Molecule on Glia (AMOG) Incorporated into Lipid Vesicles Binds to Subpopulations of Neurons. J. Neurosci. 2018, 8, 2961–2966. [Google Scholar] [CrossRef]
  13. Vagin, O.; Tokhtaeva, E.; Sachs, G. The Role of the β1 Subunit of the Na,K-ATPase and Its Glycosylation in Cell-Cell Adhesion. J. Biol. Chem. 2006, 281, 39573–39587. [Google Scholar] [CrossRef]
  14. Espineda, C.E. Repression of Na, K-ATPase 1-Subunit by the Transcription Factor Snail in Carcinoma. Mol. Biol. Cell 2003, 15, 1364–1373. [Google Scholar] [CrossRef]
  15. Inge, L.J.; Rajasekaran, S.A.; Yoshimoto, K.; Mischel, P.S.; McBride, W.; Landaw, E.; Rajasekaran, A.K. Evidence for a Potential Tumor Suppressor Role for the Na,K-ATPase beta1-Subunit. Histol. Histopathol. 2008, 23, 459–467. [Google Scholar] [CrossRef] [PubMed]
  16. Rajasekaran, S.A.; Palmer, L.G.; Quan, K.; Harper, J.F.; Ball, W.J.; Bander, N.H.; Peralta Soler, A.; Rajasekaran, A.K. Na,K-ATPase Beta-Subunit Is Required for Epithelial Polarization, Suppression of Invasion, and Cell Motility. Mol. Biol. Cell 2001, 12, 279–295. [Google Scholar] [CrossRef] [PubMed]
  17. Lubarski-Gotliv, I.; Dey, K.; Kuznetsov, Y.; Kalchenco, V.; Asher, C.; Garty, H. FXYD5 (Dysadherin) May Mediate Metastatic Progression through Regulation of the β-Na + -K + -ATPase Subunit in the 4T1 Mouse Breast Cancer Model. Am. J. Physiol. Physiol. 2017, 313, C108–C117. [Google Scholar] [CrossRef] [PubMed]
  18. Madan, P.; Rose, K.; Watson, A.J. Na/K-ATPase β1 Subunit Expression Is Required for Blastocyst Formation and Normal Assembly of Trophectoderm Tight Junction-Associated Proteins. J. Biol. Chem. 2007, 282, 12127–12134. [Google Scholar] [CrossRef] [PubMed]
  19. Paul, S.M. The Na+/K+ ATPase Is Required for Septate Junction Function and Epithelial Tube-Size Control in the Drosophila Tracheal System. Development 2003, 130, 4963–4974. [Google Scholar] [CrossRef] [PubMed]
  20. Treuheit, M.J.; Costello, C.E.; Kirley, T.L. Structures of the Complex Glycans Found on the beta-Subunit of (Na,K)-ATPase. J. Biol. Chem. 1993, 268, 13914–13919. [Google Scholar] [PubMed]
  21. Oda, H.; Takeichi, M. Structural and Functional Diversity of Cadherin at the Adherens Junction. J. Cell Biol. 2011, 193, 1137–1146. [Google Scholar] [CrossRef] [PubMed]
  22. Aricescu, A.R.; Jones, E.Y. Immunoglobulin Superfamily Cell Adhesion Molecules: Zippers and Signals. Curr. Opin. Cell Biol. 2007, 19, 543–550. [Google Scholar] [CrossRef]
  23. Shimono, Y.; Rikitake, Y.; Mandai, K.; Mori, M.; Takai, Y. Immunoglobulin Superfamily Receptors and Adherens Junctions. Subcell. Biochem. 2012, 60, 137–170. [Google Scholar] [CrossRef]
  24. Chen, J.; Wu, Y. Understanding the Functional Roles of Multiple Extracellular Domains in Cell Adhesion Molecules with a Coarse-Grained Model. J. Mol. Biol. 2017, 429, 1081–1095. [Google Scholar] [CrossRef]
  25. Tokhtaeva, E.; Sachs, G.; Sun, H.; Dada, L.A.; Sznajder, J.I.; Vagin, O. Identification of the Amino Acid Region Involved in the Intercellular Interaction between the 1 Subunits of Na+/K+-ATPase. J. Cell Sci. 2012, 125, 1605–1616. [Google Scholar] [CrossRef] [PubMed]
  26. Tokhtaeva, E.; Sun, H.; Deiss-Yehiely, N.; Wen, Y.; Soni, P.N.; Gabrielli, N.M.; Marcus, E.A.; Ridge, K.M.; Sachs, G.; Vazquez-Levin, M.; et al. The O-Glycosylated Ectodomain of FXYD5 Impairs Adhesion by Disrupting Cell–cell Trans-Dimerization of Na,K-ATPase β 1 Subunits. J. Cell Sci. 2016, 129, 2394–2406. [Google Scholar] [CrossRef] [PubMed]
  27. Harrison, O.J.; Vendome, J.; Brasch, J.; Jin, X.; Hong, S.; Katsamba, P.S.; Ahlsen, G.; Troyanovsky, R.B.; Troyanovsky, S.M.; Honig, B.; et al. Nectin Ectodomain Structures Reveal a Canonical Adhesive Interface. Nat. Struct. Mol. Biol. 2012, 19, 906–915. [Google Scholar] [CrossRef] [PubMed]
  28. Brasch, J.; Katsamba, P.S.; Harrison, O.J.; Ahlsén, G.; Troyanovsky, R.B.; Indra, I.; Kaczynska, A.; Kaeser, B.; Troyanovsky, S.; Honig, B.; et al. Homophilic and Heterophilic Interactions of Type II Cadherins Identify Specificity Groups Underlying Cell-Adhesive Behavior. Cell Rep. 2018, 23, 1840–1852. [Google Scholar] [CrossRef] [PubMed] [Green Version]
  29. Janin, J.; Bahadur, R.P.; Chakrabarti, P. Protein-Protein Interaction and Quaternary Structure. Q. Rev. Biophys. 2008, 41, 133–180. [Google Scholar] [CrossRef] [PubMed]
  30. Kanai, R.; Ogawa, H.; Vilsen, B.; Cornelius, F.; Toyoshima, C. Crystal Structure of a Na+-Bound Na+,K+-ATPase Preceding the E1P State. Nature 2013, 502, 201–206. [Google Scholar] [CrossRef] [PubMed]
  31. Salmaso, V.; Moro, S. Bridging Molecular Docking to Molecular Dynamics in Exploring Ligand-Protein Recognition Process: An Overview. Front. Pharmacol. 2018, 9. [Google Scholar] [CrossRef]
  32. Maximova, T.; Moffatt, R.; Ma, B.; Nussinov, R.; Shehu, A. Principles and Overview of Sampling Methods for Modeling Macromolecular Structure and Dynamics. PLoS Comput. Biol. 2016, 12. [Google Scholar] [CrossRef]
  33. Vajda, S.; Yueh, C.; Beglov, D.; Bohnuud, T.; Mottarella, S.E.; Xia, B.; Hall, D.R.; Kozakov, D. New Additions to the ClusPro Server Motivated by CAPRI. Proteins Struct. Funct. Bioinform. 2017, 85, 435–444. [Google Scholar] [CrossRef]
  34. Kozakov, D.; Hall, D.R.; Xia, B.; Porter, K.A.; Padhorny, D.; Yueh, C.; Beglov, D.; Vajda, S. The ClusPro Web Server for Protein-Protein Docking. Nat. Protoc. 2017, 12, 255–278. [Google Scholar] [CrossRef]
  35. Vilchis-Nestor, C.A.; Roldán, M.L.; Leonardi, A.; Navea, J.G.; Padilla-Benavides, T.; Shoshani, L. Ouabain Enhances Cell-Cell Adhesion Mediated by β1 Subunits of the Na+,K+-ATPase in CHO Fibroblasts. Int. J. Mol. Sci. 2019, 20, 2111. [Google Scholar] [CrossRef] [PubMed]
  36. Castillo, J.P.; Rui, H.; Basilio, D.; Das, A.; Roux, B.; Latorre, R.; Bezanilla, F.; Holmgren, M. Mechanism of Potassium Ion Uptake by the Na+/K+-ATPase. Nat. Commun. 2015, 6, 7622. [Google Scholar] [CrossRef] [PubMed]
  37. Hilbers, F.; Kopec, W.; Isaksen, T.J.; Holm, T.H.; Lykke-Hartmann, K.; Nissen, P.; Khandelia, H.; Poulsen, H. Tuning of the Na,K-ATPase by the Beta Subunit. Sci. Rep. 2016, 6. [Google Scholar] [CrossRef] [PubMed]
  38. Bab-Dinitz, E.; Albeck, S.; Peleg, Y.; Brumfeld, V.; Gottschalk, K.E.; Karlish, S.J.D. A C-Terminal Lobe of the beta Subunit of Na,K-ATPase and H,K-ATPase Resembles Cell Adhesion Molecules. Biochemistry 2009, 48, 8684–8691. [Google Scholar] [CrossRef] [PubMed]
  39. Shinoda, T.; Ogawa, H.; Cornelius, F.; Toyoshima, C. Crystal Structure of the Sodium–potassium Pump at 2.4 Å Resolution. Nature 2009, 459, 446–450. [Google Scholar] [CrossRef] [PubMed]
  40. Rodrigues, J.P.G.L.M.; Melquiond, A.S.J.; Karaca, E.; Trellet, M.; Van Dijk, M.; Van Zundert, G.C.P.; Schmitz, C.; De Vries, S.J.; Bordogna, A.; Bonati, L.; et al. Defining the Limits of Homology Modeling in Information-Driven Protein Docking. Proteins Struct. Funct. Bioinform. 2013, 81, 2119–2128. [Google Scholar] [CrossRef] [PubMed]
  41. Smith, G.R.; Sternberg, M.J.E.; Bates, P.A. The Relationship between the Flexibility of Proteins and Their Conformational States on Forming Protein-Protein Complexes with an Application to Protein-Protein Docking. J. Mol. Biol. 2005, 347, 1077–1101. [Google Scholar] [CrossRef]
  42. Dempski, R.E.; Friedrich, T.; Bamberg, E. The β Subunit of the Na+/K+-ATPase Follows the Conformational State of the Holoenzyme. J. Gen. Physiol. 2005, 125, 505–520. [Google Scholar] [CrossRef]
  43. Razavi, A.M.; Delemotte, L.; Berlin, J.R.; Carnevale, V.; Voelz, V.A. Molecular Simulations and Free-Energy Calculations Suggest Conformation-Dependent Anion Binding to a Cytoplasmic Site as a Mechanism for Na+/K+-ATPase Ion Selectivity. J. Biol. Chem. 2017, 292, 12412–12423. [Google Scholar] [CrossRef]
  44. Čechová, P.; Berka, K.; Kubala, M. Ion Pathways in the Na+/K+-ATPase. J. Chem. Inf. Model. 2016, 56, 2434–2444. [Google Scholar] [CrossRef]
  45. Waterhouse, A.; Bertoni, M.; Bienert, S.; Studer, G.; Tauriello, G.; Gumienny, R.; Heer, F.T.; De Beer, T.A.P.; Rempfer, C.; Bordoli, L.; et al. SWISS-MODEL: Homology Modelling of Protein Structures and Complexes. Nucleic Acids Res. 2018, 46, W296–W303. [Google Scholar] [CrossRef] [PubMed]
  46. Scott, W.R.P.; Hünenberger, P.H.; Tironi, I.G.; Mark, A.E.; Billeter, S.R.; Fennen, J.; Torda, A.E.; Huber, T.; Krüger, P.; Van Gunsteren, W.F. The GROMOS Biomolecular Simulation Program Package. J. Phys. Chem. A 1999, 103, 3596–3607. [Google Scholar] [CrossRef]
  47. Hess, B.; Bekker, H.; Berendsen, H.J.C.; Fraaije, J.G.E.M. LINCS: A Linear Constraint Solver for Molecular Simulations. J. Comput. Chem. 1997, 18, 1463–1472. [Google Scholar] [CrossRef]
  48. Van Der Spoel, D.; Lindahl, E.; Hess, B.; Groenhof, G.; Mark, A.E.; Berendsen, H.J.C. GROMACS: Fast, Flexible, and Free. J. Comput. Chem. 2005, 26, 1701–1718. [Google Scholar] [CrossRef] [PubMed]
Figure 1. Generation of a high-quality model of canineβ1subunit extracellular domain. (a) The silhouette of the complete pig Na+, K+-ATPase structure (PDB ID = 3WGU). The β1 subunit structure is emphasized in green (cartoon model). (b) Structural alignment between the pig (green) and the canine (blue) β1 subunit extracellular domain, named EDβ1. Our model starts from threonine 60 where the single α-helix of TM domain of β1 the ends.
Ijms 20 04538 g001
Figure 2. Molecular dynamics simulations of EDβ1. (a) RMSD (Root Mean Square Deviation) plot of Cα computed during 50ns for EDβ1. (b) RMSF (Root Mean Square Fluctuation) plot of EDβ1. Besides C and N terminal ends, segments with the highest fluctuation correspond to residues R136–E141 and I163–G171, respectively. Black arrows indicate the β-sheet secondary structure. (c) Ribbon representation of EDβ1 before the simulation (native structure, blue). The structure suffers important RMS fluctuation in two loops (red ovals) corresponding to those highlighted in Figure 2b. (d) Conformers of EDβ1 at the beginning (10 ns conformer, orange), middle (30 ns conformer, green) and end of the simulation (50 ns conformer, cyan).
Ijms 20 04538 g002
Figure 3. Docking of EDβ1 and description of the interface. (a) Docking results for the top six largest clusters. (b) Models for each of the selected four dimers. One EDβ1 is depicted in surface representation (gray) and the docked EDβ1 in cartoon representation (blue). Black arrows identify amino acid residues within the same segments (magenta for Lys221–Tyr229 and green for Leu196–Tyr207). (c) The interface of model A. The two main segments forming the interface are marked in the β1 subunit sequence keeping the same color code as in (b). Interface residues highlighted in sticks representation. Light blue residues are those that appear at the interface but are non-continuous in sequence. (d) RMSF of model A during 50 ns of Molecular Dynamics simulations.
Ijms 20 04538 g003
Figure 4. Stable expression of canine YFP-β1 subunit mutants in CHO fibroblasts. (a) Scheme describing the location of the mutated sites. Three consecutive residues were mutated in each case. Images shown correspond to YFP fluorescence from clones expressing each of the mutants in a stable manner. (b) Identification of YFP-β1 fusion proteins by western blot: A band of 110 kDa is detected in lysates from cells stably expressing either YFP-β1 WT (lane 1) or YFP-β1 M1-M4 (lanes 2 to 5) or YFP- β2 subunit, with an anti-α subunit antibody (upper panel). In the second panel, the antibody we have regularly used for detection of the canine β1 subunit recognizes a band of 75 kDa in cell lysates from YFP-β1 WT (lane b) and M1 (lane 2), and a band of 50 kDa in a lysate from MDCK cells expressing the transfected YFP-β2 subunit (lane 6), corresponding to endogenous canine β1 subunit. That antibody does not recognize the β1 mutants M2, M3, and M4 (Lanes 3–5). A 75 kDa band is detected with an anti-GFP antibody (third panel) in all lanes. Anti-actin has been used as an internal control (lower panel).
Ijms 20 04538 g004
Figure 5. Fibroblasts expressing mutants YFP-β1 M2 and M3 show lower adhesiveness. (a) Representative snapshots of cells submitted to a Dispase assay. (b) Distribution Graph of fragments larger than 5000 μm2. Horizontal bars represent median values, (n = 4) *, significant difference p < 0.05; **, significant difference p < 0.01 and ns = non-significant, non-parametric Mann-Whitney’s test.
Ijms 20 04538 g005
Figure 6. Mutants M2, M3, and M4 show decreased in vitro interaction with an immobilized His6-tagged β1 subunit. (a) Upper panel: an anti-β1 subunit antibody detects a ~50 KDa band in a lysate from cells stably expressing the Na+,K+–ATPase β1 subunit with a His6 tag (β1His6, lane 1). The same antibody recognizes a ~75 KDa band in a cell lysate from fibroblasts stably expressing the fusion protein YFP-β1 WT. After immobilizing the bait, β1His6 protein as described in the Methods, total cell lysates from each of the following cell lines were loaded as prey proteins: non-transfected CHO WT cells (negative control) and CHO cells expressing YFP β1 WT (positive control) or mutated YFP β1 M1–M4. Eluates from each of the six protein-protein interactions were analyzed by western blot and detected with the same anti- β1 subunit antibody as in Figure 5 (lanes 4 to 9). Lane 3 was intentionally left empty. A positive pull-down pattern corresponds to the mixture of both the immobilized and prey proteins (lane 5). In a negative pull-down only the immobilized protein was detected (lane 4). (b) Densitometric quantification of the pull-down results in A. The signal obtained by anti-GFP antibody in each of the eluted proteins was normalized with the signal of YFP β1 WT and depicted as a comparative bar graph. Error bars SD ± (n = 3) *, significant difference p < 0.05; ***, significant difference p < 0.0005 and ns = non-significant, unpaired Student’s t-test with Welch correction.
Ijms 20 04538 g006

