Article

Avian Expression Patterns and Genomic Mapping Implicate Leptin in Digestion and TNF in Immunity, Suggesting That Their Interacting Adipokine Role Has Been Acquired Only in Mammals

1
Department of Animal Science, Agricultural Research Organization, Volcani Center, P.O. Box 15159, Rishon LeTsiyon 7528809, Israel
2
Department of Developmental Biology, Faculty of Science, Charles University, 12843 Prague, Czech Republic
3
Department of Biology, Faculty of Science, McMaster University, Hamilton, ON L8S4K1, Canada
4
GenPhySE, Université de Toulouse, INRA, ENVT, 31326 Castanet Tolosan, France
5
Institute of Molecular Genetics of the Czech Academy of Sciences, 14220 Prague, Czech Republic
6
Department of Medical Biochemistry and Microbiology, Uppsala University, SE-75123 Uppsala, Sweden
7
Department of Animal Breeding and Genetics, Swedish University of Agricultural Sciences, SE-75007 Uppsala, Sweden
8
Department of Veterinary Integrative Biosciences, College of Veterinary Medicine and Biomedical Sciences, Texas A&M University, College Station, TX 77843-4458, USA
*
Author to whom correspondence should be addressed.
Int. J. Mol. Sci. 2019, 20(18), 4489; https://doi.org/10.3390/ijms20184489
Submission received: 31 July 2019 / Revised: 29 August 2019 / Accepted: 6 September 2019 / Published: 11 September 2019

Abstract

:
In mammals, leptin and tumor-necrosis factor (TNF) are prominent interacting adipokines mediating appetite control and insulin sensitivity. While TNF pleiotropically functions in immune defense and cell survival, leptin is largely confined to signaling energy stores in adipocytes. Knowledge about the function of avian leptin and TNF is limited and they are absent or lowly expressed in adipose, respectively. Employing radiation-hybrid mapping and FISH-TSA, we mapped TNF and its syntenic genes to chicken chromosome 16 within the major histocompatibility complex (MHC) region. This mapping position suggests that avian TNF has a role in regulating immune response. To test its possible interaction with leptin within the immune system and beyond, we compared the transcription patterns of TNF, leptin and their cognate receptors obtained by meta-analysis of GenBank RNA-seq data. While expression of leptin and its receptor (LEPR) were detected in the brain and digestive tract, TNF and its receptor mRNAs were primarily found in viral-infected and LPS-treated leukocytes. We confirmed leptin expression in the duodenum by immunohistochemistry staining. Altogether, we suggest that whereas leptin and TNF interact as adipokines in mammals, in birds, they have distinct roles. Thus, the interaction between leptin and TNF may be unique to mammals.

1. Introduction

In mammals, leptin is a key adipokine that works in concert with other adipokines such as TNF (also known as TNFα) to regulate energy homeostasis [1,2]. TNF has a critical role in obesity-induced insulin resistance [3], in addition to its other functions [4]. The amount of leptin produced by the adipose tissue signals the amount of fat stores to the hypothalamus and peripheral tissues [1,2]. With respect to the immune response, various studies have shown that leptin modulates innate and adaptive immunity [5]. Leptin stimulates neutrophil chemotaxis and promotes macrophage phagocytosis and production of pro-inflammatory cytokines including TNF [6,7]. It is thought that leptin’s primary role in the immune system is adjusting the intensity of the immune response to the availability of energy stores [6]. TNF has a broader function in the immune system, which includes immune cell development and functional regulation. This is in addition to TNF’s general role in the control of survival, proliferation, differentiation and death of cells [8]. Taken together, leptin and TNF work in concert and stimulate each other’s expression both in the adipose tissue and in immune cells [9,10].
The identification of both TNF and leptin in birds has been hampered for decades, despite intensive efforts to find them [11,12] and they were suggested to be missing prior to recent discoveries [13,14]. For both TNF and leptin, erroneous sequences/annotations submitted to GenBank (accession nos. HQ739087 and AF012727, respectively) led to erroneous publications. This was much more pronounced for leptin (as summarized by Seroussi et al., [15]), but also true for TNF as denoted by Elleder and Kaspers [16], also resulting in misleading publications (see for example Rozenboim et al. [17]).
The motivation to keep searching for avian TNF and leptin was encouraged by the finding of their cognate receptors, including the chicken orthologs of the two mammalian TNF receptor genes (TNFR1 and 2 [18,19], respectively) and the chicken leptin receptor (LEPR also known as OBR; [20,21,22]). Both the TNF and leptin receptors belong to the family of the cytokine type I receptors and were found to share functional motifs and consensus sequences with their mammalian orthologs. These include their corresponding ligand-binding domains, death domains of TNFR1 [23], and other consensus sequences implicated in their respective signal transduction pathways [18,19,20,21].
TNF and leptin were recently identified in several avian species including chickens [13,24,25,26,27,28]. In retrospect, it appears that the difficulty to identify these genes was due to the following characteristics: extreme GC-content (~70%), their location in genomic regions with low complexity repetitive and palindromic sequence elements, relatively low sequence conservation and low levels of expression. So far, characterization of the avian TNF and leptin has surprisingly revealed a very low or absent mRNA expression in adipose tissue as characterized under a variety of physiological conditions related to obesity, body growth, reproduction efficiency and feeding regimen [29].
Two similar versions of genuine chicken TNF and leptin genes were published. The first publication of both genes [13,15] lacked the 5′ regions, which were identified soon after [14,28]. For the TNF, an additional difference between the two versions is the length of a glycine stretch close the C’-terminal end, which is hard to resolve due to the low coverage with RNA-seq data from this GC-rich part of the gene. These difficult regions were characterized by optimized PCR amplification methods and Sanger sequencing [16]. The 5′ extended sequence of the original TNF is of high importance since it includes its predicted transmembrane domain of TNF. The 5′ extended sequence of leptin includes the expected signal peptide. However, this sequence is longer than that of orthologous leptins.
The human TNF gene maps to chromosome 6p21.3, contains four exons and spans about 3 Kilobases. The last exon shares similarity with lymphotoxin alpha (LTA, previously known also as TNF-β) [30]. These genes are linked to the major histocompatibility complex, class I, B (HLA-B) locus, analogous to their murine chromosomal position between the complement (class III) region and H-2D [31]. Except the ribosomal RNA genes cluster (also known as the nucleolus organizer region, NOR), which map near the centromere of chicken chromosome 16 (GGA16), nearly all protein coding genes presently mapped have been implicated in the immune responses [32,33]. These include the polymorphic major histocompatibility complex-B (MHC-B) and MHC-Y, both consisting of gene orthologs of the mammalian class I and II MHC genes [34,35]. In mammals, TNF maps within the MHC locus between lymphotoxin α and β genes. These three genes share some redundant activities, in addition to their unique functions [36]. Lymphotoxin α and β have not been found in chickens [11,12].
We have previously shown that the chicken TNF is expressed primarily in embryonic and adult spleens, as well as in monocytes and macrophages [13,14]. In these lymphocytes, TNF is induced by lipopolysaccharide (LPS) as a model for gram negative infections [14]. The avian leptin mRNA was primarily reported in brain tissues and, in some cases, also in gonads and adrenal regions [15,25,27,28], as well as a sporadic high expression in the liver [15]. Unlike the expression profile of chicken leptin, the chicken TNF profile of mRNA expression resembles that in mammals, except for low abundance in the adipose tissue [15]. Chromosomal mapping of TNF onto the chicken genome is crucial proof for its correct identification. This proof is especially important due to the difference between the avian and mammalian expression in the adipose tissue; the relatively low sequence similarity between chicken TNF and its mammalian and reptilian orthologs (~34% amino acid identity to human and ~39% amino acid identity to American alligator); and the erroneous annotation of chicken TNF sequence in GenBank. Thus, the primary aims of this work were to map and compare the chromosomal position of avian TNF with that of the mammalian TNF and to test if its mRNA expression profiling supports its possible interaction with leptin within the immune system and beyond.

2. Results

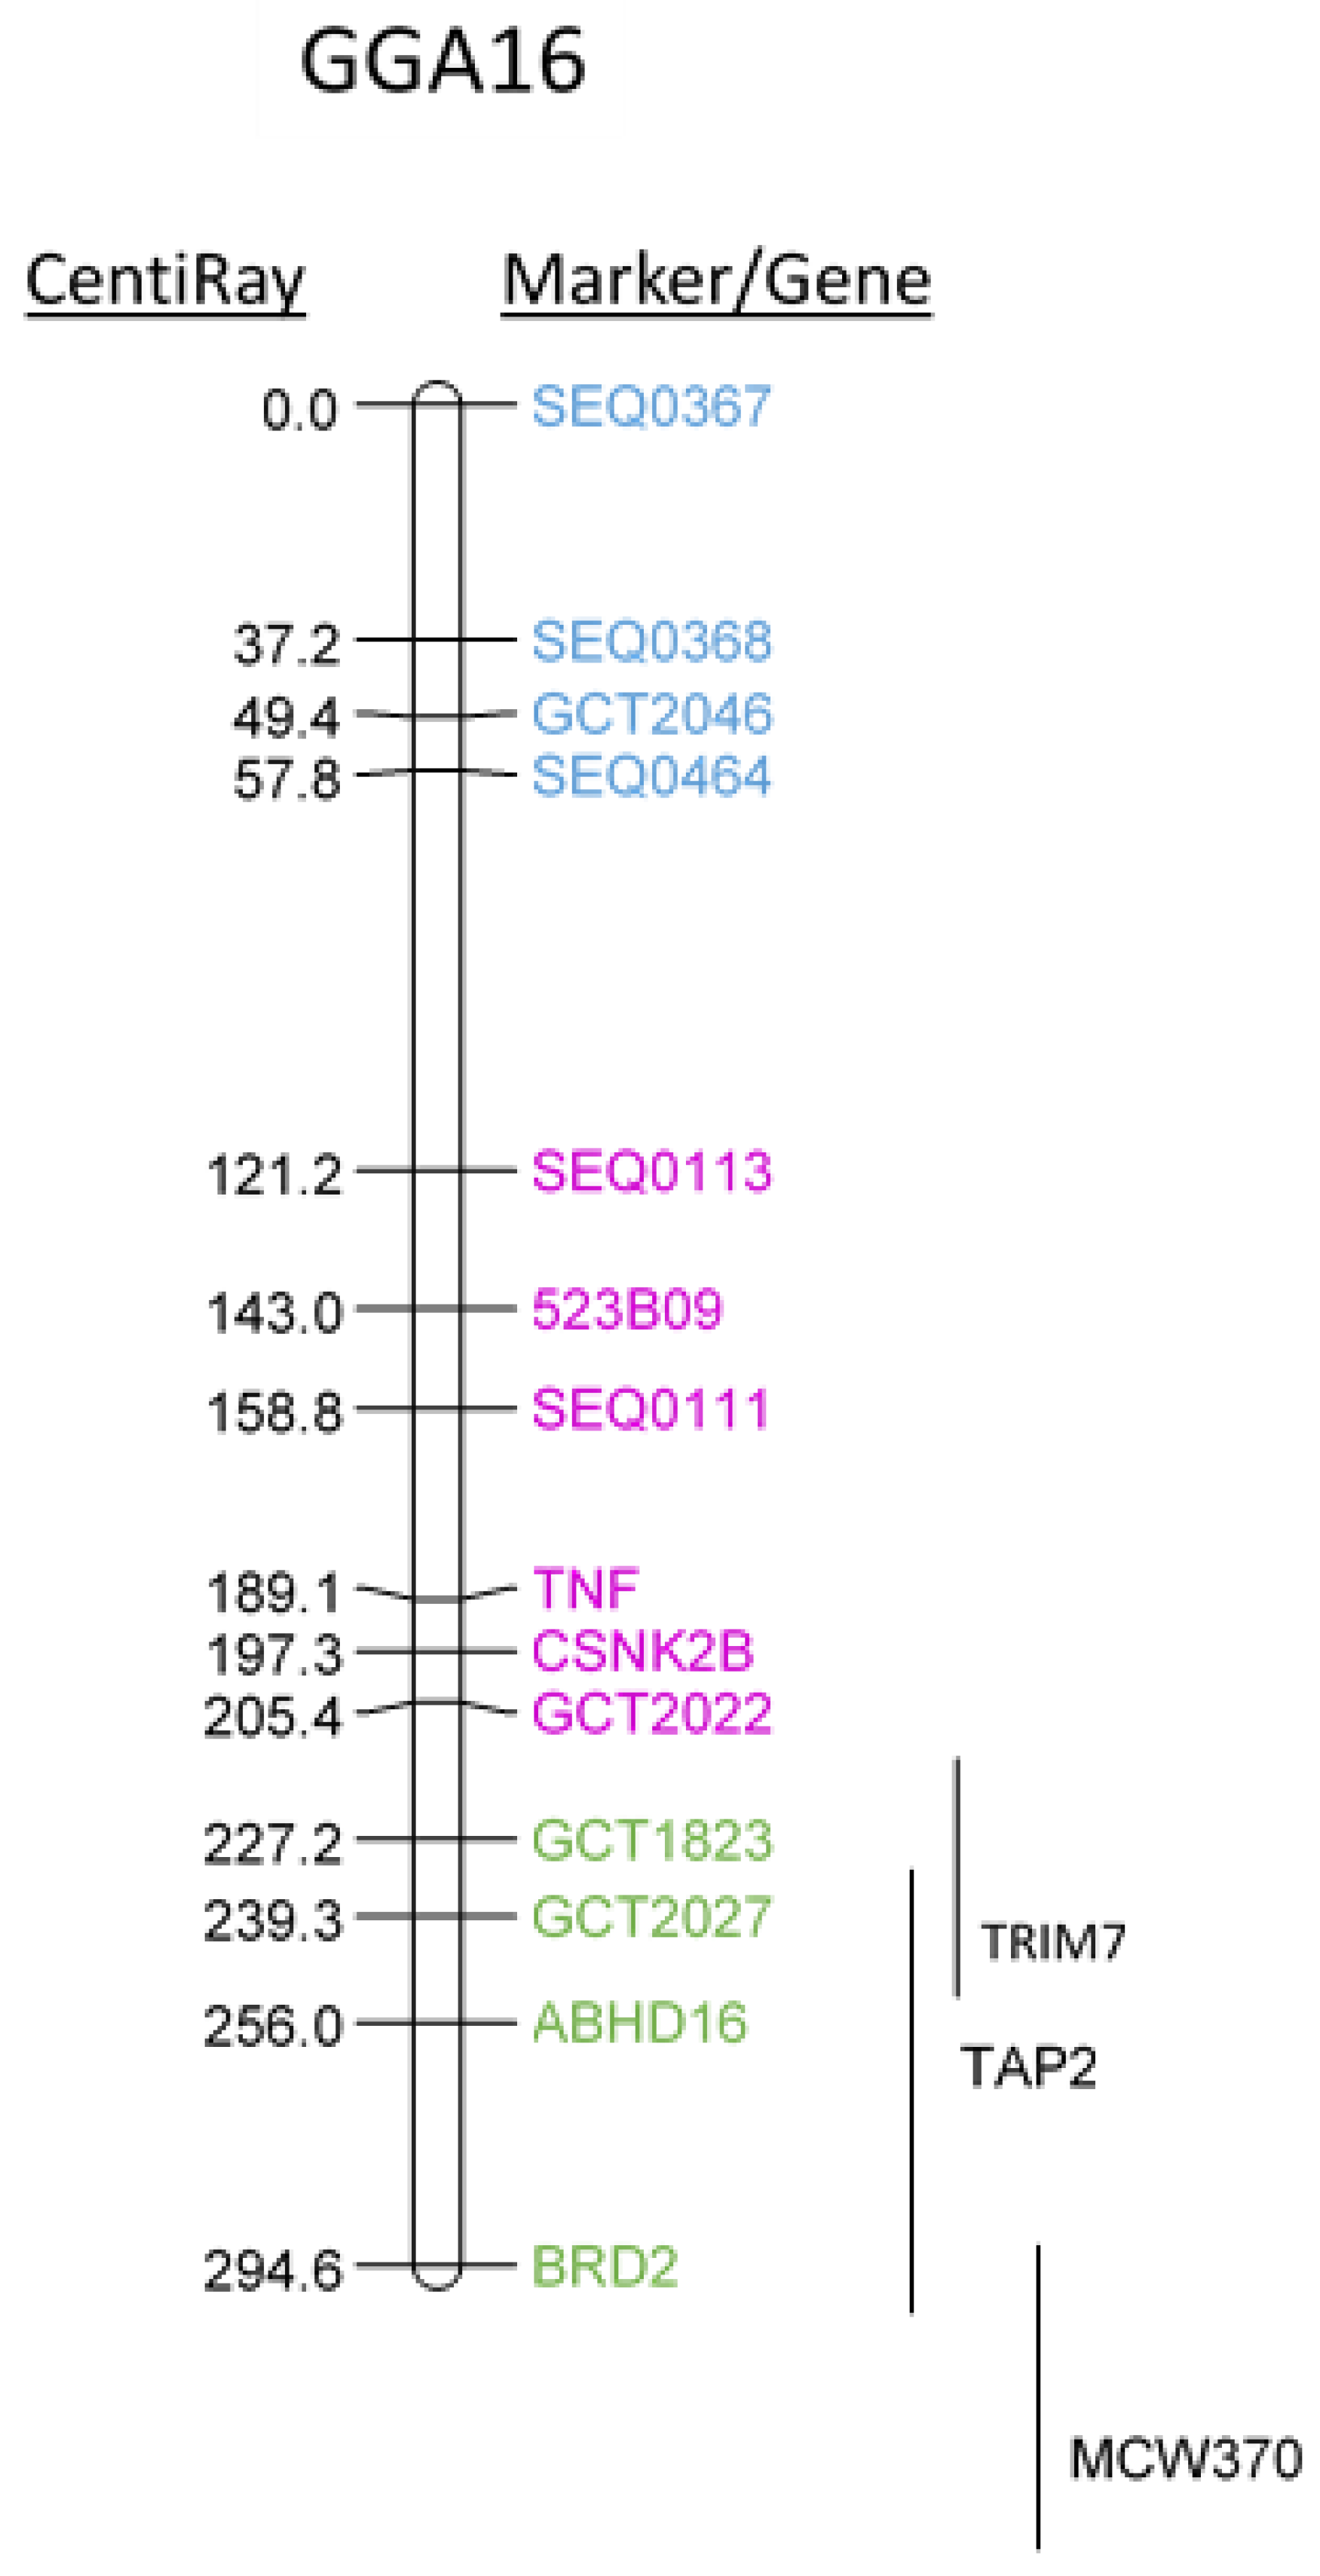
2.1. Mapping Chicken TNF onto Chicken GGA16 Using Radiation-Hybrid (RH) Panel

As a first indication for the location of chicken TNF within the chicken genome, we employed the well-established RH panel in Wg3hCl2 cells, prepared by fusing chicken embryonic diploid fibroblasts with hypoxanthine-guanine phosphoribosyl transferase (HPRT)-deficient hamster cells [37]. The analysis shown in Figure 1 located the chicken TNF close to CSNK2B, between SEQ0111 and GCT2022 markers of the MHC cluster Y on the q arm of microchromosome GGA16 [33]. This location was confirmed also by using PCR primers for TRIM7.2, BRD2, TAP2 and ABHD16A, which are located within the MHC cluster on GGA16 in the current genome assembly (Table 1). The CSNK2B and ABHD16A genes are mapped onto a TNF genomic contig, also in crow (Corvus cornix) [14].

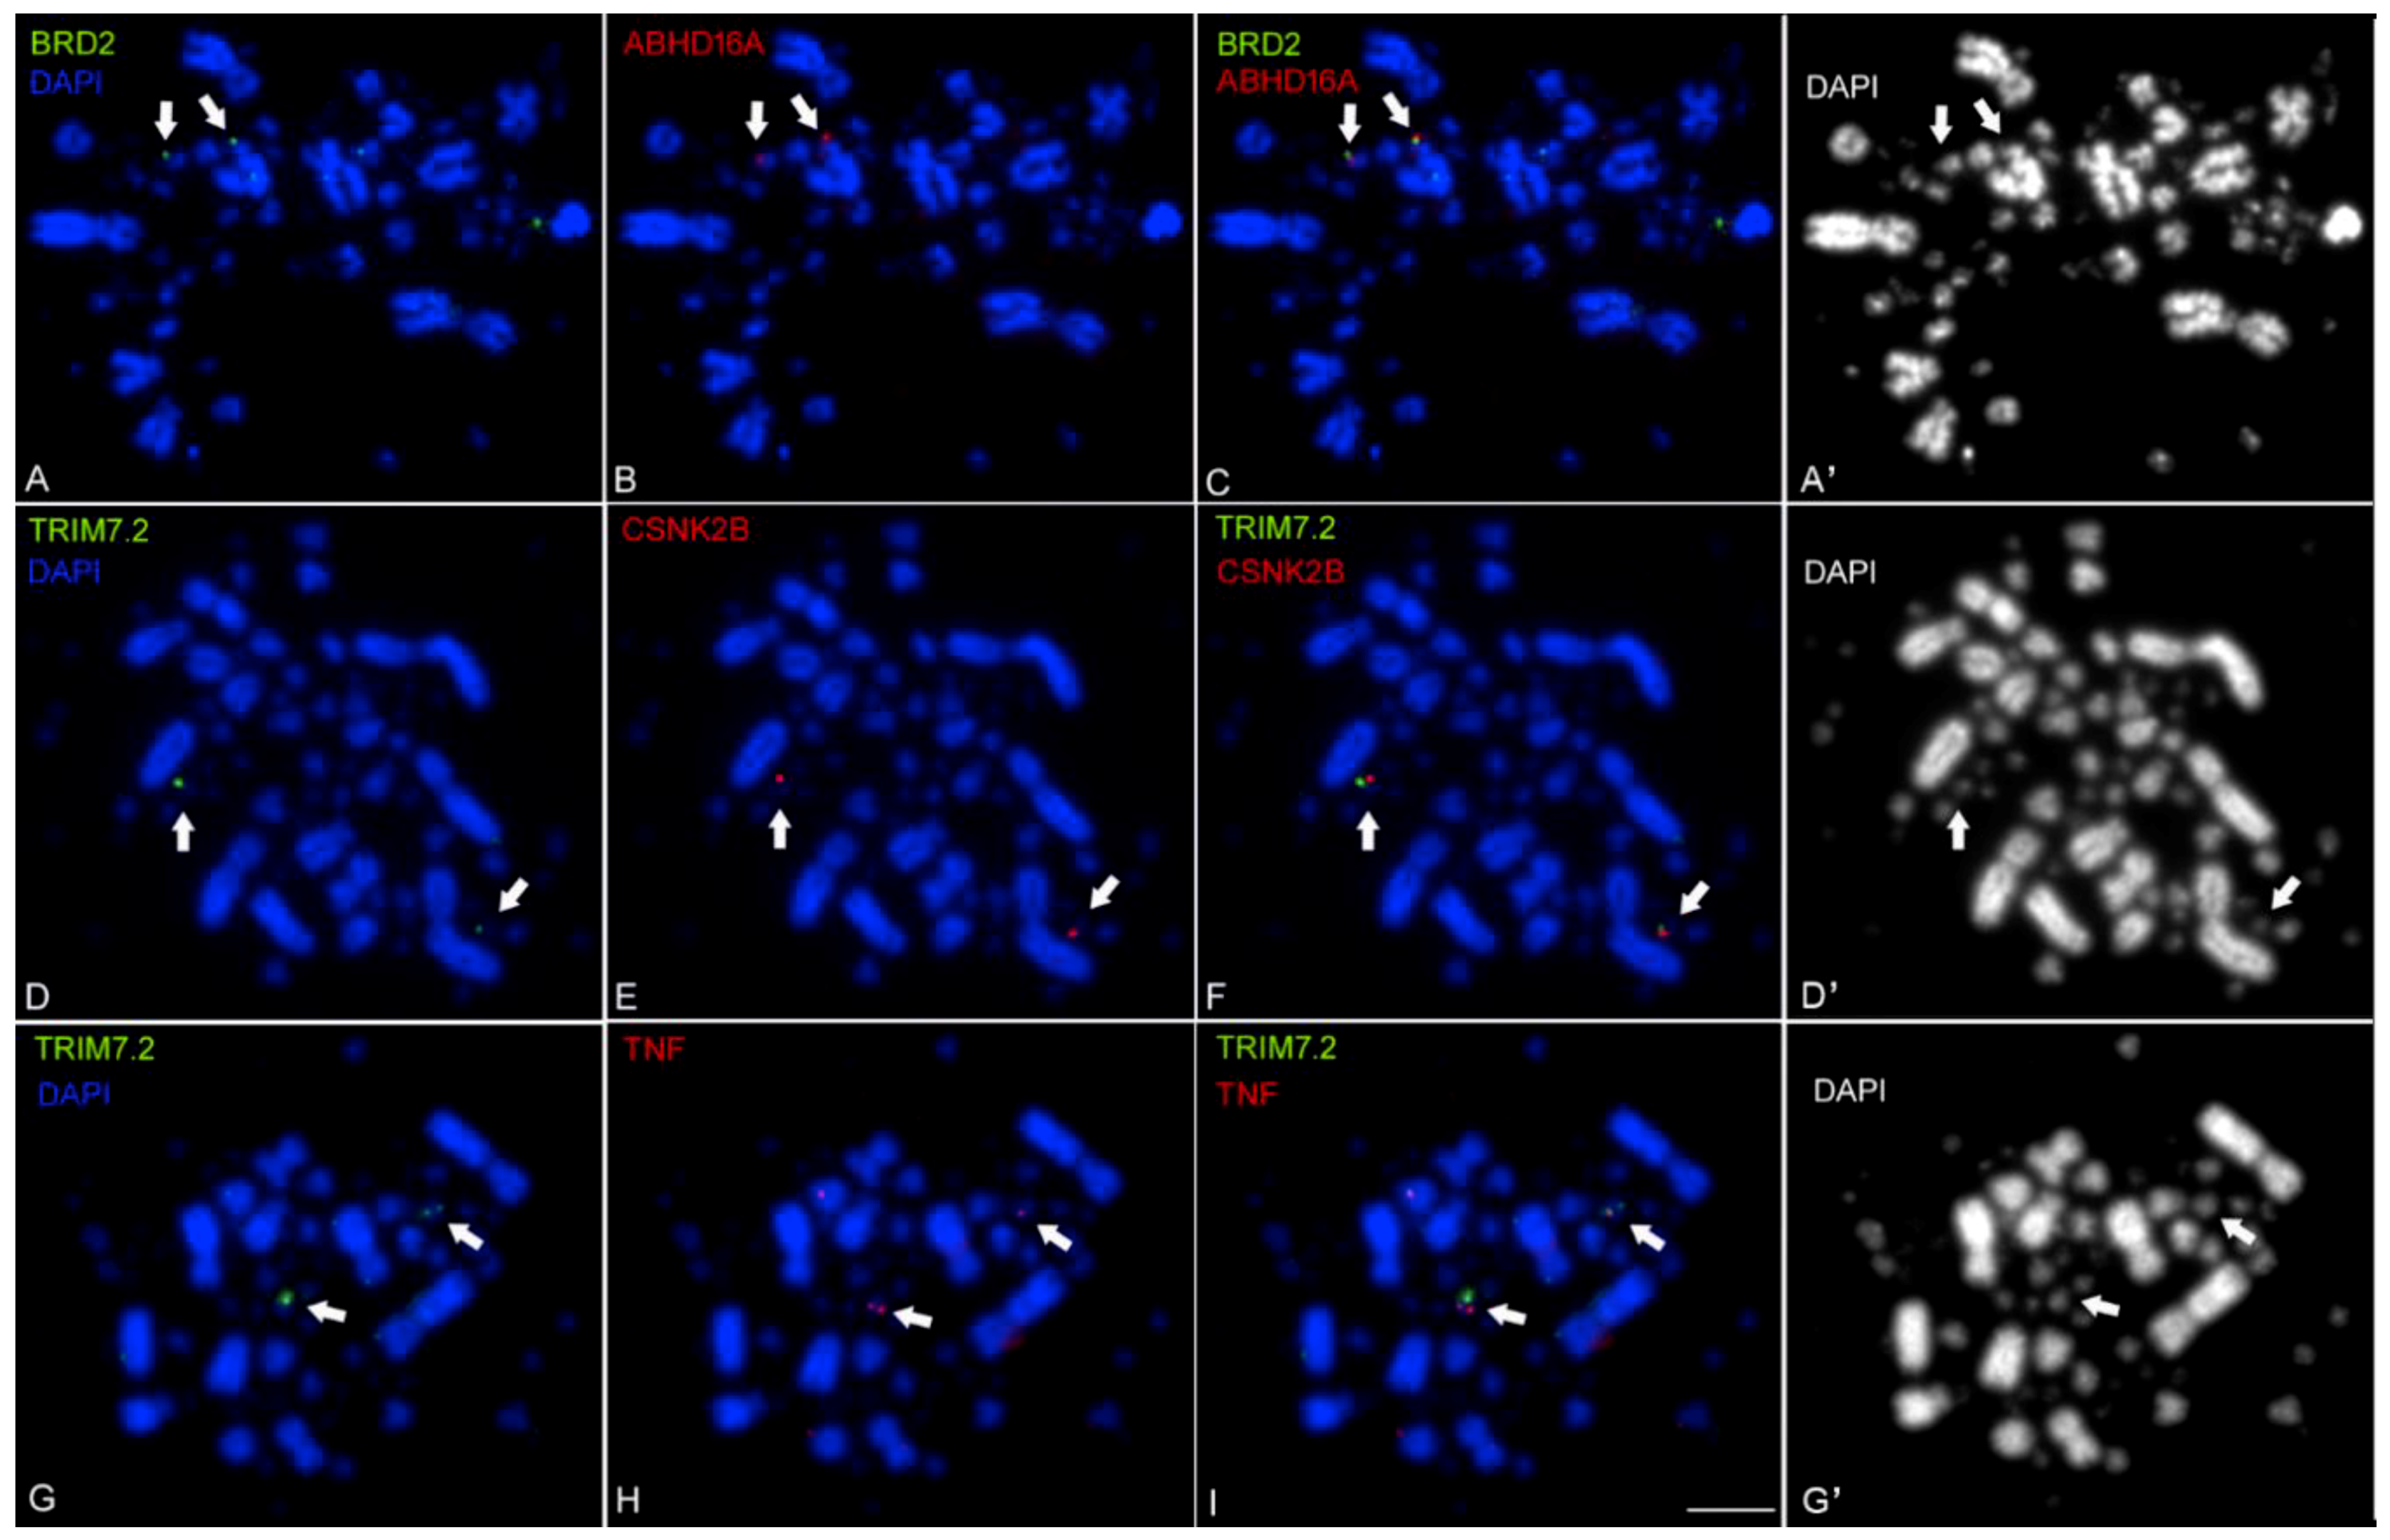
2.2. Mapping the Chicken TNF and its Syntenic Genes Using Fluorescent in Situ Hybridization with Tyramide Signal Amplification (FISH-TSA)

To further confirm the localization of TNF on chicken GGA16, we used FISH-TSA on metaphase spreads of mitotic chromosomes. cDNA probes were prepared for TNF and for BRD2, TRIM7.2, CSNK2B and ABHD16A genes. Using dual-color labeling technique, the analysis showed that the three chicken genes, TNF, ABHD16A and CSNK2B were co-localized with either BRD2 or TRIM7.2 on a single microchromosome (Figure 2), thus, confirming the result of the RH mapping.
This mapping characterization summarized in Table 1 suggested the presence in chickens of an inflammatory region (MHC class III, between MHC class I and II), which is a homologous region between teleost fish and mammals [38]. In chicken, it is represented by the complement gene (C4). C4 is closely associated with TRIM 7.2, BRD2 and TAP2 in the current GGA16 assembly.

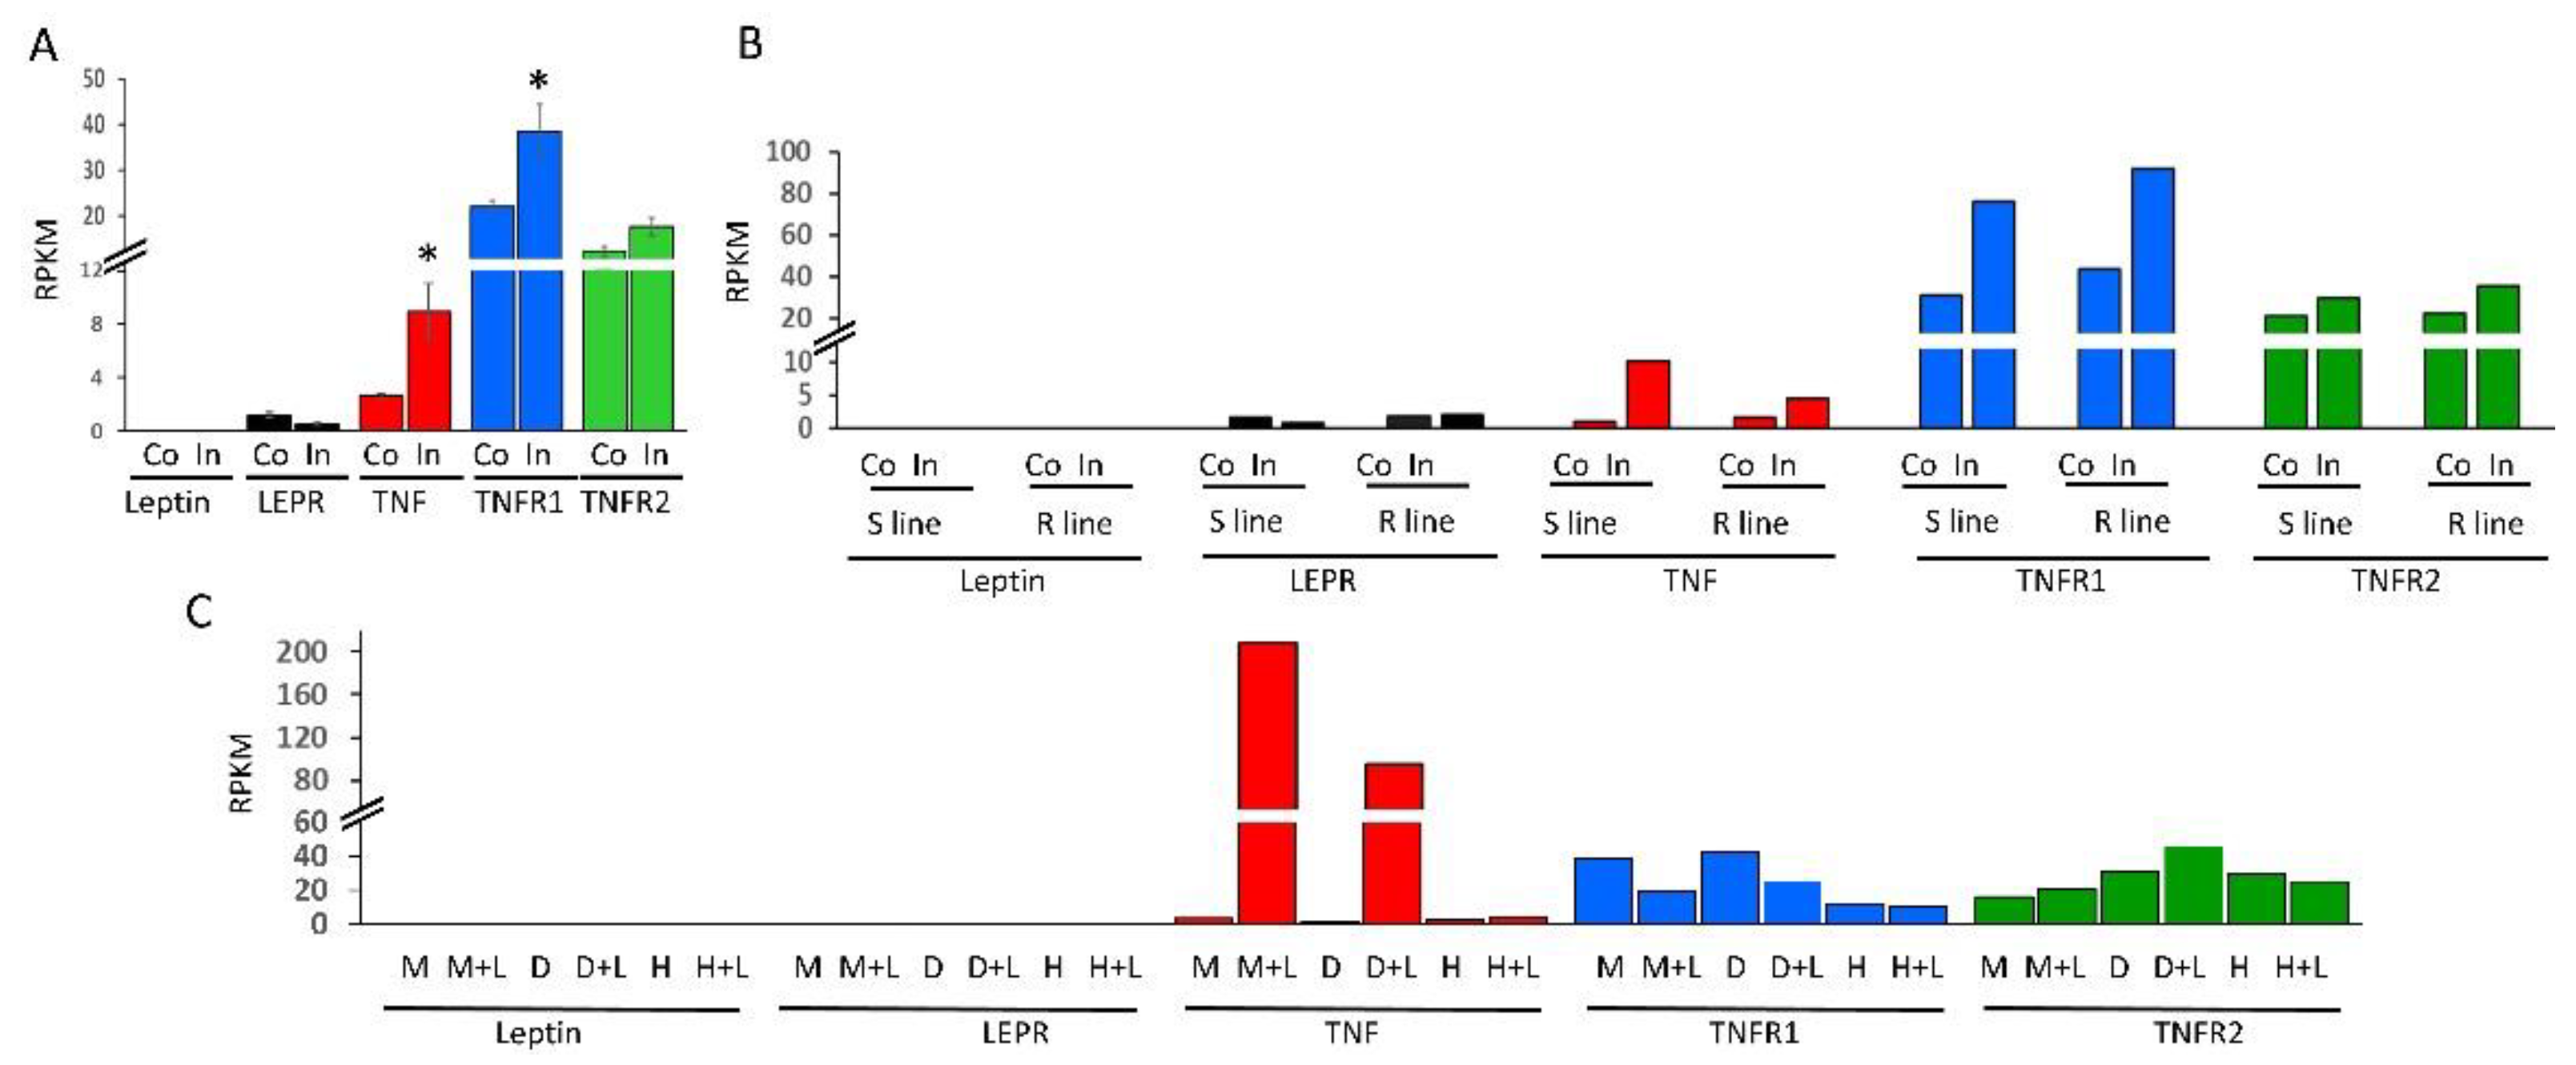
2.3. Expression Profiling of mRNAs of TNF, Leptin and Their Cognate Receptors in Immune Cells

In mammals, TNF and leptin interact with each other to control immune functions and endocrine activities of the adipose tissue [39,40,41,42]. To test if a similar interaction exists also in chicken, we compared the mRNA expression patterns of leptin, TNF and their cognate receptors in tissues and immune cell lines by meta-analyzing the available RNA-seq data in the Sequence Read Archive (SRA) in NCBI. Sequence reads were counted using the SRA BLAST tool and sequences of chicken leptin, LEPR, TNF, TNFR1 and TNFR2 as baits (Figure 3).
Analysis of RNA-seq dataset from spleens of chickens four days after intranasal infection with bursal disease virus (IBDV) showed a significant induction of TNF and TNFR1 (p ≤ 0.05); no induction of TNFR2; and no or low expression of leptin and LEPR (<1 RPKM), respectively (Figure 3A). Another analysis of spleens from white-leghorn strains is shown in Figure 3B. These strains were bidirectionally selected for high susceptibly and resistance to infection by Marek’s disease virus (MDV) [43,44]. Spleens of both the resistant and sensitive lines did not express leptin mRNA and lowly expressed LEPR mRNA, regardless of infection by MDV, while mRNAs of TNF and TNFR1 were induced in the spleens of both sensitive and resistant lines (TNF, 10- and 3-fold; TNFR1, 2- and 1.5-fold, respectively). Since the data was obtained from pools of RNA samples from three birds of each treated group [43], statistical significance was not estimated. Nevertheless, analyzing this dataset suggested that leptin and LEPR are neither important for immune response nor to the degree of sensitivity of chicken spleens to viral infection. On the other hand, these results supported a role for TNF and TNFR1 mRNAs in the infected spleens. Yet, an additional BLASTN search was performed on a dataset from primary cell lines of macrophages and dendritic cells derived from bone marrow and from heterophil cells isolated from blood (Figure 3C). The cell cultures were challenged with LPS for 24 h. TNF mRNA was induced 59, 60 and 2 folds in the cultured macrophages, dendritic and heterophil cells, respectively. TNFR1 and TNFR2 were slightly affected at the mRNA levels. Whereas in the immune cell lines, like in spleens, leptin and LEPR were undetectable and lowly expressed (below 0.4 RPKM in all of the samples), respectively. For chicken TNF, this analysis confirmed previous indications suggesting TNF implication in the immune response [13,14]. For the chicken leptin, this search suggested that in contrast to the prominent role of mammalian leptins in regulation of both innate and adaptive immune responses [42], the chicken leptin does not modulate an immune response.

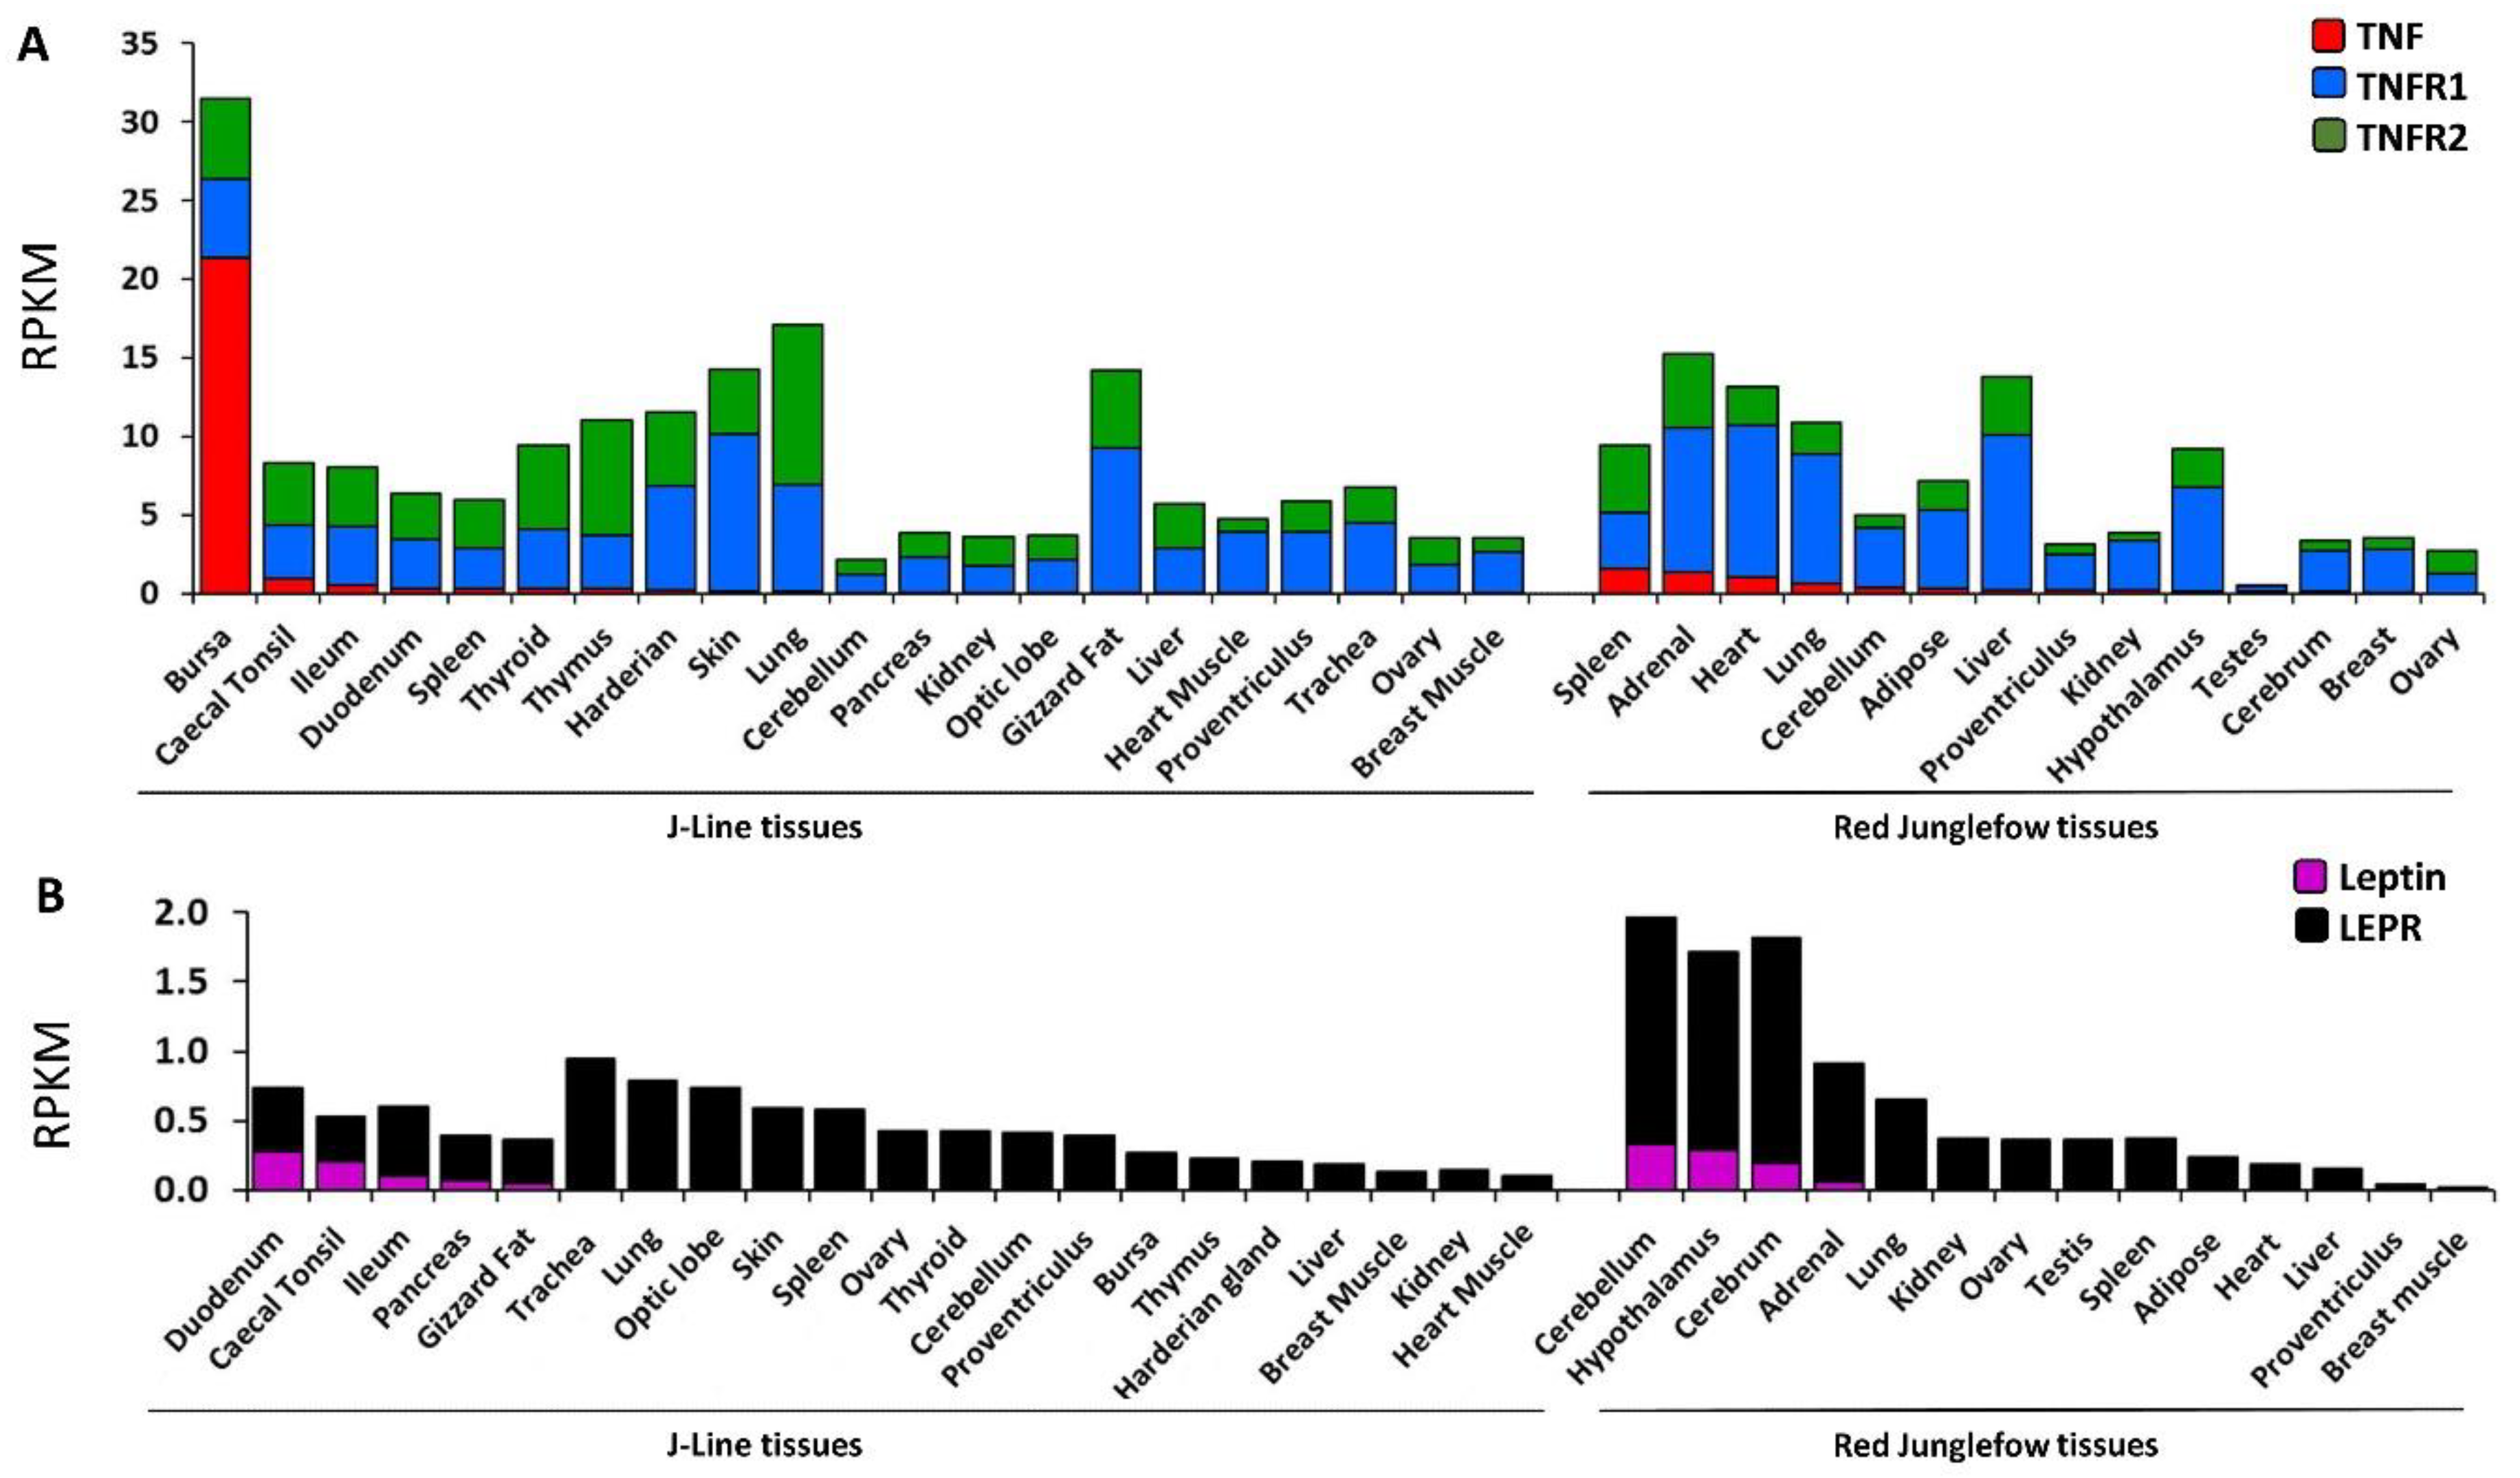
2.4. Expression Profiling of Leptin, TNF and Their Cognate Receptors in Variety of Chicken Tissues

We extended our previous profiling of leptin, TNF and their cognate receptor expression patterns [13,15,28], using a meta-analysis of RNA-seq studies available in the SRA (Figure 4). Among the various tissues of adult J-Line and red junglefowl chickens, TNF was prominently expressed only in the bursa (above 20 RPKM), and it was also detected at a low level (<1 RPKM) in the spleen, adrenal, heart and lung. Similarly-low TNF mRNA levels were also observed in caecal tonsil, ileum and duodenum, which likely represent the high activity of these tissues in innate immune response through recruitment of immune cells [46,47]. Interestingly, the TNF receptors, TNFR 1 and 2 seem to be ubiquitously expressed. This pattern confirmed the primary role of TNF in the immune system and suggested that, like in mammals, avian TNF affects survival of most cell types.
In addition to the known expression of the chicken leptin and LEPR in brain tissues of red junglefowl (cerebellum, hypothalamus and cerebrum; [15,28]), expression of these genes along the digestive system (duodenum, caecal tonsil, ileum, and pancreas) is reported in this study for the first time in chicken. This finding was based on querying the same datasets using the chicken leptin and LEPR sequences as baits. In J-line chickens, expression of leptin mRNA was observed in duodenum and caecal tonsil at rather low levels (0.28 and 0.20 RPKM, respectively) and at lower levels also in the ileum and pancreas (0.1 and 0.07 RPKM, respectively). This expression pattern suggests a role for chicken leptin in the digestive tract.
In mammals, expression of leptin in the stomach is well known. Therefore, our finding suggested that this site of leptin expression represents an important role.

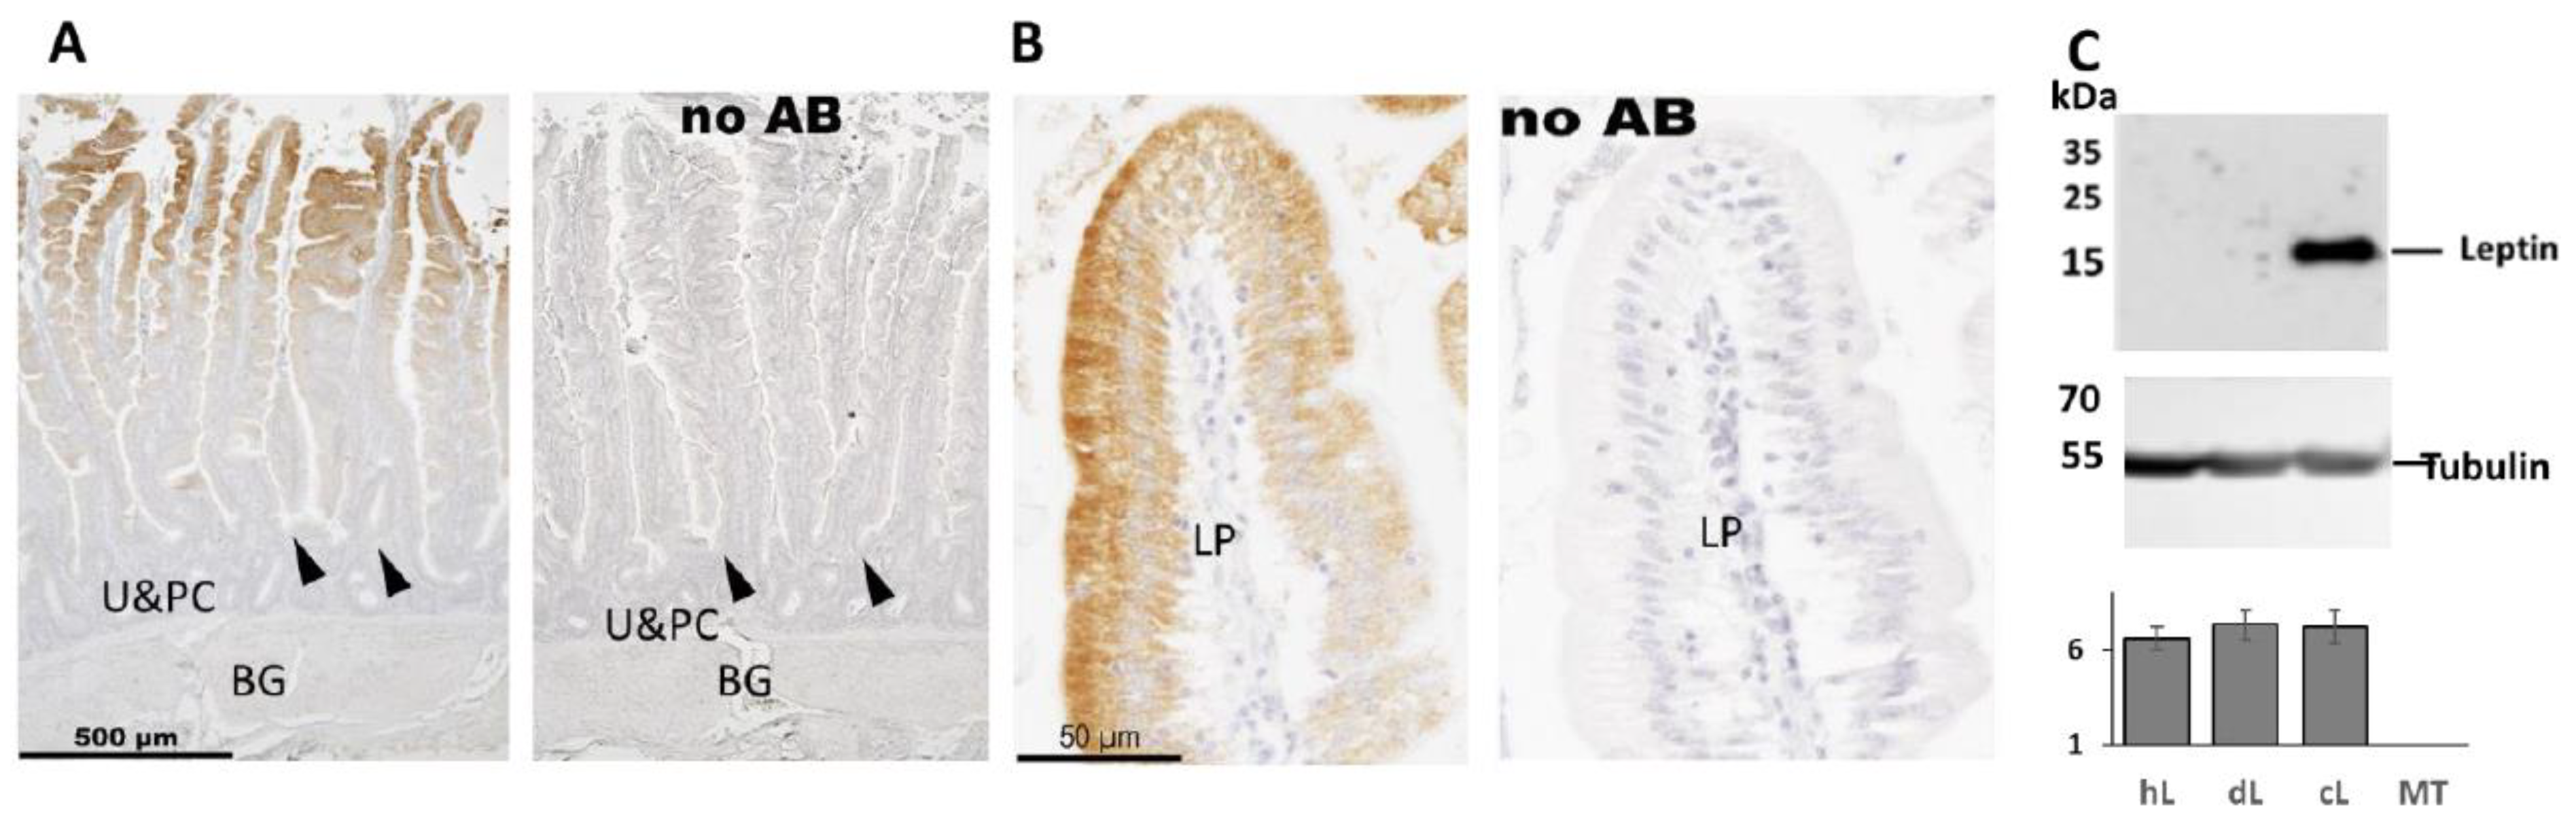
2.5. Immunohistochemistry Analysis of Leptin in Chicken Duodenum

The surprising finding of chicken leptin mRNA in tissues belonging to the digestive tissue indicates a possible role of leptin in chickens. To estimate if, like in mammals [48,49,50], chicken leptin is expressed in the gastric mucosa, we characterized duodenal leptin expression in mature female chickens by immunohistochemistry analysis (IHC) using chicken leptin-specific antibodies (Figure 5). Leptin was observed in the mucosa facing the lumen in both enterocytes and goblet cells fading gradually towards the crypts, where cells are less differentiated. Leptin was undetectable in cells below the crypts including Paneth cells, which represent the main epithelial cell type that secrete antimicrobial peptides and mucosal production of IgA. Paneth cells are the only cells in the small intestine of mammals normally expressing TNF mRNA [46]. The specificity of the antibody was demonstrated by western blotting (Figure 5C) applied with conditioned media (CM) of cells exogenously expressing human, duck and chicken leptins [15]. While leptin activity was similar in all three samples (bottom panel), only CM of chicken leptin-producing cells showed a signal of the expected size specific to leptin (top panel).

3. Discussion

We have mapped the chicken TNF gene together with additional four syntenic genes in mammals (BRD2, TAP2, CSNK2B and ABHD16A) to chicken chromosome 16q, within the MHC locus and demonstrated that these genes form a syntenic block also in chickens consistent with their co-localization in mammals and several other vertebrates [51]. This mapping position may define an MHC Class III inflammatory region in the chicken genome, which is a region of inflammation-related genes within the MHC cluster. The inflammatory region found to be similar in fish and mammals, but was represented in chicken and quail genomes only by the C4 gene [38].
The use of two different approaches for the mapping: FISH and RH-mapping strongly confirmed the genomic allocation of TNF. Interestingly, this position seems to be part of the GC-rich region observed within the GGA16 chromosome by a low DAPI staining [52]. Thus, the high GC-rich content (~70%) of the chicken TNF gene is likely to be shared by its neighboring genes and their intragenic sequences. Therefore, it is possible that the two closest neighboring genes of TNF in other vertebrates (lymphotoxin A and B), missing in chickens, would also be found; as happened in similar scenarios e.g., the leptin and RBM28 genes in the centromeric GC-rich region of GGA1 [53].
Our meta-analysis of TNF, TNFR1 and TNFR2 mRNA expression in RNA-seq datasets in the SRA extended a previous study of TNF [13,14], indicating its implication in the immune response by showing that mRNAs of both TNF and TNFR1 are induced in spleen and in immune cells upon virus infection and LPS treatment. The comparative mRNA expression analysis of TNF and its receptors shown here also suggested that TNF in the spleen and in immune cells has paracrine/autocrine mode of action in addition to its well established endocrine action. Unlike TNFR2, TNFR1 has a death domain, for executing TNF’s cytotoxicity and has high affinity to both the soluble and membrane bound TNF [54]. Our finding that TNFR1 mRNA levels were more responsive to viral and LPS treatments than those of TNFR2 is compatible with TNFR1 functions. Strikingly, in the same datasets, leptin mRNA was absent in the spleen and in immune cells under all of the experimental conditions. LEPR mRNA was lowly expressed and did not respond to treatments or to selective breeding toward resistance or sensitivity to infection. Since the role of the mammalian leptin is to communicate energy status to the immune system [40], this observation fits previous indications that chicken leptin is not a circulating signal of energy availability [15,27,28,29].
Profiling TNFR1 and 2 mRNA expression in a variety of chicken tissues showed a wide range of expression of both receptors but with more abundant expression of TNFR1 in most of the tissues. This characterization suggested a further role of chicken TNF not only in the immune system, but also in general cell survival, which is among its classical roles in mammals [4]. Since in mammals TNFR2 is predominately expressed in cells of the immune system and endothelial cells [55], it is likely that in some of the chicken tissues low expression is contributed by endothelial and immune cells within the examined tissues.
The most surprising result in the current study was our finding of leptin and LEPR mRNA in the digestive system, opening a new frontier for chicken leptin research. In mammals, gastric leptin was discovered in 1998 by Bado et al. [48] and has been shown to be produced by the gastric chief cells in the stomach and by enterocytes and goblet cells in the duodenum [56]. The primary role of leptin in the digestive system is thought to be in gastric emptying and nutrient absorption activities [56,57]. In addition, gastric leptin also interacts with other gastric regulatory peptides such as ghrelin, cholecystokinin (CCK) and peptide transporter 1 (PepT1) [50] and affects CCK activation of vagus nerve afferents in the duodenum [58]. The possibility that gastric leptin serves as a short-term signal in the regulation of food intake, has also been suggested in mammals [57], complementing the long-term regulation of appetite by leptin secreted from the adipose tissue [2]. In mammals, expression of leptin in the stomach is well known. Therefore, our finding suggested that this site of leptin expression represents a role for leptin that is common among many species.
The immunostaining of leptin in the duodenum and the finding of its presence in mucosal cells (enterocytes and goblet cells), provided a critical proof that the low expression of leptin mRNA (0.3 RPKM) in J-line duodenum is significant. Our finding of leptin in the digestive system raised the possibility that chicken leptin may operate in short term regulation of appetite based on the digestive activity. This may take place either via the afferent vagus nerve or through the blood circulation or both. However, more work is needed to evaluate this possibility.

4. Materials and Methods

4.1. RH-Mapping

PCR amplifications were carried out for each marker (Table S1) in 15 μL solution containing 25 ng DNA from the RH panel [37], 0.4 μM of each primer, 0.25 units Taq polymerase (GoTaq, Promega Madison, WI, USA), 2 mM MgCl2, 0.2 mM dNTP, using the Applied Biosystems 2720 thermal cycler. The first 5 min denaturation step was followed by 35 cycles, of denaturation at 94 °C for 30 s, annealing at Tm (see Table S1) for 30 s and elongation at 72 °C for 30 s. Each marker was genotyped twice and a third genotyping was performed in case of discrepancy between the first two determinations. The RH map was built as previously described [59] using the Carthagene software [60] and drawn with MapChart 2.0 [61].

4.2. FISH-TSA Analysis

4.2.1. Chromosome Preparation and Cell Culture

Primary line of chicken CEF cells, were prepared from 10-day old pooled chick embryos (males and females) of an inbred White Leghorn strain [62] as previously described [63]. Cells were maintained at 37 °C and 5% CO2 in a mixture of two parts Dulbecco’s modified Eagle’s medium and one part F-12 medium, supplemented with 8% fetal calf serum, 2% chicken serum, and antibiotic-antimycotic solution (Sigma-Aldrich, St. Louis, MO, USA). Chromosome metaphase spreads obtained from the CEF cell culture (passage 5) were prepared according to Courtet et al. [64]. Cell suspension was spread onto a clean glass microscopic-slide one day before use for FISH-TSA and stored overnight at −20 °C.

4.2.2. cDNA Probe Preparation and Labelling

Total RNA was isolated from chicken DF-1 cells [65] using TRI reagent (Sigma-Aldrich) and converted to cDNA with the SMART RACE protocol (Clontech, Palo Alto, CA, USA). The probes for the chicken genes were prepared by PCR amplification from the cDNA using the primers listed in Table S2, (see also Sequence S1 and Figure S1 describing our genuine ABHD16A sequence) and conditions previously described [14]. The PCR products were separated by agarose electrophoresis and purified using the Qiaex II gel extraction kit (Qiagen, Valencia, CA, USA). The cDNA probes (1 µg each) were labeled by random primed method using the DecaLabel DNA Labeling Kit (Thermo Fisher Scientific, Waltham, MA, USA) according to manufacturer’s instructions.

4.2.3. FISH-TSA

Double color FISH-TSA protocol was adapted from Krylov et al. [66] with minor modifications described in Knytl et al. [67]. ABHD16A, CSNK2B, and TNF probes were labeled by Digoxigenin-11-dUTP (Roche, Mannheim, Germany) and hybridized to chromosomal DNA overnight at 37 °C. Signals were detected by anti-digoxigenin antibody conjugated to horseradish peroxidase (Anti-Digoxigenin-POD, Fab fragments, Roche), and amplified by tetramethylrhodamine (TMR) with TSA Plus Fluorescein and TMR System Kit (PerkinElmer, Inc., Waltham, MA, USA). BRD2 and TRIM7.2 probes labeled by Biotin-16-dUTP (Roche) were detected by streptavidin-POD, conjugate (Roche), and signal was amplified by fluorescein (TSA Plus Fluorescein and TMR System Kit, PerkinElmer Inc., Waltham, MA, USA). Hybridization mixture containing both hapten-labeled probes was applied on chromosome slide as previously described [68]. Targeted single-copy gene fragments were visualized in sequential rounds of incubations as detailed before [69] in the following order: (1) streptavidin-POD, TSA fluorescein; (2) anti-digoxigenin-POD, TSA TMR. Between the sequential steps 1 and 2, slides were incubated in 1% hydrogen peroxide (H2O2/PBS) for 30 min at room temperature, then three washes in PBS for 5 min at room temperature, and a final wash in TNT buffer (0.1 M Tris-HCl, 0.15 M NaCl, 0.05% Tween-20, pH 7.5) for 5 min at room temperature. Chromosomes were counterstained by DAPI with antifade (Cytocell, Cambridge, UK).

4.2.4. Microscopy and Processing of FISH-TSA Images

FISH-TSA images were captured with camera DFC 7000T (equipped with a black-and-white CCD-Chip (Leica, Wetzlar, Germany)) coupled to an epifluorescence microscope Leica DM6B equipped with a set of three narrowband fluorescent filters. Digital pseudocolored images (blue for DAPI, green for biotinylated probe, red for digoxigenated probe (described in Section 4.2.2), were merged in red-green-blue channel mode and processed by Adaptive Contrast Control Scientific Image Analyzer software (Sofo ACC 6.2, Brno, Czech Republic). and Adobe Photoshop (CS7), Adobe Systems, San Jose, CA, USA.

4.3. Bioinformatic Analysis

Deducing the sequence of the chicken ortholog of AHBD16A was performed using the human AHBD16A sequence for BLAST searches using RNA-seq datasets (study PRJEB7620). Sequence reads were assembled with CLC genomics workbench, Qiagen, Bustehrad, Czech republic and with Lasergene SeqMan (DNASTAR, Madison, WI, USA).

4.4. Animals and Tissue Sampling

Commercial females of the Leghorn breed (layers) were purchased from commercial husbandries (Hasolelim, Israel) at the age of 1 d and grown at the Volcani Center according to recommended husbandry and feeding conditions (NRC 1994) with free access to food and water. Maintenance conditions and feeding formulas were according to the Lohmann guideline (http://www.hylinena.com/userdocs/products/lohmann_brown_lite_commercials_2011.pdf), as detailed previously [29]. At the age of first egg, lay (about four months of age) tissue samples were snap-frozen in liquid nitrogen, after neck dislocation. All animal procedures were carried out in accordance with the National Institutes of Health Guidelines on the Care and Use of Animals and Protocol IL732/17 (1.11.17), obtained by the Animal Experimentation Ethics Committee of the Agricultural Research Organization, Volcani Center.

4.5. Antibodies and Western Analysis

A custom-made antibody directed against chicken leptin-peptide (amino acid sequence: PPRAEKLRADARSLSRTLSARLGD) was prepared in rabbits and affinity purified by HY Laboratories LTD, Rehovot Israel. Anti alpha tubulin antibody was purchased from ABCAM (ab89984, Zotal, Tel-Aviv, Israel).
Protein concentration was measured by Bradford assay (Sigma, Yavne, Israel). Total proteins (20 mg) were subjected to 12% SDS-PAGE and transferred to a nitrocellulose membrane.

4.6. IHC Analysis

Chicken duodenum was fixed in buffered formalin for ~48 h. Fixed specimens were dehydrated through graded ethanol concentrations, cleared in xylene and embedded into paraffin. Five micrometers longitudinal sections were prepared and mounted onto positively charged glass slides. For immunohistochemical staining sections were deparaffinized in xylene and rehydrated through descending ethanol concentrations. Rehydrated sections were incubated with rabbit polyclonal antibodies to chicken leptin diluted 1:600 in TBST (10mM Tris-HCl, 150 mM NaCl, 0.1% Tween-20, pH 7.5) for 1 h at room temperature. After washing in TBST (5 times for 2 min) sections were incubated with anti-rabbit ZytoChem Plus HRP-Polymer (Zytomed Biotest, Kfar Saba, Israel) for 30 min. Then sections were washed in TBST and peroxidase activity was revealed by incubation in a mixture of 0.05% diaminobenzidine hydrochloride (Sigma-Aldrich, Rehobot, Israel) with 0.03% hydrogen peroxide in 0.1 M Tris-HCl, 10 mM imidazole (pH 7.5). Sections were slightly stained with Gill’s hematoxylin, dehydrated, cleared in xylene and mounted in DPX (Sigma-Aldrich). Digital microphotographs were prepared using SPOT InSight CMOS camera attached to BX51 microscope (Olympus, Japan). This analysis was conducted by Smart Assays, Ness Ziona, Israel.

4.7. Statistical Analyses

Statistical analyses of the qRT-PCR analysis and leptin bioassay were performed by one-way ANOVA and Tukey-Kramer honestly significant difference test (p ≤ 0.05); means ± SEs are reported.

Supplementary Materials

Supplementary materials can be found at https://www.mdpi.com/1422-0067/20/18/4489/s1.

Author Contributions

M.K., D.E. and V.K. performed the FISH-TSA analysis, F.P., S.L. and M.M. performed the RH-mapping. S.Y. and S.G. did the bioinformatic, qPCR, leptin bioassay and western analysis, S.M. helped with the bioinformatic analysis, M.R. was responsible for growing and physiological characterization of the chickens. M.F.-E., E.S. and L.A. designed the experiments and wrote the paper. All authors read and corrected the final drafts.

Funding

This research was funded by the Israel National Science Foundation (grant 1294/17, to MFE and ES) and by the Ministry of Education, Youth and Sports of the Czech Republic (project NPU I No. LO1419, to DE).

Conflicts of Interest

The authors declare no conflict of interest.

References

  1. Zhang, Y.; Proenca, R.; Maffei, M.; Barone, M.; Leopold, L.; Friedman, J.M. Positional cloning of the mouse obese gene and its human homologue. Nature 1994, 372, 425–432. [Google Scholar] [CrossRef] [PubMed]
  2. Friedman, J. The long road to leptin. J. Clin. Investig. 2016, 126, 4727–4734. [Google Scholar] [CrossRef] [PubMed] [Green Version]
  3. Uysal, K.T.; Wiesbrock, S.M.; Marino, M.W.; Hotamisligil, G.S. Protection from obesity-induced insulin resistance in mice lacking TNF-alpha function. Nature 1997, 389, 610–614. [Google Scholar] [CrossRef] [PubMed]
  4. Brenner, D.; Blaser, H.; Mak, T.W. Regulation of tumour necrosis factor signalling: Live or let die. Nat. Rev. Immunol. 2015, 15, 362–374. [Google Scholar] [CrossRef] [PubMed]
  5. Carbone, F.; La Rocca, C.; Matarese, G. Immunological functions of leptin and adiponectin. Biochimie 2012, 94, 2082–2088. [Google Scholar] [CrossRef] [PubMed]
  6. Lord, G.M.; Matarese, G.; Howard, J.K.; Baker, R.J.; Bloom, S.R.; Lechler, R.I. Leptin modulates the T-cell immune response and reverses starvation-induced immunosuppression. Nature 1998, 394, 897–901. [Google Scholar] [CrossRef] [PubMed]
  7. Loffreda, S.; Yang, S.Q.; Lin, H.Z.; Karp, C.L.; Brengman, M.L.; Wang, D.J.; Klein, A.S.; Bulkley, G.B.; Bao, C.; Noble, P.W.; et al. Leptin regulates proinflammatory immune responses. FASEB J. 1998, 12, 57–65. [Google Scholar] [CrossRef] [PubMed] [Green Version]
  8. Chu, C.Q. How much have we learnt about the TNF family of cytokines? Cytokine 2018, 101, 1–3. [Google Scholar] [CrossRef] [PubMed]
  9. Grunfeld, C.; Zhao, C.; Fuller, J.; Pollack, A.; Moser, A.; Friedman, J.; Feingold, K.R. Endotoxin and cytokines induce expression of leptin, the ob gene product, in hamsters. J. Clin. Investig. 1996, 97, 2152–2157. [Google Scholar] [CrossRef]
  10. Park, H.K.; Ahima, R.S. Physiology of leptin: Energy homeostasis, neuroendocrine function and metabolism. Metabolism 2015, 64, 24–34. [Google Scholar] [CrossRef]
  11. Magor, K.E.; Miranzo Navarro, D.; Barber, M.R.; Petkau, K.; Fleming-Canepa, X.; Blyth, G.A.; Blaine, A.H. Defense genes missing from the flight division. Dev. Comp. Immunol. 2013, 41, 377–388. [Google Scholar] [CrossRef] [PubMed]
  12. Dakovic, N.; Terezol, M.; Pitel, F.; Maillard, V.; Elis, S.; Leroux, S.; Lagarrigue, S.; Gondret, F.; Klopp, C.; Baeza, E.; et al. The loss of adipokine genes in the chicken genome and implications for insulin metabolism. Mol. Biol. Evol. 2014, 31, 2637–2646. [Google Scholar] [CrossRef] [PubMed]
  13. Bornelov, S.; Seroussi, E.; Yosefi, S.; Pendavis, K.; Burgess, S.C.; Grabherr, M.; Friedman-Einat, M.; Andersson, L. Correspondence on Lovell et al.: Identification of chicken genes previously assumed to be evolutionarily lost. Genome Biol. 2017, 18, 112. [Google Scholar] [CrossRef] [PubMed]
  14. Rohde, F.; Schusser, B.; Hron, T.; Farkasova, H.; Plachy, J.; Hartle, S.; Hejnar, J.; Elleder, D.; Kaspers, B. Characterization of chicken tumor necrosis factor-alpha, a long missed cytokine in birds. Front. Immunol. 2018, 9, 605. [Google Scholar] [CrossRef] [PubMed]
  15. Seroussi, E.; Cinnamon, Y.; Yosefi, S.; Genin, O.; Smith, J.G.; Rafati, N.; Bornelov, S.; Andersson, L.; Friedman-Einat, M. Identification of the Long-Sought Leptin in Chicken and Duck Expression Pattern of the Highly GC-Rich Avian leptin Fits an Autocrine/Paracrine Rather Than Endocrine Function. Endocrinology 2016, 157, 737–751. [Google Scholar] [CrossRef] [PubMed]
  16. Elleder, D.; Kaspers, B. After TNF-alpha, still playing hide-and-seek with chicken genes. Poult. Sci. 2019. [Google Scholar] [CrossRef] [PubMed]
  17. Rozenboim, I.; Mahato, J.; Cohen, N.A.; Tirosh, O. Low protein and high-energy diet: A possible natural cause of fatty liver hemorrhagic syndrome in caged White Leghorn laying hens. Poult. Sci. 2016, 95, 612–621. [Google Scholar] [CrossRef]
  18. Bridgham, J.T.; Johnson, A.L. Expression and regulation of Fas antigen and tumor necrosis factor receptor type I in hen granulosa cells. Biol. Reprod. 2001, 65, 733–739. [Google Scholar] [CrossRef]
  19. Abdalla, S.A.; Horiuchi, H.; Furusawa, S.; Matsuda, H. Molecular study on chicken tumor necrosis factor receptor-II and tumor necrosis factor receptor-associated factor-5. Vet. Immunol. Immunopathol. 2004, 98, 31–41. [Google Scholar] [CrossRef]
  20. Horev, G.; Einat, P.; Aharoni, T.; Eshdat, Y.; Friedman-Einat, M. Molecular cloning and properties of the chicken leptin-receptor (CLEPR) gene. Mol. Cell. Endocrinol. 2000, 162, 95–106. [Google Scholar] [CrossRef]
  21. Ohkubo, T.; Tanaka, M.; Nakashima, K. Structure and tissue distribution of chicken leptin receptor (cOb-R) mRNA. Biochim. Biophys. Acta 2000, 1491, 303–308. [Google Scholar] [CrossRef]
  22. Dunn, I.C.; Boswell, T.; Friedman-Einat, M.; Eshdat, Y.; Burt, D.W.; Paton, I.R. Mapping of the leptin receptor gene (LEPR) to chicken chromosome 8. Anim. Genet. 2000, 31, 290. [Google Scholar] [CrossRef] [PubMed]
  23. Idriss, H.T.; Naismith, J.H. TNF alpha and the TNF receptor superfamily: Structure-function relationship(s). Microsc. Res. Tech. 2000, 50, 184–195. [Google Scholar] [CrossRef]
  24. Friedman-Einat, M.; Seroussi, E. Quack leptin. BMC Genom. 2014, 15, 551. [Google Scholar] [CrossRef] [PubMed]
  25. Friedman-Einat, M.; Cogburn, L.A.; Yosefi, S.; Hen, G.; Shinder, D.; Shirak, A.; Seroussi, E. Discovery and characterization of the first genuine avian leptin gene in the rock dove (Columba livia). Endocrinology 2014, 155, 3376–3384. [Google Scholar] [CrossRef]
  26. Prokop, J.W.; Schmidt, C.; Gasper, D.; Duff, R.J.; Milsted, A.; Ohkubo, T.; Ball, H.C.; Shawkey, M.D.; Mays, H.L., Jr.; Cogburn, L.A.; et al. Discovery of the elusive leptin in birds: Identification of several ‘missing links’ in the evolution of leptin and its receptor. PLoS ONE 2014, 9, e92751. [Google Scholar] [CrossRef]
  27. Huang, G.; Li, J.; Wang, H.; Lan, X.; Wang, Y. Discovery of a novel functional leptin protein (LEP) in zebra finches: Evidence for the existence of an authentic avian leptin gene predominantly expressed in the brain and pituitary. Endocrinology 2014, 155, 3385–3396. [Google Scholar] [CrossRef]
  28. Farkasova, H.; Hron, T.; Pačes, J.; Pajer, P.; Elleder, D. Identification of a GC-rich leptin gene in chicken. Agri Gene 2016, 1, 88–92. [Google Scholar] [CrossRef]
  29. Bornelov, S.; Seroussi, E.; Yosefi, S.; Benjamini, S.; Miyara, S.; Ruzal, M.; Grabherr, M.; Rafati, N.; Molin, A.M.; Pendavis, K.; et al. Comparative omics and feeding manipulations in chicken indicate a shift of the endocrine role of visceral fat towards reproduction. BMC Genom. 2018, 19, 295. [Google Scholar] [CrossRef]
  30. Nedwin, G.E.; Naylor, S.L.; Sakaguchi, A.Y.; Smith, D.; Jarrett-Nedwin, J.; Pennica, D.; Goeddel, D.V.; Gray, P.W. Human lymphotoxin and tumor necrosis factor genes: Structure, homology and chromosomal localization. Nucleic Acids Res. 1985, 13, 6361–6373. [Google Scholar] [CrossRef]
  31. Inoko, H.; Trowsdale, J. Linkage of TNF genes to the HLA-B locus. Nucleic Acids Res. 1987, 15, 8957–8962. [Google Scholar] [CrossRef] [PubMed] [Green Version]
  32. Kaufman, J.; Milne, S.; Gobel, T.W.; Walker, B.A.; Jacob, J.P.; Auffray, C.; Zoorob, R.; Beck, S. The chicken B locus is a minimal essential major histocompatibility complex. Nature 1999, 401, 923–925. [Google Scholar] [CrossRef] [PubMed]
  33. Solinhac, R.; Leroux, S.; Galkina, S.; Chazara, O.; Feve, K.; Vignoles, F.; Morisson, M.; Derjusheva, S.; Bed’hom, B.; Vignal, A.; et al. Integrative mapping analysis of chicken microchromosome 16 organization. BMC Genom. 2010, 11, 616. [Google Scholar] [CrossRef] [PubMed]
  34. Kaufman, J. Generalists and specialists: A new view of how MHC Class I molecules fight infectious pathogens. Trends Immunol. 2018, 39, 367–379. [Google Scholar] [CrossRef] [PubMed]
  35. Warren, W.C.; Hillier, L.W.; Tomlinson, C.; Minx, P.; Kremitzki, M.; Graves, T.; Markovic, C.; Bouk, N.; Pruitt, K.D.; Thibaud-Nissen, F.; et al. A New Chicken Genome Assembly Provides Insight into Avian Genome Structure. G3 Genes Genomes Genet. 2017, 7, 109–117. [Google Scholar] [CrossRef] [PubMed] [Green Version]
  36. Kuprash, D.V.; Alimzhanov, M.B.; Tumanov, A.V.; Grivennikov, S.I.; Shakhov, A.N.; Drutskaya, L.N.; Marino, M.W.; Turetskaya, R.L.; Anderson, A.O.; Rajewsky, K.; et al. Redundancy in tumor necrosis factor (TNF) and lymphotoxin (LT) signaling in vivo: Mice with inactivation of the entire TNF/LT locus versus single-knockout mice. Mol. Cell. Biol. 2002, 22, 8626–8634. [Google Scholar] [CrossRef]
  37. Morisson, M.; Lemiere, A.; Bosc, S.; Galan, M.; Plisson-Petit, F.; Pinton, P.; Delcros, C.; Feve, K.; Pitel, F.; Fillon, V.; et al. ChickRH6: A chicken whole-genome radiation hybrid panel. Genet. Sel. Evol. 2002, 34, 521–533. [Google Scholar] [CrossRef]
  38. Deakin, J.E.; Papenfuss, A.T.; Belov, K.; Cross, J.G.; Coggill, P.; Palmer, S.; Sims, S.; Speed, T.P.; Beck, S.; Graves, J.A. Evolution and comparative analysis of the MHC Class III inflammatory region. BMC Genom. 2006, 7, 281. [Google Scholar] [CrossRef]
  39. Pasparakis, M.; Alexopoulou, L.; Episkopou, V.; Kollias, G. Immune and inflammatory responses in TNF alpha-deficient mice: A critical requirement for TNF alpha in the formation of primary B cell follicles, follicular dendritic cell networks and germinal centers, and in the maturation of the humoral immune response. J. Exp. Med. 1996, 184, 1397–1411. [Google Scholar] [CrossRef]
  40. Flier, J.S. Lowered leptin slims immune response. Nat. Med. 1998, 4, 1124–1125. [Google Scholar] [CrossRef]
  41. Naylor, C.; Petri, W.A., Jr. Leptin Regulation of Immune Responses. Trends Mol. Med. 2016, 22, 88–98. [Google Scholar] [CrossRef] [PubMed]
  42. Francisco, V.; Pino, J.; Campos-Cabaleiro, V.; Ruiz-Fernandez, C.; Mera, A.; Gonzalez-Gay, M.A.; Gomez, R.; Gualillo, O. Obesity, Fat Mass and Immune System: Role for Leptin. Front. Physiol. 2018, 9, 640. [Google Scholar] [CrossRef] [PubMed] [Green Version]
  43. Dong, K.; Chang, S.; Xie, Q.; Black-Pyrkosz, A.; Zhang, H. Comparative transcriptomics of genetically divergent lines of chickens in response to Marek’s disease virus challenge at cytolytic phase. PLoS ONE 2017, 12, e0178923. [Google Scholar] [CrossRef] [PubMed]
  44. Bacon, L.D.; Hunt, H.D.; Cheng, H.H. A review of the development of chicken lines to resolve genes determining resistance to diseases. Poult. Sci. 2000, 79, 1082–1093. [Google Scholar] [CrossRef] [PubMed]
  45. Bush, S.J.; Freem, L.; MacCallum, A.J.; O’Dell, J.; Wu, C.; Afrasiabi, C.; Psifidi, A.; Stevens, M.P.; Smith, J.; Summers, K.M.; et al. Combination of novel and public RNA-seq datasets to generate an mRNA expression atlas for the domestic chicken. BMC Genom. 2018, 19, 594. [Google Scholar] [CrossRef] [PubMed]
  46. Tan, X.; Hsueh, W.; Gonzalez-Crussi, F. Cellular localization of tumor necrosis factor (TNF)-alpha transcripts in normal bowel and in necrotizing enterocolitis. TNF gene expression by Paneth cells, intestinal eosinophils, and macrophages. Am. J. Pathol. 1993, 142, 1858–1865. [Google Scholar] [PubMed]
  47. Santaolalla, R.; Abreu, M.T. Innate immunity in the small intestine. Curr. Opin. Gastroenterol. 2012, 28, 124–129. [Google Scholar] [CrossRef] [Green Version]
  48. Bado, A.; Levasseur, S.; Attoub, S.; Kermorgant, S.; Laigneau, J.P.; Bortoluzzi, M.N.; Moizo, L.; Lehy, T.; Guerre-Millo, M.; Le Marchand-Brustel, Y.; et al. The stomach is a source of leptin. Nature 1998, 394, 790–793. [Google Scholar] [CrossRef]
  49. Peters, J.H.; Ritter, R.C.; Simasko, S.M. Leptin and CCK selectively activate vagal afferent neurons innervating the stomach and duodenum. Am. J. Physiol. Regul. Integr. Comp. Physiol. 2006, 290, R1544–R1549. [Google Scholar] [CrossRef] [Green Version]
  50. Yarandi, S.S.; Hebbar, G.; Sauer, C.G.; Cole, C.R.; Ziegler, T.R. Diverse roles of leptin in the gastrointestinal tract: Modulation of motility, absorption, growth, and inflammation. Nutrition 2011, 27, 269–275. [Google Scholar] [CrossRef] [Green Version]
  51. Sambrook, J.G.; Figueroa, F.; Beck, S. A genome-wide survey of Major Histocompatibility Complex (MHC) genes and their paralogues in zebrafish. BMC Genom. 2005, 6, 152. [Google Scholar] [CrossRef] [PubMed]
  52. O’Hare, T.H.; Delany, M.E. Genetic variation exists for telomeric array organization within and among the genomes of normal, immortalized, and transformed chicken systems. Chromosome Res. 2009, 17, 947–964. [Google Scholar] [CrossRef] [PubMed] [Green Version]
  53. Seroussi, E.; Pitel, F.; Leroux, S.; Morisson, M.; Bornelov, S.; Miyara, S.; Yosefi, S.; Cogburn, L.A.; Burt, D.W.; Andersson, L.; et al. Mapping of leptin and its syntenic genes to chicken chromosome 1p. BMC Genet. 2017, 18, 77. [Google Scholar]
  54. Wajant, H.; Siegmund, D. TNFR1 and TNFR2 in the control of the life and death balance of macrophages. Front. Cell Dev. Biol. 2019, 7, 91. [Google Scholar] [CrossRef] [PubMed]
  55. Wajant, H.; Pfizenmaier, K.; Scheurich, P. Tumor necrosis factor signaling. Cell Death Differ. 2003, 10, 45–65. [Google Scholar] [CrossRef] [PubMed] [Green Version]
  56. Cammisotto, P.; Bendayan, M. A review on gastric leptin: The exocrine secretion of a gastric hormone. Anat. Cell Biol. 2012, 45, 1–16. [Google Scholar] [CrossRef] [PubMed]
  57. Inagaki-Ohara, K. Gastric leptin and tumorigenesis: Beyond obesity. Int. J. Mol. Sci. 2019, 20, 2622. [Google Scholar] [CrossRef]
  58. Darcel, N.P.; Liou, A.P.; Tome, D.; Raybould, H.E. Activation of vagal afferents in the rat duodenum by protein digests requires PepT1. J. Nutr. 2005, 135, 1491–1495. [Google Scholar] [CrossRef]
  59. Pitel, F.; Abasht, B.; Morisson, M.; Crooijmans, R.P.; Vignoles, F.; Leroux, S.; Feve, K.; Bardes, S.; Milan, D.; Lagarrigue, S.; et al. A high-resolution radiation hybrid map of chicken chromosome 5 and comparison with human chromosomes. BMC Genom. 2004, 5, 66. [Google Scholar] [CrossRef]
  60. de Givry, S.; Bouchez, M.; Chabrier, P.; Milan, D.; Schiex, T. CARHTA GENE: Multipopulation integrated genetic and radiation hybrid mapping. Bioinformatics 2005, 21, 1703–1704. [Google Scholar] [CrossRef]
  61. Voorrips, R.E. MapChart: Software for the graphical presentation of linkage maps and QTLs. J. Hered. 2002, 93, 77–78. [Google Scholar] [CrossRef] [PubMed]
  62. Plachy, J. The chicken—A laboratory animal of the class Aves. Folia Biol.-Prague 2000, 46, 17–23. [Google Scholar]
  63. Federspiel, M.J.; Hughes, S.H. Retroviral gene delivery. Method Cell Biol. 1997, 52, 179. [Google Scholar]
  64. Courtet, M.; Flajnik, M.; Du Pasquier, L. Major histocompatibility complex and immunoglobulin loci visualized by in situ hybridization on Xenopus chromosomes. Dev. Comp. Immunol. 2001, 25, 149–157. [Google Scholar] [CrossRef]
  65. Himly, M.; Foster, D.N.; Bottoli, I.; Iacovoni, J.S.; Vogt, P.K. The DF-1 chicken fibroblast cell line: Transformation induced by diverse oncogenes and cell death resulting from infection by avian leukosis viruses. Virology 1998, 248, 295–304. [Google Scholar] [CrossRef] [PubMed]
  66. Krylov, V.; Tlapakova, T.; Macha, J. Localization of the single copy gene Mdh2 on Xenopus tropicalis chromosomes by FISH-TSA. Cytogenet. Genome Res. 2007, 116, 110–112. [Google Scholar] [CrossRef]
  67. Knytl, M.; Tlapakova, T.; Vankova, T.; Krylov, V. Silurana Chromosomal Evolution: A new piece to the puzzle. Cytogenet. Genome Res. 2018, 156, 223–228. [Google Scholar] [CrossRef]
  68. Knytl, M.; Smolik, O.; Kubickova, S.; Tlapakova, T.; Evans, B.J.; Krylov, V. Chromosome divergence during evolution of the tetraploid clawed frogs, Xenopus mellotropicalis and Xenopus epitropicalis as revealed by Zoo-FISH. PLoS ONE 2017, 12, e0177087. [Google Scholar] [CrossRef]
  69. Carabajal Paladino, L.Z.; Nguyen, P.; Sichova, J.; Marec, F. Mapping of single-copy genes by TSA-FISH in the codling moth, Cydia pomonella. BMC Genet. 2014, 15 (Suppl. 2), S15. [Google Scholar] [CrossRef]
Figure 1. RH mapping of TNF to the q arm of GGA16. Positions of markers included in the comprehensive map are indicated with error bars on the right. Putative assignments [5,6] of nucleolus organizer regions (NOR; blue), major histocompatibility complex (MHC-Y; pink), and MHC-B (green) are indicated.
Ijms 20 04489 g001
Figure 2. Detection of single-copy sequences in metaphase chromosomes by double color FISH-TSA. Somatic chromosomes prepared from a primary line of chicken embryo fibroblast (CEF) were used for hybridization with the indicated probes. Panels C,F,I were generated by merging of panels A,B,D,E,G,H, respectively, using red-green-blue color mode. For better visualization of the microchromosomes stained by 4’ 6-diamidino-2-phenylindole (DAPI), contrast-enhanced monochromatic images of A,D,G are shown in A’,D’,G’, respectively. Arrows indicate the two genes that were analyzed in each panel. Each gene locus was indicated in two copies on homologous chromosome pairs. Scale bar represents 10 µm.
Ijms 20 04489 g002
Figure 3. Meta-analysis of mRNA expression of chicken leptin, TNF and their cognate receptors in RNA-seq datasets from: A. * p < 0.05. Spleens of chickens intra-nasally administrated with PBS (Co) or very virulent infectious bursal disease virus (In); BioProject accession no. PRJEB7219 (n = 3 for each treatment). B. Spleens from 10 days old Leghorn lines susceptible (S line) or resistant (R line) to infection by Marek’s disease virus, five days after challenge with highly virulent Marek’s disease virus (In), or not challenged (Co) ([43]; BioProject accession no. PRJNA344896). C. Bone marrow-derived macrophages (M) and dendritic cells (D) from six-week-old broiler chickens and heterophils (H) isolated from blood of day-old broiler chicks (Ross), at the absence (M, D, H) or presence of lipopolysaccharide (+L) ([45]; BioProject accession no. PRJEB7475).
Ijms 20 04489 g003
Figure 4. Meta-analysis of the expression patterns of TNF, leptin and their cognate receptors in adult J-Line and Red junglefowl chickens. A. Chicken TNF, TNFR1 and TNFR2 full-length sequences (accessions MF000729, NM_204439, and NM_001030779, respectively) were used as baits for BLASTN searching the SRA databases of 9 female 16 to 17 weeks of age J-line chickens (BioProject accession no. PRJEB12891) and two-year-old female and male red junglefowls (BioProject accession no. PRJNA204941). B. Chicken leptin and LEPR full-length sequences (accessions: LN794246 and NM_204323, respectively), were used as baits for BLASTN searching the same databases as in A. Results are presented as RPKM.
Ijms 20 04489 g004
Figure 5. Immunohistochemistry analysis of leptin in chicken duodenum. A. Low power microphotographs of parallel non retrieved duodenum sections from mature leghorn chickens incubated with leptin antibody diluted from 1:1600 or processed without the primary antibody (no AB). Staining is observed in the mucosa in both enterocytes (absorbing cells) and goblet cells (mucosa secreting cells, distinctive by the presence of vacuoles). Crypts are indicated by arrow heads. U&PC are undifferentiated cells and Paneth cells. BG stands for Brunner’s gland. B. Higher magnification of a microvillus from B showing more clearly the absence of staining in the lamina propria (LP). C. The specificity of the leptin antibody was demonstrated by western analysis (top), using conditioned medium from 293 cells expressing exogenously administrated leptin minigenes of human, duck and chicken or mock transfected (hL, dL, and cL and MT, respectively) as described in details by Seroussi et al. [15]. Staining the same blot with tubulin antibody (middle panel) demonstrated that similar amounts of protein were loaded onto the gel wells, and the graph at the bottom indicated that a similar level of leptin activity was present in the three samples of conditioned medium (detected using LEPR based bioassay [15]).
Ijms 20 04489 g005
Table 1. Summary of mapping positions.
Gene NamePosition RH-Mapping (CentiRay)Linkage by FISHPosition GGA16Position HSA6
TRIM 7.2Tripartite motif containing 7200–240CSNK2B, TNF2,482,253..2,492,415
BRD2Bromodomain containing 2294.6ABHD16A2,574,363..2,583,21632968594..32981505
TAP2Transporter 2, ATP-binding cassette220–300 2,601,162..2,604,72432821833..32838823
C4AComplement 4 2,610,038..2,624,39231982057..32002680
TNFTumor Necrosis Factor189.1 Unknown31575565..31578336
CSNK2BCasein kinase II subunit beta197.3 Unknown31665880..31670070
ABHD16AAbhydrolase domain containing 16A256 Unknown31686949..31703360

