Global Transcriptome and Co-Expression Network Analysis Reveal Contrasting Response of Japonica and Indica Rice Cultivar to γ Radiation

Abstract

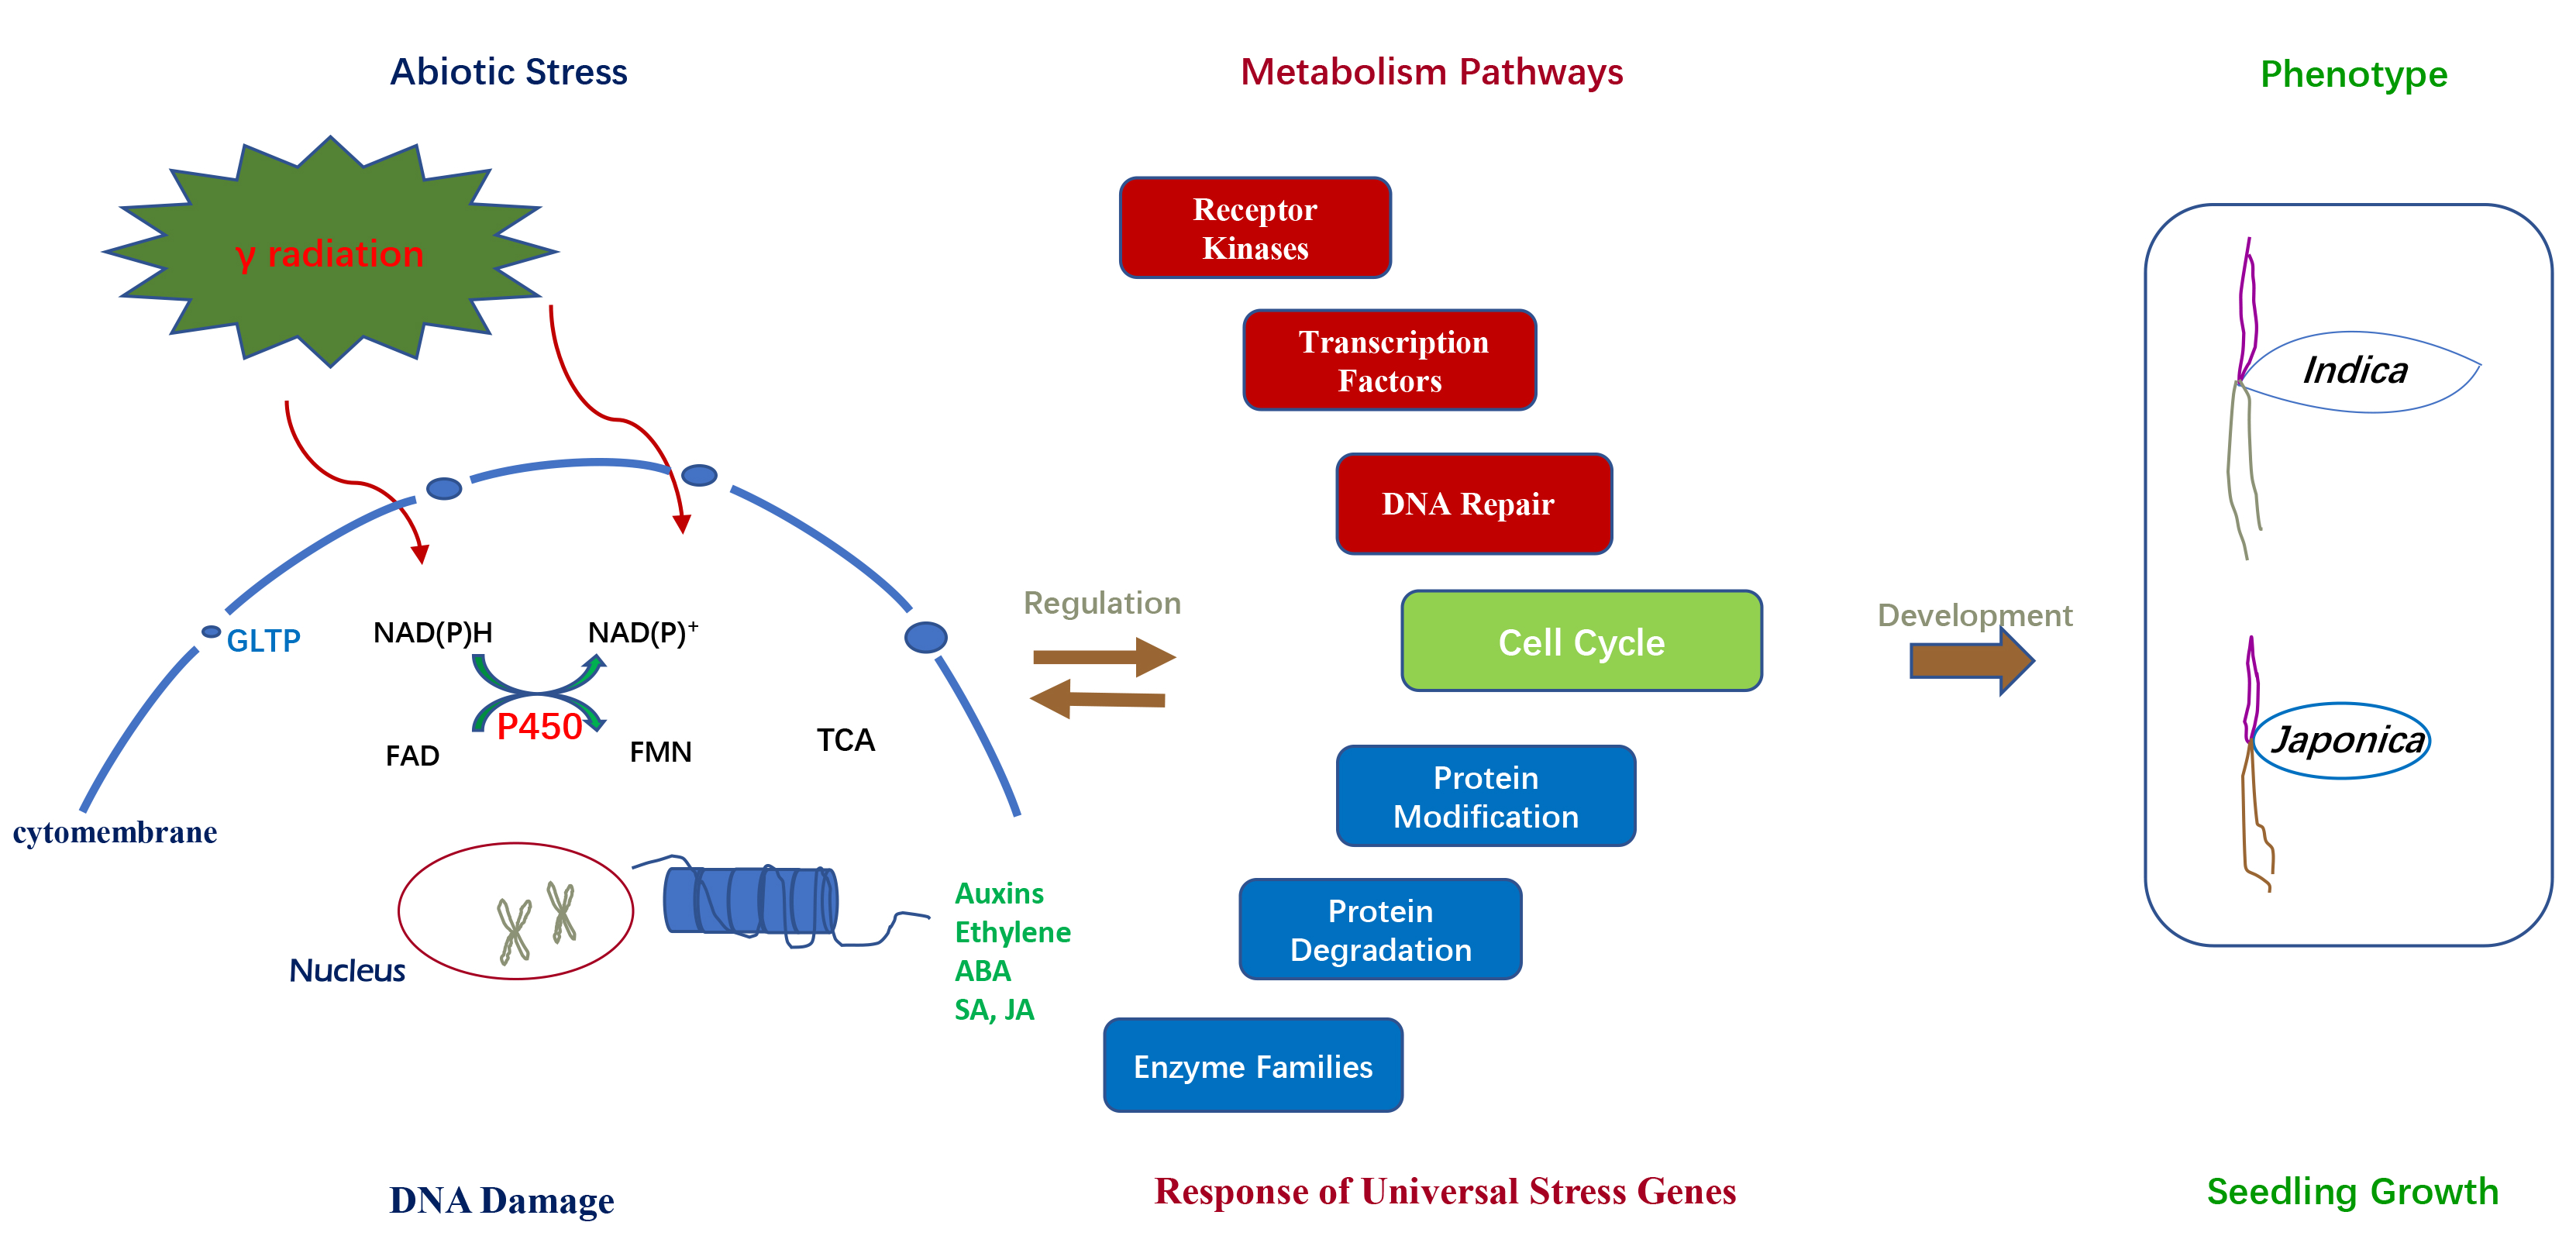
1. Introduction
2. Results
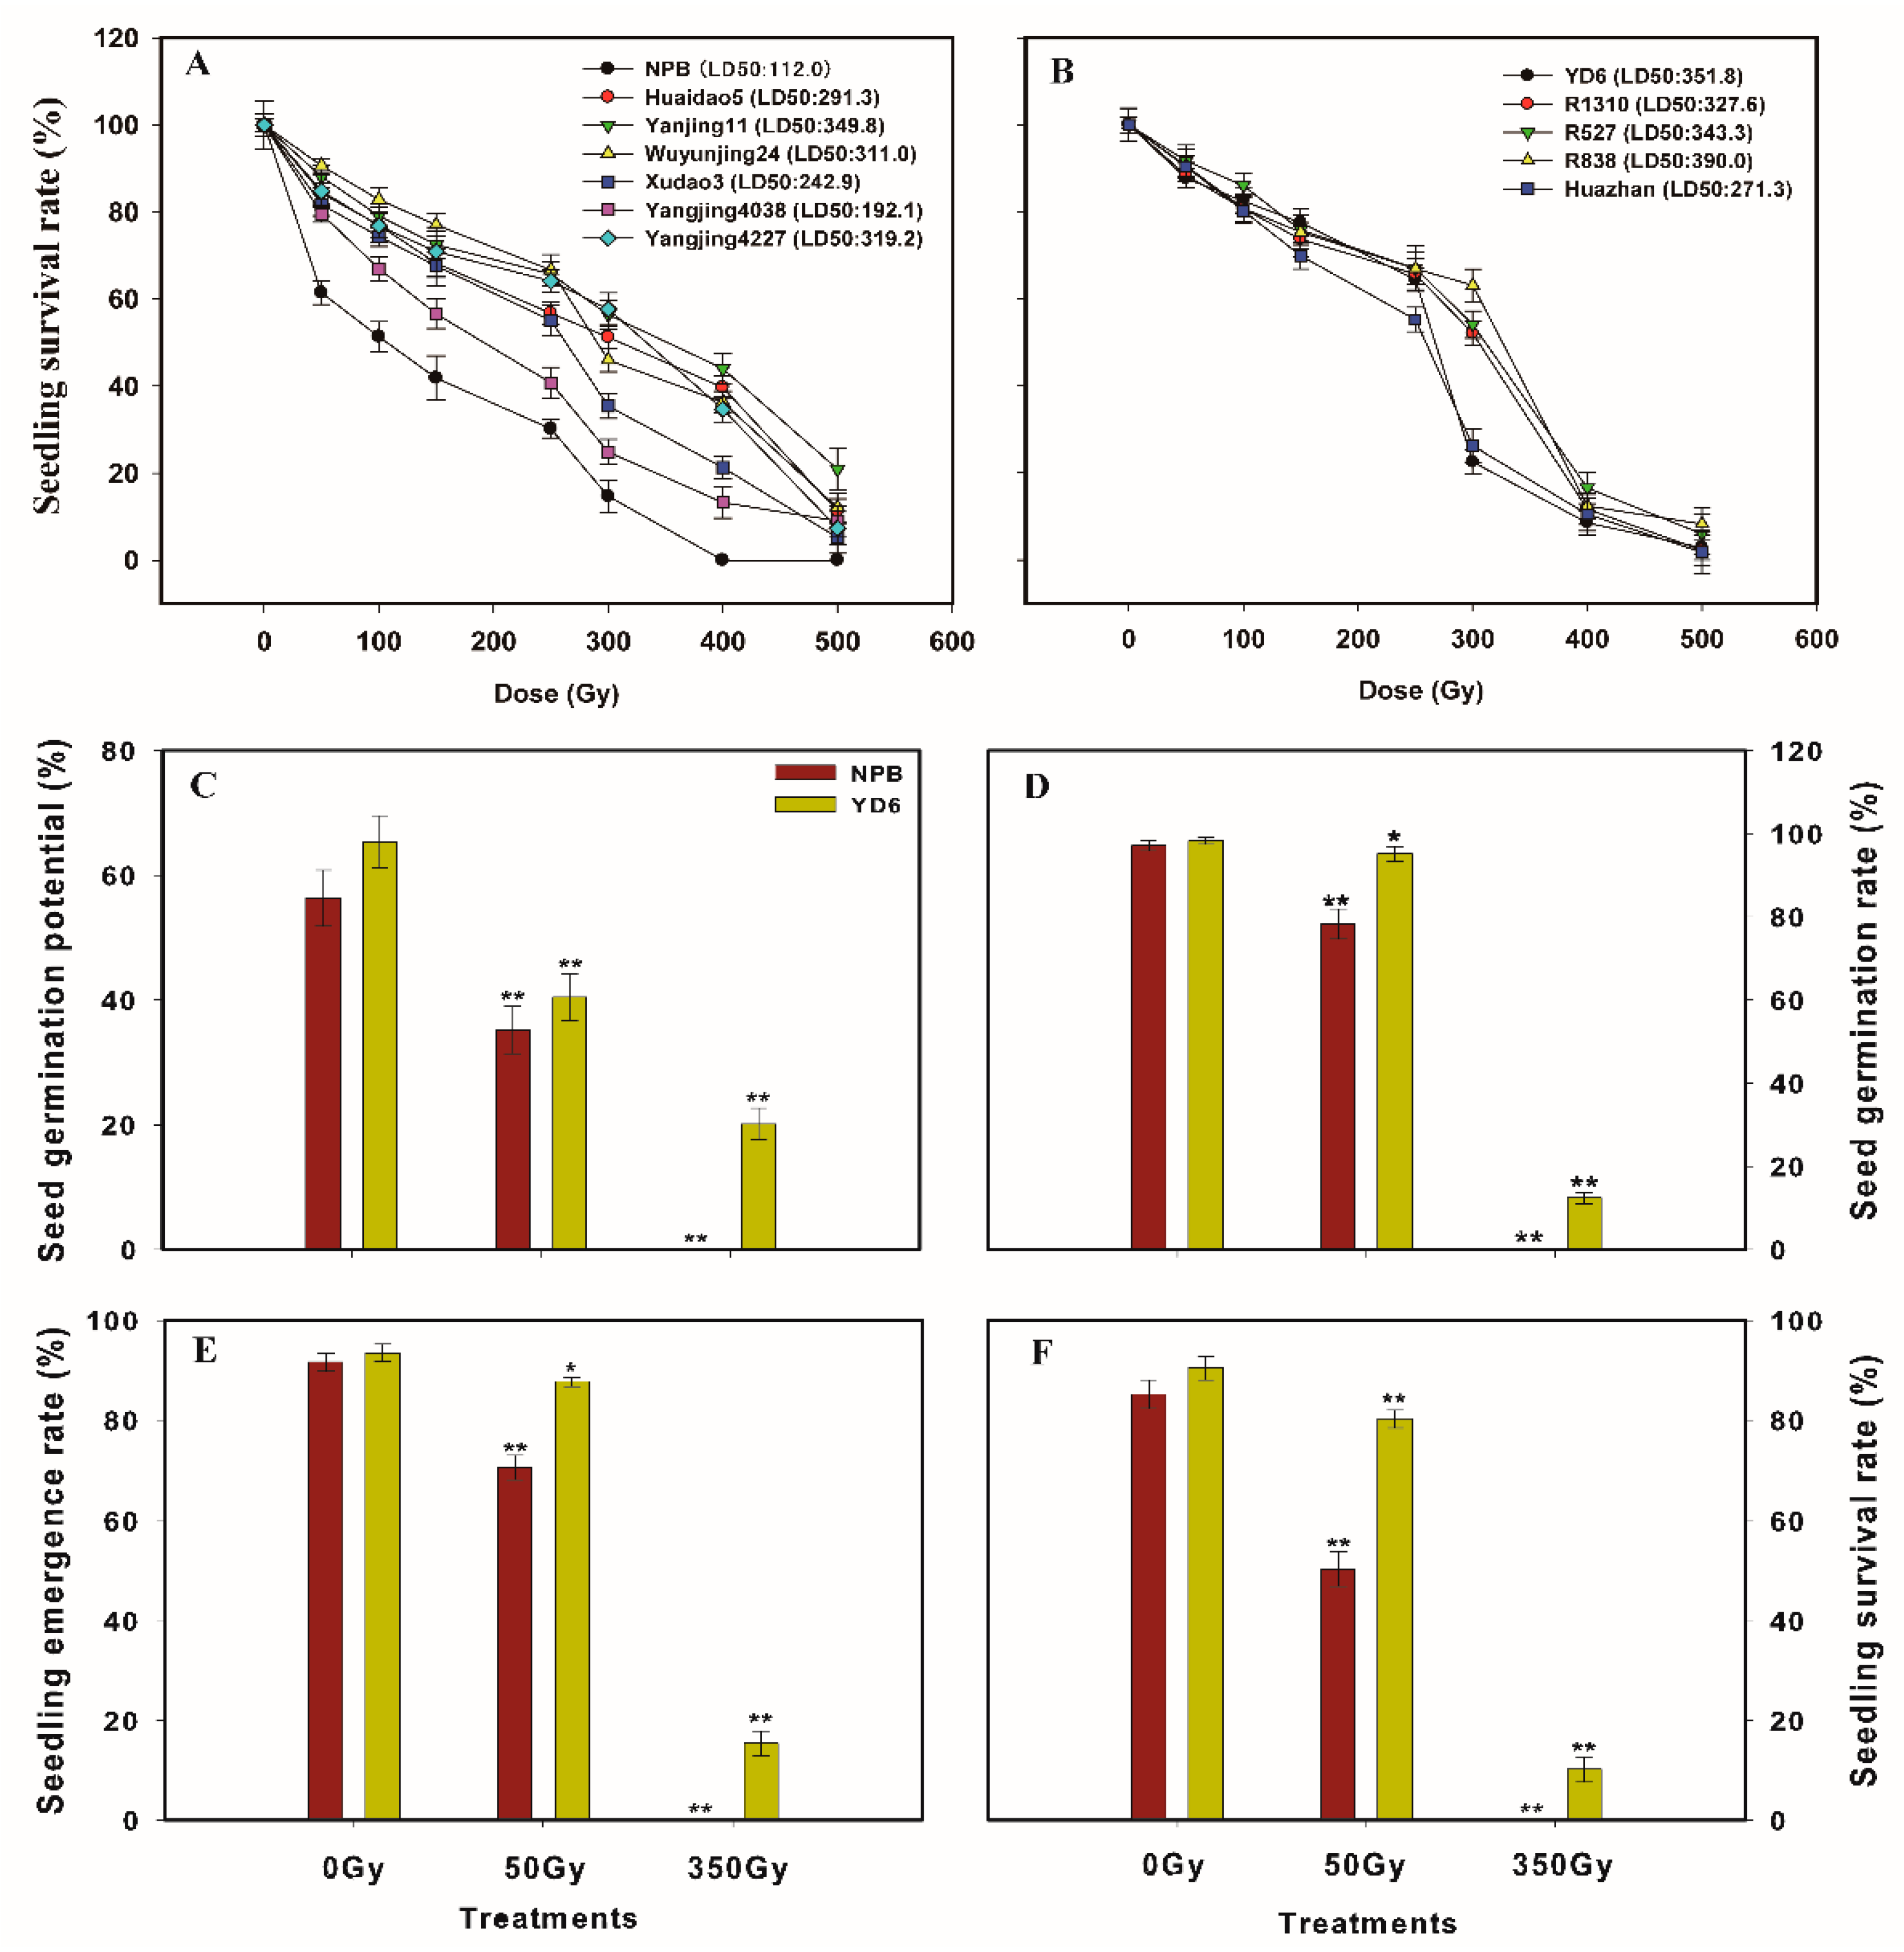
2.1. Seedling Survival Rate Reveals Japonica Subspecies are More Sensitive to Irradiation than Its Indica Counterparts
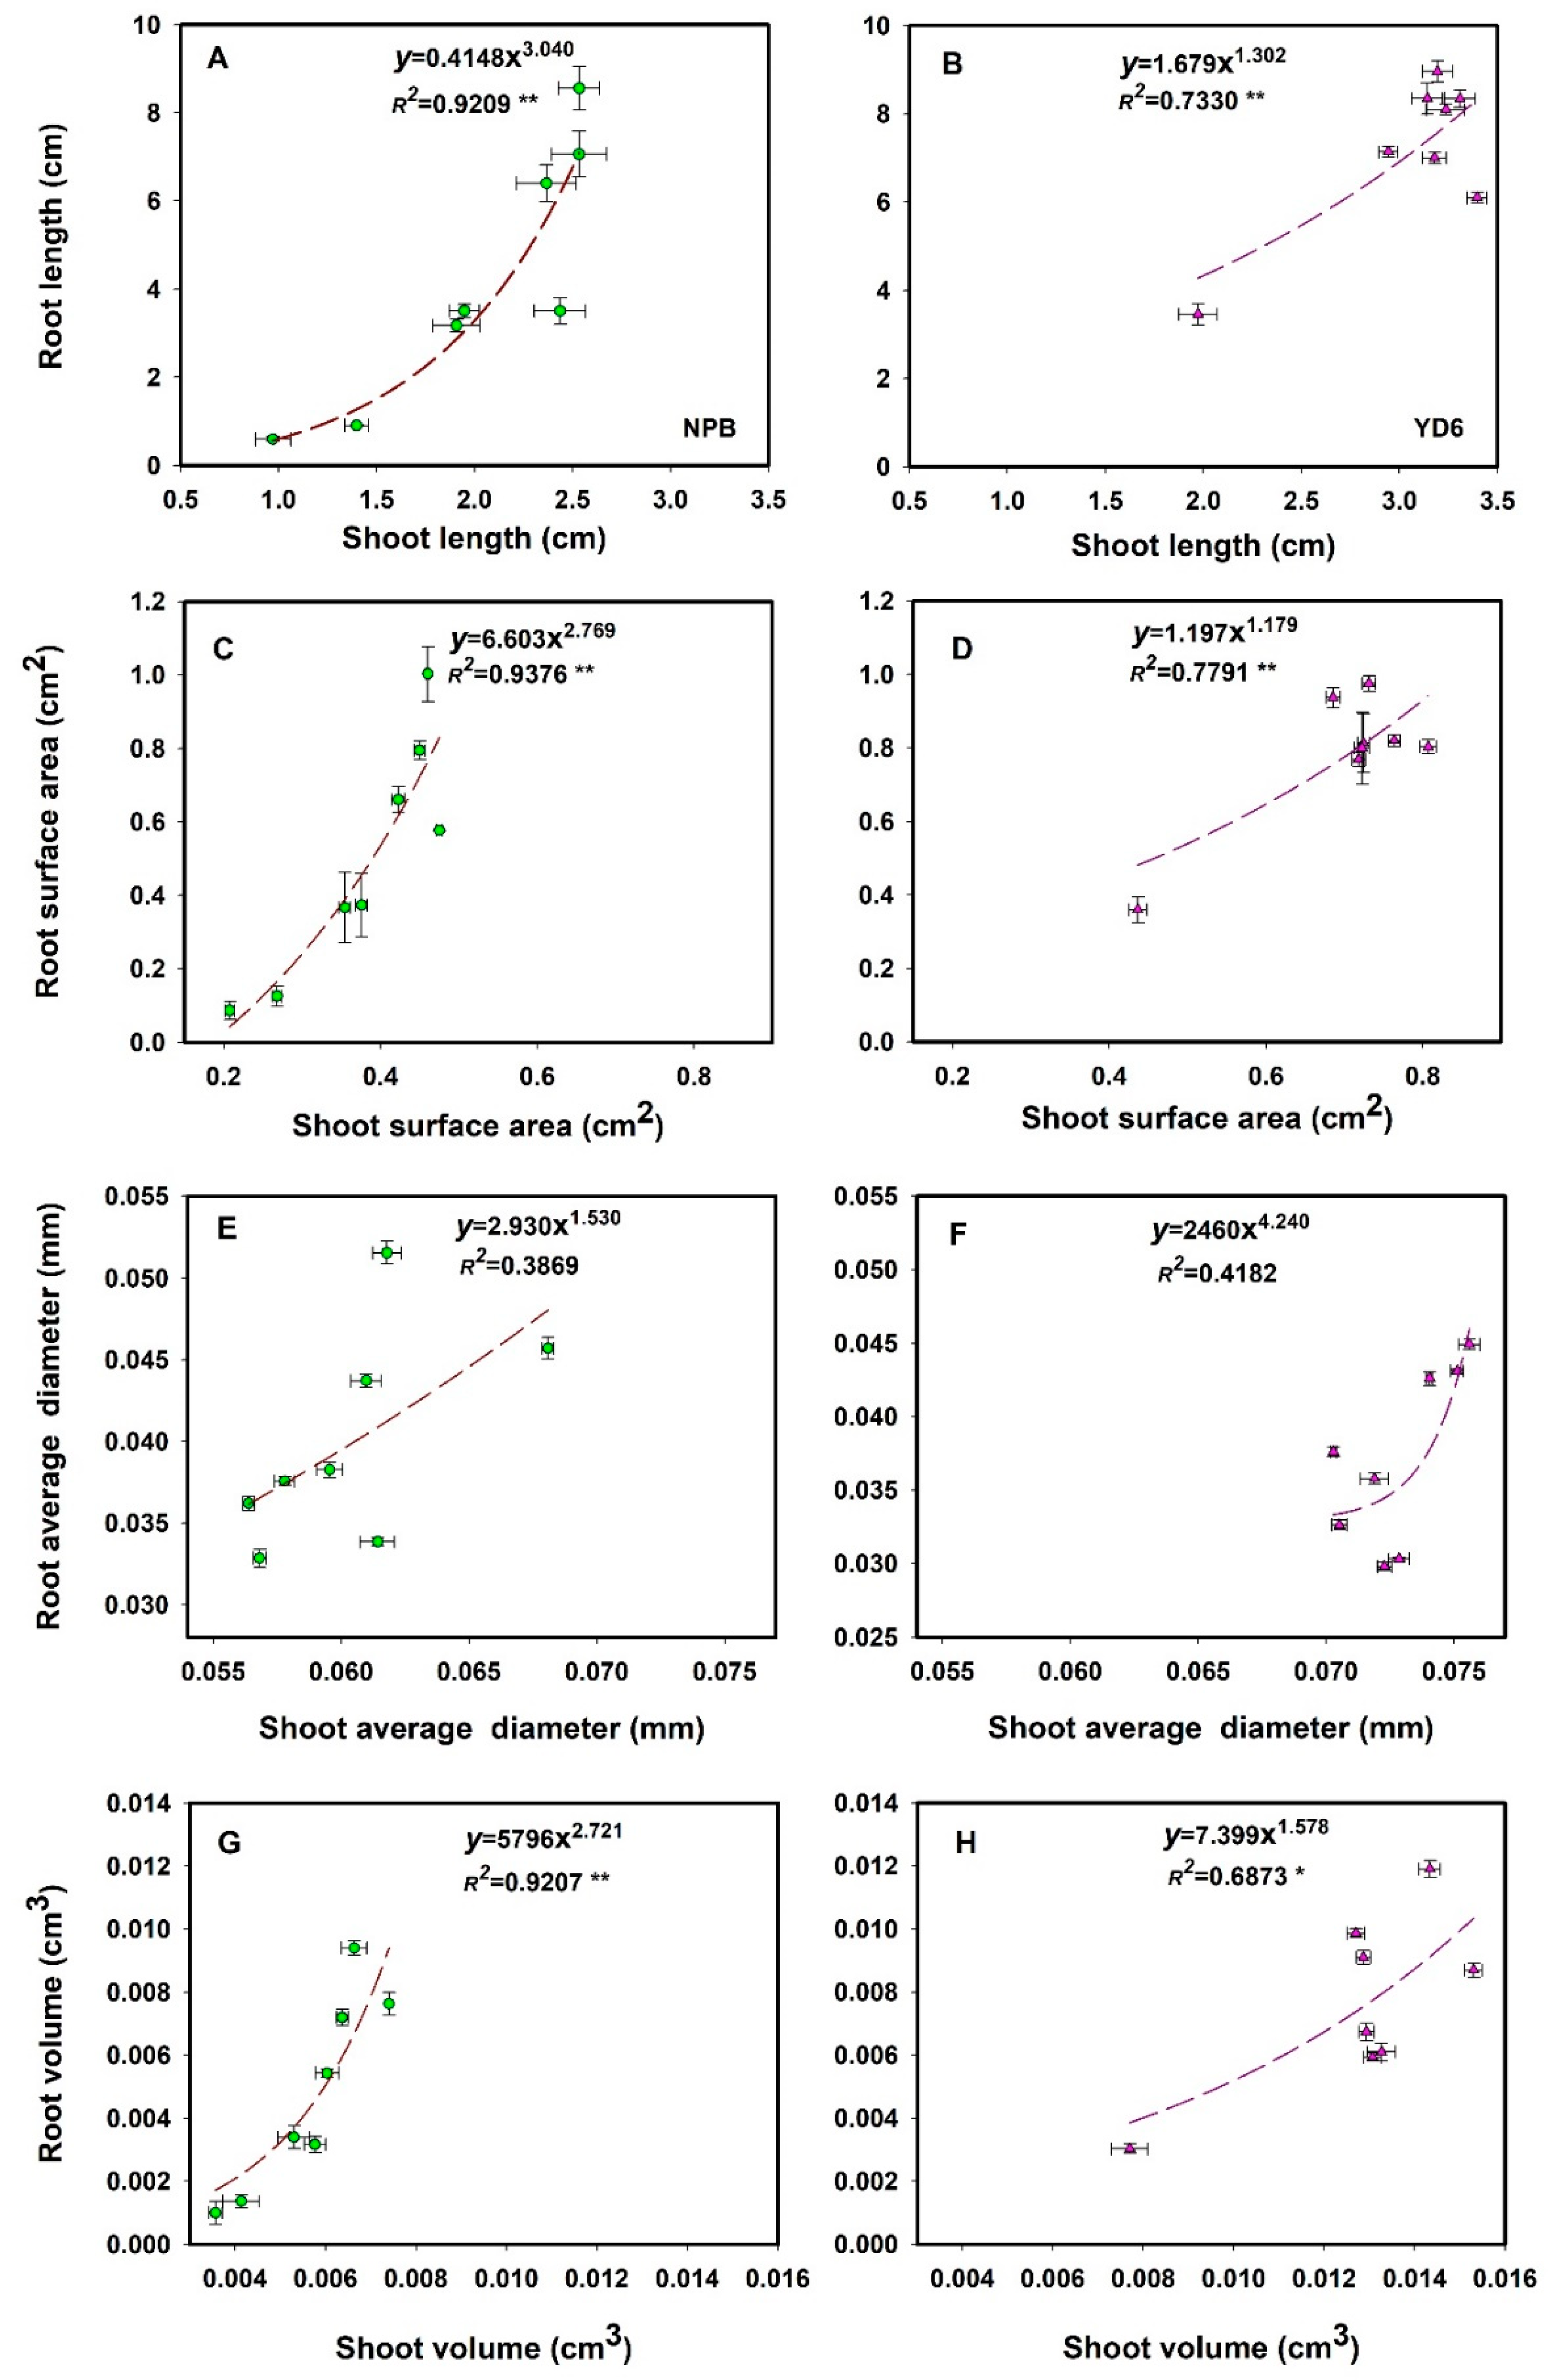
2.2. Irradiation Imposes More Inhibition on Root Growth than Shoot, More in NPB than in YD6
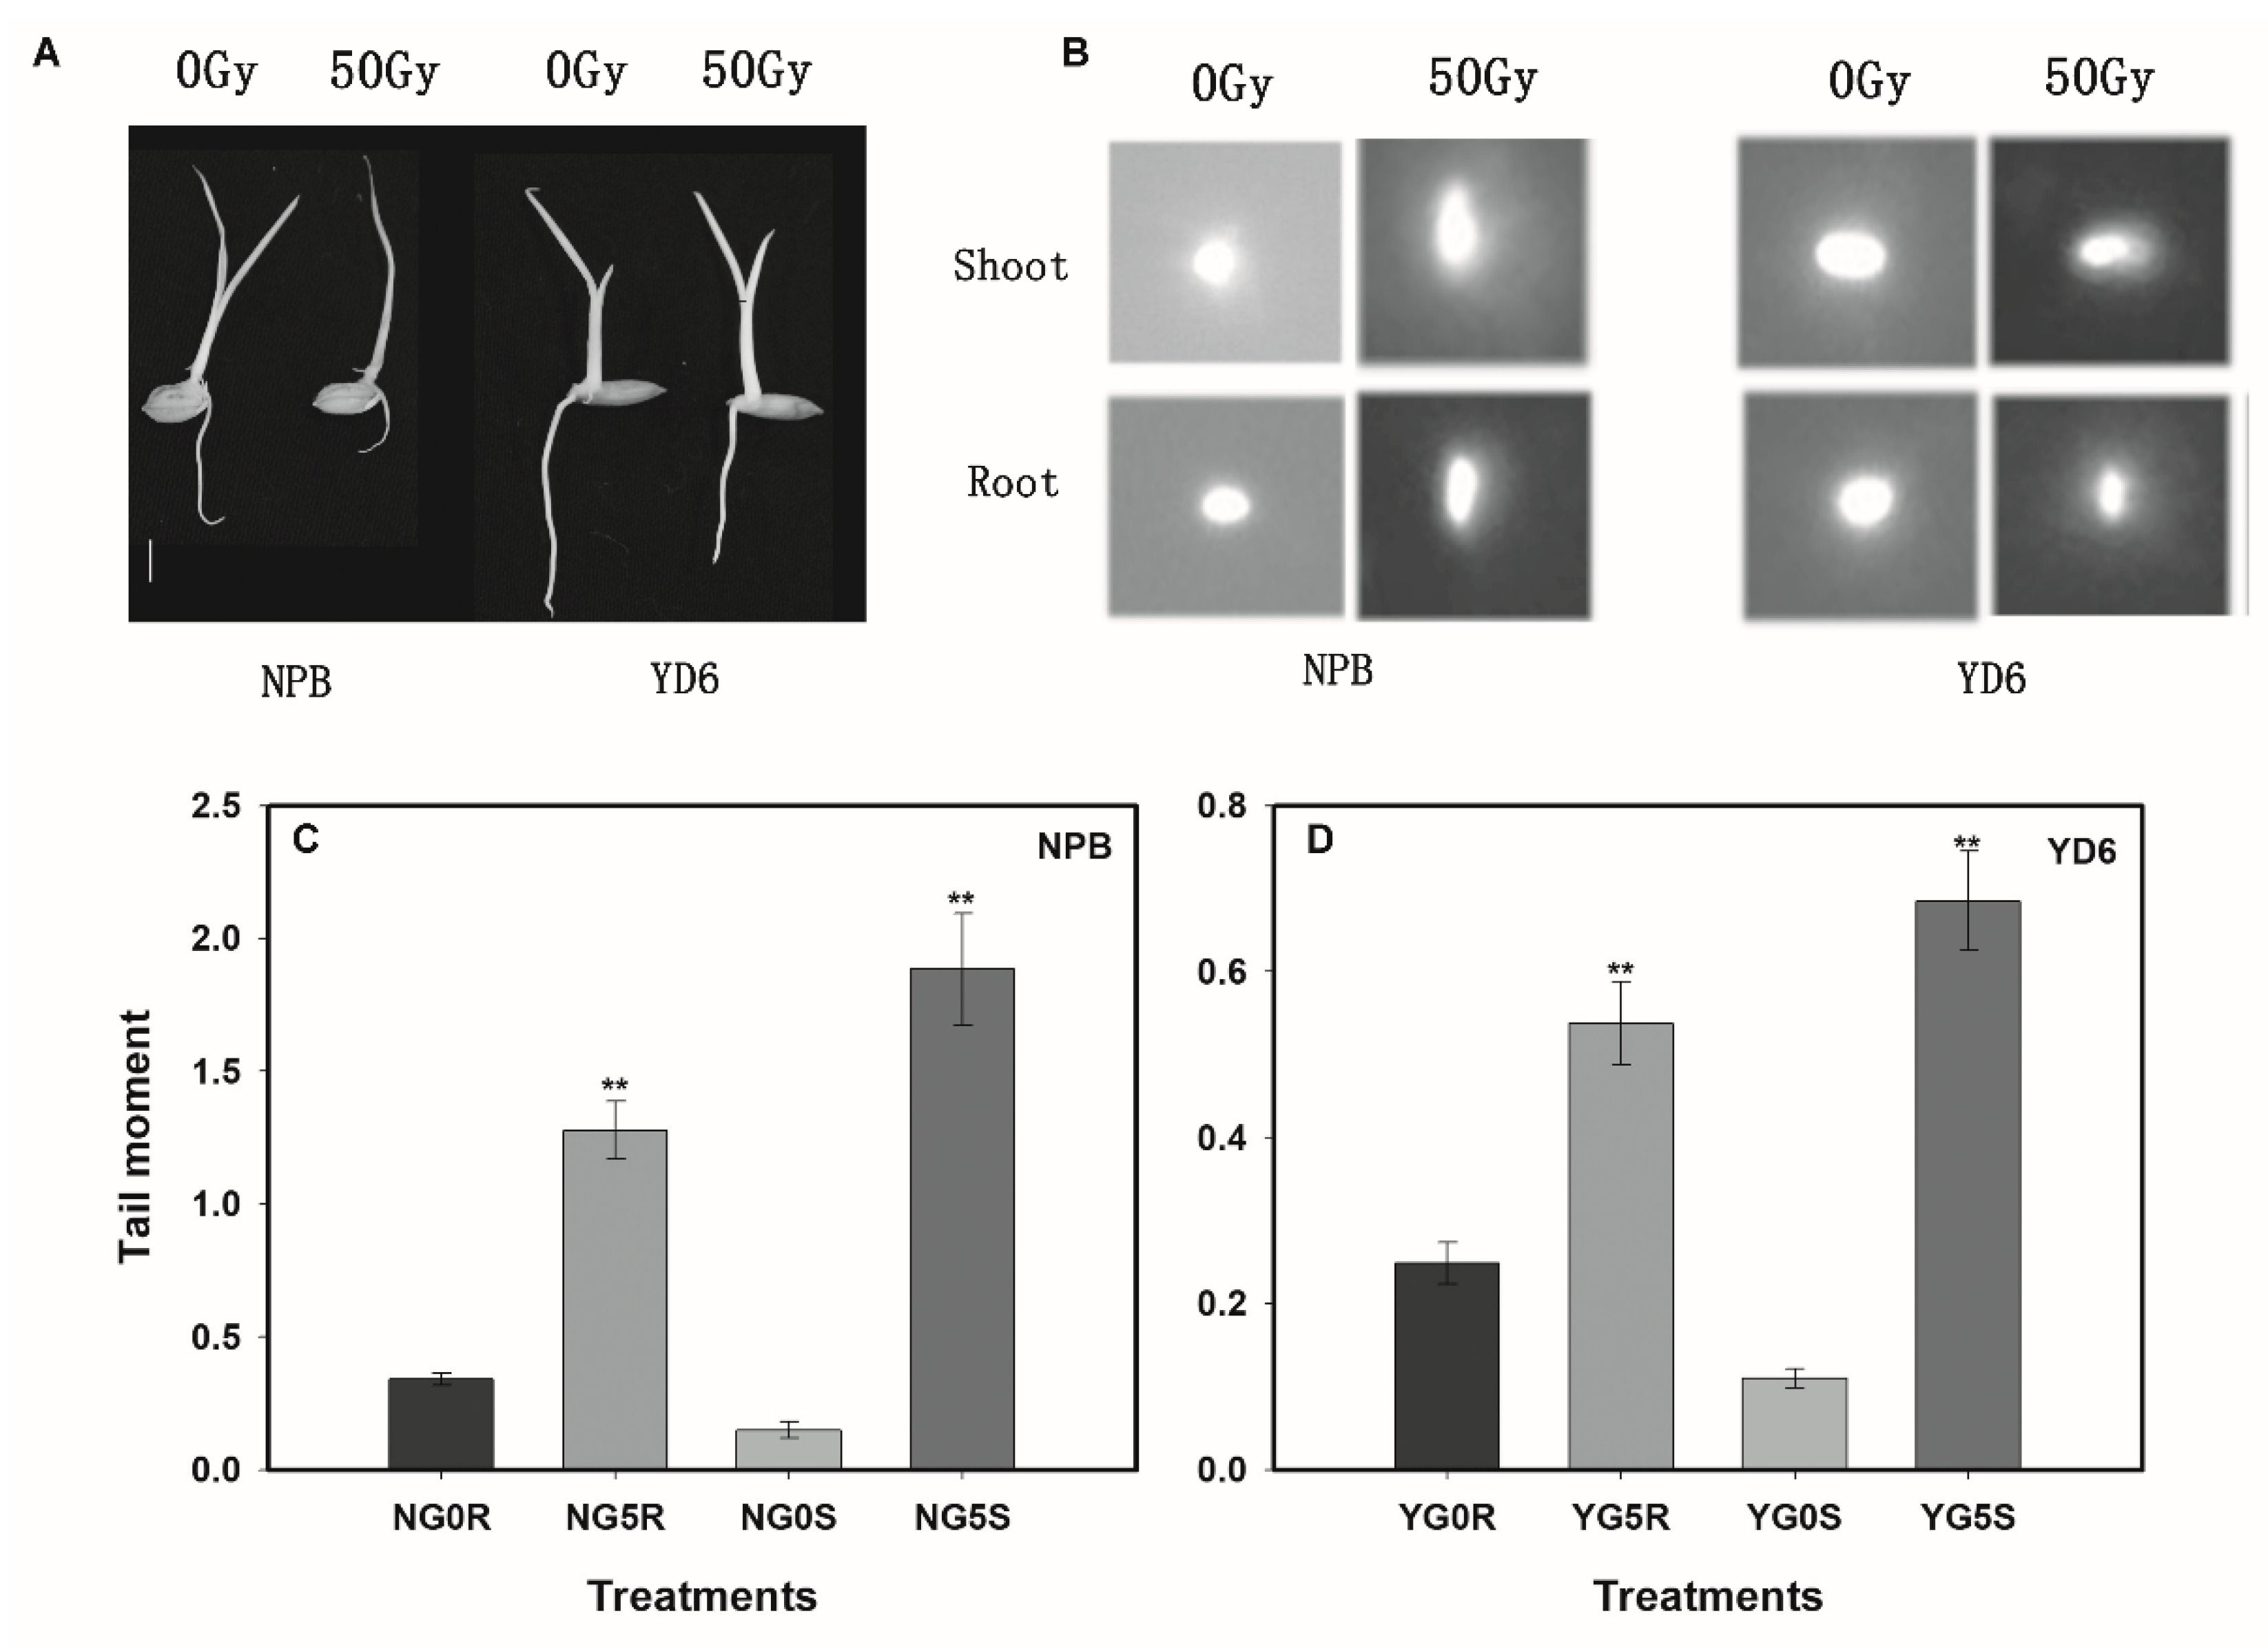
2.3. More Extensive DNA Damage Incurred in NPB than in YD6 Even under a Low Dose Irradiation
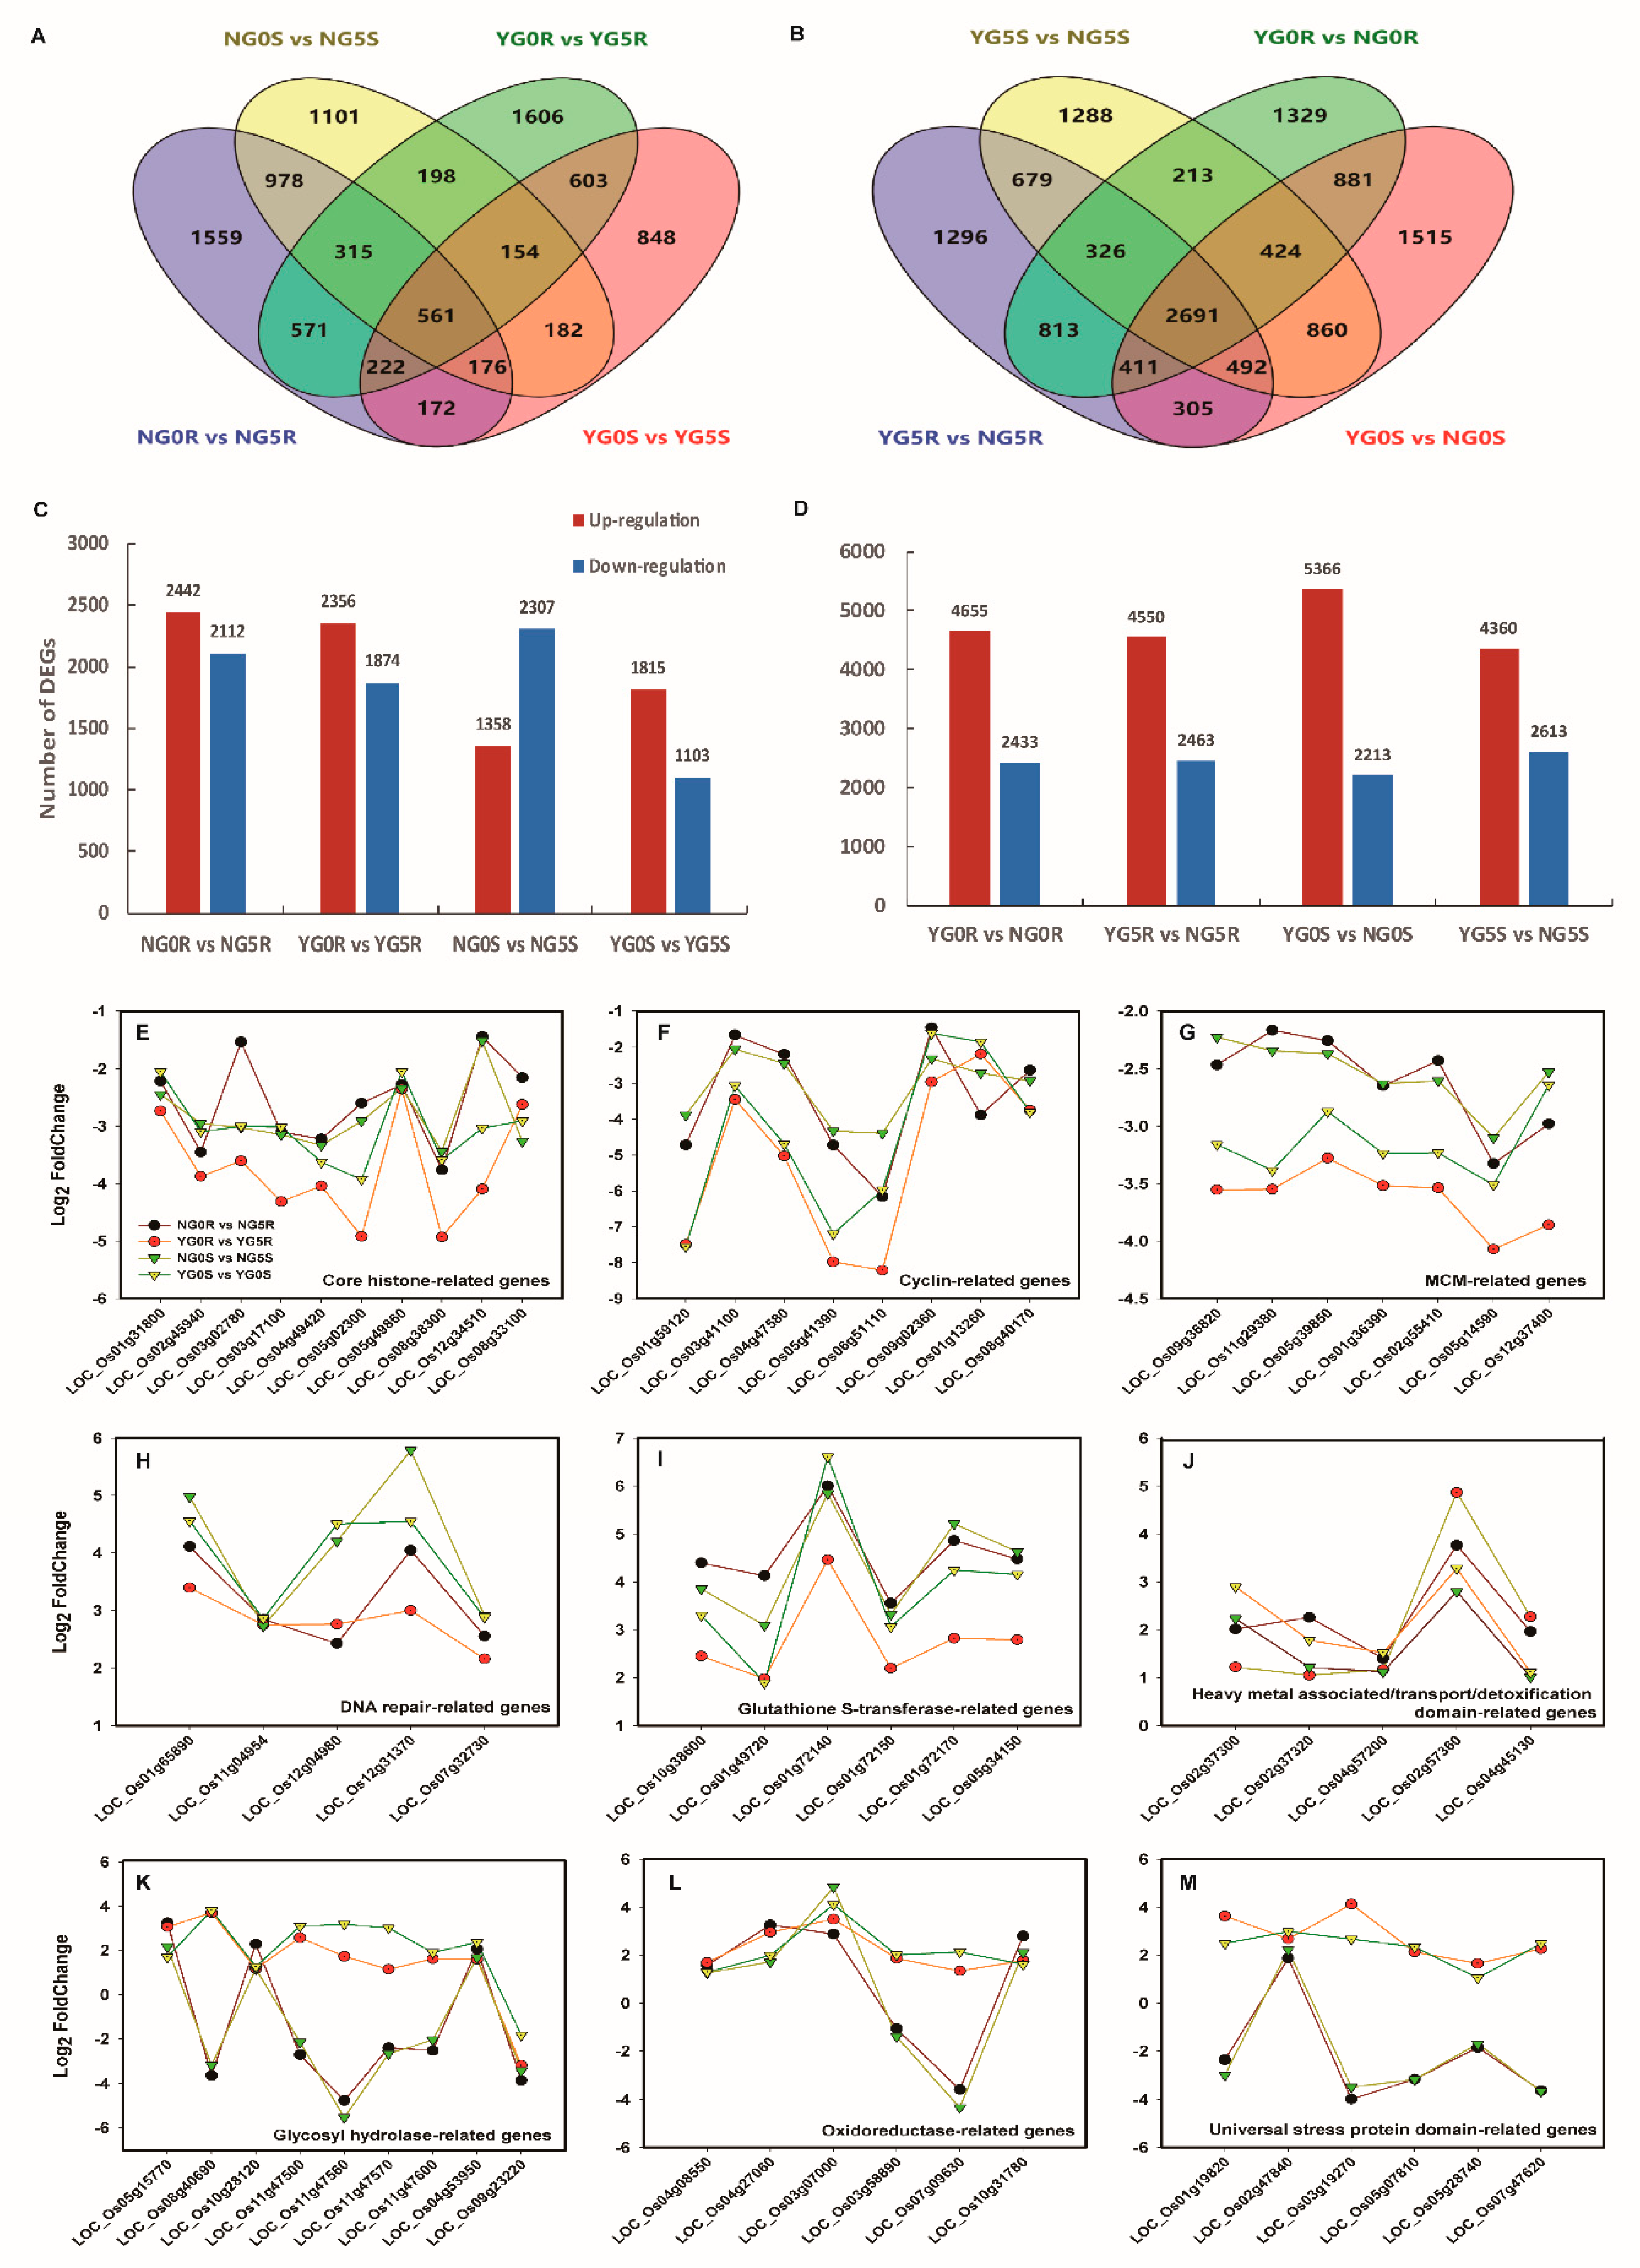
2.4. RNA Sequencing Analysis on Shoot and Root of NPB and YD6
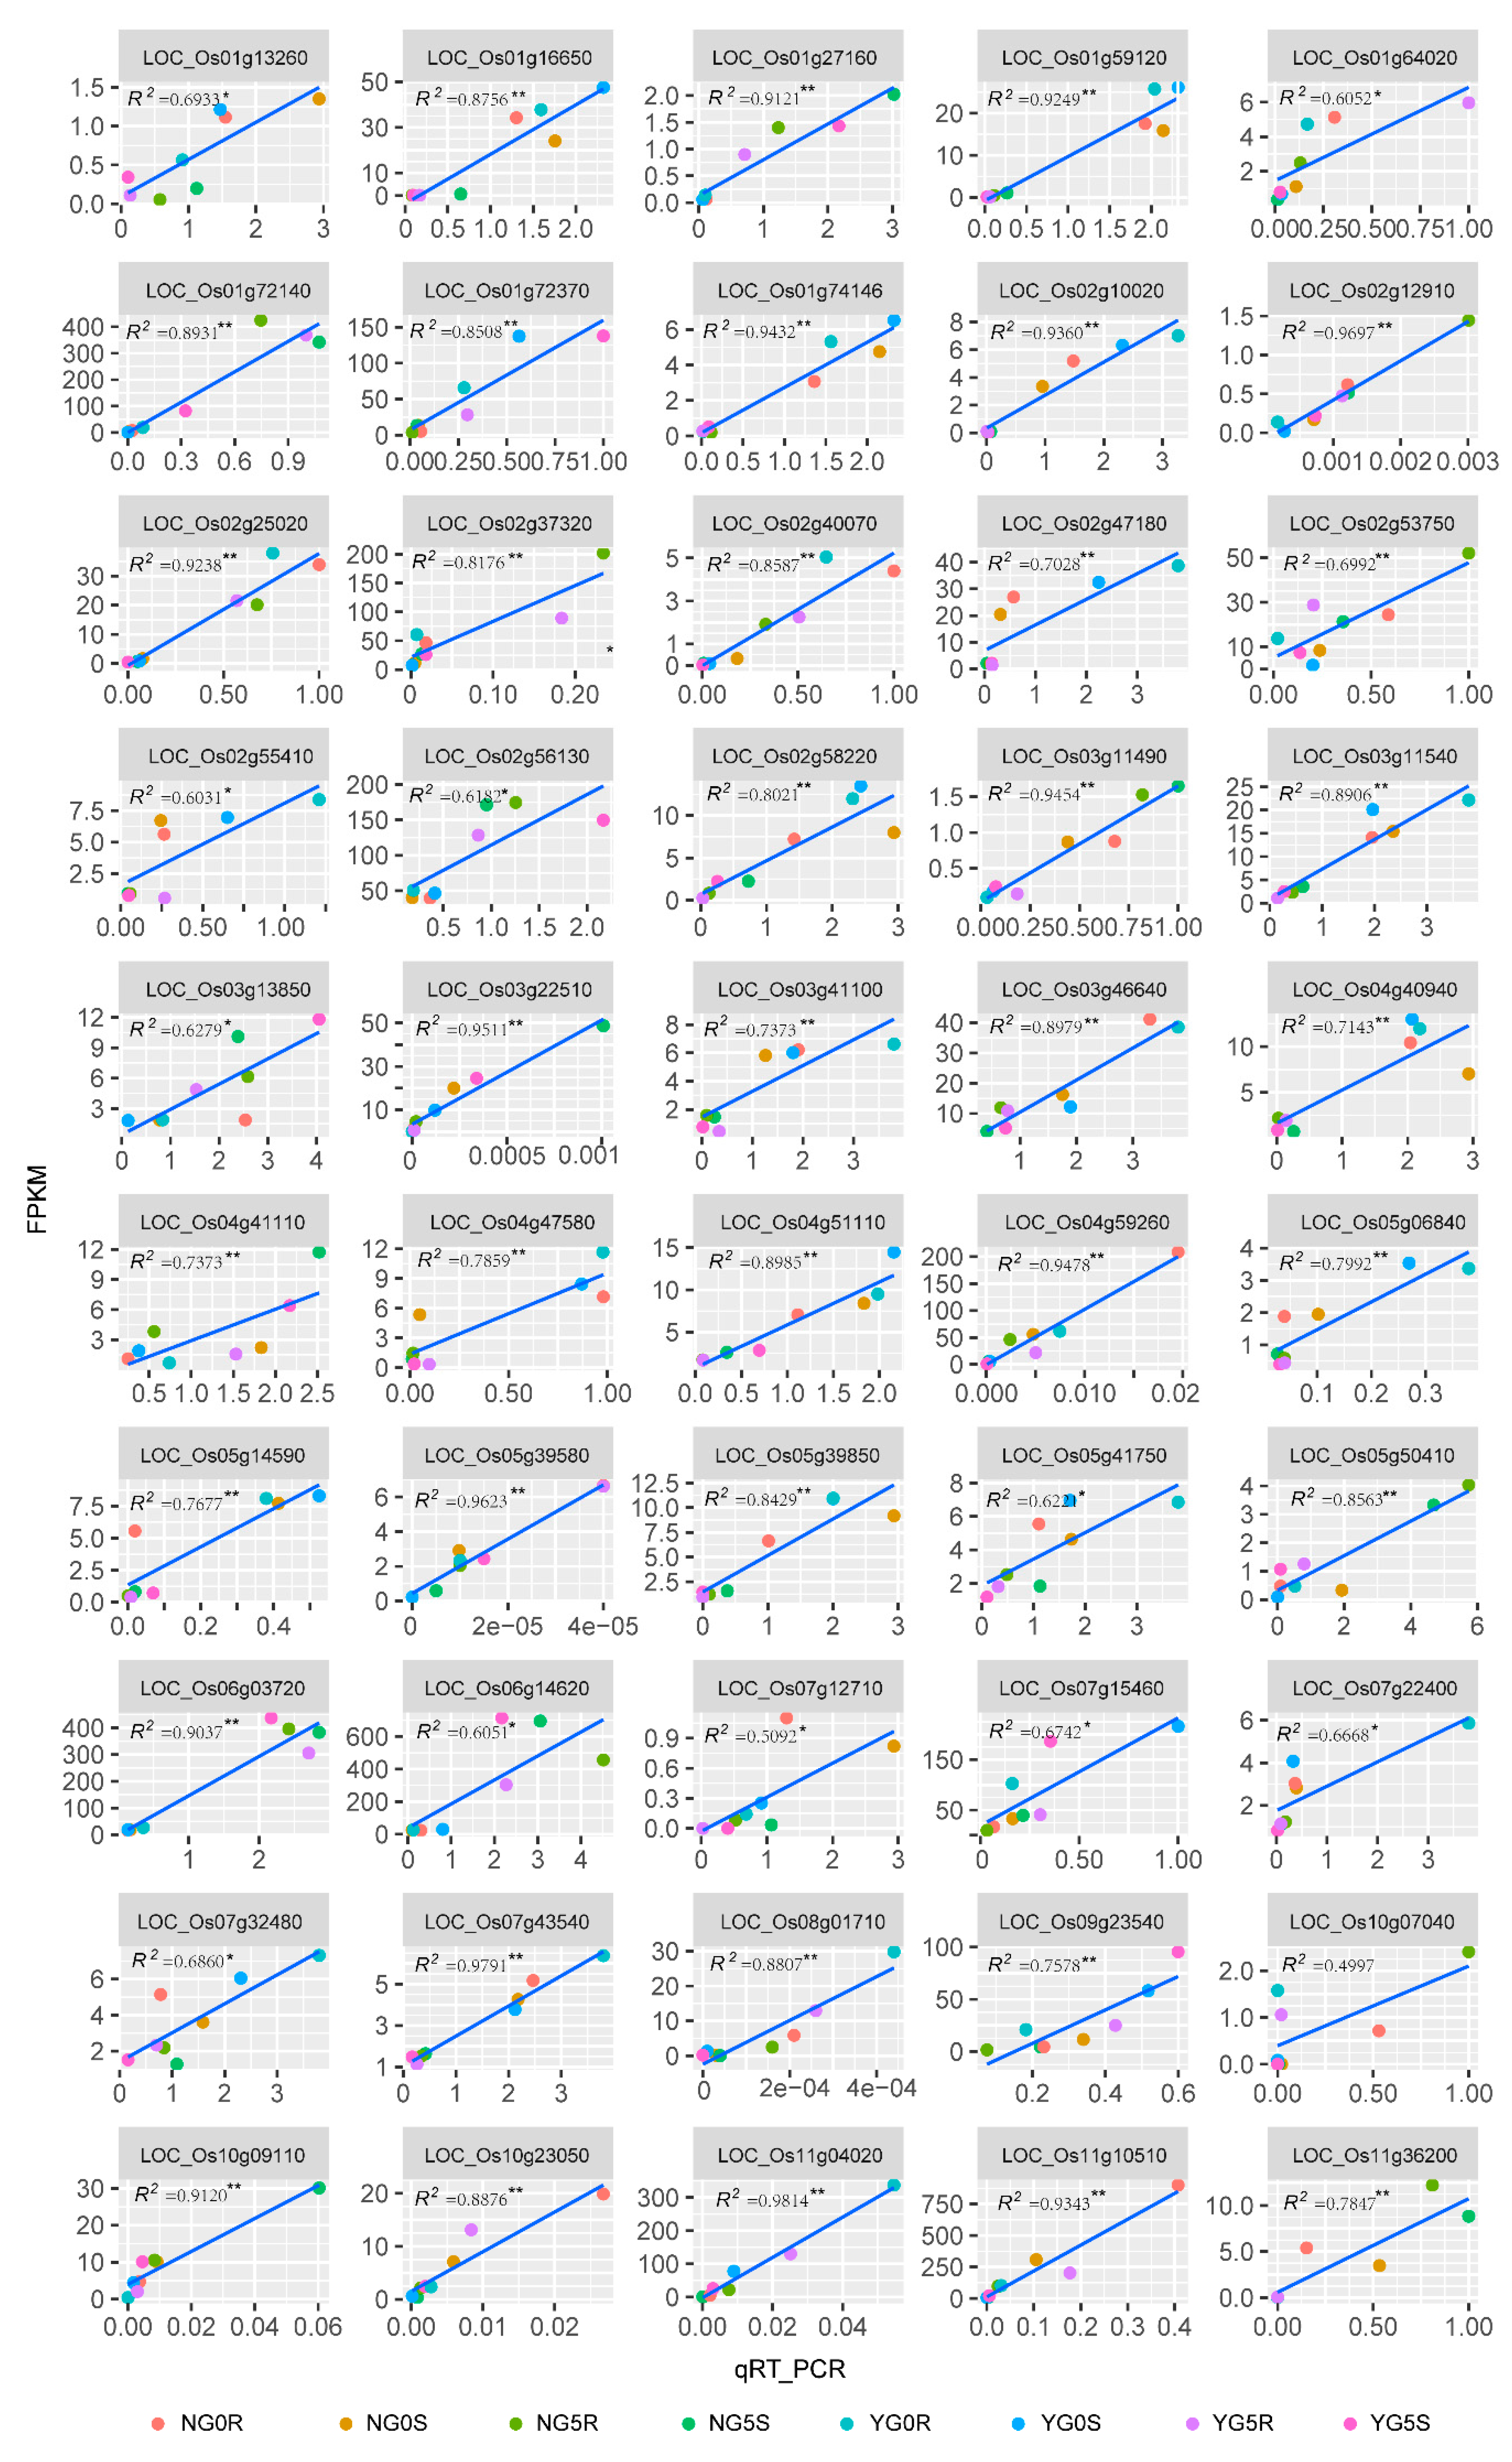
2.5. Validation of RNA-Seq Data by Quantitative Real-Time PCR (qRT-PCR)
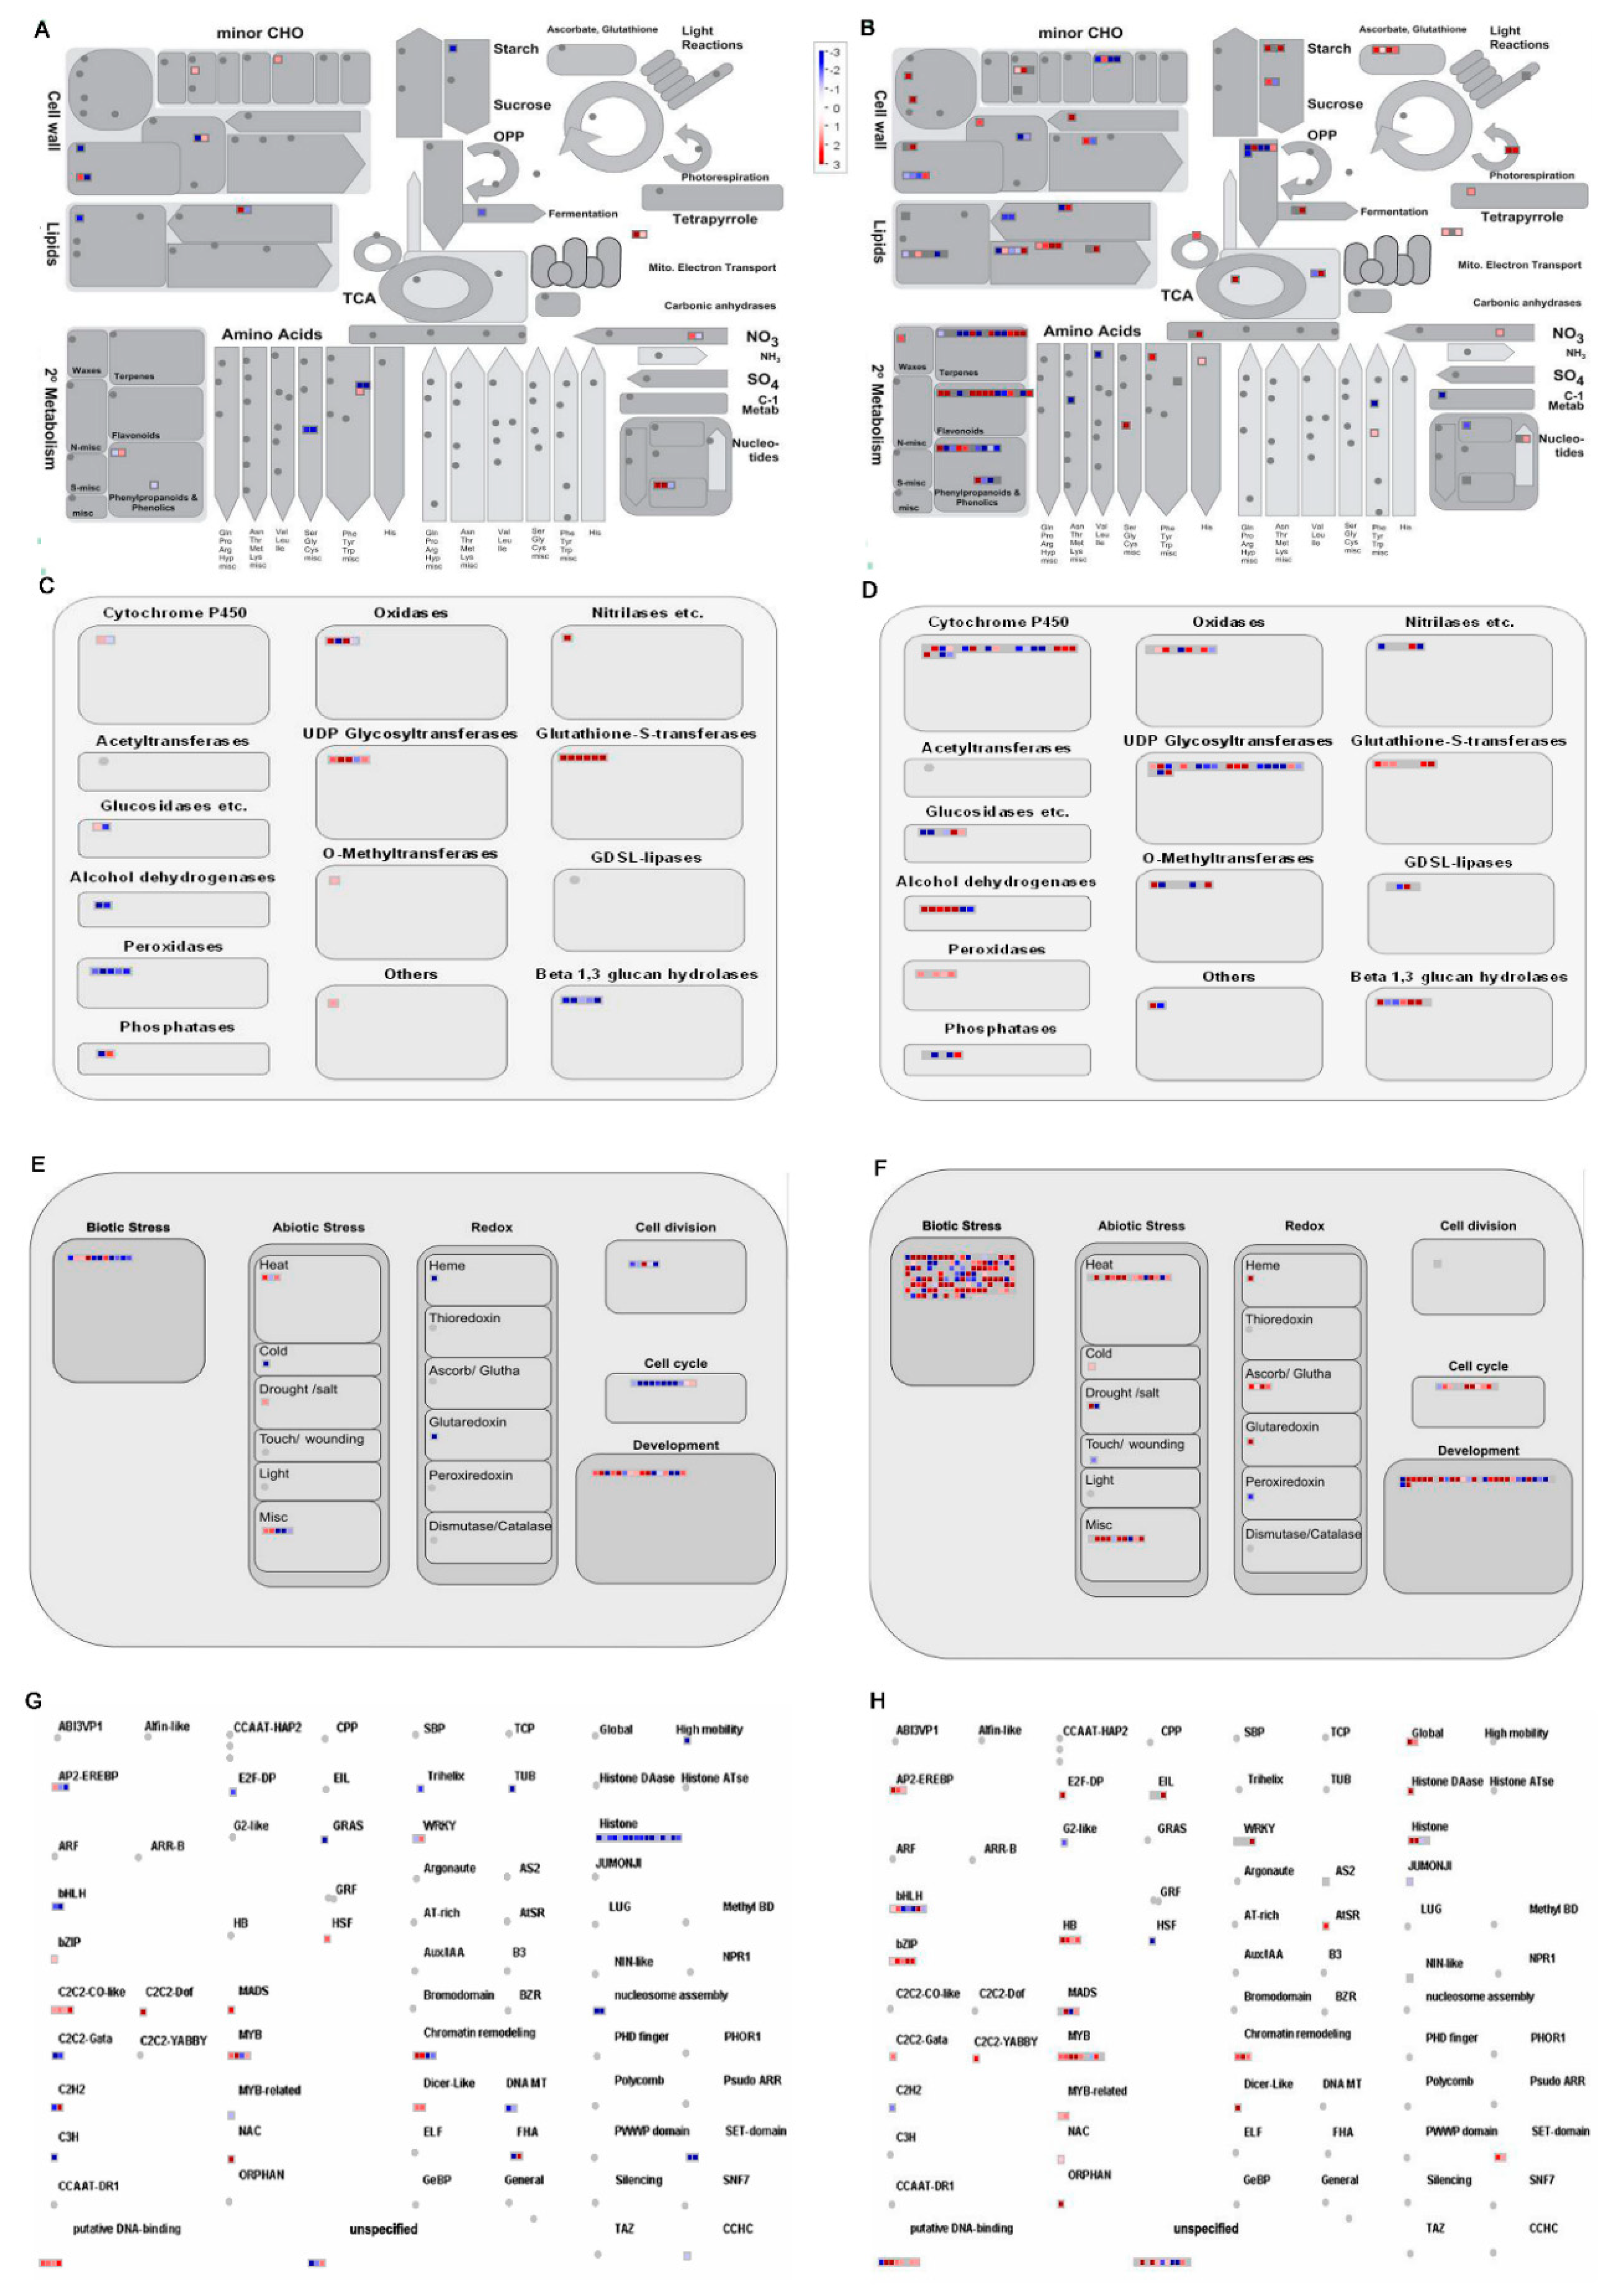
2.6. Gene Ontology (GO) Pathway and MapMan Analysis of DEGs
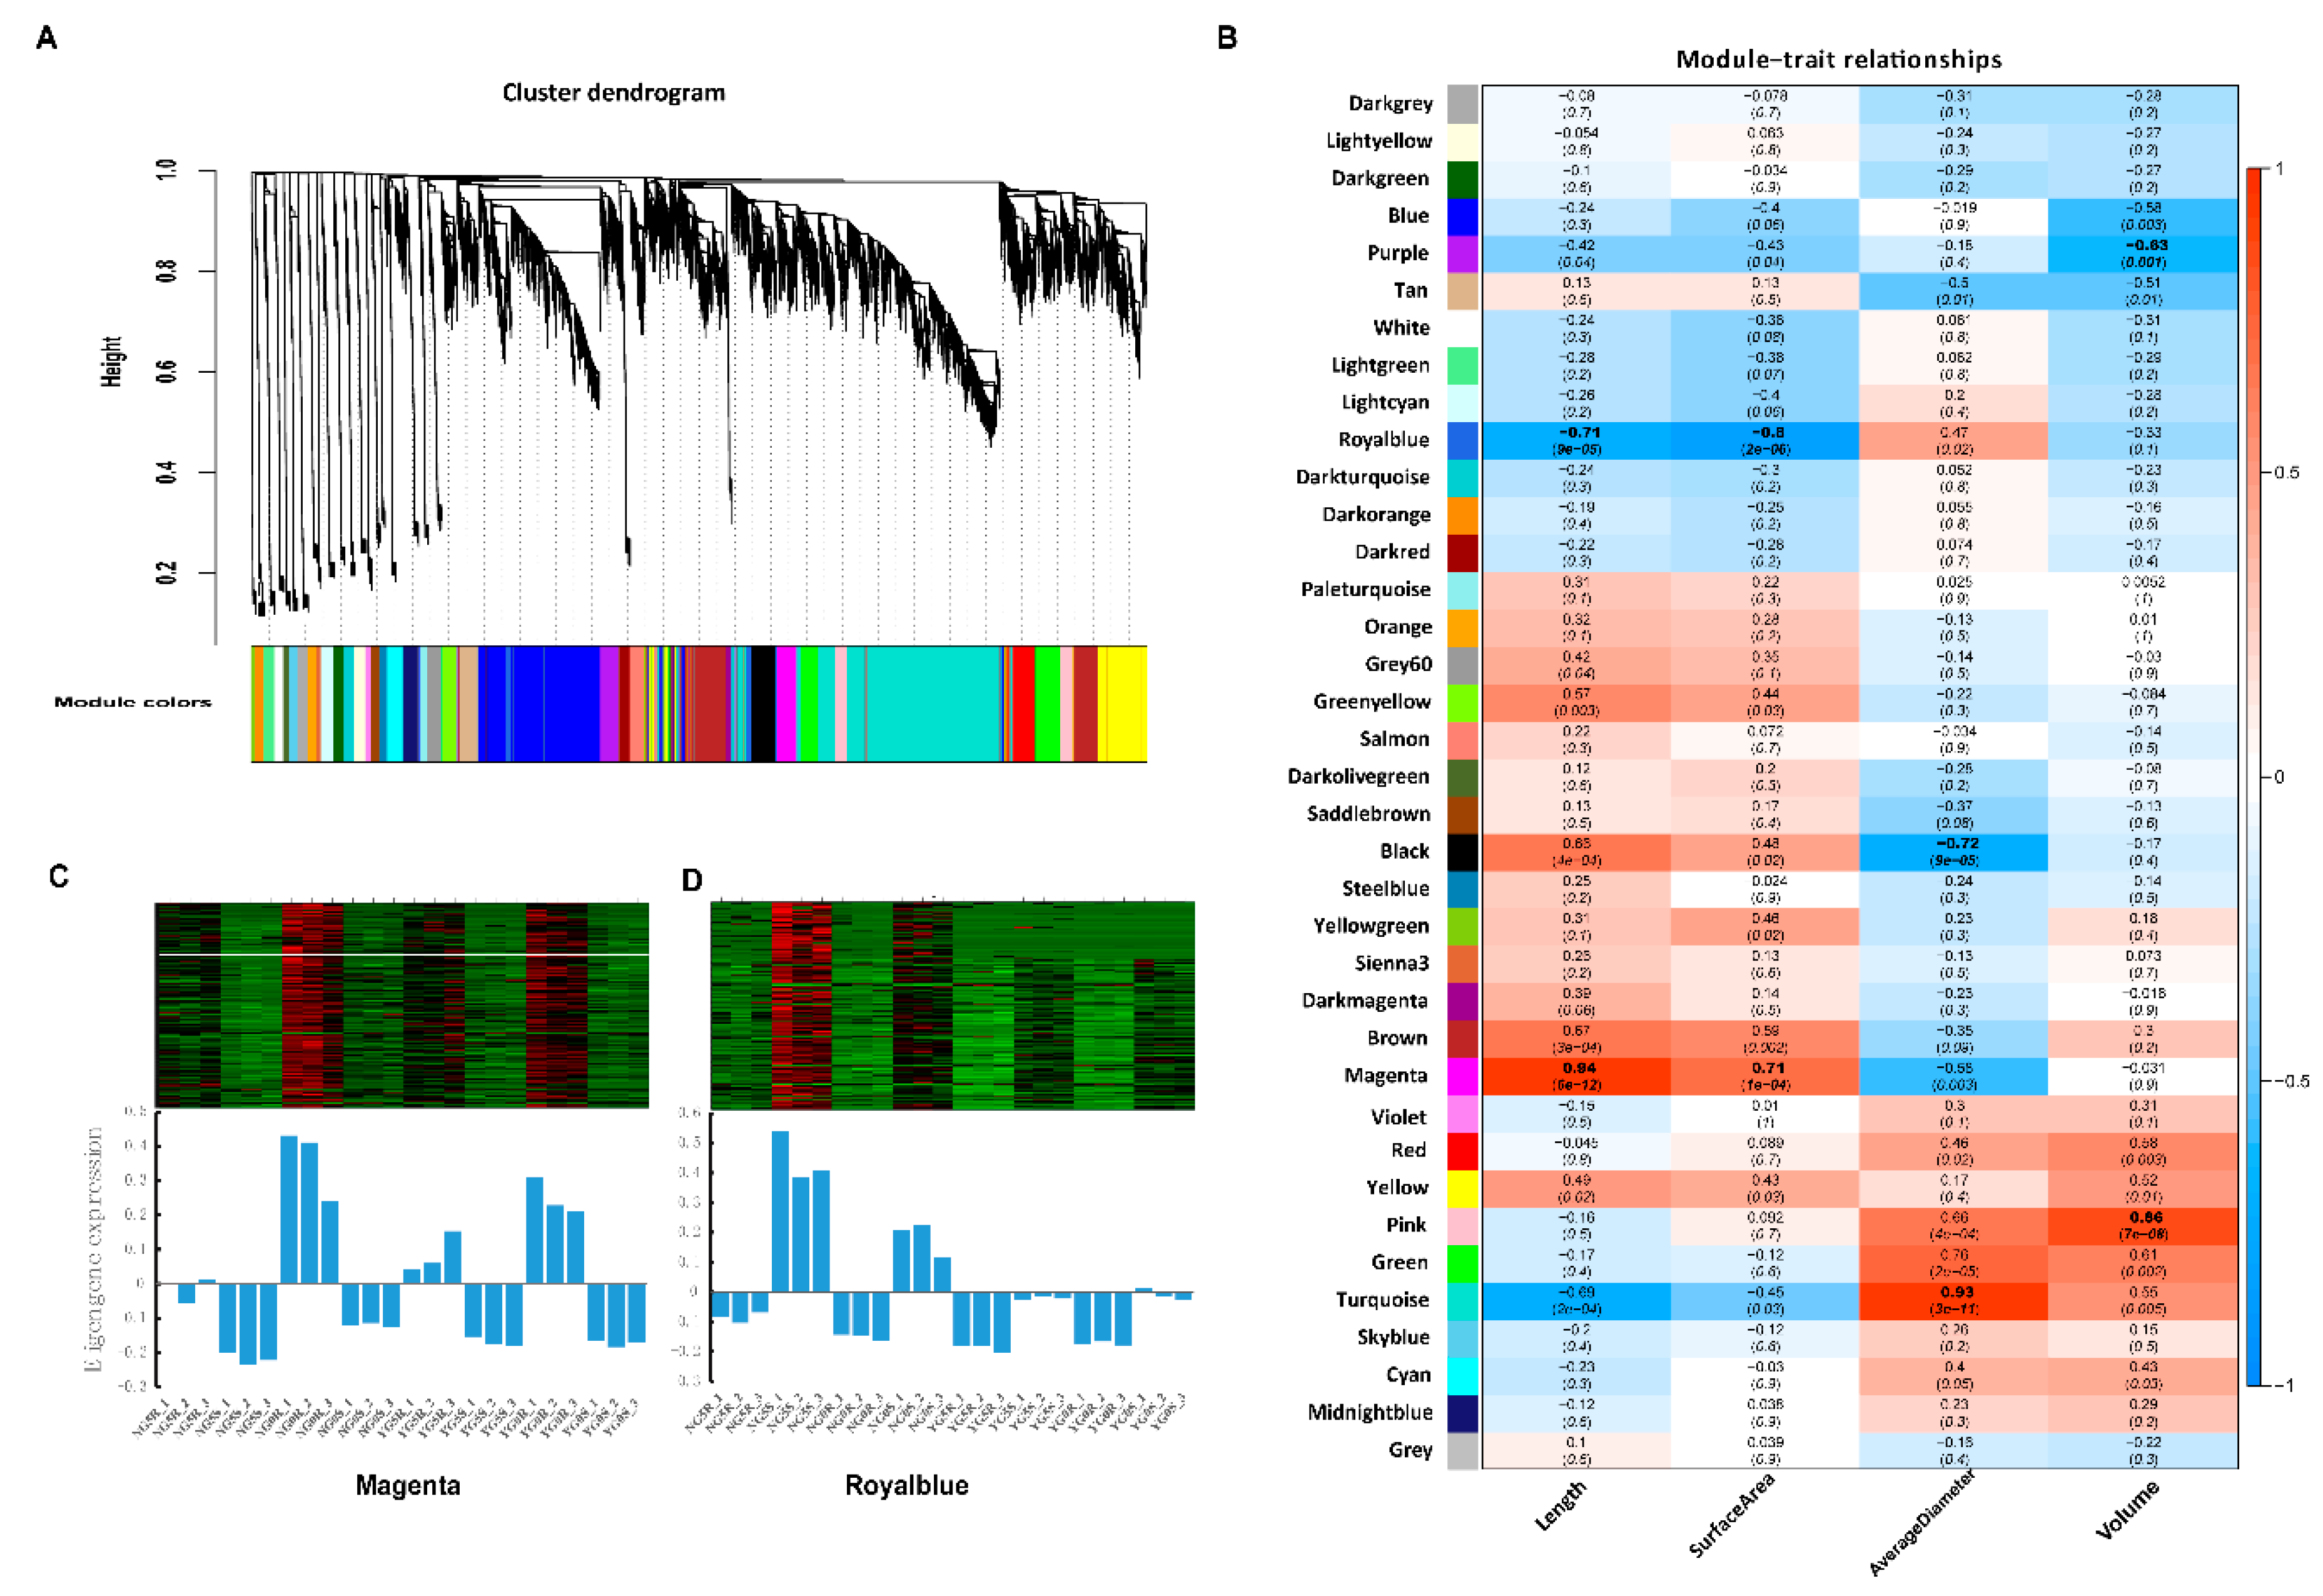
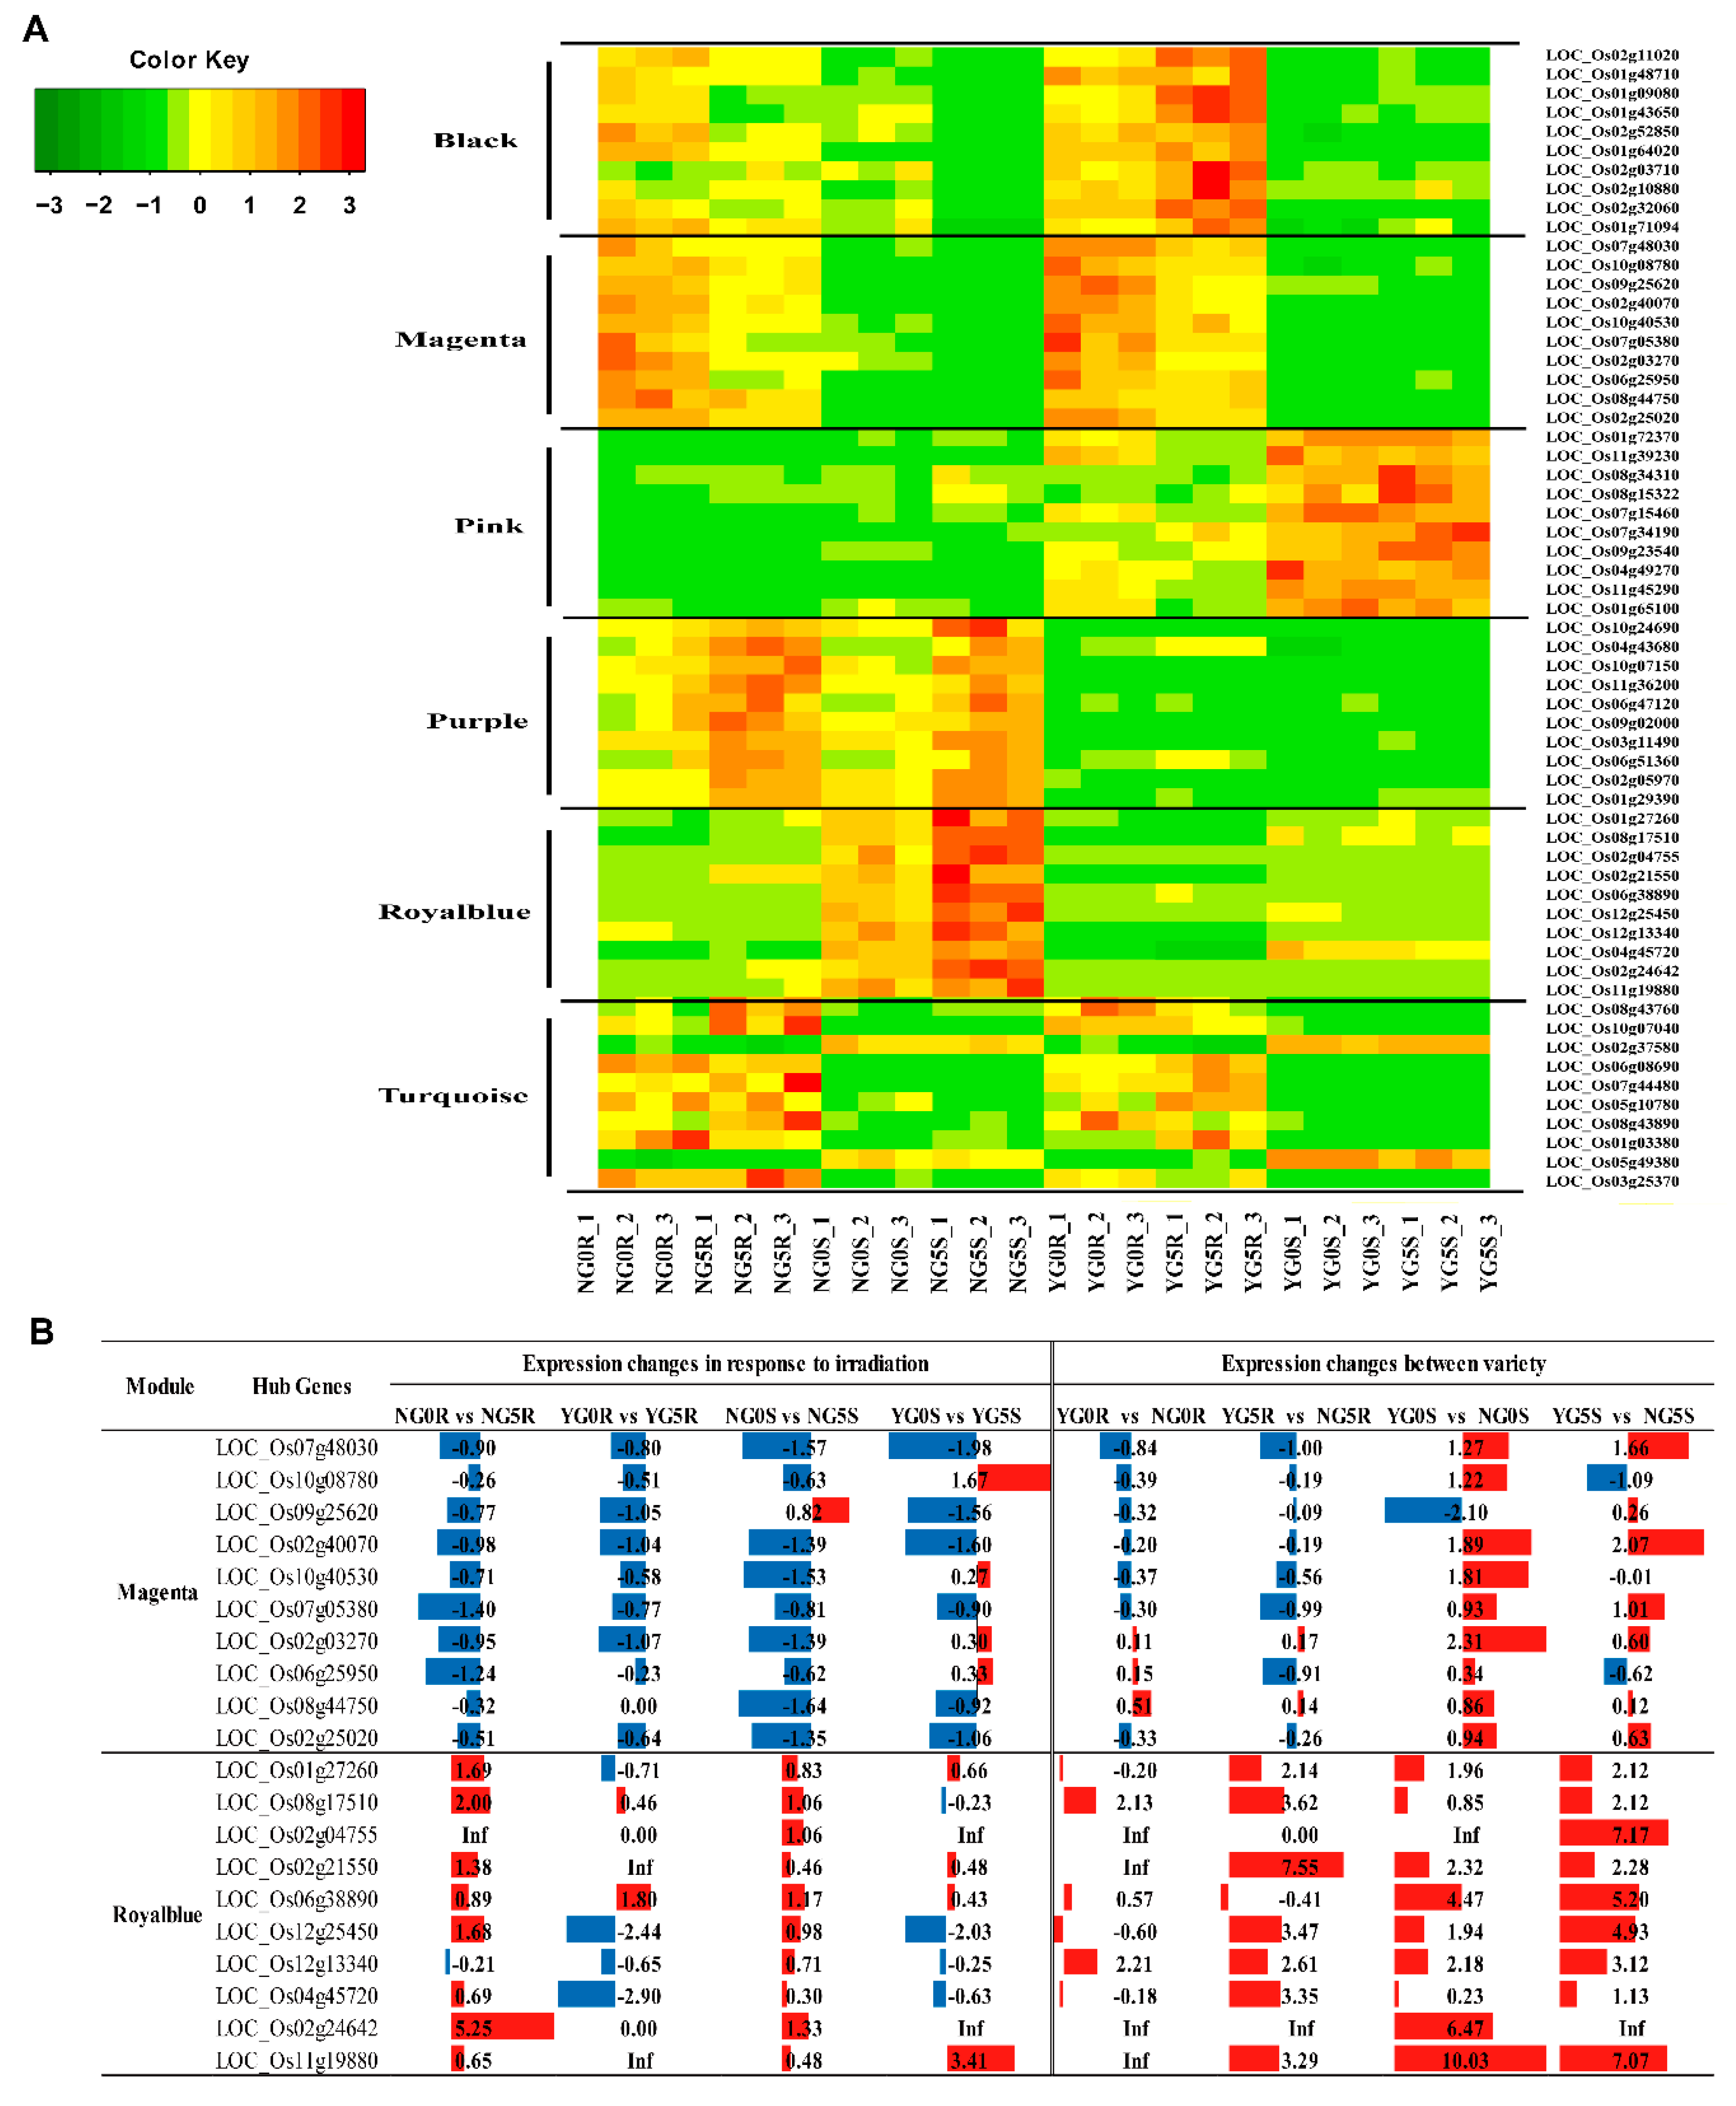
2.7. Weighted Gene Co-Expression Network Analysis (WGCNA) Identifies Candidate Pivotal Modules Associated with Seedling Growth Traits
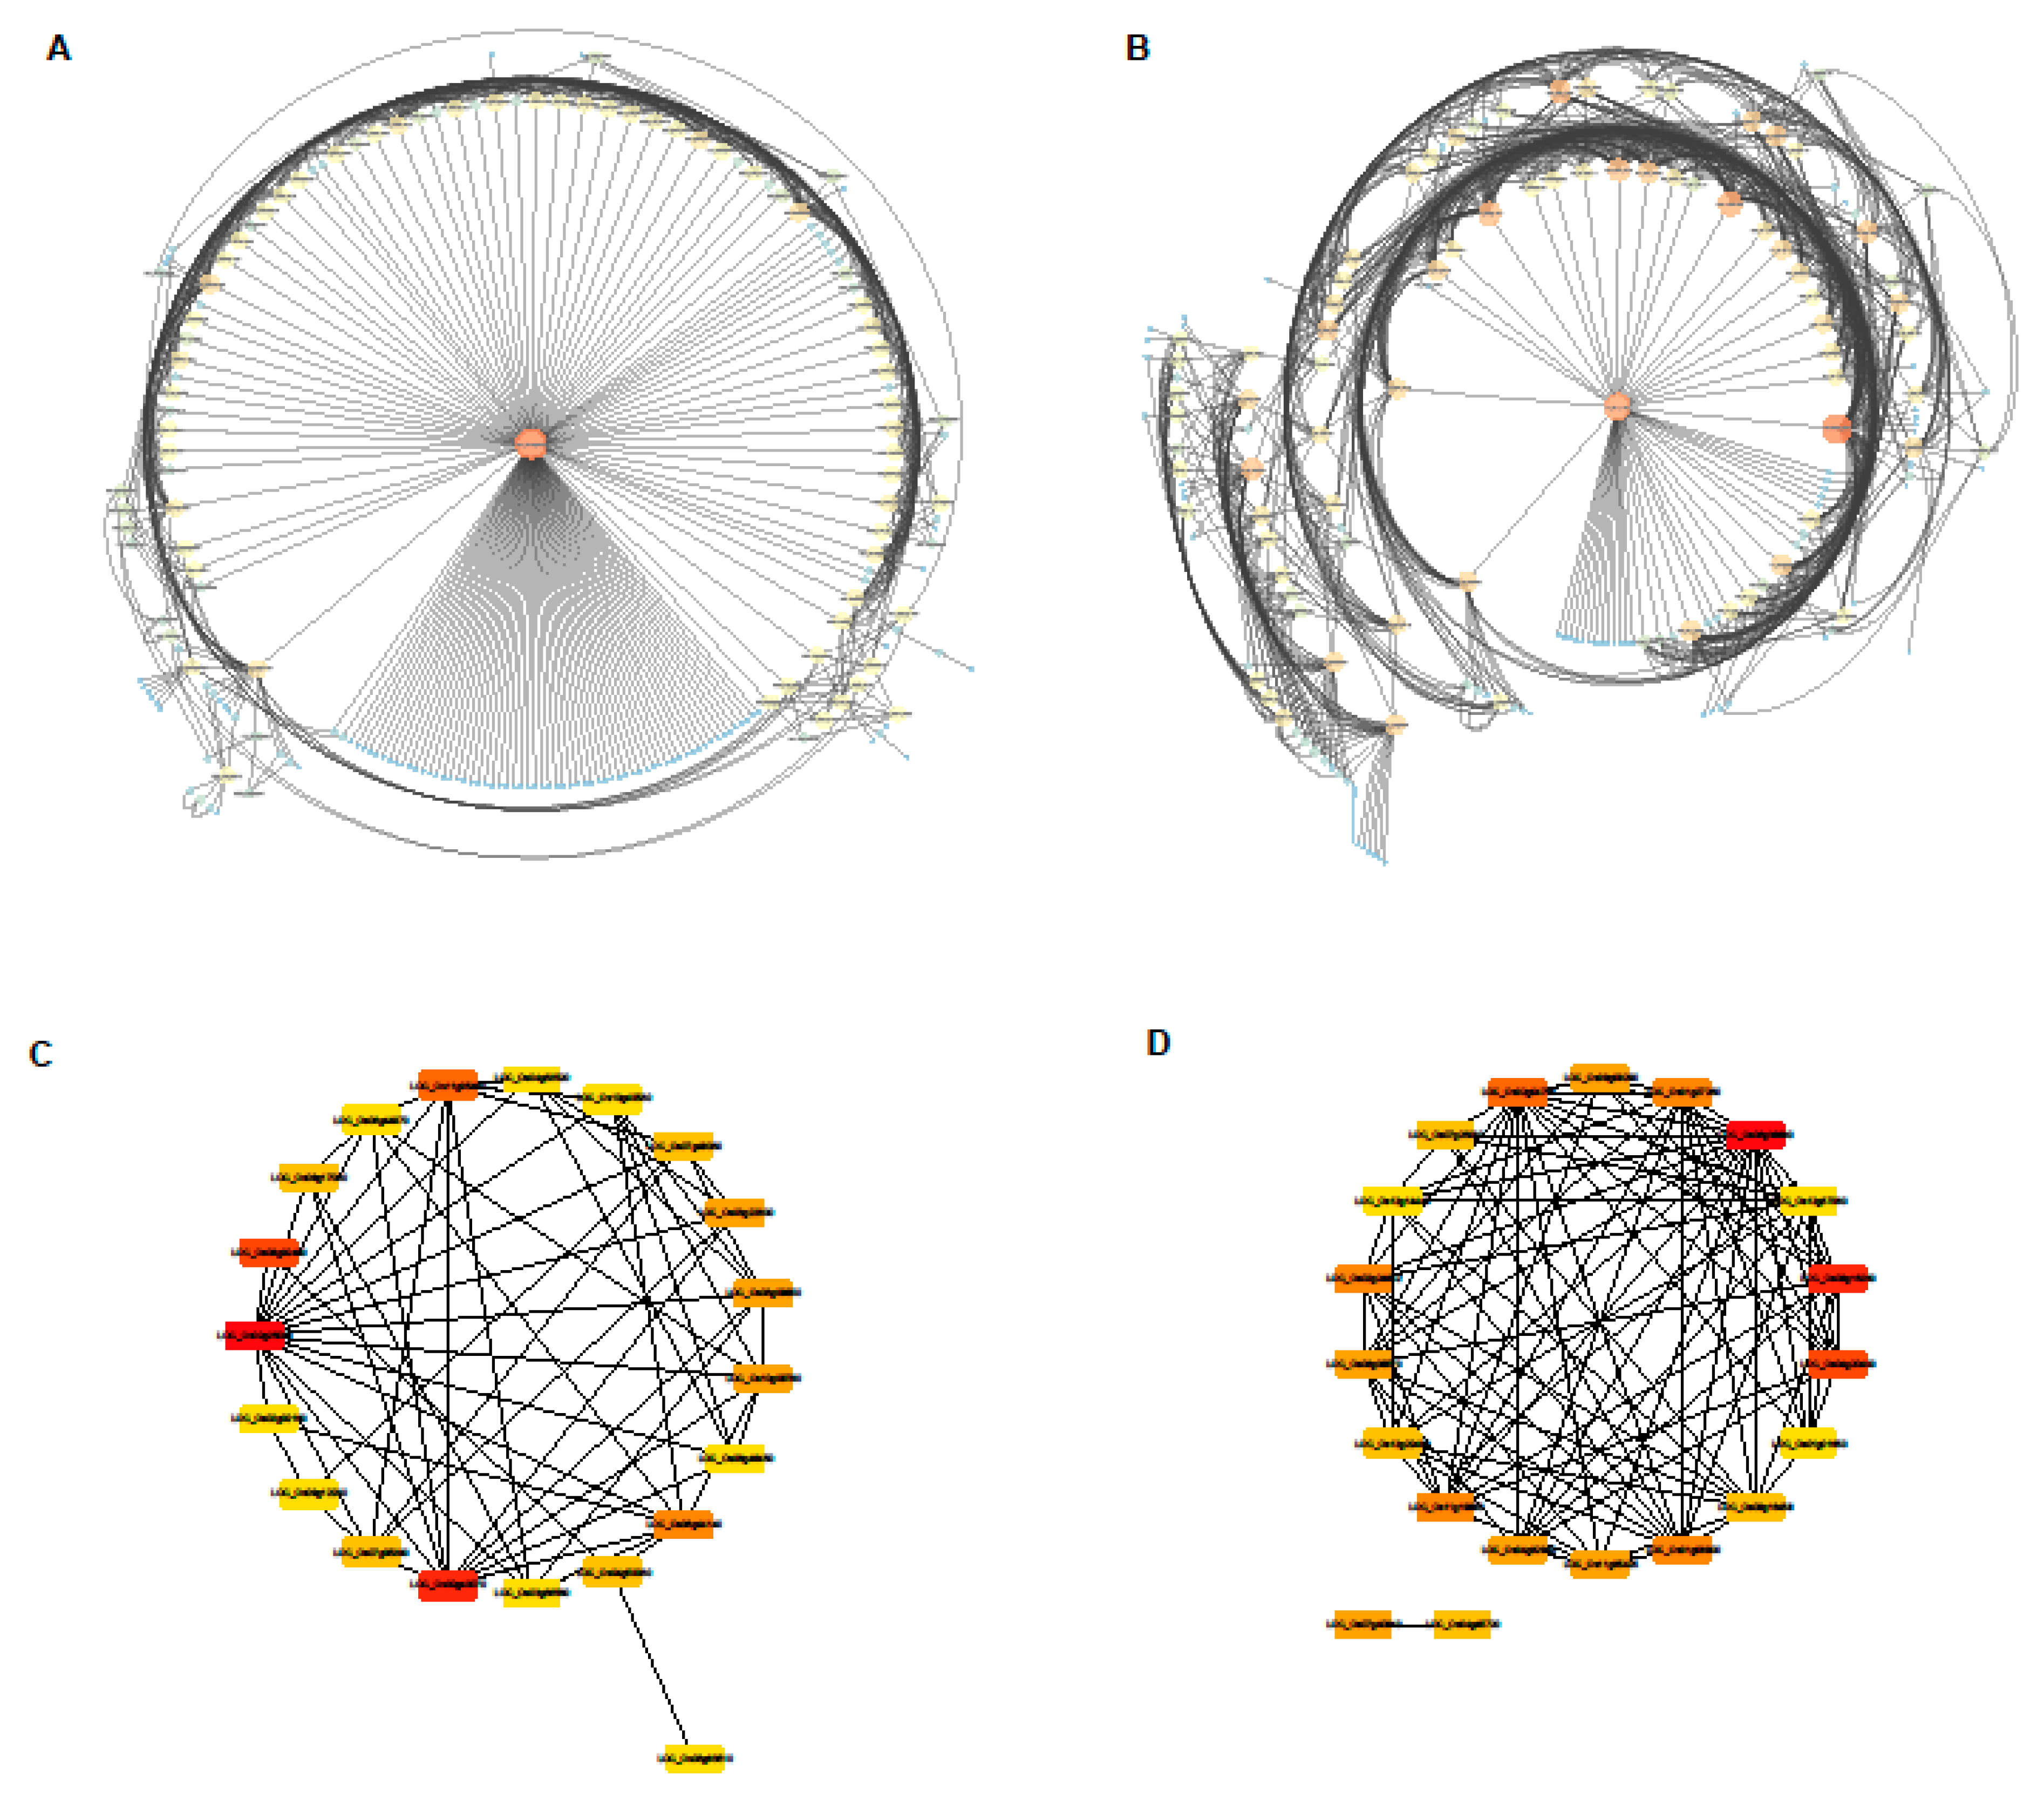
2.8. Construction of the Gene Networks and Establishment of Candidate Hub Genes
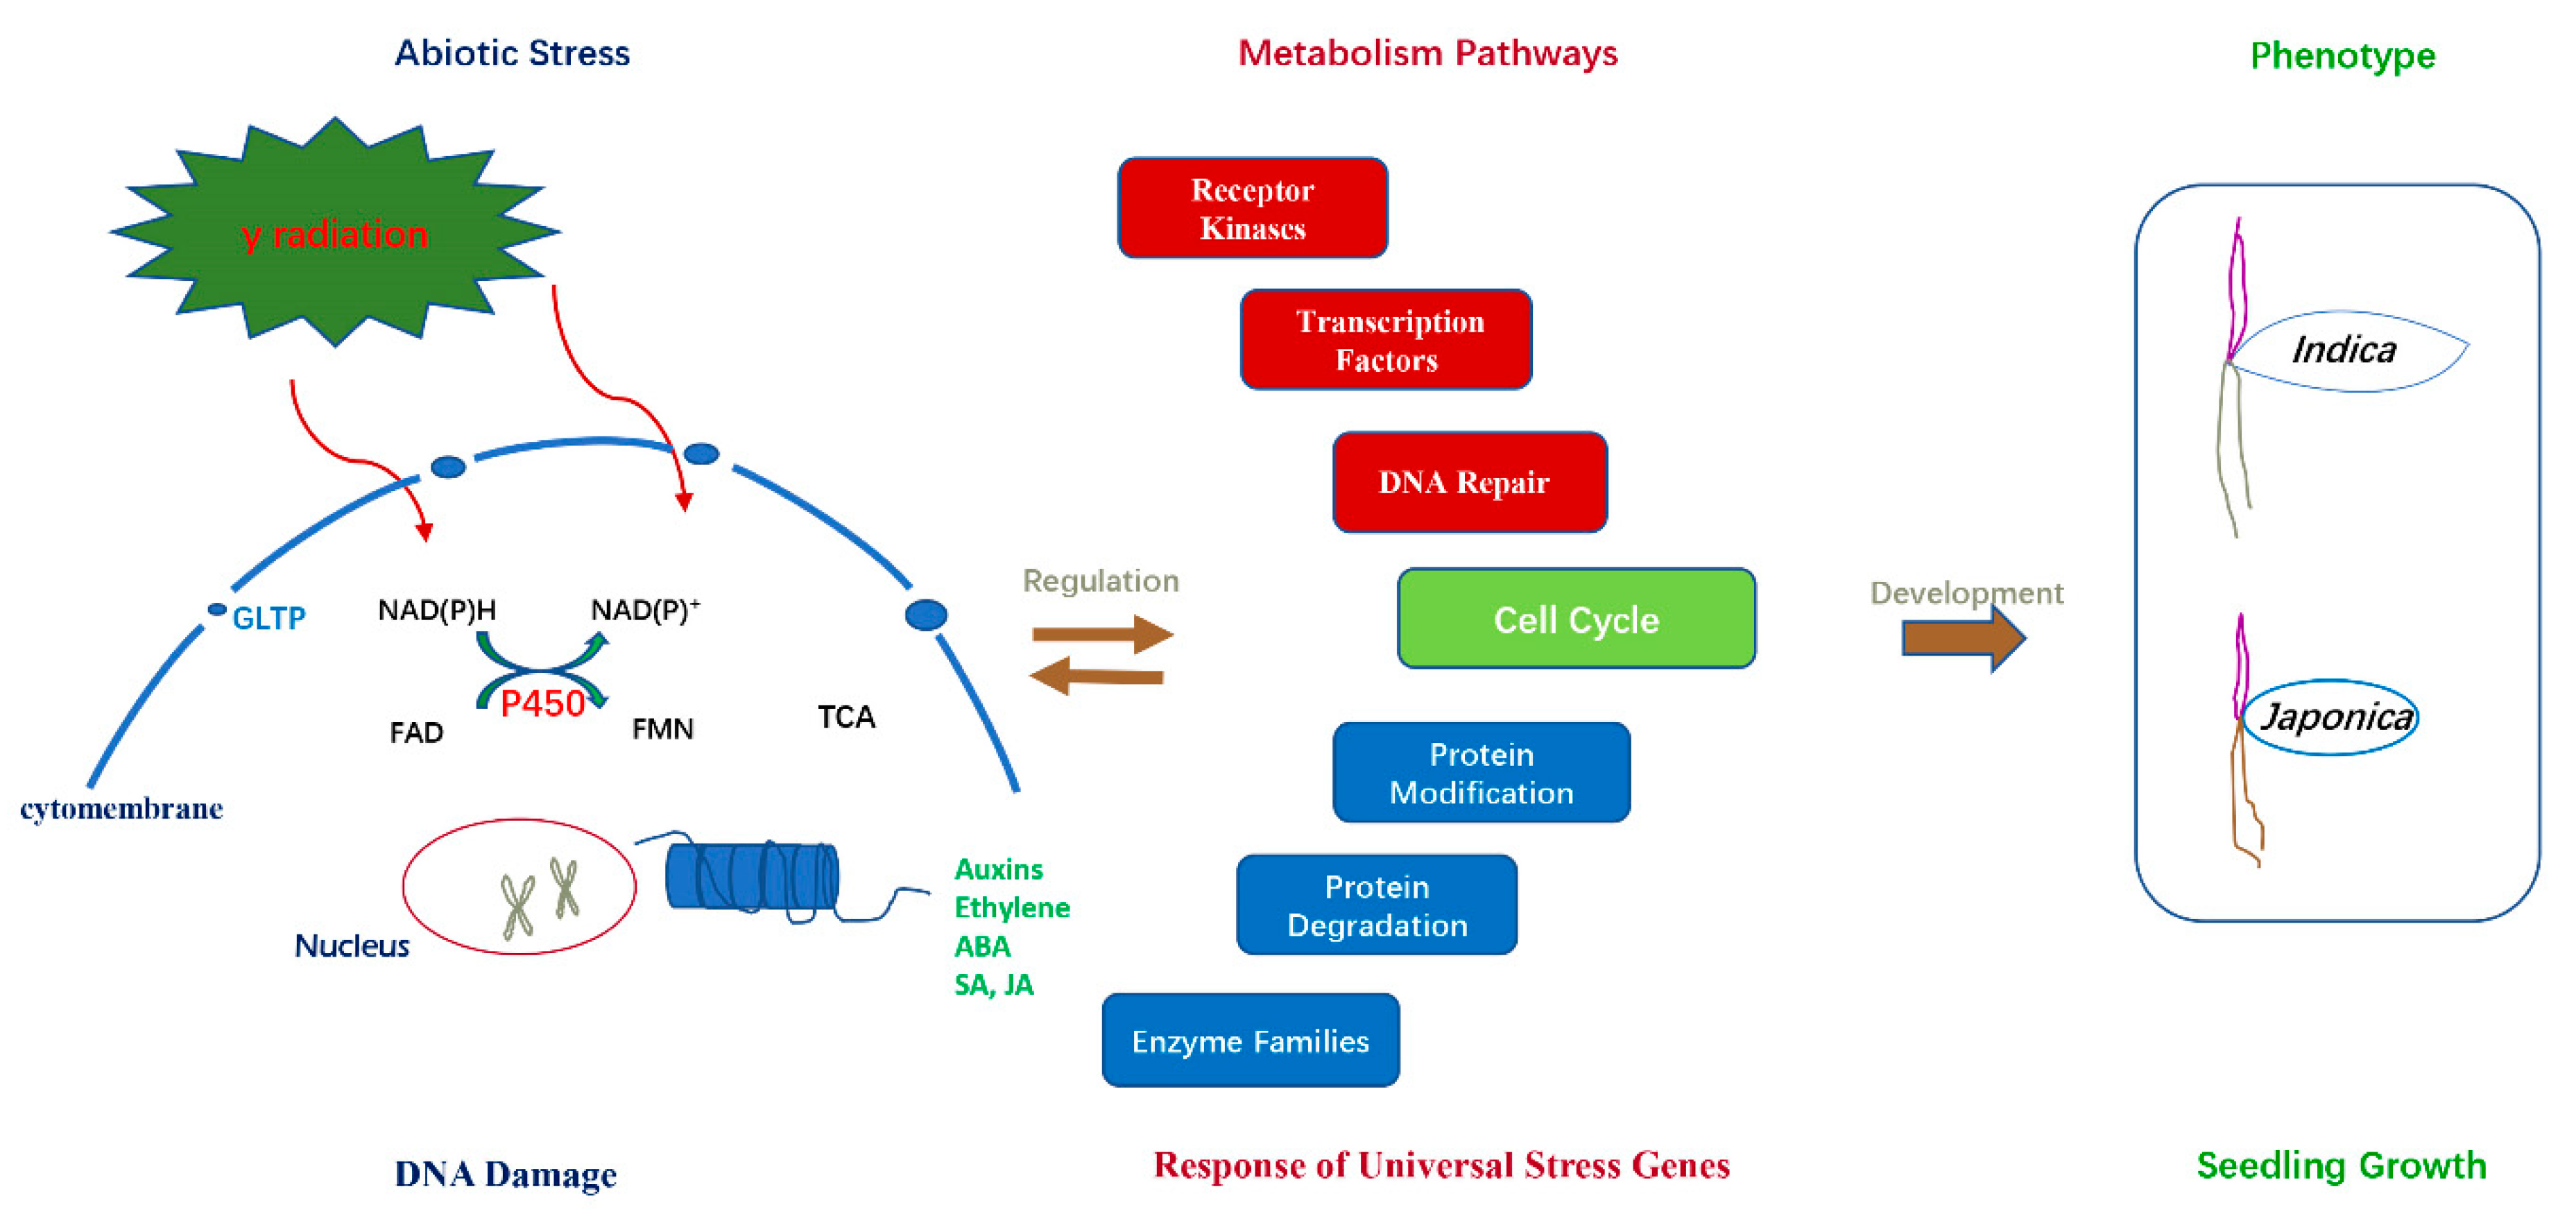
3. Discussion
4. Materials and Methods
4.1. Plant Materials
4.2. Material Treatments and Survey Methods
4.3. Image Scanning of Root and Shoot
4.4. Comet Assay
4.5. Sequencing Sample Preparation and mRNA Library Construction
4.6. Functional Annotation of Transcripts and Mapman Analysis
4.7. Validation of RNA-Seq by Qutantitative RT-PCR Analysis
4.8. Co-Expression Network Analysis for Construction of Modules
5. Conclusions
Supplementary Materials
Author Contributions
Funding
Acknowledgments
Conflicts of Interest
Abbreviations
| CASP | comet assay software project |
| DSBs | double strand breaks |
| DEGs | differentially expressed genes |
| MCM | mini-chromosome maintenance protein |
| FPKM | fragments per kilo-base per million reads |
| GO | gene ontology |
| KEGG | Kyoto encyclopedia of genes and genomes |
| RNA-Seq | RNA-sequencing |
| qRT-PCR | quantitative real-time polymerase chain reaction |
| UDP | uridine diphosphate |
References
- Zhu, K.; Min, C.; Xia, H.; Yang, Y.; Wang, B.; Chen, K. Characterisation of Indica Special Protein (ISP), a Marker Protein for the Differentiation of Oryza sativa Subspecies indica and japonica. Int. J. Mol. Sci. 2014, 15, 7332–7343. [Google Scholar] [CrossRef]
- Yuan, Y.; Zhang, Q.; Zeng, S.; Gu, L.; Si, W.; Zhang, X.; Tian, D.; Yang, S.; Wang, L. Selective sweep with significant positive selection serves as the driving force for the differentiation of japonica and indica rice cultivars. BMC Genom. 2017, 18, 307. [Google Scholar] [CrossRef]
- Sun, X.; Jia, Q.; Guo, Y.; Zheng, X.; Liang, K. Whole-genome analysis revealed the positively selected genes during the differentiation of indica and temperate japonica rice. PLoS ONE 2015, 10, e0119239. [Google Scholar] [CrossRef]
- Yang, Y.; Keming, Z.; Hengchuan, X.; Liang, C.; Keping, C. Comparative proteomic analysis of indica and japonica rice varieties. Genet. Mol. Biol. 2014, 37, 652–661. [Google Scholar] [CrossRef]
- Macovei, A.; Garg, B.; Raikwar, S.; Balestrazzi, A.; Carbonera, D.; Buttafava, A.; Bremont, J.F.J.; Gill, S.S.; Tuteja, N. Synergistic exposure of rice seeds to different doses of γ-ray and salinity stress resulted in increased antioxidant enzyme activities and gene-specific modulation of TC-NER pathway. BioMed Res. Int. 2014, 2014, 676934. [Google Scholar] [CrossRef]
- Wi, S.G.; Chung, B.Y.; Kim, J.-S.; Kim, J.-H.; Baek, M.-H.; Lee, J.-W.; Kim, Y.S. Effects of gamma irradiation on morphological changes and biological responses in plants. Micron 2007, 38, 553–564. [Google Scholar] [CrossRef]
- Han, J.; Won, E.J.; Lee, B.Y.; Hwang, U.K.; Kim, I.C.; Yim, J.H.; Leung, K.M.; Lee, Y.S.; Lee, J.S. Gamma rays induce DNA damage and oxidative stress associated with impaired growth and reproduction in the copepod Tigriopus japonicus. Aquat. Toxicol. 2014, 152, 264–272. [Google Scholar] [CrossRef]
- Daly, K.; Thompson, K.H. Quantitative Dose-response of Growth and Development in Arabidopsis Thaliana Exposed to Chronic Gamma-radiation. Int. J. Radiat. Biol. Relat. Stud. Phys. Chem. Med. 1975, 28, 61–66. [Google Scholar] [CrossRef]
- Kovalchuk, O.; Kovalchuk, I.; Titov, V.; Arkhipov, A.; Hohn, B. Radiation hazard caused by the Chernobyl accident in inhabited areas of Ukraine can be monitored by transgenic plants. Mutat. Res. 1999, 446, 49. [Google Scholar] [CrossRef]
- Zaka, R.; Chenal, C.; Misset, M.T. Effects of low doses of short-term gamma irradiation on growth and development through two generations of Pisum sativum. Sci. Total Environ. 2004, 320, 121–129. [Google Scholar] [CrossRef]
- Karran, P. DNA double strand break repair in mammalian cells. Curr. Opin. Genet. Dev. 2000, 10, 144–150. [Google Scholar] [CrossRef]
- Rhee, J.S.; Kim, B.M.; Kim, R.O.; Seo, J.S.; Kim, I.C.; Lee, Y.M.; Lee, J.S. Co-expression of antioxidant enzymes with expression of p53, DNA repair, and heat shock protein genes in the gamma ray-irradiated hermaphroditic fish Kryptolebias marmoratus larvae. Aquat. Toxicol. 2013, 140, 58–67. [Google Scholar] [CrossRef]
- Sudprasert, W.; Navasumrit, P.; Ruchirawat, M. Effects of low-dose gamma radiation on DNA damage, chromosomal aberration and expression of repair genes in human blood cells. Int. J. Hyg. Environ. Health 2006, 209, 503–511. [Google Scholar] [CrossRef]
- Zhai, X.; Malakhova, M.L.; Pike, H.M.; Benson, L.M.; Bergen, H.R.; Sugar, I.P.; Malinina, L.; Patel, D.J.; Brown, R.E. Glycolipid Acquisition by Human Glycolipid Transfer Protein Dramatically Alters Intrinsic Tryptophan Fluorescence: INSIGHTS INTO GLYCOLIPID BINDING AFFINITY. J. Biol. Chem. 2009, 284, 13620–13628. [Google Scholar] [CrossRef]
- Prinetti, A.; Loberto, N.; Chigorno, V.; Sonnino, S. Glycosphingolipid behaviour in complex membranes. Biochim. Biophys. Acta 2009, 1788, 184–193. [Google Scholar] [CrossRef]
- Schnaar, R.L. Glycolipid-mediated cell–cell recognition in inflammation and nerve regeneration. Arch. Biochem. Biophys. 2004, 426, 163–172. [Google Scholar] [CrossRef]
- Ohkawa, H.; Imaishi, H.; Shiota, N.; Yamada, T.; Inui, H.; Ohkawa, Y. Molecular Mechanisms of Herbicide Resistance with Special Emphasis on Cytochrome P450 Monooxygenases. Plant Biotechnol. 1998, 15, 173–176. [Google Scholar] [CrossRef]
- Liu, Z.; Li, J.; Chen, J.; Shan, Q.; Zheng, S. MCM family in HCC: MCM6 indicates adverse tumor features and poor outcomes and promotes S/G2 cell cycle progression. BMC Cancer 2018, 18, 200. [Google Scholar] [CrossRef]
- Mimura, S.; Kubota, Y.; Takisawa, H. MCM interference during licensing of DNA replication in Xenopus egg extracts-Possible Role of a C-terminal region of MCM3. Cell Cycle 2018, 18, 200. [Google Scholar] [CrossRef]
- Cole, T.; Williams, B.A.; Geo, P.; Ali, M.; Gordon, K.; Van Baren, M.J.; Salzberg, S.L.; Wold, B.J.; Lior, P. Transcript assembly and quantification by RNA-Seq reveals unannotated transcripts and isoform switching during cell differentiation. Nat. Biotechnol. 2010, 28, 511–515. [Google Scholar]
- Langfelder, P.; Horvath, S. WGCNA: An R package for weighted correlation network analysis. BMC Bioinform. 2008, 9, 559. [Google Scholar] [CrossRef]
- Choi, J.Y.; Platts, A.E.; Fuller, D.Q.; Hsing, Y.-I.; Wing, R.A.; Purugganan, M.D. The rice paradox: Multiple origins but single domestication in Asian rice. Mol. Biol. Evol. 2017, 34, 969. [Google Scholar] [CrossRef]
- Polesi, L.F.; Sarmento, S.B.S.; de Moraes, J.; Franco, C.M.L.; Canniatti-Brazaca, S.G. Physicochemical And Structural Characteristics Of Rice Starch Modified By Irradiation. Food Chem. 2015, 191, 59. [Google Scholar] [CrossRef]
- Rakwal, R.; Kimura, S.; Shibato, J.; Nojima, K.; Kim, Y.K.; Nahm, B.H.; Jwa, N.S.; Endo, S.; Tanaka, K.; Iwahashi, H. Growth retardation and death of rice plants irradiated with carbon ion beams is preceded by very early dose- and time-dependent gene expression changes. Mol. Cells 2008, 25, 272–278. [Google Scholar]
- Antonova, E.V.; Khlestkina, E.K. Radiosensitivity and mutability of wheat seed progeny cultivated under adverse environments. Plant Physiol. Biochem. 2019, 137, 162–168. [Google Scholar] [CrossRef]
- Takeuchi, Y.; Akizuki, M.; Shimizu, H.; Kondo, N.; Sugahara, K. Effect of UV-B (290–320 nm) irradiation on growth and metabolism of cucumber cotyledons. Physiol. Plant. 2010, 76, 425–430. [Google Scholar] [CrossRef]
- Ghisi, R.; Trentin, A.R.; Masi, A.; Ferretti, M. Carbon and nitrogen metabolism in barley plants exposed to UV-B radiation. Physiol. Plant. 2010, 116, 200–205. [Google Scholar] [CrossRef]
- Casati, P.; Campi, M.; Morrow, D.J.; Fernandes, J.F.; Walbot, V. Transcriptomic, proteomic and metabolomic analysis of UV-B signaling in maize. BMC Genom. 2011, 12, 321. [Google Scholar] [CrossRef]
- Bolsunovsky, A.Y.; Dementyev, D.V.; Trofimova, E.A.; Iniatkina, E.M.; Kladko, Y.V.; Petrichenkov, M.V. Cytogenetic Effects of γ-Radiation in Onion (Allium cepa L.) Seedlings. Dokl. Biochem. Biophys. 2018, 481, 181–185. [Google Scholar] [CrossRef]
- Macovei, A.; Tuteja, N. Different expression of miRNAs targeting helicases in rice in response to low and high dose rate γ-ray treatments. Plant Signal. Behav. 2013, 8, e25128. [Google Scholar] [CrossRef]
- Kataria, S.; Jajoo, A.; Guruprasad, K.N. Impact of increasing Ultraviolet-B (UV-B) radiation on photosynthetic processes. J. Photochem. Photobiol. B-Biol. 2014, 137, 55–66. [Google Scholar] [CrossRef]
- Coronel, V.P.; Dai, Q.J.; Vergara, B.S.; Teramura, A. Preliminary Study on Response of Rice Seedlings to Enhanced UV-B Radiation. Int. Rice Res. Newsl. 1990, 15, 37. [Google Scholar]
- Dai, Q.; Shaobing, P.; Chavez, A.Q.; Vergara, B.S. Intraspecific responses of 188 rice cultivars to enhanced UVB radiation. Environ. Exp. Bot. 1994, 34, 433–442. [Google Scholar] [CrossRef]
- Barnes, P.; Maggard, S.; Holman, S.R.; Vergara, B.S. Intraspecific Variation in Sensitivity to UV-B Radiation in Rice. Crop Sci. 1993, 33, 1041–1046. [Google Scholar] [CrossRef]
- Filippo, J.S.; Sung, P.; Klein, H. Mechanism of Eukaryotic Homologous Recombination. Annu. Rev. Biochem. 2008, 77, 229–257. [Google Scholar] [CrossRef]
- Kowalczykowski, S.C. An Overview of the Molecular Mechanisms of Recombinational DNA Repair. Cold Spring Harb. Perspect. Biol. 2015, 7, a016410. [Google Scholar] [CrossRef]
- Costa-Nunes, J.A.D.; Capitão, C.; Kozak, J.; Costa-Nunes, P.; Ducasa, G.M.; Pontes, O.; Angelis, K.J. The AtRAD21.1 and AtRAD21.3 Arabidopsis cohesins play a synergistic role in somatic DNA double strand break damage repair. BMC Plant Biol. 2014, 14, 353. [Google Scholar] [CrossRef]
- Anand, R.; Beach, A.; Li, K.; Haber, J. Rad51-mediated double-strand break repair and mismatch correction of divergent substrates. Nature 2017, 544, 377. [Google Scholar] [CrossRef]
- Dai, J.; Voloshin, O.; Potapova, S.; Camerini-Otero, R.D. Meiotic Knockdown and Complementation Reveals Essential Role of RAD51 in Mouse Spermatogenesis. Cell Rep. 2017, 18, 1383–1394. [Google Scholar] [CrossRef]
- Kobayashi, W.; Hosoya, N.; Machida, S.; Miyagawa, K.; Kurumizaka, H. SYCP3 regulates strand invasion activities of RAD51 and DMC1. Genes Cells 2017, 22, 799–809. [Google Scholar] [CrossRef]
- Han, Y.; Jiang, J.; Liu, H.; Ma, Q.; Xu, W.; Xu, Y.; Xu, Z.; Chong, K. Overexpression of OsSIN, encoding a novel small protein, causes short internodes in Oryza sativa. Plant Sci. 2005, 169, 487–495. [Google Scholar] [CrossRef]
- Riechmann, J.L.; Meyerowitz, E.M. The AP2/EREBP family of plant transcription factors. Biol. Chem. 1998, 379, 633–646. [Google Scholar]
- Journot-Catalino, N.; Somssich, I.; Roby, D.; Thomas, K. The transcription factors WRKY11 and WRKY17 act as negative regulators of basal resistance in Arabidopsis thaliana. Plant Cell 2006, 18, 3289–3302. [Google Scholar] [CrossRef]
- Fan, X.; Guo, Q.; Xu, P.; Gong, Y.; Shu, H.; Yang, Y.; Ni, W.; Zhang, X.; Shen, X. Transcriptome-wide identification of salt-responsive members of the WRKY gene family in Gossypium aridum. PLoS ONE 2015, 10, e0126148. [Google Scholar] [CrossRef]
- Chen, W.; Zhu, T. Networks of transcription factors with roles in environmental stress response. Trends Plant Sci. 2004, 9, 591–596. [Google Scholar] [CrossRef]
- Chen, C.; Chen, Z. Potentiation of developmentally regulated plant defense response by AtWRKY18, a pathogen-induced Arabidopsis transcription factor. Plant Physiol. 2002, 129, 706–716. [Google Scholar] [CrossRef]
- Anders, S.; Pyl, P.T.; Huber, W. HTSeq—A Python framework to work with high-throughput sequencing data. Bioinformatics 2015, 31, 166–169. [Google Scholar] [CrossRef]
- Livak, K.; Schmittgen, T. Analysis of relative gene expression data using real-time quantitative PCR and the 2(-Delta Delta C(T)) Method. Methods-A Companion Methods Enzymol. 2001, 25, 402–408. [Google Scholar] [CrossRef]
- Wisniewski, N.; Cadeiras, M.; Bondar, G.; Cheng, R.K.; Shahzad, K.; Onat, D.; Latif, F.; Korin, Y.; Reed, E.; Fakhro, R. Weighted Gene Coexpression Network Analysis (WGCNA) Modeling of Multiorgan Dysfunction Syndrome after Mechanical Circulatory Support Therapy. J. Heart Lung Transplant. 2013, 32, S233. [Google Scholar] [CrossRef]
- Shannon, P.; Markiel, A.; Ozier, O.; Baliga, N.S.; Wang, J.T.; Ramage, D.; Amin, N.; Schwikowski, B.; Ideker, T. Cytoscape: A Software Environment for Integrated Models of Biomolecular Interaction Networks. Genome Res. 2003, 13, 2498–2504. [Google Scholar] [CrossRef]


| Gene Name | Description | KME Value | Group |
|---|---|---|---|
| Magenta module with positive correlation | |||
| LOC_Os08g44750 | Auxin-induced protein 5NG4, putative, expressed | 0.97 | |
| LOC_Os02g03270 | AT hook motif domain containing protein, expressed | 0.94 | |
| LOC_Os09g25620 | CPuORF8 - conserved peptide uORF-containing transcript, expressed | 0.92 | |
| LOC_Os07g05380 | ATPase BadF/BadG/BcrA/BcrD type, putative, expressed | 0.91 | |
| LOC_Os06g25950 | Expressed protein | 0.90 | |
| LOC_Os10g40530 | LTPL146 - Protease inhibitor/seed storage/LTP family protein precursor, expressed | 0.90 | |
| LOC_Os02g25020 | DNA binding protein, putative, expressed | 0.87 | |
| LOC_Os07g48030 | Peroxidase precursor, putative, expressed | 0.82 | |
| LOC_Os02g40070 | AP2-like ethylene-responsive transcription factor PLETHORA 2, putative, expressed | 0.80 | |
| LOC_Os10g08780 | Expressed protein | −0.70 | |
| Royalblue module with negative correlation | |||
| LOC_Os11g19880 | O-methyltransferase, putative, expressed | 0.99 | DEGs |
| LOC_Os02g24642 | Photosystem II reaction center protein K precursor, putative, expressed | 0.96 | |
| LOC_Os06g38890 | Transposon protein, putative, unclassified, expressed | 0.93 | |
| LOC_Os04g45720 | Aldehyde dehydrogenase, putative, expressed | 0.92 | |
| LOC_Os02g21550 | Flavonol synthase/flavanone 3-hydroxylase, putative, expressed | 0.91 | DEGs |
| LOC_Os12g25450 | O-methyltransferase, putative, expressed | 0.91 | |
| LOC_Os01g27260 | Glutathione S-transferase, putative, expressed | 0.90 | |
| LOC_Os12g13340 | Expressed protein | 0.85 | DEGs |
| LOC_Os08g17510 | Sulfotransferase domain containing protein, expressed | −0.71 | |
| LOC_Os02g04755 | Transposon protein, putative, unclassified, expressed | −0.73 | |
| Gene Name | Description | KME Value | Group |
|---|---|---|---|
| Turquoise module with positive correlation | |||
| LOC_Os01g03380 | BBTI6 - Bowman-Birk type bran trypsin inhibitor precursor, putative, expressed | 0.94 | |
| LOC_Os07g44480 | Peroxidase, putative, expressed | 0.93 | |
| LOC_Os06g08690 | Leucine-rich repeat receptor protein kinase EXS precursor, putative, expressed | 0.92 | |
| LOC_Os02g37580 | Fimbrin-like protein 2, putative, expressed | 0.92 | |
| LOC_Os05g10780 | Aminotransferase, classes I and II, domain containing protein, expressed | 0.91 | |
| LOC_Os10g07040 | Chalcone synthase, putative, expressed | 0.90 | |
| LOC_Os05g49380 | OsDegp9—Putative Deg protease homologue, expressed | 0.90 | |
| LOC_Os08g43760 | Carrier, putative, expressed | 0.87 | DEGs |
| LOC_Os08g43890 | Carrier, putative, expressed | 0.86 | |
| LOC_Os03g25370 | Peroxidase precursor, putative, expressed | 0.84 | |
| Black module with negative correlation | |||
| LOC_Os01g43650 | WRKY11, expressed | 0.96 | |
| LOC_Os01g09080 | WRKY107, expressed | 0.95 | DEGs |
| LOC_Os01g64020 | Transcription factor, putative, expressed | 0.92 | |
| LOC_Os02g52850 | Receptor-like protein kinase like protein, putative, expressed | 0.91 | |
| LOC_Os02g11020 | Cytochrome P450 72A1, putative, expressed | 0.91 | |
| LOC_Os02g03710 | UP-9A, putative, expressed | 0.81 | |
| LOC_Os01g71094 | Basic 7S globulin 2 precursors, putative, expressed | −0.62 | |
| LOC_Os02g32060 | Hydrolase, NUDIX family, domain containing protein, expressed | −0.66 | |
| LOC_Os02g10880 | UDP-glucoronosyl and UDP-glucosyl transferase domain containing protein, expressed | −0.67 | |
| LOC_Os01g48710 | Heavy metal-associated domain containing protein, expressed | −0.79 | |
| Gene Name | Description | KME Value | Group |
|---|---|---|---|
| Pink module with positive correlation | |||
| LOC_Os04g49270 | tRNA-splicing endonuclease positive effector-related, putative, expressed | 0.97 | DEGs |
| LOC_Os07g34190 | Chalcone and stilbene synthases, putative, expressed | 0.97 | DEGs |
| LOC_Os01g65100 | Peptide transporter, putative, expressed | 0.95 | DEGs |
| LOC_Os07g15460 | Metal transporter Nramp6, putative, expressed | 0.94 | DEGs |
| LOC_Os08g15322 | Cytochrome b559 subunit alpha, putative, expressed | 0.92 | |
| LOC_Os09g23540 | Dehydrogenase, putative, expressed | 0.91 | DEGs |
| LOC_Os08g34310 | ZOS8-05 - C2H2 zinc finger protein, expressed | 0.91 | |
| LOC_Os01g72370 | Helix-loop-helix DNA-binding domain containing protein, expressed | 0.90 | DEGs |
| LOC_Os11g45290 | Retrotransposon protein, putative, unclassified, expressed | 0.89 | DEGs |
| LOC_Os11g39230 | Retrotransposon protein, putative, unclassified, expressed | 0.89 | DEGs |
| Purple module with negative correlation | |||
| LOC_Os02g05970 | Phytosulfokine receptor precursor, putative, expressed | 0.98 | DEGs |
| LOC_Os03g11490 | Expressed protein | 0.95 | DEGs |
| LOC_Os10g24690 | Expressed protein | 0.95 | DEGs |
| LOC_Os06g47120 | Expressed protein | 0.95 | DEGs |
| LOC_Os01g29390 | Expressed protein | 0.94 | DEGs |
| LOC_Os10g07150 | Transposon protein, putative, unclassified, expressed | 0.93 | DEGs |
| LOC_Os11g36200 | Receptor-like protein kinase 2 precursor, putative, expressed | 0.93 | DEGs |
| LOC_Os06g51360 | LysM domain containing protein, putative, expressed | 0.90 | |
| LOC_Os09g02000 | Expressed protein | 0.87 | DEGs |
| LOC_Os04g43680 | MYB family transcription factor, putative, expressed | −0.83 | |
© 2019 by the authors. Licensee MDPI, Basel, Switzerland. This article is an open access article distributed under the terms and conditions of the Creative Commons Attribution (CC BY) license (http://creativecommons.org/licenses/by/4.0/).
Share and Cite
Zhang, X.; Huang, N.; Mo, L.; Lv, M.; Gao, Y.; Wang, J.; Liu, C.; Yin, S.; Zhou, J.; Xiao, N.; et al. Global Transcriptome and Co-Expression Network Analysis Reveal Contrasting Response of Japonica and Indica Rice Cultivar to γ Radiation. Int. J. Mol. Sci. 2019, 20, 4358. https://doi.org/10.3390/ijms20184358
Zhang X, Huang N, Mo L, Lv M, Gao Y, Wang J, Liu C, Yin S, Zhou J, Xiao N, et al. Global Transcriptome and Co-Expression Network Analysis Reveal Contrasting Response of Japonica and Indica Rice Cultivar to γ Radiation. International Journal of Molecular Sciences. 2019; 20(18):4358. https://doi.org/10.3390/ijms20184358
Chicago/Turabian StyleZhang, Xiaoxiang, Niansheng Huang, Lanjing Mo, Minjia Lv, Yingbo Gao, Junpeng Wang, Chang Liu, Shuangyi Yin, Juan Zhou, Ning Xiao, and et al. 2019. "Global Transcriptome and Co-Expression Network Analysis Reveal Contrasting Response of Japonica and Indica Rice Cultivar to γ Radiation" International Journal of Molecular Sciences 20, no. 18: 4358. https://doi.org/10.3390/ijms20184358
APA StyleZhang, X., Huang, N., Mo, L., Lv, M., Gao, Y., Wang, J., Liu, C., Yin, S., Zhou, J., Xiao, N., Pan, C., Xu, Y., Dong, G., Yang, Z., Li, A., Huang, J., Wang, Y., & Yao, Y. (2019). Global Transcriptome and Co-Expression Network Analysis Reveal Contrasting Response of Japonica and Indica Rice Cultivar to γ Radiation. International Journal of Molecular Sciences, 20(18), 4358. https://doi.org/10.3390/ijms20184358