Graphene Oxide Nanoparticles Having Long Wavelength Absorbing Chlorins for Highly-Enhanced Photodynamic Therapy with Reduced Dark Toxicity


Abstract
:
1. Introduction
2. Results and Discussion
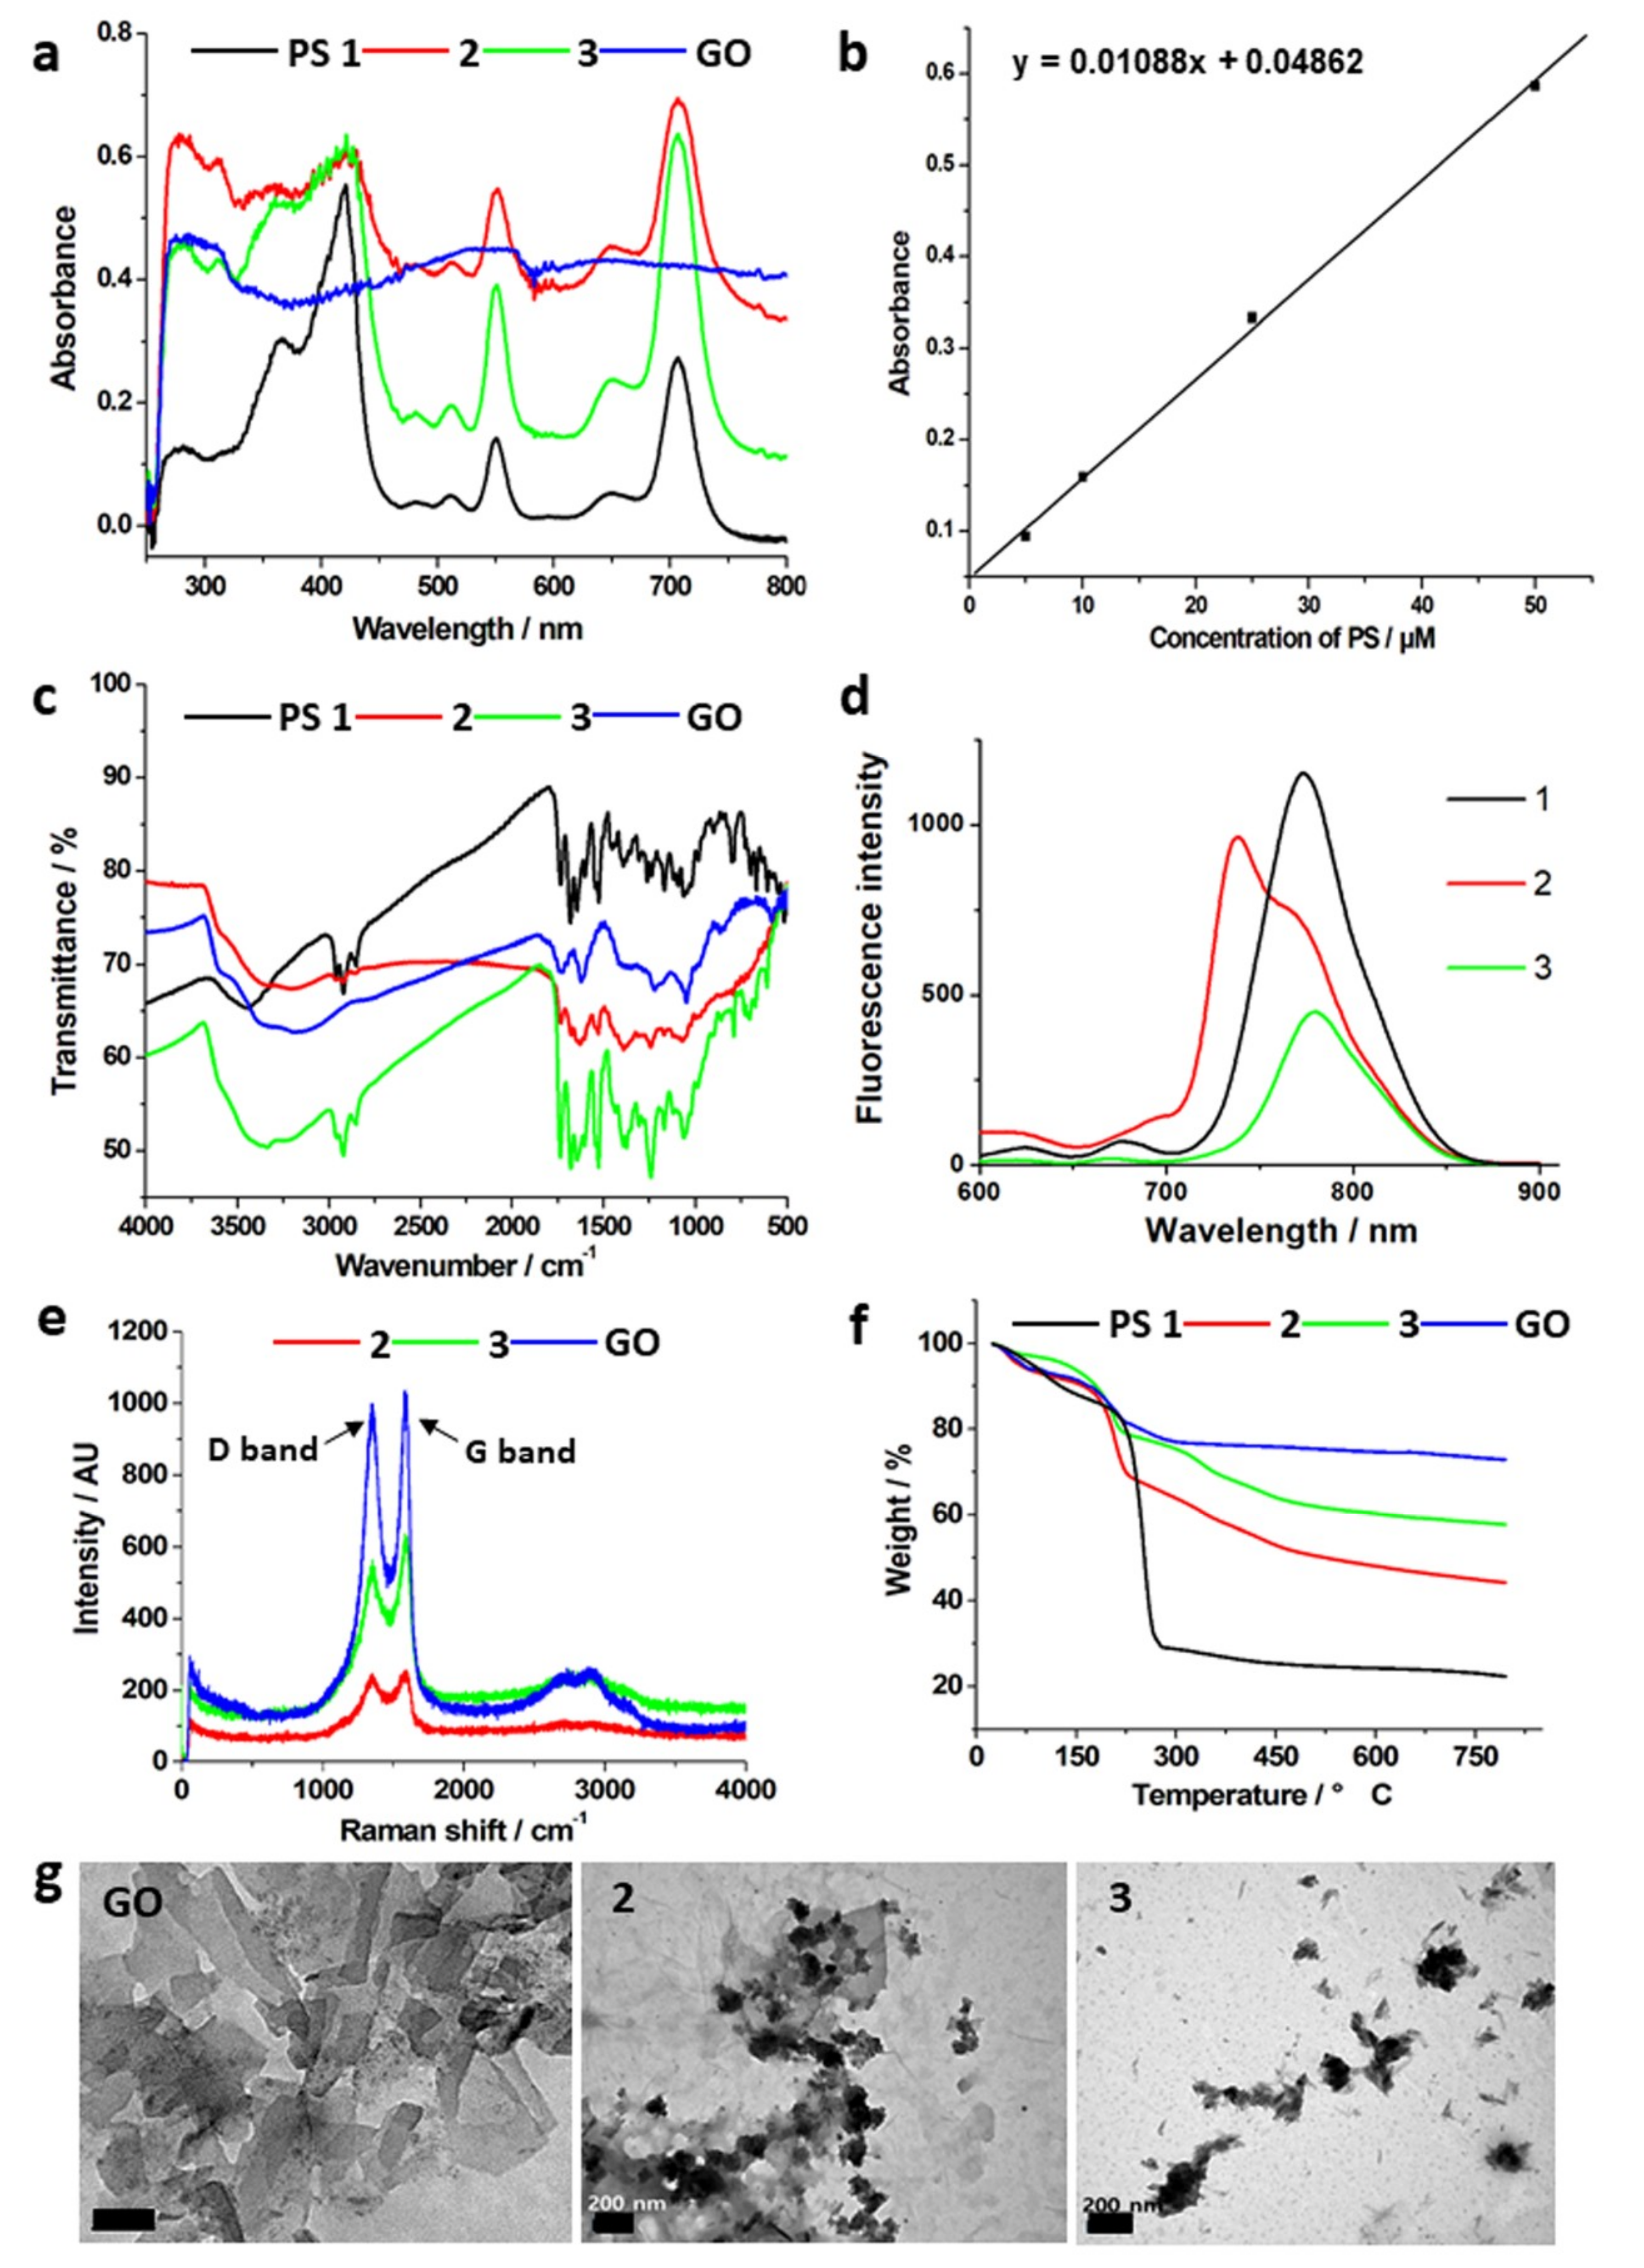
2.1. Characterizations of Prepared Photosensitizers and GO–PS Complexes
2.2. In Vitro Photocytotoxicity and Dark Toxicity
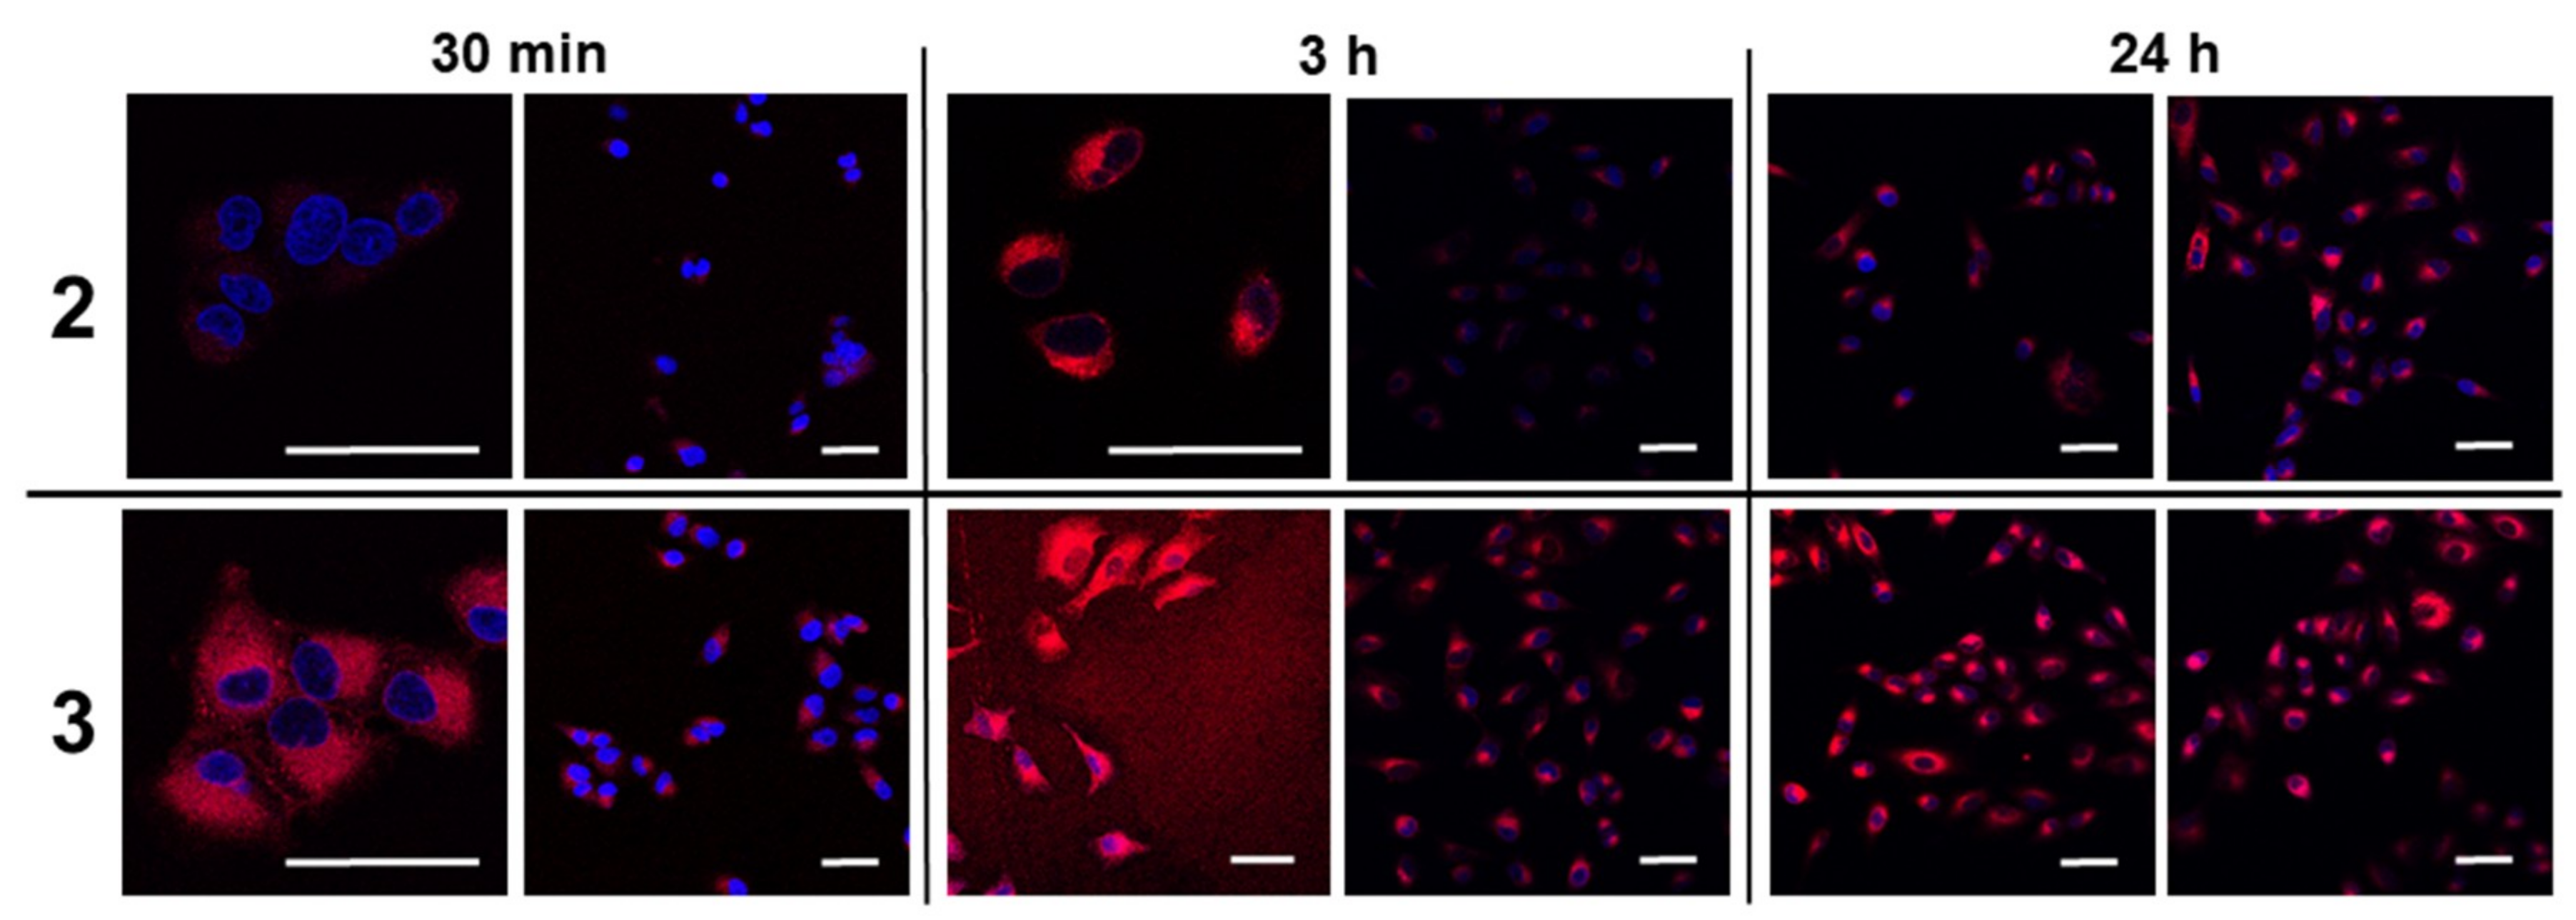
2.3. Live/Dead Cell Imaging and Singlet Oxygen Photogeneration
3. Materials and Methods
3.1. Materials
3.2. General
3.3. Synthesis of Photosensitizer
3.3.1. Purpurin-18 (P18)
3.3.2. Pupurin-18 Methyl Ester (P18ME)
3.3.3. Purpurin-18-N-Ethylamine, PS 1
3.4. Synthesis of GO and GO–PS Complexes
3.4.1. Synthesis of GO
3.4.2. Preparation of GO–PS Complex with Covalent Bond, GO–PS 2 (GO:PS = 1:2)
3.4.3. Preparation of GO–PS Complex with Noncovalent Bond, GO–PS 3 (GO:PS = 1:2)
3.5. Cell Culture and Photoirradiation
3.6. MTT Assay and Cell Viability
3.7. Cellular Accumulation
3.8. Singlet Oxygen Photogeneration
3.9. Live and Dead Cell Imaging
4. Conclusions
Supplementary Materials
Author Contributions
Acknowledgments
Conflicts of Interest
References
- Kim, K.S.; Zhao, Y.; Jang, H.; Lee, S.Y.; Kim, J.M.; Ahn, J.-H.; Kim, P.; Choi, J.-Y.; Hong, B.H. Large-scale pattern growth of graphene films for stretchable transparent electrodes. Nature 2009, 457, 706–710. [Google Scholar] [CrossRef]
- Jiao, L.; Zhang, L.; Wang, X.; Diankov, G.; Dai, H. Narrow graphene nanoribbons from carbon nanotubes. Nature 2009, 458, 877–880. [Google Scholar] [CrossRef]
- Feng, L.; Liu, Z. Graphene in biomedicine: Opportunities and challenges. Nanomedicine 2011, 6, 317–324. [Google Scholar] [CrossRef]
- Mao, H.Y.; Laurent, S.; Chen, W.; Akhavan, O.; Imani, M.; Ashkarran, A.A.; Mahmoudi, M. Graphene: Promises, facts, opportunities, and challenges in nanomedicine. Chem. Rev. 2013, 113, 3407–3424. [Google Scholar] [CrossRef]
- Ghosal, K.; Sarkar, K. Biomedical applications of graphene nanomaterials and beyond. ACS Biomater. Sci. Eng. 2018, 4, 2653–2703. [Google Scholar] [CrossRef]
- Sun, X.; Liu, Z.; Welsher, K.; Robinson, J.T.; Goodwin, A.; Zaric, S.; Dai, H. Nano-graphene oxide for cellular imaging and drug delivery. Nano Res. 2008, 1, 203–212. [Google Scholar] [CrossRef] [Green Version]
- Zhang, L.; Xia, J.; Zhao, Q.; Liu, L.; Zhang, Z. Functional graphene oxide as a nanocarrier for controlled loading and targeted delivery of mixed anticancer drugs. Small 2010, 6, 537–544. [Google Scholar] [CrossRef]
- Xu, Z.; Zhu, S.; Wang, M.; Li, Y.; Shi, P.; Huang, X. Delivery of paclitaxel using PEGylated graphene oxide as a nanocarrier. ACS Appl. Mater. Interfaces 2015, 7, 1355–1363. [Google Scholar] [CrossRef]
- Wei, Y.; Zhou, F.; Zhang, D.; Chen, Q.; Xing, D. A graphene oxide based smart drug delivery system for tumor mitochondria-targeting photodynamic therapy. Nanoscale 2016, 8, 3530–3538. [Google Scholar] [CrossRef] [Green Version]
- Khezri, B.; Mousavi, S.M.B.; Krejčová, L.; Heger, Z.; Sofer, Z.; Pumera, M. Ultrafast electrochemical trigger drug delivery mechanism for nanographene micromachines. Adv. Funct. Mater. 2019, 29, 1806696. [Google Scholar] [CrossRef]
- Liu, Q.; Wei, L.; Wang, J.; Peng, F.; Luo, D.; Cui, R.; Niu, Y.; Qin, X.; Liu, Y.; Sun, H.; Yang, J.; Li, Y. Cell imaging by graphene oxide based on surface enhanced Raman scattering. Nanoscale 2012, 4, 7084–7089. [Google Scholar] [CrossRef]
- Yan, X.; Niu, G.; Lin, J.; Jin, A.J.; Hu, H.; Tang, Y.; Zhang, Y.; Wu, A.; Lu, J.; Zhang, S.; Huang, P.; Shen, B.; Chen, X. Enhanced fluorescence imaging guided photodynamic therapy of sinoporphyrin sodium loaded graphene oxide. Biomaterials 2015, 42, 94–102. [Google Scholar] [CrossRef]
- Yang, K.; Zhang, S.; Zhang, G.; Sun, X.; Lee, S.T.; Liu, Z. Graphene in mice: Ultrahigh in vivo tumor uptake and efficient photothermal therapy. Nano Lett. 2010, 10, 3318–3323. [Google Scholar] [CrossRef]
- Zhang, W.; Guo, Z.; Huang, D.; Liu, Z.; Guo, X.; Zhong, H. Synergistic effect of chemo-photothermal therapy using PEGylated graphene oxide. Biomaterials 2011, 32, 8555–8561. [Google Scholar] [CrossRef]
- Chen, Y.-W.; Su, Y.-L.; Hu, S.-H.; Chen, S.-Y. Functionalized graphene nanocomposites for enhancing photothermal therapy in tumor treatment. Adv. Drug Deliv. Rev. 2016, 105, 190–204. [Google Scholar] [CrossRef]
- Meng, J.; Chen, X.; Tian, Y.; Li, Z.; Zheng, Q. Nanoscale metal–organic frameworks decorated with graphene oxide for magnetic resonance imaging guided photothermal therapy. Chem. Eur. J. 2017, 23, 17521–17530. [Google Scholar] [CrossRef]
- Yan, M.; Liu, Y.; Zhu, X.; Wang, X.; Liu, L.; Sun, H.; Wang, C.; Kong, D.; Ma, G. Nanoscale reduced graphene oxide-mediated photothermal therapy together with IDO inhibition and PD-L1 blockade synergistically promote antitumor immunity. ACS Appl. Mater. Interfaces 2019, 11, 1876–1885. [Google Scholar] [CrossRef]
- Hong, J.; Shah, N.J.; Drake, A.C.; DeMuth, P.C.; Lee, J.B.; Chen, J.; Hammond, P.T. Graphene multilayers as gates for multi-week sequential release of proteins from surfaces. ACS Nano 2012, 6, 81–88. [Google Scholar] [CrossRef]
- Yan, L.; Zheng, Y.B.; Zhao, F.; Li, S.; Gao, X.; Xu, B.; Weiss, P.S.; Zhao, Y. Chemistry and physics of a single atomic layer: Strategies and challenges for functionalization of graphene and graphene-based materials. Chem. Soc. Rev. 2012, 41, 97–114. [Google Scholar] [CrossRef]
- Georgakilas, V.; Otyepka, M.; Bourlinos, A.B.; Chandra, V.; Kim, N.; Kemp, K.C.; Hobza, P.; Zboril, R.; Kim, K.S. Functionalization of graphene: Covalent and non-covalent approaches, derivatives and applications. Chem. Rev. 2012, 112, 6156–6214. [Google Scholar] [CrossRef]
- Cheng, C.; Nie, S.; Li, S.; Peng, H.; Yang, H.; Ma, L.; Sun, S.; Zhao, C. Biopolymer functionalized reduced graphene oxide with enhanced biocompatibility via mussel inspired coatings/anchors. J. Mater. Chem. B 2013, 1, 265–275. [Google Scholar] [CrossRef]
- Lu, C.H.; Zhu, C.L.; Li, J.; Liu, J.J.; Chen, X.; Yang, H.H. Using graphene to protect DNA from cleavage during cellular delivery. Chem. Commun. 2010, 46, 3116–3118. [Google Scholar] [CrossRef] [Green Version]
- Liao, K.-H.; Lin, Y.-S.; Macosko, C.W.; Haynes, C.L. Cytotoxicity of graphene oxide and graphene in human erythrocytes and skin fibroblasts. ACS Appl. Mater. Interfaces 2011, 3, 2607–2615. [Google Scholar] [CrossRef]
- Yuan, J.; Gao, H.; Sui, J.; Duan, H.; Chen, W.N.; Ching, C.B. Cytotoxicity evaluation of oxidized single-walled carbon nanotubes and graphene oxide on human hepatoma HepG2 cells: An iTRAQ-coupled 2D LC-MS/MS proteome analysis. Toxicol. Sci. 2012, 126, 149–161. [Google Scholar] [CrossRef]
- Lalwani, G.; D’Agati, M.; Khan, A.M.; Sitharaman, B. Toxicology of graphene-based nanomaterials. Adv. Drug Deliv. Rev. 2016, 105, 109–144. [Google Scholar] [CrossRef] [Green Version]
- Yang, K.; Wan, J.; Zhang, S.; Zhang, Y.; Lee, S.-T.; Liu, Z. In vivo pharmacokinetics, long-term biodistribution, and toxicology of PEGylated graphene in mice. ACS Nano 2011, 5, 516–522. [Google Scholar] [CrossRef]
- Zhang, S.; Yang, K.; Feng, L.; Liu, Z. In vitro and in vivo behaviors of dextran functionalized graphene. Carbon 2011, 49, 4040–4049. [Google Scholar] [CrossRef]
- Yang, K.; Gong, H.; Shi, X.; Wan, J.; Zhang, Y.; Liu, Z. In vivo biodistribution and toxicology of functionalized nano-graphene oxide in mice after oral and intraperitoneal administration. Biomaterials 2013, 34, 2787–2795. [Google Scholar] [CrossRef]
- Tian, B.; Wang, C.; Zhang, S.; Feng, L.; Liu, Z. Photothermally enhanced photodynamic therapy delivered by nano-graphene oxide. ACS Nano 2011, 5, 7000–7009. [Google Scholar] [CrossRef]
- Miao, W.; Shim, G.; Lee, S.; Lee, S.; Choe, Y.S.; Oh, Y.-K. Safety and tumor tissue accumulation of pegylated graphene oxide nanosheets for co-delivery of anticancer drug and photosensitizer. Biomaterials 2013, 34, 3402–3410. [Google Scholar] [CrossRef]
- Lkhagvadulam, B.; Kim, J.H.; Yoon, I.; Shim, Y.K. Size-dependent photodynamic activity of gold nanoparticles conjugate of water soluble purpurin-18-N-methyl-D-glucamine. BioMed Res. Int. 2013, 2013, 720579. [Google Scholar] [CrossRef]
- Kim, S.B.; Lee, T.H.; Yoon, I.; Shim, Y.K.; Lee, W.K. Gold nanorod-photosensitizer complex obtained by layer-by-layer method for photodynamic/photothermal therapy in vitro. Chem. Asian J. 2015, 10, 563–567. [Google Scholar] [CrossRef]
- Yoon, I.; Kim, J.H.; Li, J.Z.; Lee, W.K.; Shim, Y.K. Efficient photosensitization by a chlorin–polyoxometalate supramolecular complex. Inorg. Chem. 2014, 53, 3–5. [Google Scholar] [CrossRef]
- Chang, J.-E.; Liu, Y.; Lee, T.H.; Lee, W.K.; Yoon, I.; Kim, K. Tumor size-dependent anticancer efficacy of chlorin derivatives for photodynamic therapy. Int. J. Mol. Sci. 2018, 19, 1596. [Google Scholar] [CrossRef]
- Zhang, P.; Huang, H.; Banerjee, S.; Clarkson, G.J.; Ge, C.; Imberti, C.; Sadler, P.J. Nucleus-targeted organoiridium-albumin conjugate for photodynamic cancer therapy. Angew. Chem. Int. Ed. 2019, 58, 2350–2354. [Google Scholar] [CrossRef]
- Wang, Y.; Wang, H.; Liu, D.; Song, S.; Wang, X.; Zhang, H. Graphene oxide covalently grafted upconversion nanoparticles for combined NIR mediated imaging and photothermal/photodynamic cancer therapy. Biomaterials 2013, 34, 7715–7724. [Google Scholar] [CrossRef]
- Kalluru, P.; Vankayala, R.; Chiang, C.-S.; Hwang, K.C. Nano-graphene oxide-mediated In vivo fluorescence imaging and bimodal photodynamic and photothermal destruction of tumors. Biomaterials 2016, 95, 1–10. [Google Scholar] [CrossRef]
- Jang, Y.; Kim, S.; Lee, S.; Yoon, C.-M.; Lee, I.; Jang, J. Graphene oxide wrapped SiO2/TiO2 hollow nanoparticles loaded with photosensitizer for photothermal and photodynamic combination therapy. Chem. Eur. J. 2017, 23, 3719–3727. [Google Scholar] [CrossRef]
- Yu, X.; Gao, D.; Gao, L.; Lai, J.; Zhang, C.; Zhao, Y.; Zhong, L.; Jia, B.; Wang, F.; Chen, X.; Liu, Z. Inhibiting metastasis and preventing tumor relapse by triggering host immunity with tumor-targeted photodynamic therapy using photosensitizer-loaded functional nanographenes. ACS Nano 2017, 11, 10147–10158. [Google Scholar] [CrossRef]
- Hummers, W.S.; Offeman, R.E. Preparation of graphitic oxide. J. Am. Chem. Soc. 1958, 80, 1339. [Google Scholar] [CrossRef]
- Karousis, N.; Sandanayaka, A.S.D.; Hasobe, T.; Economopoulos, S.P.; Sarantopoulou, E.; Tagmatarchis, N. Graphene oxide with covalently linked porphyrin antennae: Synthesis, characterization and photophysical properties. J. Mater. Chem. 2011, 21, 109–117. [Google Scholar] [CrossRef]
- Du, Y.; Dong, N.; Zhang, M.; Zhu, K.; Na, R.; Zhang, S.; Sun, N.; Wang, G.; Wang, J. Covalent functionalization of graphene oxide with porphyrin and porphyrin incorporated polymers for optical limiting. Phys. Chem. Chem. Phys. 2017, 19, 2252–2260. [Google Scholar] [CrossRef]
- Pan, J.; Yang, Y.; Fang, W.; Liu, W.; Le, K.; Xu, D.; Li, X. Fluorescent phthalocyanine–graphene conjugate with enhanced NIR absorbance for imaging and multi-modality therapy. ACS Appl. Nano Mater. 2018, 1, 2785–2795. [Google Scholar] [CrossRef]
- Wang, K.; Zhang, Z.; Lin, L.; Chen, J.; Hao, K.; Tian, H.; Chen, X. Covalent organic nanosheets integrated heterojunction with two strategies to overcome hypoxic-tumor photodynamic therapy. Chem. Mater. 2019, 31, 3313–3323. [Google Scholar] [CrossRef]
- Wojcik, A.; Kamat, P.V. Reduced graphene oxide and porphyrin. An interactive affair in 2-D. ACS Nano 2010, 4, 6697–6706. [Google Scholar] [CrossRef]
- Malig, J.; Jux, N.; Kiessling, D.; Cid, J.-J.; Vázquez, P.; Torres, T.; Guldi, D.M. Towards tunable graphene/phthalocyanine-PPV hybrid systems. Angew. Chem. Int. Ed. 2011, 50, 3561–3565. [Google Scholar] [CrossRef]
- Dembereldorj, U.; Kim, M.; Kim, S.; Ganbold, E.-O.; Lee, S.Y.; Joo, S.-W. A spatiotemporal anticancer drug release platform of PEGylated graphene oxide triggered by glutathione in vitro and in vivo. J. Mater. Chem. 2012, 22, 23845–23851. [Google Scholar] [CrossRef]
- Zhang, Y.; Zhang, H.; Wang, Z.; Jin, Y. pH-Sensitive graphene oxide conjugate purpurin-18 methyl ester photosensitizer nanocomplex in photodynamic therapy. New. J. Chem. 2018, 42, 13272–13284. [Google Scholar] [CrossRef]
- Peng, C.; Hu, W.; Zhou, Y.; Fan, C.; Huang, Q. Intracellular imaging with a graphene-based fluorescent probe. Small 2010, 6, 1686–1692. [Google Scholar] [CrossRef]
- Chowdhury, S.M.; Lalwani, G.; Zhang, K.; Yang, J.Y.; Neville, K.; Sitharaman, B. Cell specific cytotoxicity and uptake of graphene nanoribbons. Biomaterials 2013, 34, 283–293. [Google Scholar] [CrossRef]
- Jiang, X.-M.; Wang, L.-M.; Chen, C.-Y. Cellular uptake, intracellular trafficking and biological responses of gold nanoparticles. J. Chi. Chem. Soc. 2011, 58, 273–281. [Google Scholar] [CrossRef]
- Wen, Y.; Jia, Q.; Nan, F.; Zheng, X.; Liu, W.; Wu, J.; Ren, H.; Ge, J.; Wang, P. Pheophytin derived near-infrared-light responsive carbon dot assembly as a new phototheranotic agent for bioimaging and photodynamic therapy. Chem. Asian J. 2019, 14, 2162–2168. [Google Scholar] [CrossRef]


| Compound | GO | 1 | 2 | 3 |
|---|---|---|---|---|
| C = O stretching | 1723 | 1735 | 1732, 1629 (amide bond) | 1736 |
| C = C | 1623 | 1681, 1645 | 1677 | 1679, 1644 |
| C–O/O–H | 1400–1000 |
| Compound/Incubation Time | 1 | 2 | 3 |
|---|---|---|---|
| 3 h | 12.61 | 0.69 | 0.22 |
| 12 h | 5.49 | 0.48 | 0.21 |
| 24 h | 1.44 | 0.31 | 0.20 |
| GO–PS 2 | GO–PS 3 | |
|---|---|---|
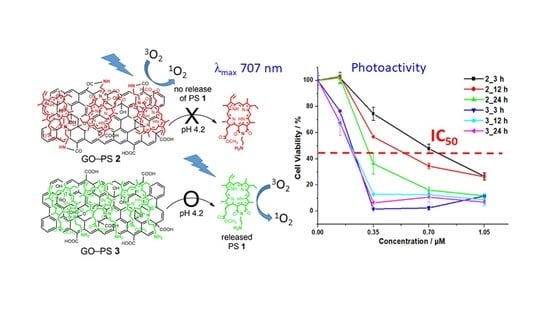
| Synthesis and synthetic condition | covalent bond by amide formation at pH 4–6 (weak acidic) | noncovalent bond by hydrophobic/π-π stacking at neutral pH |
| Organic content by TGA | 56.6 wt % PS; 43.4 wt % GO (PS: 912 nmol/mg) | 29.9 wt % PS; 70.1 wt % GO (PS: 482 nmol/mg) |
| Size by TEM | 104.2 ± 27.1 nm | 187.2 ± 40.1 nm |
| Stability in acidic aqueous solution | stable under weak acidic condition | release of PS under weak acidic condition |
| Cell viability (IC50) at 3–24 h incubation times | 0.69–0.31 μM | 0.22–0.20 μM |
| Dark toxicity | dose-dependent toxicity | negligible until 14.0 μM |
| 1O2 Photogeneration (remaining of DPBF) | 64.32% (comparable with MB, 59.22%) | 73.11% |
© 2019 by the authors. Licensee MDPI, Basel, Switzerland. This article is an open access article distributed under the terms and conditions of the Creative Commons Attribution (CC BY) license (http://creativecommons.org/licenses/by/4.0/).
Share and Cite
Kang, E.S.; Lee, T.H.; Liu, Y.; Han, K.-H.; Lee, W.K.; Yoon, I. Graphene Oxide Nanoparticles Having Long Wavelength Absorbing Chlorins for Highly-Enhanced Photodynamic Therapy with Reduced Dark Toxicity. Int. J. Mol. Sci. 2019, 20, 4344. https://doi.org/10.3390/ijms20184344
Kang ES, Lee TH, Liu Y, Han K-H, Lee WK, Yoon I. Graphene Oxide Nanoparticles Having Long Wavelength Absorbing Chlorins for Highly-Enhanced Photodynamic Therapy with Reduced Dark Toxicity. International Journal of Molecular Sciences. 2019; 20(18):4344. https://doi.org/10.3390/ijms20184344
Chicago/Turabian StyleKang, Eun Seon, Tae Heon Lee, Yang Liu, Ki-Ho Han, Woo Kyoung Lee, and Il Yoon. 2019. "Graphene Oxide Nanoparticles Having Long Wavelength Absorbing Chlorins for Highly-Enhanced Photodynamic Therapy with Reduced Dark Toxicity" International Journal of Molecular Sciences 20, no. 18: 4344. https://doi.org/10.3390/ijms20184344
APA StyleKang, E. S., Lee, T. H., Liu, Y., Han, K.-H., Lee, W. K., & Yoon, I. (2019). Graphene Oxide Nanoparticles Having Long Wavelength Absorbing Chlorins for Highly-Enhanced Photodynamic Therapy with Reduced Dark Toxicity. International Journal of Molecular Sciences, 20(18), 4344. https://doi.org/10.3390/ijms20184344