Gene Modules Co-regulated with Biosynthetic Gene Clusters for Allelopathy between Rice and Barnyardgrass

 , , , , , and
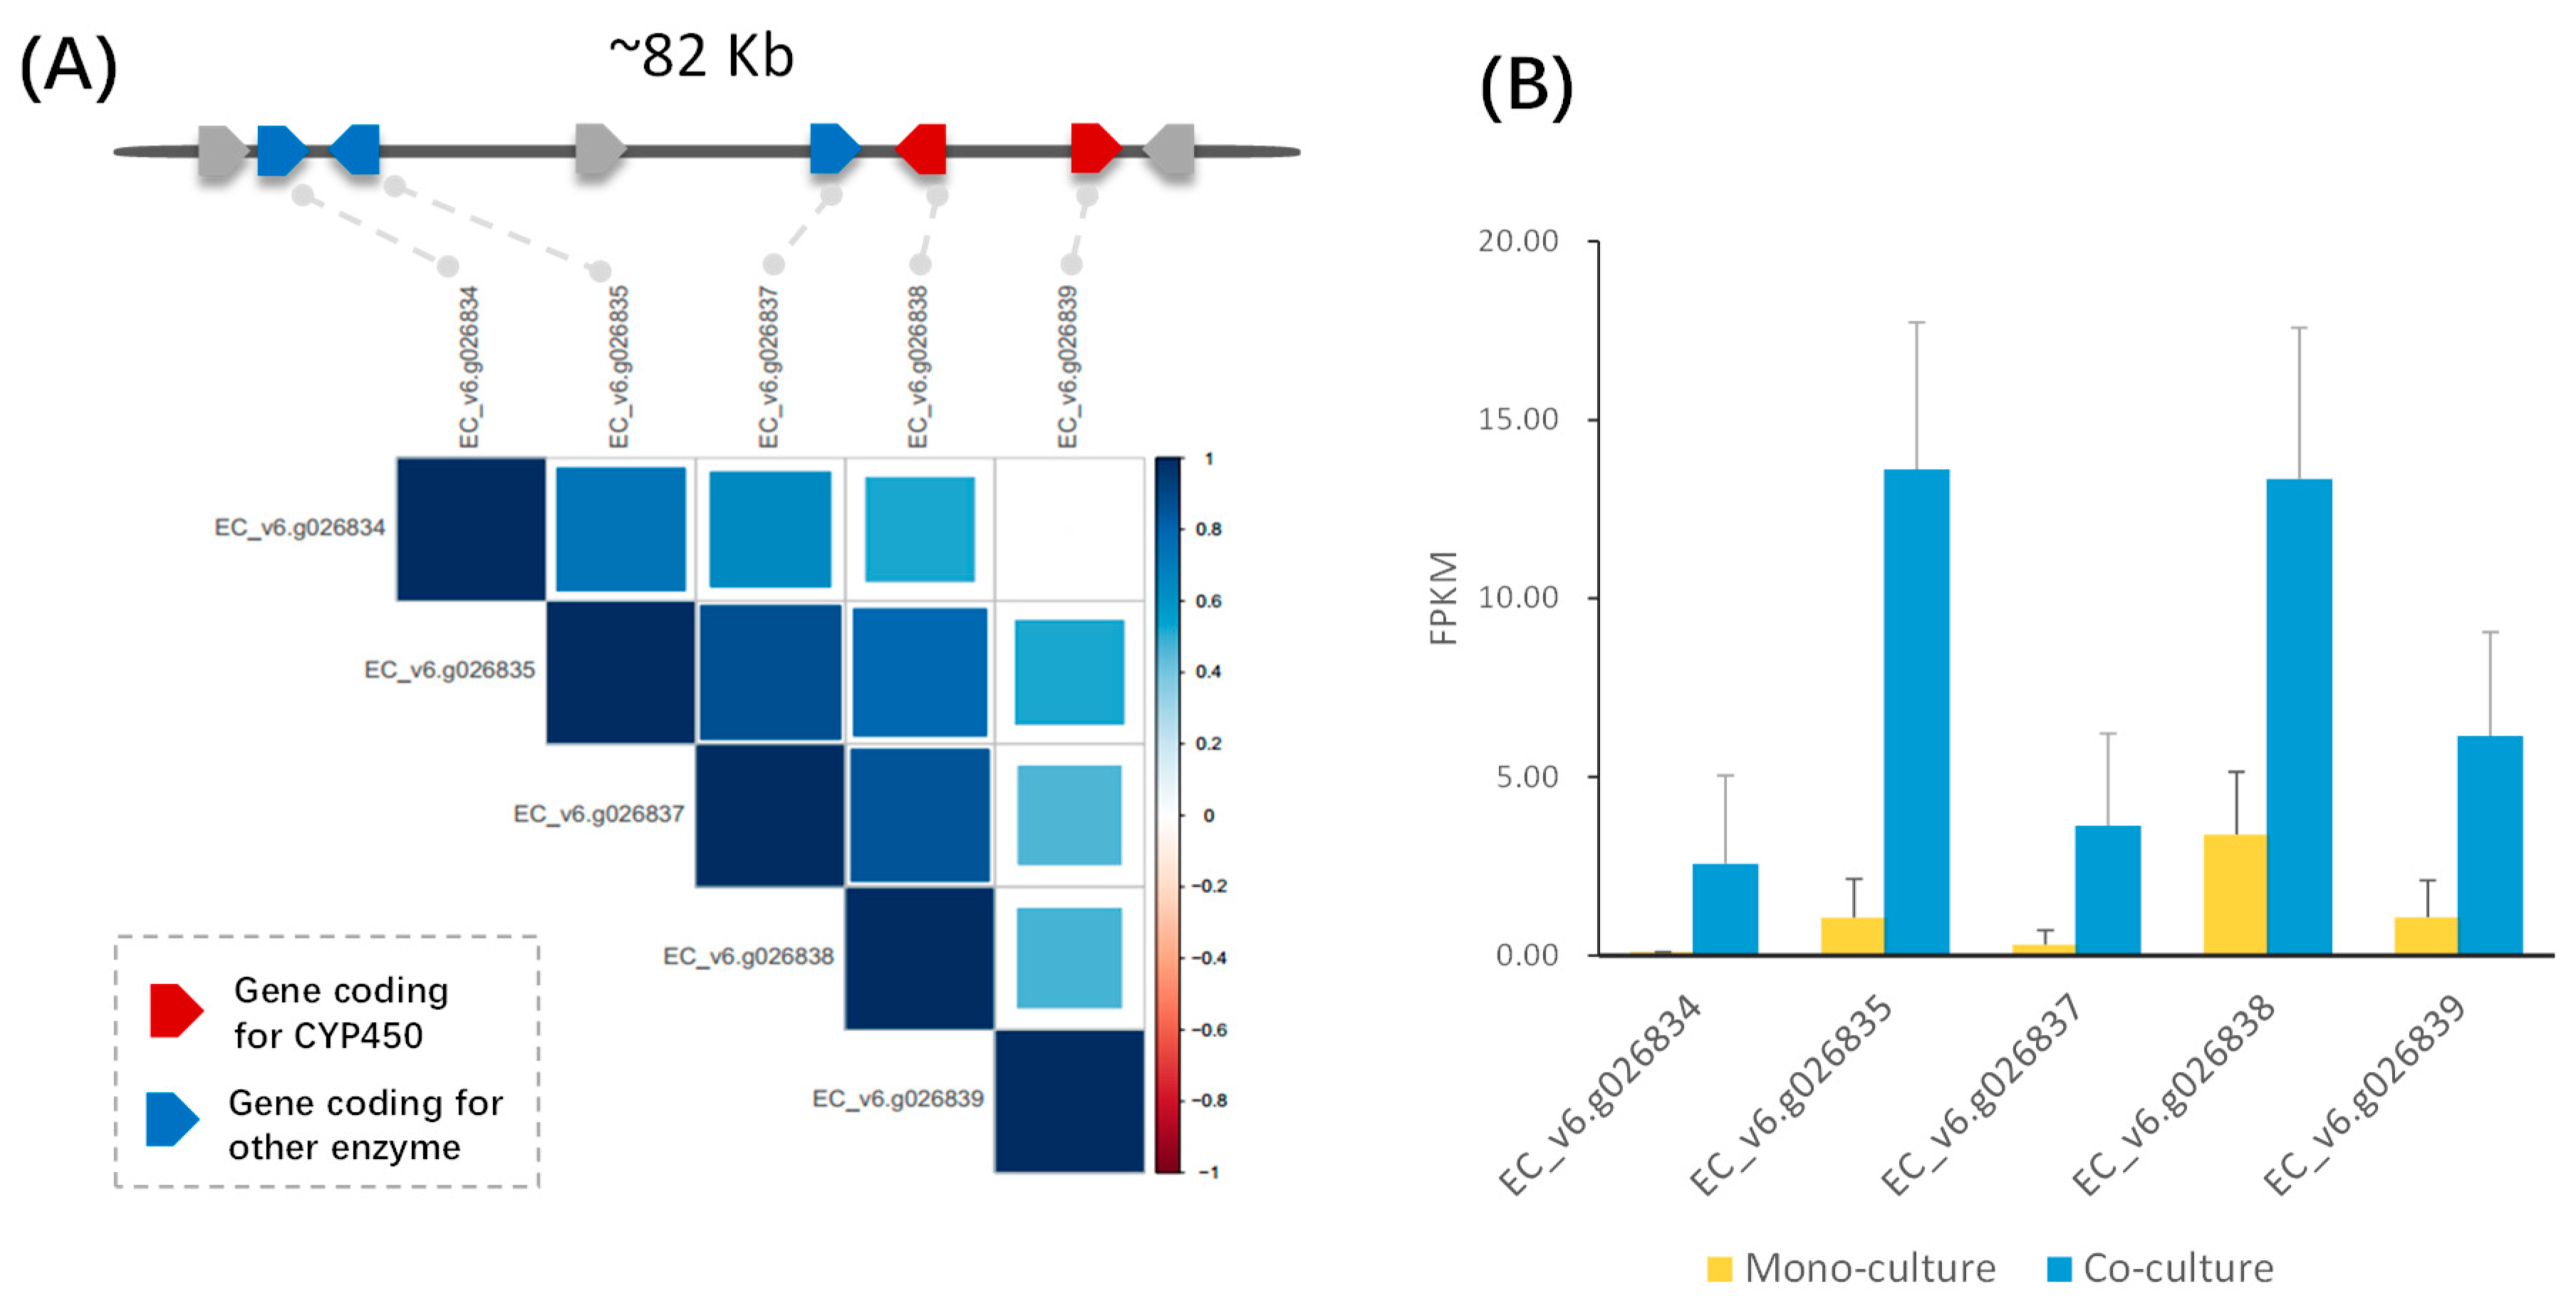
Abstract
:1. Introduction
2. Results
2.1. Transcriptomic Profiling for Allelopathic Interaction between Rice and Barnyardgrass
2.2. Identification of Candidate Biosynthetic Gene Clusters in Rice and Barnyardgrass
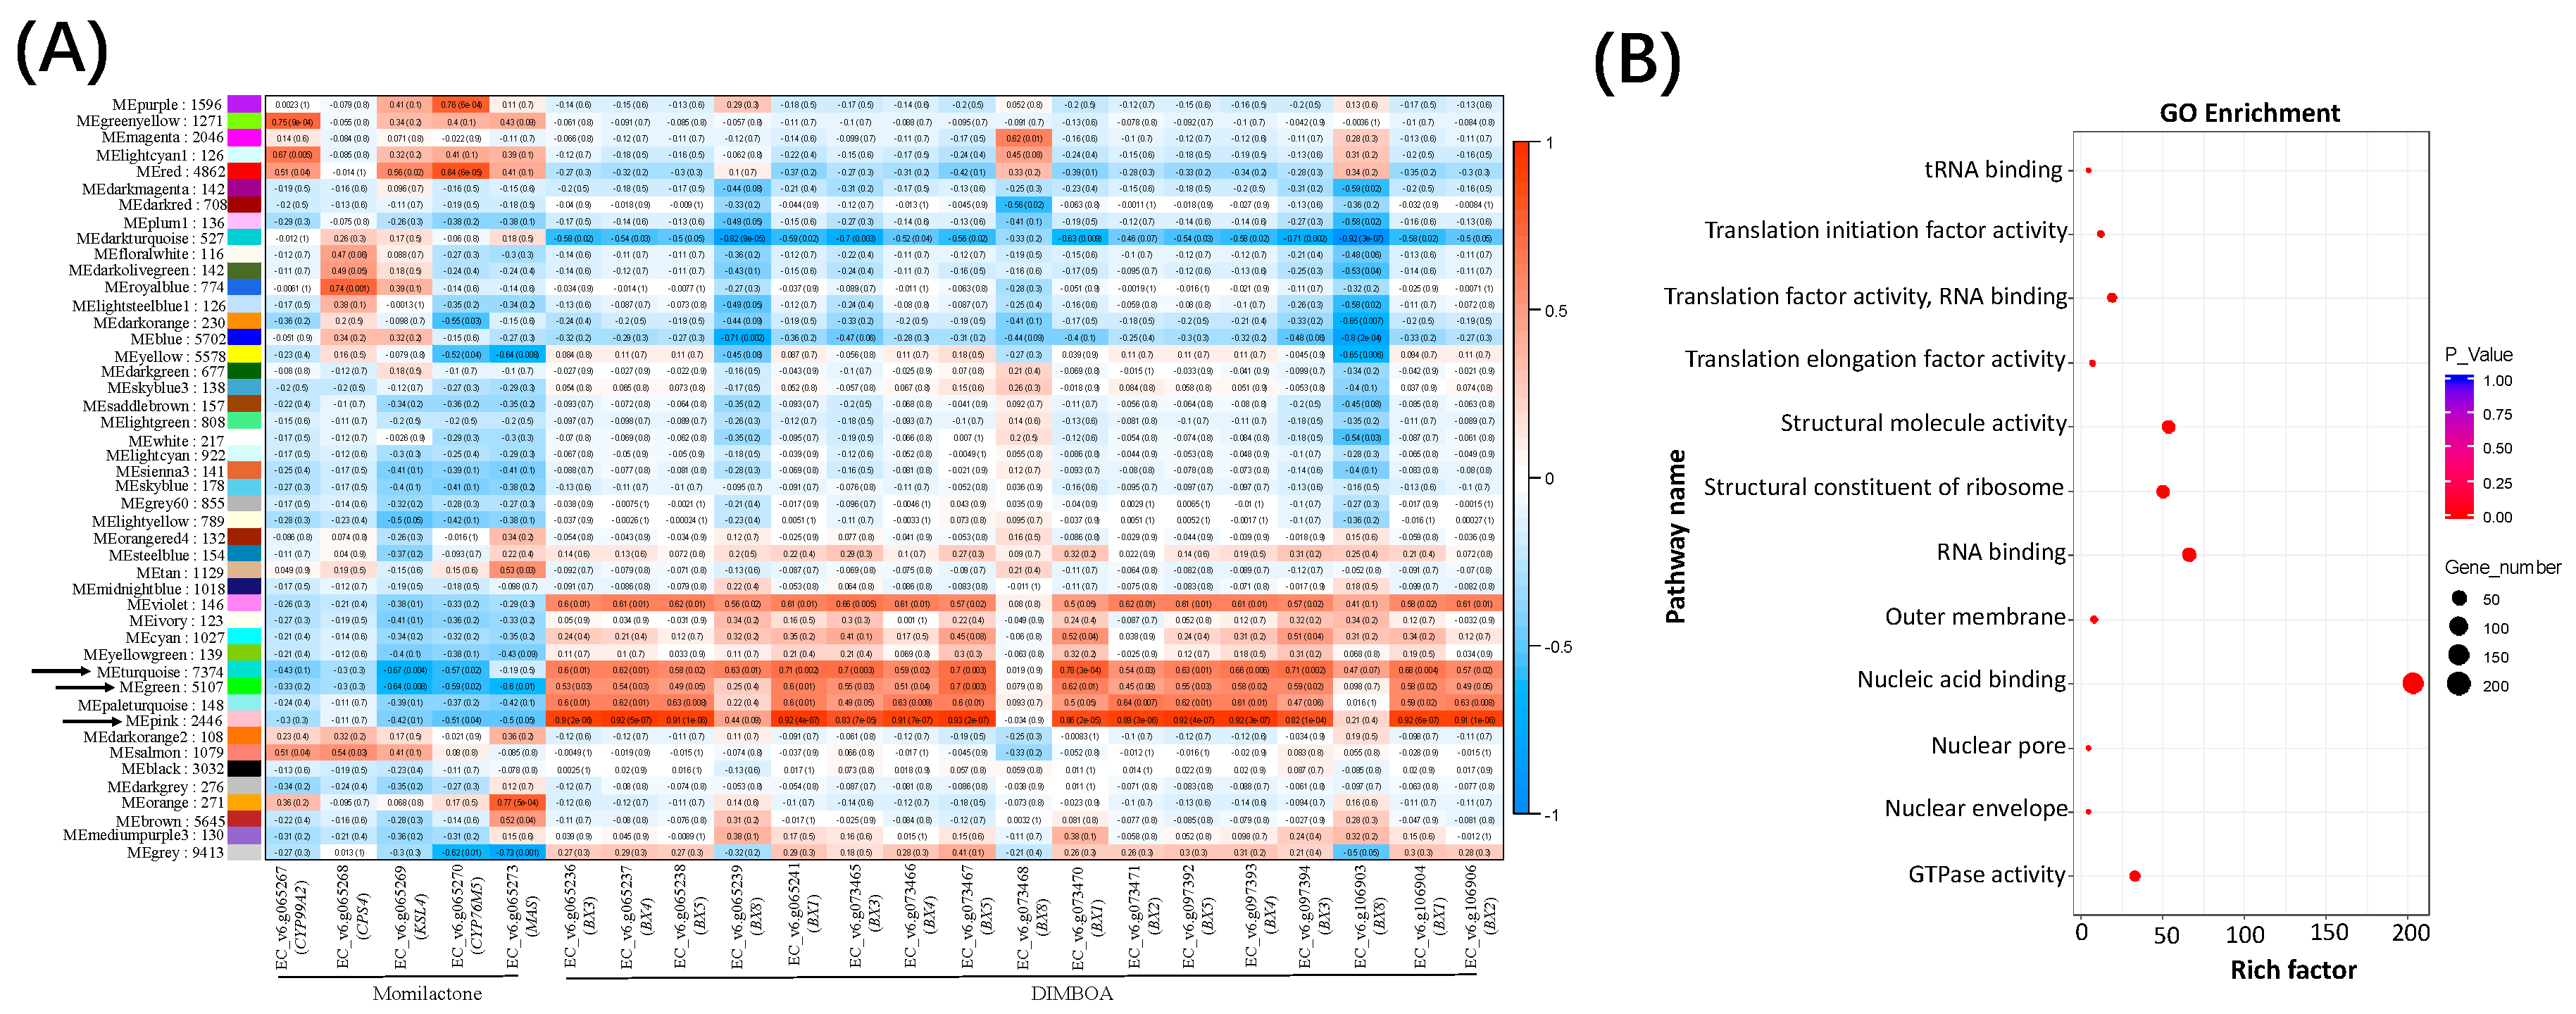
2.3. Gene Modules Co-regulated with the DIMBOA and Potential Momilactone Gene Clusters in Barnyardgrass
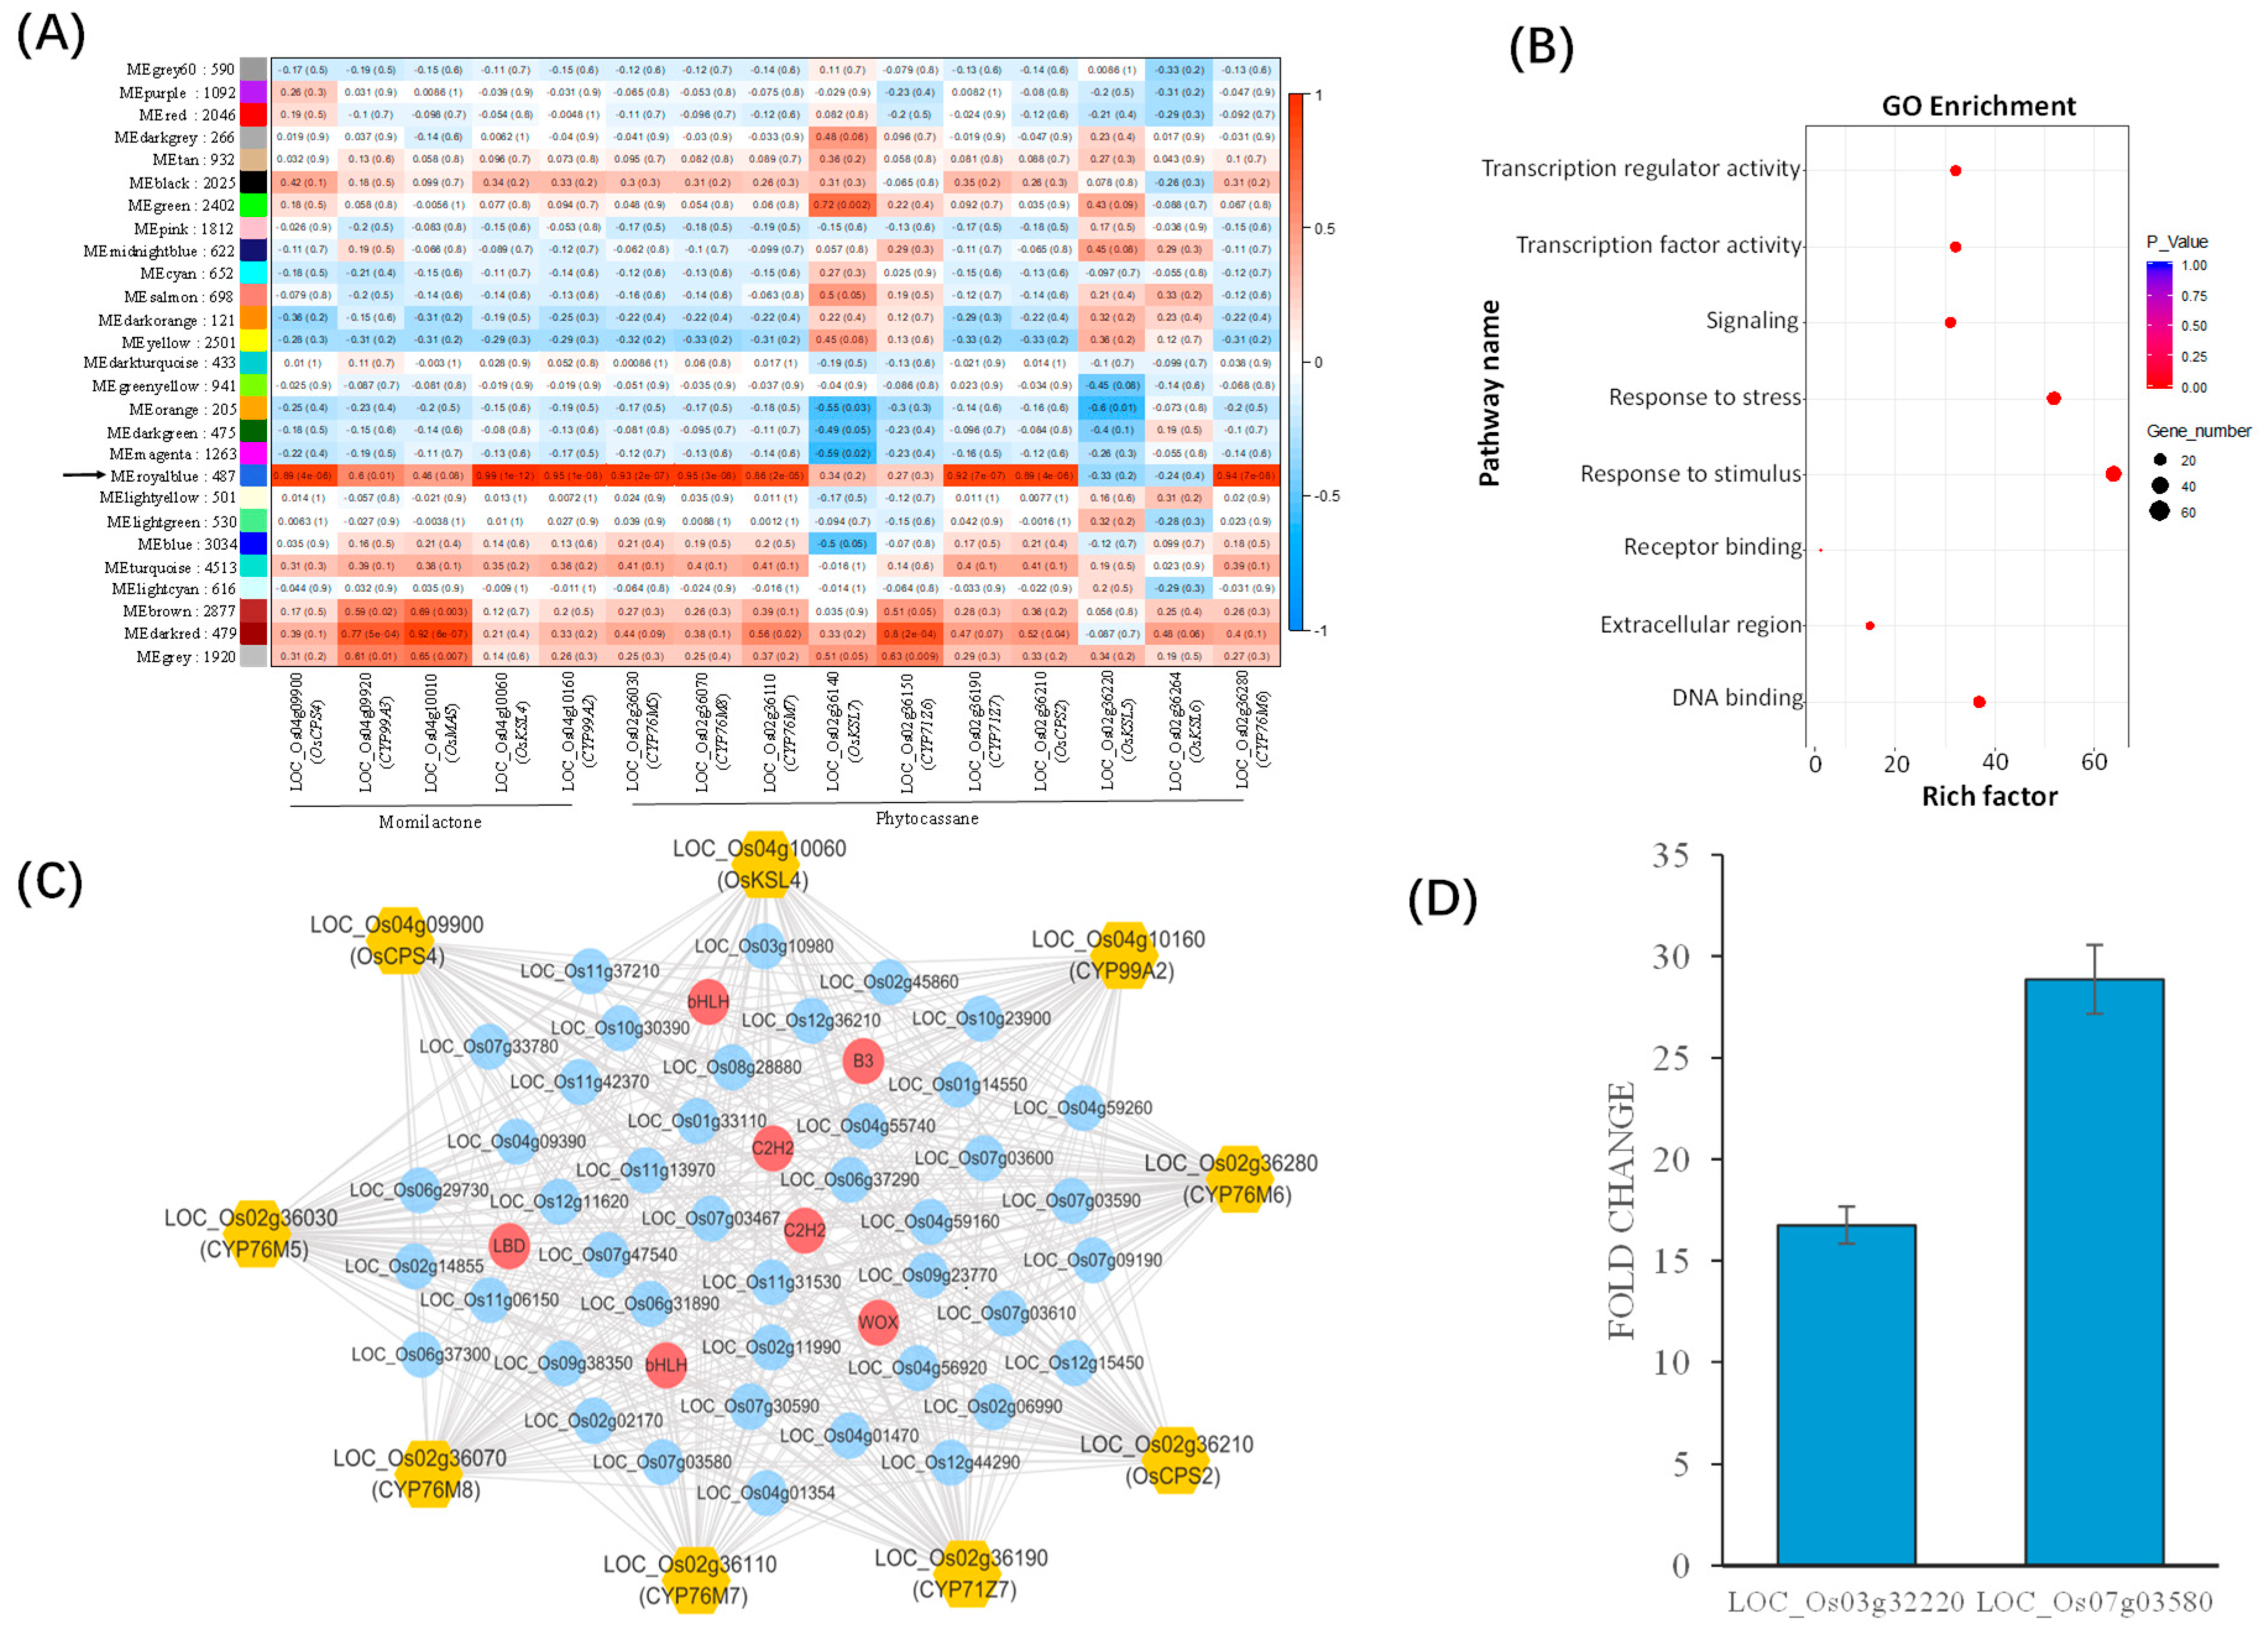
2.4. New Hub Genes Co-regulating with the Two Known Diterpenoid Gene Clusters in Rice
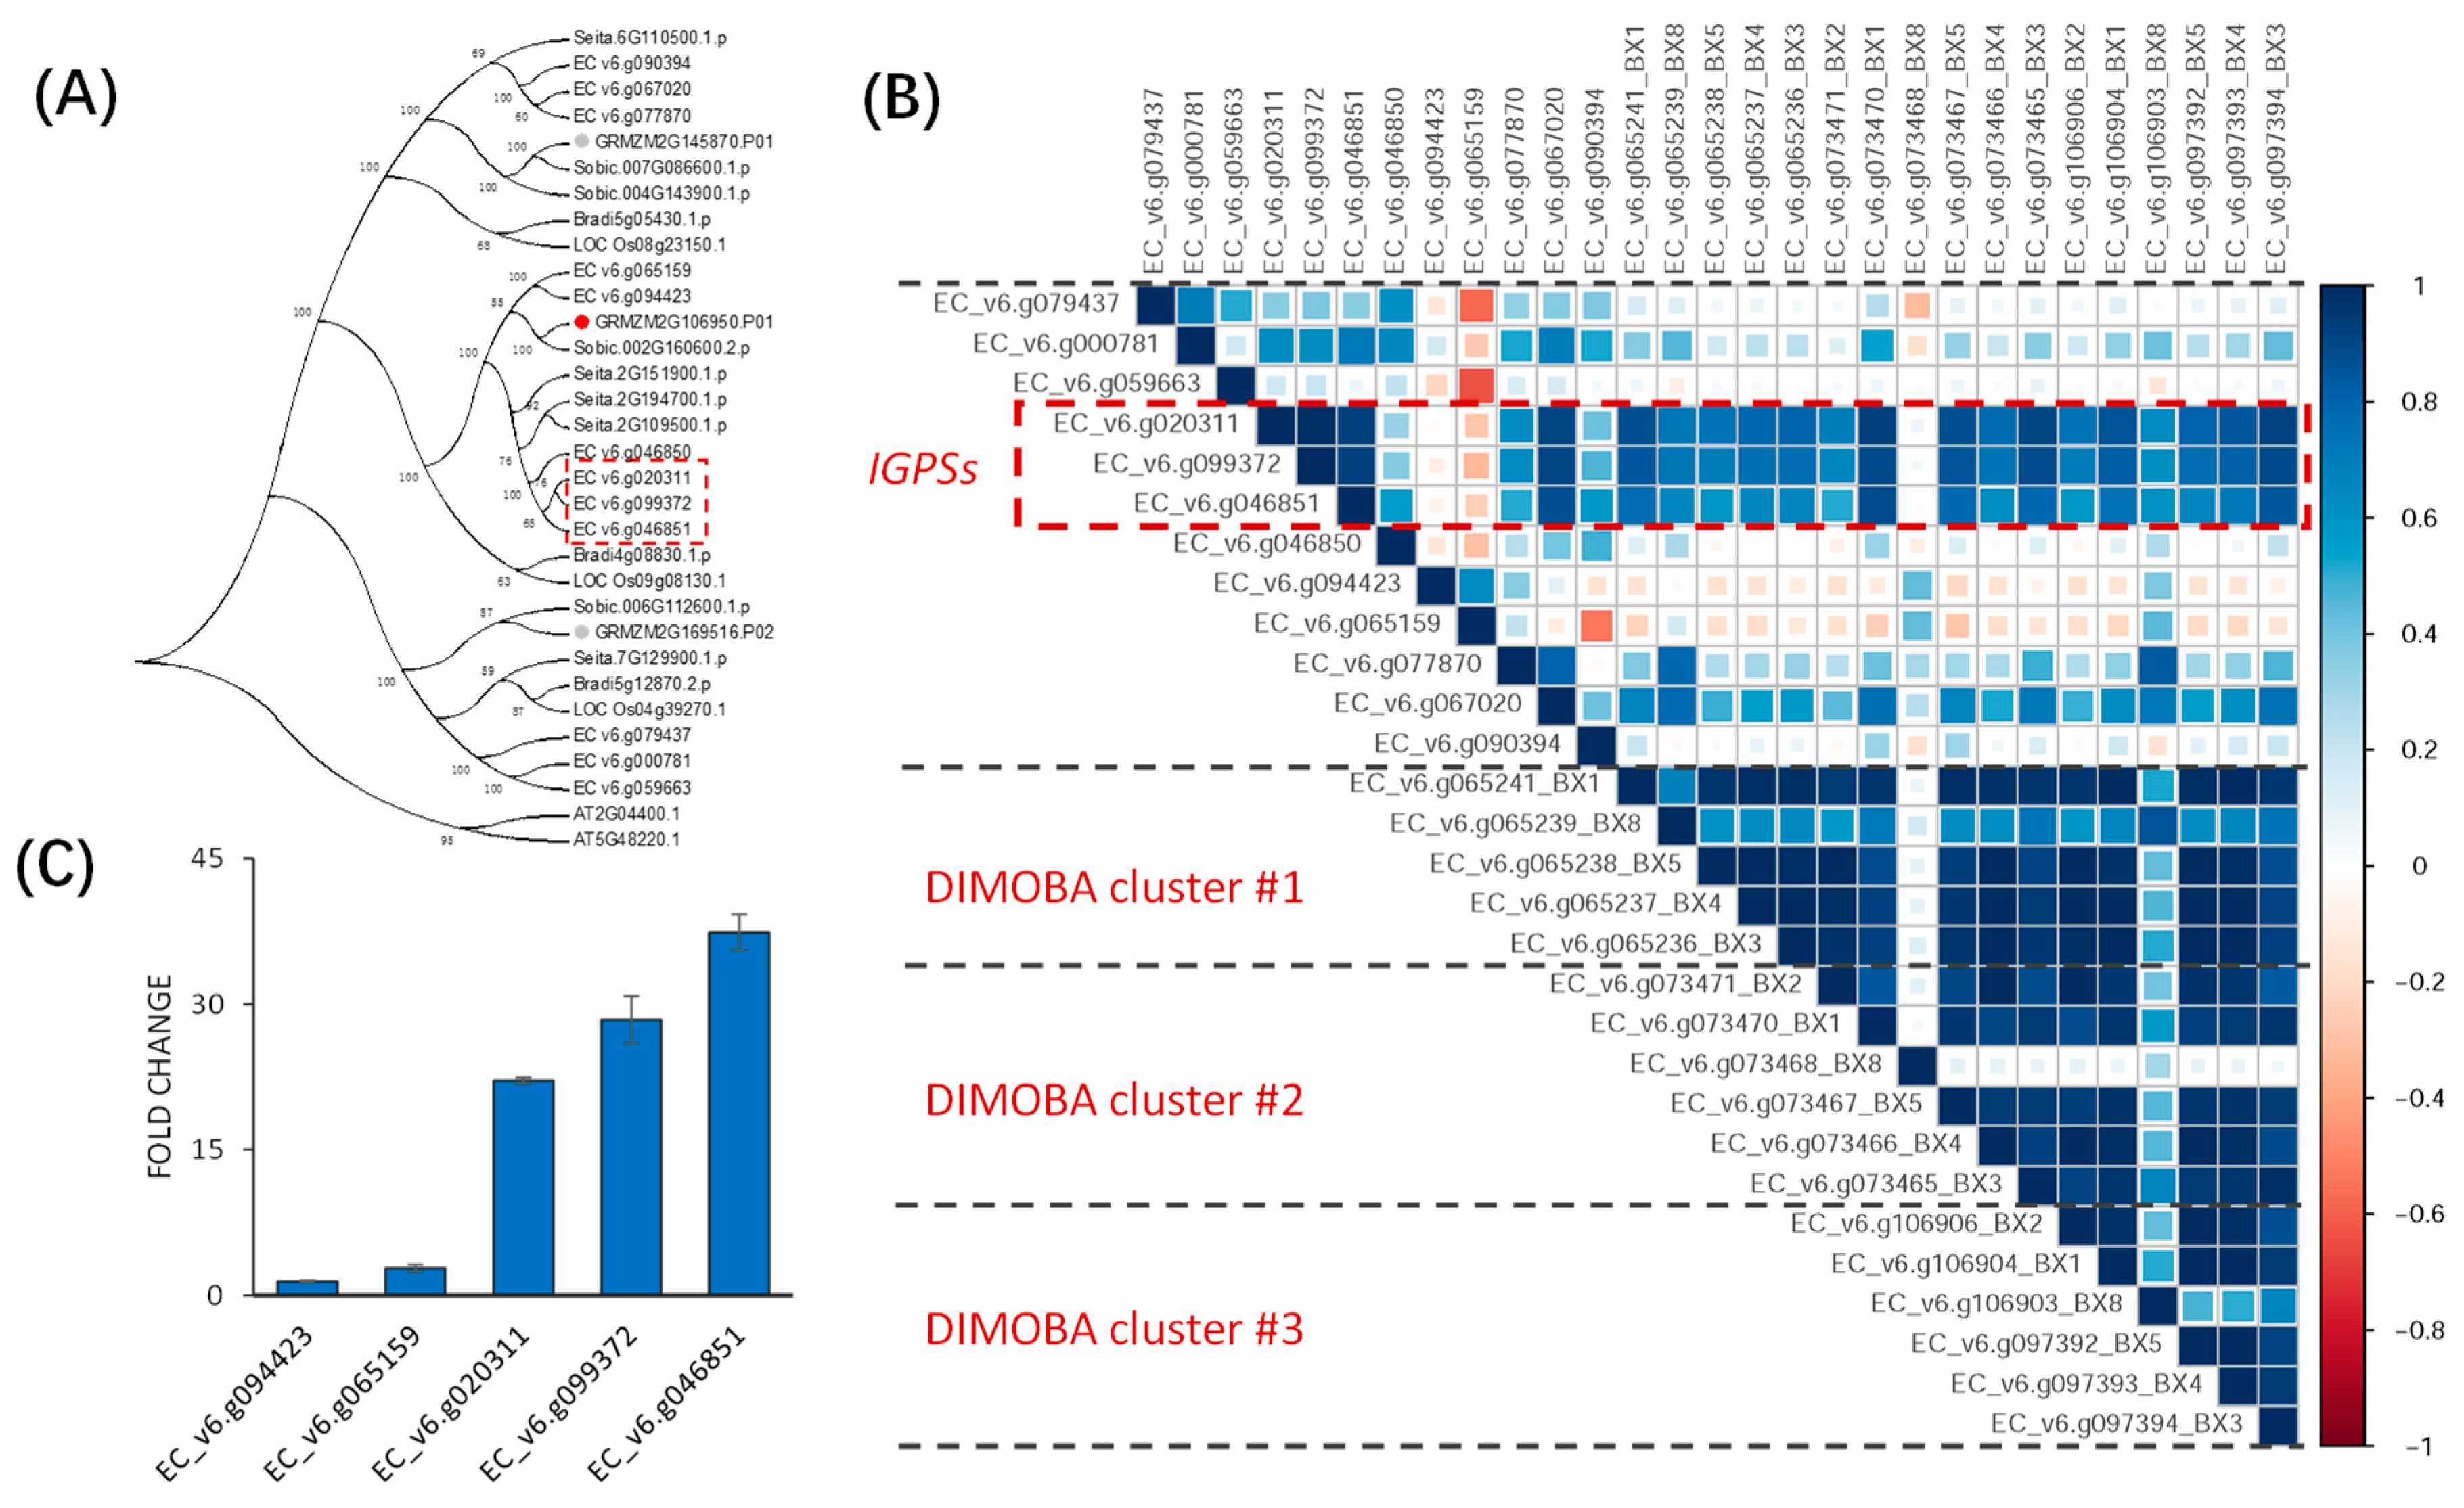
2.5. Putative Upstream Genes of the DIMBOA and Presumable Momilactone Biosynthetic Gene Clusters in Barnyardgrass
3. Discussion
4. Materials and Methods
4.1. Plant Materials and Growth Conditions
4.2. Analysis of RNA-seq Data
4.3. Metabolic Pathway Annotation
4.4. Prediction of Candidate Biosynthetic Gene Clusters by PlantiSMASH
4.5. Gene Cluster Validation by Co-pathway and Co-expression Analyses
4.6. Co-expression Network Investigation
4.7. Module Hub Gene Analysis and Visualization
4.8. Enrichment Analyses of Gene Modules
4.9. Orthologous Gene Identification
4.10. Gene Expression Validation Using Quantitative Real-Time PCR (qRT-PCR)
5. Conclusions
Supplementary Materials
Author Contributions
Funding
Acknowledgments
Conflicts of Interest
Abbreviations
| BGCs | Biosynthetic gene clusters |
| DPF | Diterpenoid phytoalexin factor |
| WGCNA | Weighted gene co-expression network analysis |
| BX1 | Indole-3-glycerolphosphatelyase |
| IGPS | Indole-3-glycerolphosphate synthase |
| PCC | Pearson correlation coefficient |
| MM | Module membership |
| GS | Gene significance |
| qRT-PCR | quantitative real-time PCR |
References
- Rice, E. Allelopathy, 2nd ed.; Academic Press: Orlando, FL, USA, 1984; p. 422. [Google Scholar]
- Khanh, T.D.; Chung, M.I.; Xuan, T.D.; Tawata, S. The exploitation of crop allelopathy in sustainable agricultural production. J. Agron. Crop Sci. 2005, 191, 172–184. [Google Scholar] [CrossRef]
- Cheng, F.; Cheng, Z.H. Research Progress on the use of Plant Allelopathy in Agriculture and the Physiological and Ecological Mechanisms of Allelopathy. Front. Plant Sci. 2015, 6, 1020. [Google Scholar] [CrossRef]
- Guo, L.B.; Qiu, J.; Ye, C.Y.; Jin, G.L.; Mao, L.F.; Zhang, H.Q.; Yang, X.F.; Peng, Q.; Wang, Y.Y.; Jia, L.; et al. Echinochloa crus-galli genome analysis provides insight into its adaptation and invasiveness as a weed. Nat. Commun. 2017, 8, 1031. [Google Scholar] [CrossRef]
- Boycheva, S.; Daviet, L.; Wolfender, J.-L.; Fitzpatrick, T.B. The rise of operon-like gene clusters in plants. Trends Plant Sci. 2014, 19, 447–459. [Google Scholar] [CrossRef]
- Xu, M.M.; Galhano, R.; Wiemann, P.; Bueno, E.; Tiernan, M.; Wu, W.; Chung, I.M.; Gershenzon, J.; Tudzynski, B.; Sesma, A.; et al. Genetic evidence for natural product-mediated plant-plant allelopathy in rice (Oryza sativa). New Phytol. 2012, 193, 570–575. [Google Scholar] [CrossRef]
- Olsen, K.M.; Small, L.L. Micro- and macroevolutionary adaptation through repeated loss of a complete metabolic pathway. New Phytol. 2018, 219, 757–766. [Google Scholar] [CrossRef]
- Nutzmann, H.W.; Osbourn, A. Regulation of metabolic gene clusters in Arabidopsis thaliana. New Phytol. 2015, 205, 503–510. [Google Scholar] [CrossRef]
- Higashi, Y.; Saito, K. Network analysis for gene discovery in plant-specialized metabolism. Plant Cell Environ. 2013, 36, 1597–1606. [Google Scholar] [CrossRef] [Green Version]
- Kautsar, S.A.; Duran, H.G.S.; Blin, K.; Osbourn, A.; Medema, M.H. plantiSMASH: Automated identification, annotation and expression analysis of plant biosynthetic gene clusters. Nucleic Acids Res. 2017, 45, W55–W63. [Google Scholar] [CrossRef]
- Schlapfer, P.; Zhang, P.; Wang, C.; Kim, T.; Banf, M.; Chae, L.; Dreher, K.; Chavali, A.K.; Nilo-Poyanco, R.; Bernard, T.; et al. Genome-Wide Prediction of Metabolic Enzymes, Pathways, and Gene Clusters in Plants. Plant Physiol. 2017, 173, 2041–2059. [Google Scholar] [CrossRef] [Green Version]
- Kraehmer, H.; Jabran, K.; Mennan, H.; Chauhan, B. Global distribution of rice weeds—A review. Crop Prot. 2016, 80, 73–86. [Google Scholar] [CrossRef]
- Xuan, T.D.; Chung, M.I.; Khanh, T.D.; Tawata, S. Identification of phytotoxic substances from early growth of barnyard grass (Echinochloa crusgalli) root exudates. J. Chem. Ecol. 2006, 32, 895–906. [Google Scholar] [CrossRef]
- Toyomasu, T.; Niida, R.; Kenmoku, H.; Kanno, Y.; Miura, S.; Nakano, C.; Shiono, Y.; Mitsuhashi, W.; Toshima, H.; Oikawa, H.; et al. Identification of diterpene biosynthetic gene clusters and functional analysis of labdane-related diterpene cyclases in Phomopsis amygdali. Biosci. Biotechnol. Biochem. 2008, 72, 1038–1047. [Google Scholar] [CrossRef]
- Kato-Noguchi, H.; Ino, T.; Ota, K. Secretion of momilactone A from rice roots to the rhizosphere. J. Plant Physiol. 2008, 165, 691–696. [Google Scholar] [CrossRef]
- Kato-Noguchi, H.; Peters, R.J. The role of momilactones in rice allelopathy. J. Chem. Ecol. 2013, 39, 175–185. [Google Scholar] [CrossRef]
- Kato-Noguchi, H. Barnyard grass-induced rice allelopathy and momilactone B. J. Plant Physiol. 2011, 168, 1016–1020. [Google Scholar] [CrossRef]
- Zhao, H.; Li, H.B.; Kong, C.H.; Xu, X.H.; Liang, W.J. Chemical response of allelopathic rice seedlings under varying environmental conditions. Allelopathy J. 2005, 15, 105–110. [Google Scholar]
- Shimura, K.; Okada, A.; Okada, K.; Jikumaru, Y.; Ko, K.W.; Toyomasu, T.; Sassa, T.; Hasegawa, M.; Kodama, O.; Shibuya, N.; et al. Identification of a biosynthetic gene cluster in rice for momilactones. J. Biol. Chem. 2007, 282, 34013–34018. [Google Scholar] [CrossRef]
- Khanh, T.D.; Xuan, T.D.; Chung, I.M. Rice allelopathy and the possibility for weed management. Ann. Appl. Biol. 2007, 151, 325–339. [Google Scholar] [CrossRef]
- Yamamura, C.; Mizutani, E.; Okada, K.; Nakagawa, H.; Fukushima, S.; Tanaka, A.; Maeda, S.; Kamakura, T.; Yamane, H.; Takatsuji, H.; et al. Diterpenoid phytoalexin factor, a bHLH transcription factor, plays a central role in the biosynthesis of diterpenoid phytoalexins in rice. Plant J. 2015, 84, 1100–1113. [Google Scholar] [CrossRef]
- Aoki, K.; Ogata, Y.; Shibata, D. Approaches for extracting practical information from gene co-expression networks in plant biology. Plant Cell Physiol. 2007, 48, 381–390. [Google Scholar] [CrossRef]
- Langfelder, P.; Horvath, S. WGCNA: An R package for weighted correlation network analysis. BMC Bioinform. 2008, 9, 559. [Google Scholar] [CrossRef]
- Shaik, R.; Ramakrishna, W. Genes and Co-Expression Modules Common to Drought and Bacterial Stress Responses in Arabidopsis and Rice. PLoS ONE 2013, 8, e77261. [Google Scholar] [CrossRef]
- Swaminathan, S.; Morrone, D.; Wang, Q.; Fulton, D.B.; Peters, R.J. CYP76M7 is an ent-cassadiene C11alpha-hydroxylase defining a second multifunctional diterpenoid biosynthetic gene cluster in rice. Plant Cell 2009, 21, 3315–3325. [Google Scholar] [CrossRef]
- El Molla, S.G.; Motaal, A.A.; El Hefnawy, H.; El Fishawy, A. Cytotoxic activity of phenolic constituents from Echinochloa crus-galli against four human cancer cell lines. Rev. Bras. Farmacogn. 2016, 26, 62–67. [Google Scholar] [CrossRef] [Green Version]
- Parvez, M.M.; Tomita-Yokotani, K.; Fujii, Y.; Konishi, T.; Iwashina, T. Effects of quercetin and its seven derivatives on the growth of Arabidopsis thaliana and Neurospora crassa. Biochem. Syst. Ecol. 2004, 32, 631–635. [Google Scholar] [CrossRef]
- Wisecaver, J.H.; Borowsky, A.T.; Tzin, V.; Jander, G.; Kliebenstein, D.J.; Rokas, A. A Global Coexpression Network Approach for Connecting Genes to Specialized Metabolic Pathways in Plants. Plant Cell 2017, 29, 944–959. [Google Scholar] [CrossRef] [Green Version]
- Lam, K.C.; Ibrahim, R.K.; Behdad, B.; Dayanandan, S. Structure, function, and evolution of plant O-methyltransferases. Genome 2007, 50, 1001–1013. [Google Scholar] [CrossRef]
- Czolpinska, M.; Rurek, M. Plant Glycine-Rich Proteins in Stress Response: An Emerging, Still Prospective Story. Front. Plant Sci. 2018, 9, 302. [Google Scholar] [CrossRef]
- Chen, F.; Tholl, D.; Bohlmann, J.; Pichersky, E. The family of terpene synthases in plants: A mid-size family of genes for specialized metabolism that is highly diversified throughout the kingdom. Plant J. 2011, 66, 212–229. [Google Scholar] [CrossRef]
- Zhou, F.; Wang, C.Y.; Gutensohn, M.; Jiang, L.; Zhang, P.; Zhang, D.; Dudareva, N.; Lu, S. A recruiting protein of geranylgeranyl diphosphate synthase controls metabolic flux toward chlorophyll biosynthesis in rice. Proc. Natl. Acad. Sci. USA 2017, 114, 6866–6871. [Google Scholar] [CrossRef] [Green Version]
- Miyamoto, K.; Fujita, M.; Shenton, M.R.; Akashi, S.; Sugawara, C.; Sakai, A.; Horie, K.; Hasegawa, M.; Kawaide, H.; Mitsuhashi, W.; et al. Evolutionary trajectory of phytoalexin biosynthetic gene clusters in rice. Plant J. 2016, 87, 293–304. [Google Scholar] [CrossRef] [Green Version]
- David, A.V.A.; Arulmoli, R.; Parasuraman, S. Overviews of biological importance of quercetin: A bioactive flavonoid. Pharmacogn. Rev. 2016, 10, 84. [Google Scholar]
- Serin, E.A.; Nijveen, H.; Hilhorst, H.W.; Ligterink, W. Learning from Co-expression Networks: Possibilities and Challenges. Front. Plant Sci. 2016, 7, 444. [Google Scholar] [CrossRef] [Green Version]
- Navarez, D.; Olofsdotter, M. Relay seeding technique for screening allelopathic rice (Oryza sativa). In Proceedings of the Second International Weed Control Congress, Copenhagen, Denmark, 25–28 June 1996; pp. 25–28. [Google Scholar]
- Patel, R.K.; Jain, M. NGS QC Toolkit: A toolkit for quality control of next generation sequencing data. PLoS ONE 2012, 7, e30619. [Google Scholar] [CrossRef]
- Kim, D.; Pertea, G.; Trapnell, C.; Pimentel, H.; Kelley, R.; Salzberg, S.L. TopHat2: Accurate alignment of transcriptomes in the presence of insertions, deletions and gene fusions. Genome Biol. 2013, 14, R36. [Google Scholar] [CrossRef]
- Karp, P.D.; Latendresse, M.; Caspi, R. The pathway tools pathway prediction algorithm. Stand. Genomic Sci. 2011, 5, 424–429. [Google Scholar] [CrossRef]
- Caspi, R.; Altman, T.; Billington, R.; Dreher, K.; Foerster, H.; Fulcher, C.A.; Holland, T.A.; Keseler, I.M.; Kothari, A.; Kubo, A.; et al. The MetaCyc database of metabolic pathways and enzymes and the BioCyc collection of Pathway/Genome Databases. Nucleic Acids Res. 2014, 42, D459–D471. [Google Scholar] [CrossRef]
- Wei, T.; Simko, V.; Levy, M.; Xie, Y.; Jin, Y.; Zemla, J. Package ‘corrplot’. Statistician 2017, 56, 316–324. [Google Scholar]
- Albert, R. Scale-free networks in cell biology. J. Cell Sci. 2005, 118, 4947–4957. [Google Scholar] [CrossRef] [Green Version]
- Shannon, P.; Markiel, A.; Ozier, O.; Baliga, N.S.; Wang, J.T.; Ramage, D.; Amin, N.; Schwikowski, B.; Ideker, T. Cytoscape: A software environment for integrated models of biomolecular interaction networks. Genome Res. 2003, 13, 2498–2504. [Google Scholar] [CrossRef]
- Jin, J.; Tian, F.; Yang, D.C.; Meng, Y.Q.; Kong, L.; Luo, J.; Gao, G. PlantTFDB 4.0: Toward a central hub for transcription factors and regulatory interactions in plants. Nucleic Acids Res. 2017, 45, D1040–D1045. [Google Scholar] [CrossRef]
- Stamatakis, A. RAxML version 8: A tool for phylogenetic analysis and post-analysis of large phylogenies. Bioinformatics 2014, 30, 1312–1313. [Google Scholar] [CrossRef]
- Tamura, K.; Peterson, D.; Peterson, N.; Stecher, G.; Nei, M.; Kumar, S. MEGA5: Molecular Evolutionary Genetics Analysis Using Maximum Likelihood, Evolutionary Distance, and Maximum Parsimony Methods. Mol. Biol. Evol. 2011, 28, 2731–2739. [Google Scholar] [CrossRef] [Green Version]
- Alamin, M.; Zeng, D.-D.; Qin, R.; Sultana, M.H.; Jin, X.-L.; Shi, C.-H. Characterization and Fine Mapping of SFL1, a Gene Controlling Screw Flag Leaf in Rice. Plant Mol. Biol. Rep. 2017, 35, 491–503. [Google Scholar] [CrossRef]


© 2019 by the authors. Licensee MDPI, Basel, Switzerland. This article is an open access article distributed under the terms and conditions of the Creative Commons Attribution (CC BY) license (http://creativecommons.org/licenses/by/4.0/).
Share and Cite
Sultana, M.H.; Liu, F.; Alamin, M.; Mao, L.; Jia, L.; Chen, H.; Wu, D.; Wang, Y.; Fu, F.; Wu, S.; et al. Gene Modules Co-regulated with Biosynthetic Gene Clusters for Allelopathy between Rice and Barnyardgrass. Int. J. Mol. Sci. 2019, 20, 3846. https://doi.org/10.3390/ijms20163846
Sultana MH, Liu F, Alamin M, Mao L, Jia L, Chen H, Wu D, Wang Y, Fu F, Wu S, et al. Gene Modules Co-regulated with Biosynthetic Gene Clusters for Allelopathy between Rice and Barnyardgrass. International Journal of Molecular Sciences. 2019; 20(16):3846. https://doi.org/10.3390/ijms20163846
Chicago/Turabian StyleSultana, Most. Humaira, Fangjie Liu, Md. Alamin, Lingfeng Mao, Lei Jia, Hongyu Chen, Dongya Wu, Yingying Wang, Fei Fu, Sanling Wu, and et al. 2019. "Gene Modules Co-regulated with Biosynthetic Gene Clusters for Allelopathy between Rice and Barnyardgrass" International Journal of Molecular Sciences 20, no. 16: 3846. https://doi.org/10.3390/ijms20163846