Article

Ocular-Component-Specific miRNA Expression in a Murine Model of Lens-Induced Myopia

1
Department of Ophthalmology, School of Medicine, Keio University, Shinjuku-ku, Tokyo 160-8582, Japan
2
Laboratory of Photobiology, School of Medicine, Keio University, Shinjuku-ku, Tokyo 160-8582, Japan
3
Santen Pharmaceutical Co., Ltd., Osaka 530-8582, Japan
*
Authors to whom correspondence should be addressed.
Int. J. Mol. Sci. 2019, 20(15), 3629; https://doi.org/10.3390/ijms20153629
Submission received: 31 May 2019 / Revised: 14 July 2019 / Accepted: 22 July 2019 / Published: 24 July 2019

Abstract

:
To identify tissues and molecules involved in refractive myopic shift and axial length elongation in a murine lens-induced myopia model, we performed a comprehensive analysis of microRNA (miRNA) expression. Three weeks after negative 30 diopter lens fixation on three-week-old C57BL/6J mice, total RNA was extracted from individual ocular components including cornea, iris, lens, retina, retinal pigment epithelium (RPE)/choroid, and sclera tissue. The miRNA expression analysis was pooled from three samples and carried out using Agilent Mouse miRNA Microarray (8 × 60 K) miRBase21.0. The expression ratio was calculated, and differentially expressed miRNAs were extracted, using GeneSpring GX 14.5. Myopic induction showed a significant myopic refractive change, axial elongation, and choroidal thinning. Through the comprehensive miRNA analysis, several upregulated miRNAs (56 in cornea tissue, 13 in iris tissue, 6 in lens tissue, 0 in retina tissue, 29 in RPE/choroid tissue, and 30 in sclera tissue) and downregulated miRNAs (7 in cornea tissue, 28 in iris tissue, 17 in lens tissue, 9 in retina tissue, 7 in RPE/choroid tissue, and 40 in sclera tissue) were observed. Overlapping expression changes in miRNAs were also found in different ocular components. Some of this miRNA dysregulation may be functionally involved in refractive myopia shift and axial length elongation.

1. Introduction

In 2000, there were 1.4 billion myopic people globally without correction of refractive errors [1]. It has been predicted that the population of people with myopia will increase to 4.8 billion by 2050 [1,2]. This expansion in the prevalence of myopia is dramatic; therefore, there is an urgent need to understand the mechanisms underlying the development and progression of myopia and establish a treatment. Previous studies have revealed some of the molecular and cellular mechanisms that underlie myopia development; for example, a large genome-wide analysis and a meta-analysis have been performed [3,4]. However, more data are needed to identify the causative factors and biomarkers of myopia progression.
As experimental animal models of myopia, two types of induction, form-deprived myopia (FDM) and lens-induced myopia (LIM), have been performed in mice [5], chicks [6,7], guinea pigs [8,9], tree shrews [10], rabbits [11], and monkeys [12]. Proteomic and microarray analyses have been performed using these experimental animal models of myopia, and changes in several factors were reported [13,14].
MicroRNAs (miRNAs) are single-stranded RNAs comprised of non-coding RNAs of 21–24 nucleotides in length that are known to inhibit gene expression after transcription [15]. MiRNAs play an important role in various diseases [16,17], and may be used as biomarkers of disease. MiRNAs may exist in serum and plasma [18,19], and miRNAs from validated blood samples can be used as predictors of myopia progression. Several previous studies focused on miRNAs involved in myopia progression suggested the possibility of using miRNAs as biomarkers of myopia progression [20,21].
In this study, using a murine model of LIM [5], a comprehensive analysis of miRNA was performed in individual ocular tissues, including cornea, iris, lens, retina, retinal pigment epithelium (RPE)/choroid, and sclera tissues, with the aim of investigating the expression pattern of and change in miRNAs during myopia progression.

2. Results

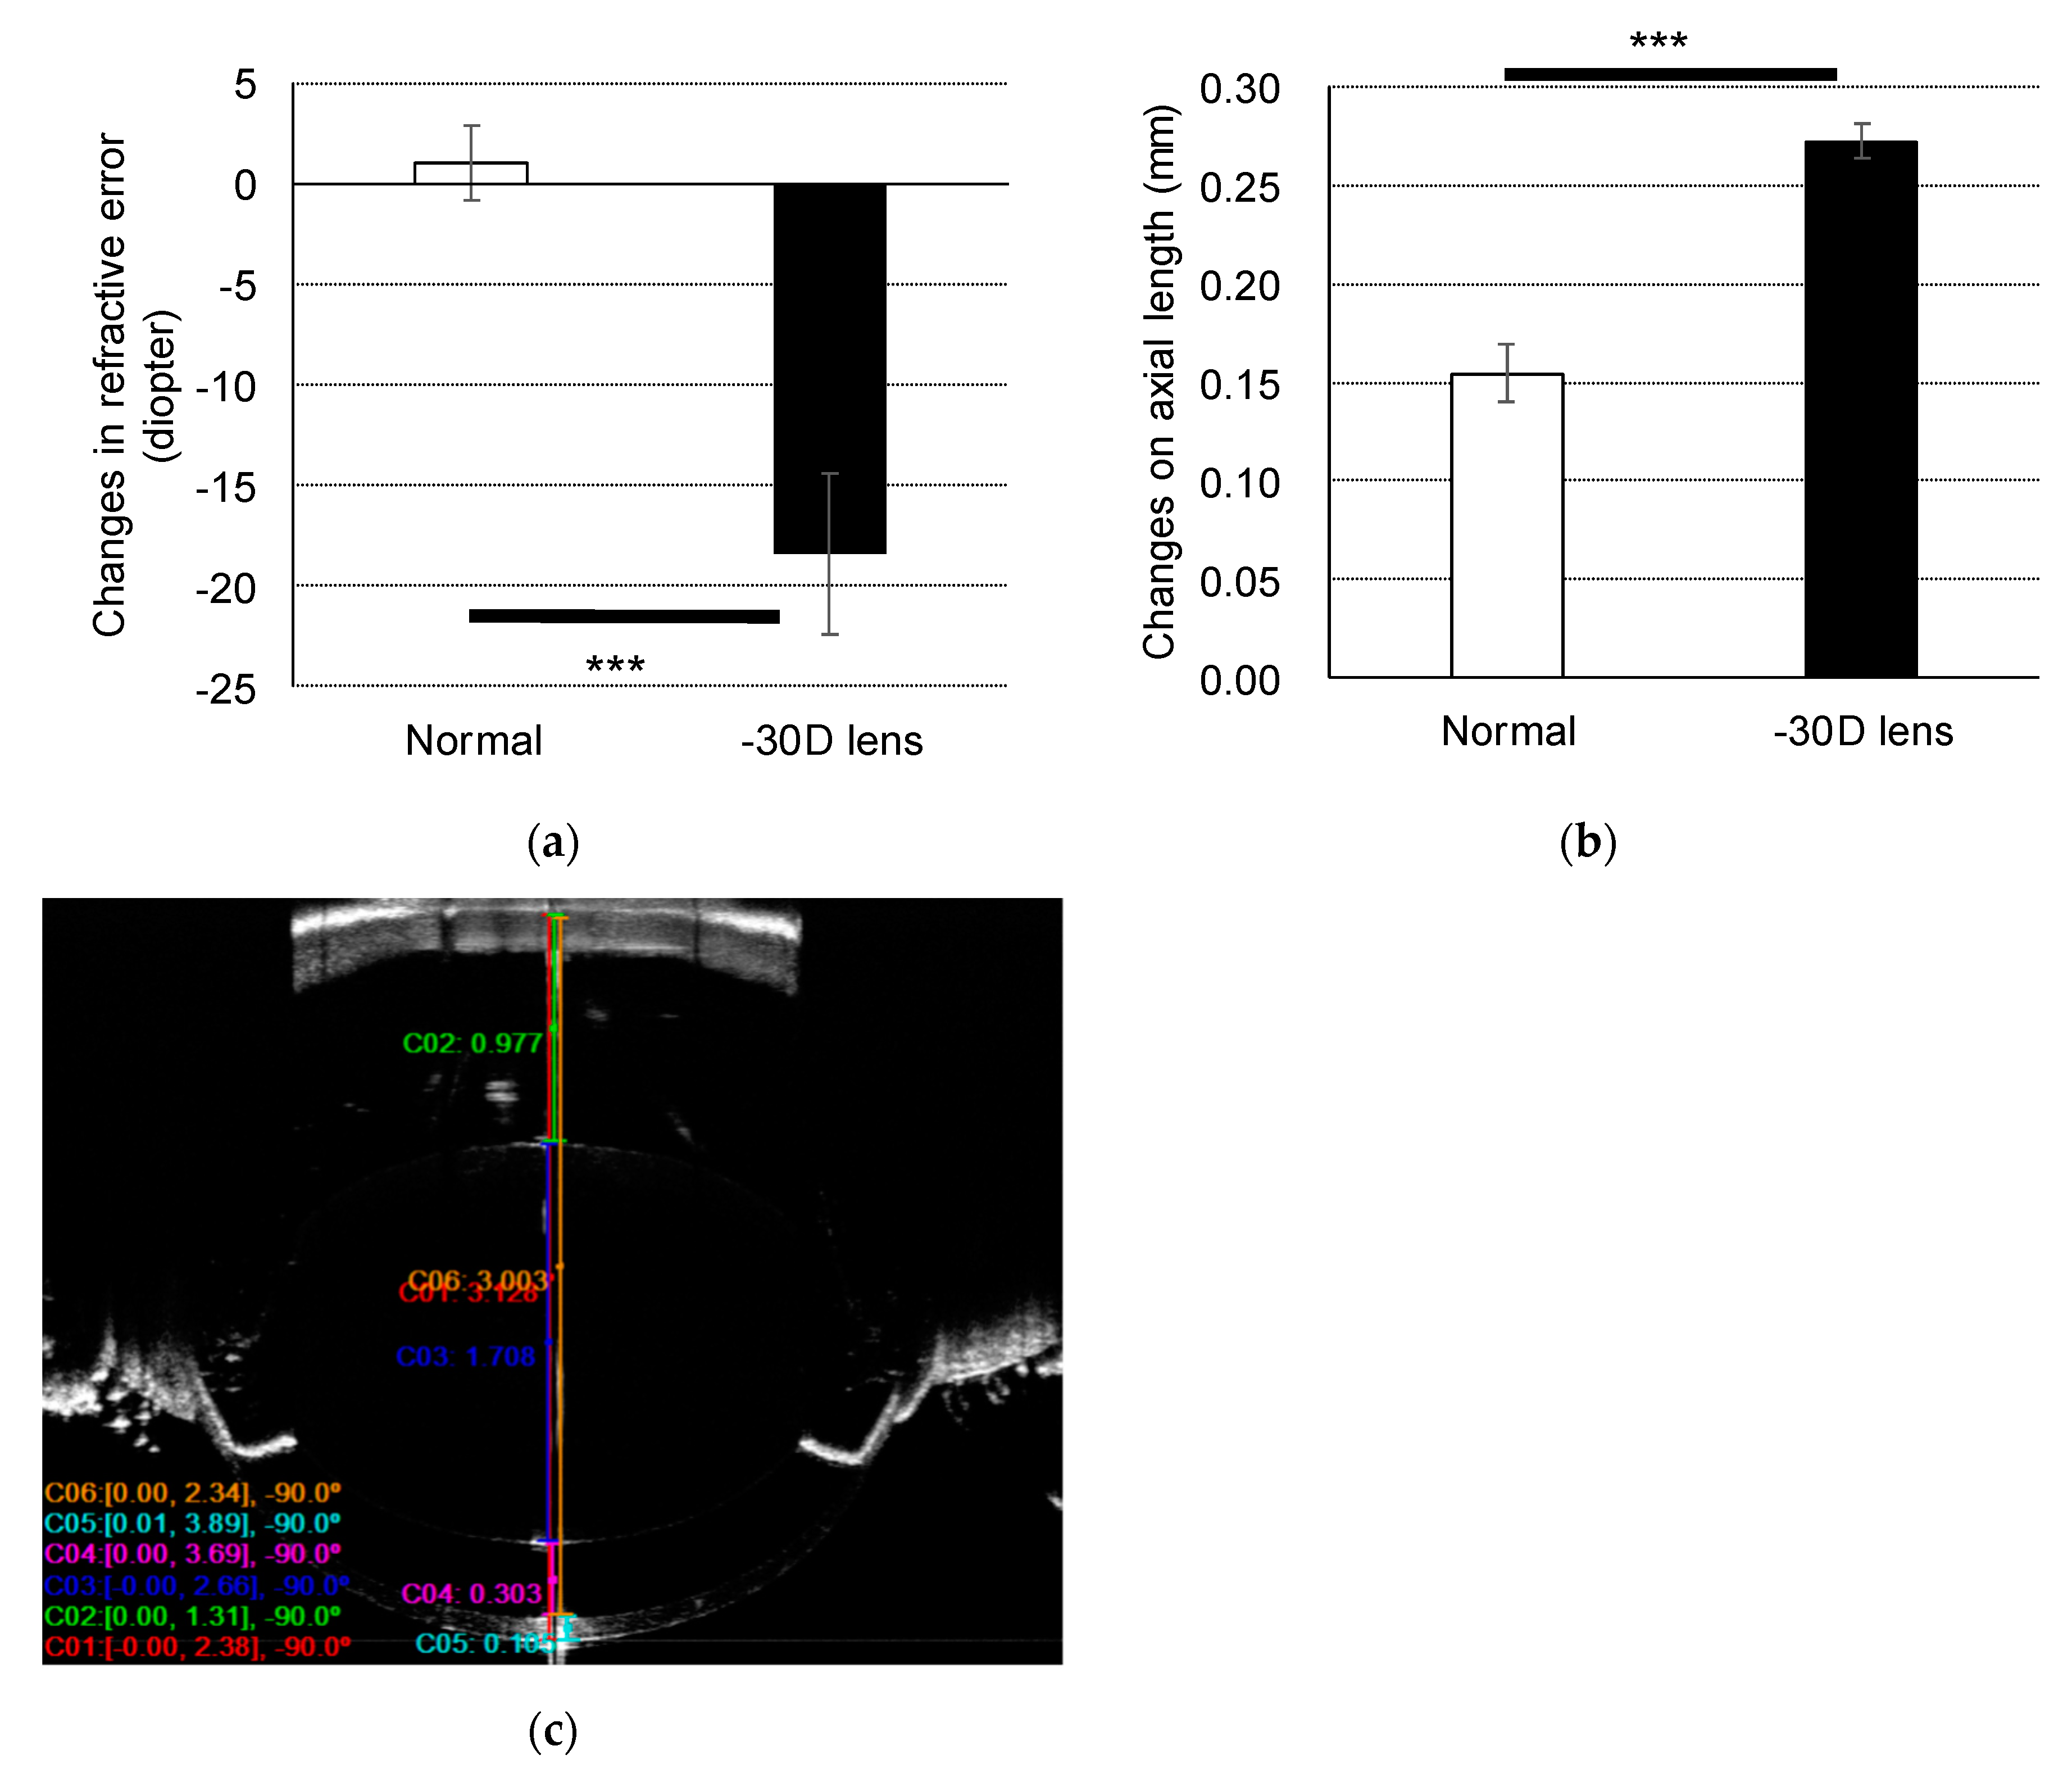
2.1. Refractive Error and Axial Length Changes in the Murine Model of Myopia

Three-week-old C57/BL/6J mice wore a negative 30 diopter (D) lens on the right eye. After three weeks, the changes in refractive error and axial length were evaluated. The naïve right eyes of the mice that were not wearing a lens were used as normal eyes. The eyes with lens-induced myopia showed a significant myopic shift in refractive error (−18.42 D ± 3.98) compared to normal eyes (0.95 D ± 1.85) (p < 0.001, Figure 1a). A significant axial elongation was also observed in eyes with lens-induced myopia (0.273 mm ± 0.009) compared to normal eyes (0.155 mm ± 0.015) (p < 0.001, Figure 1b).

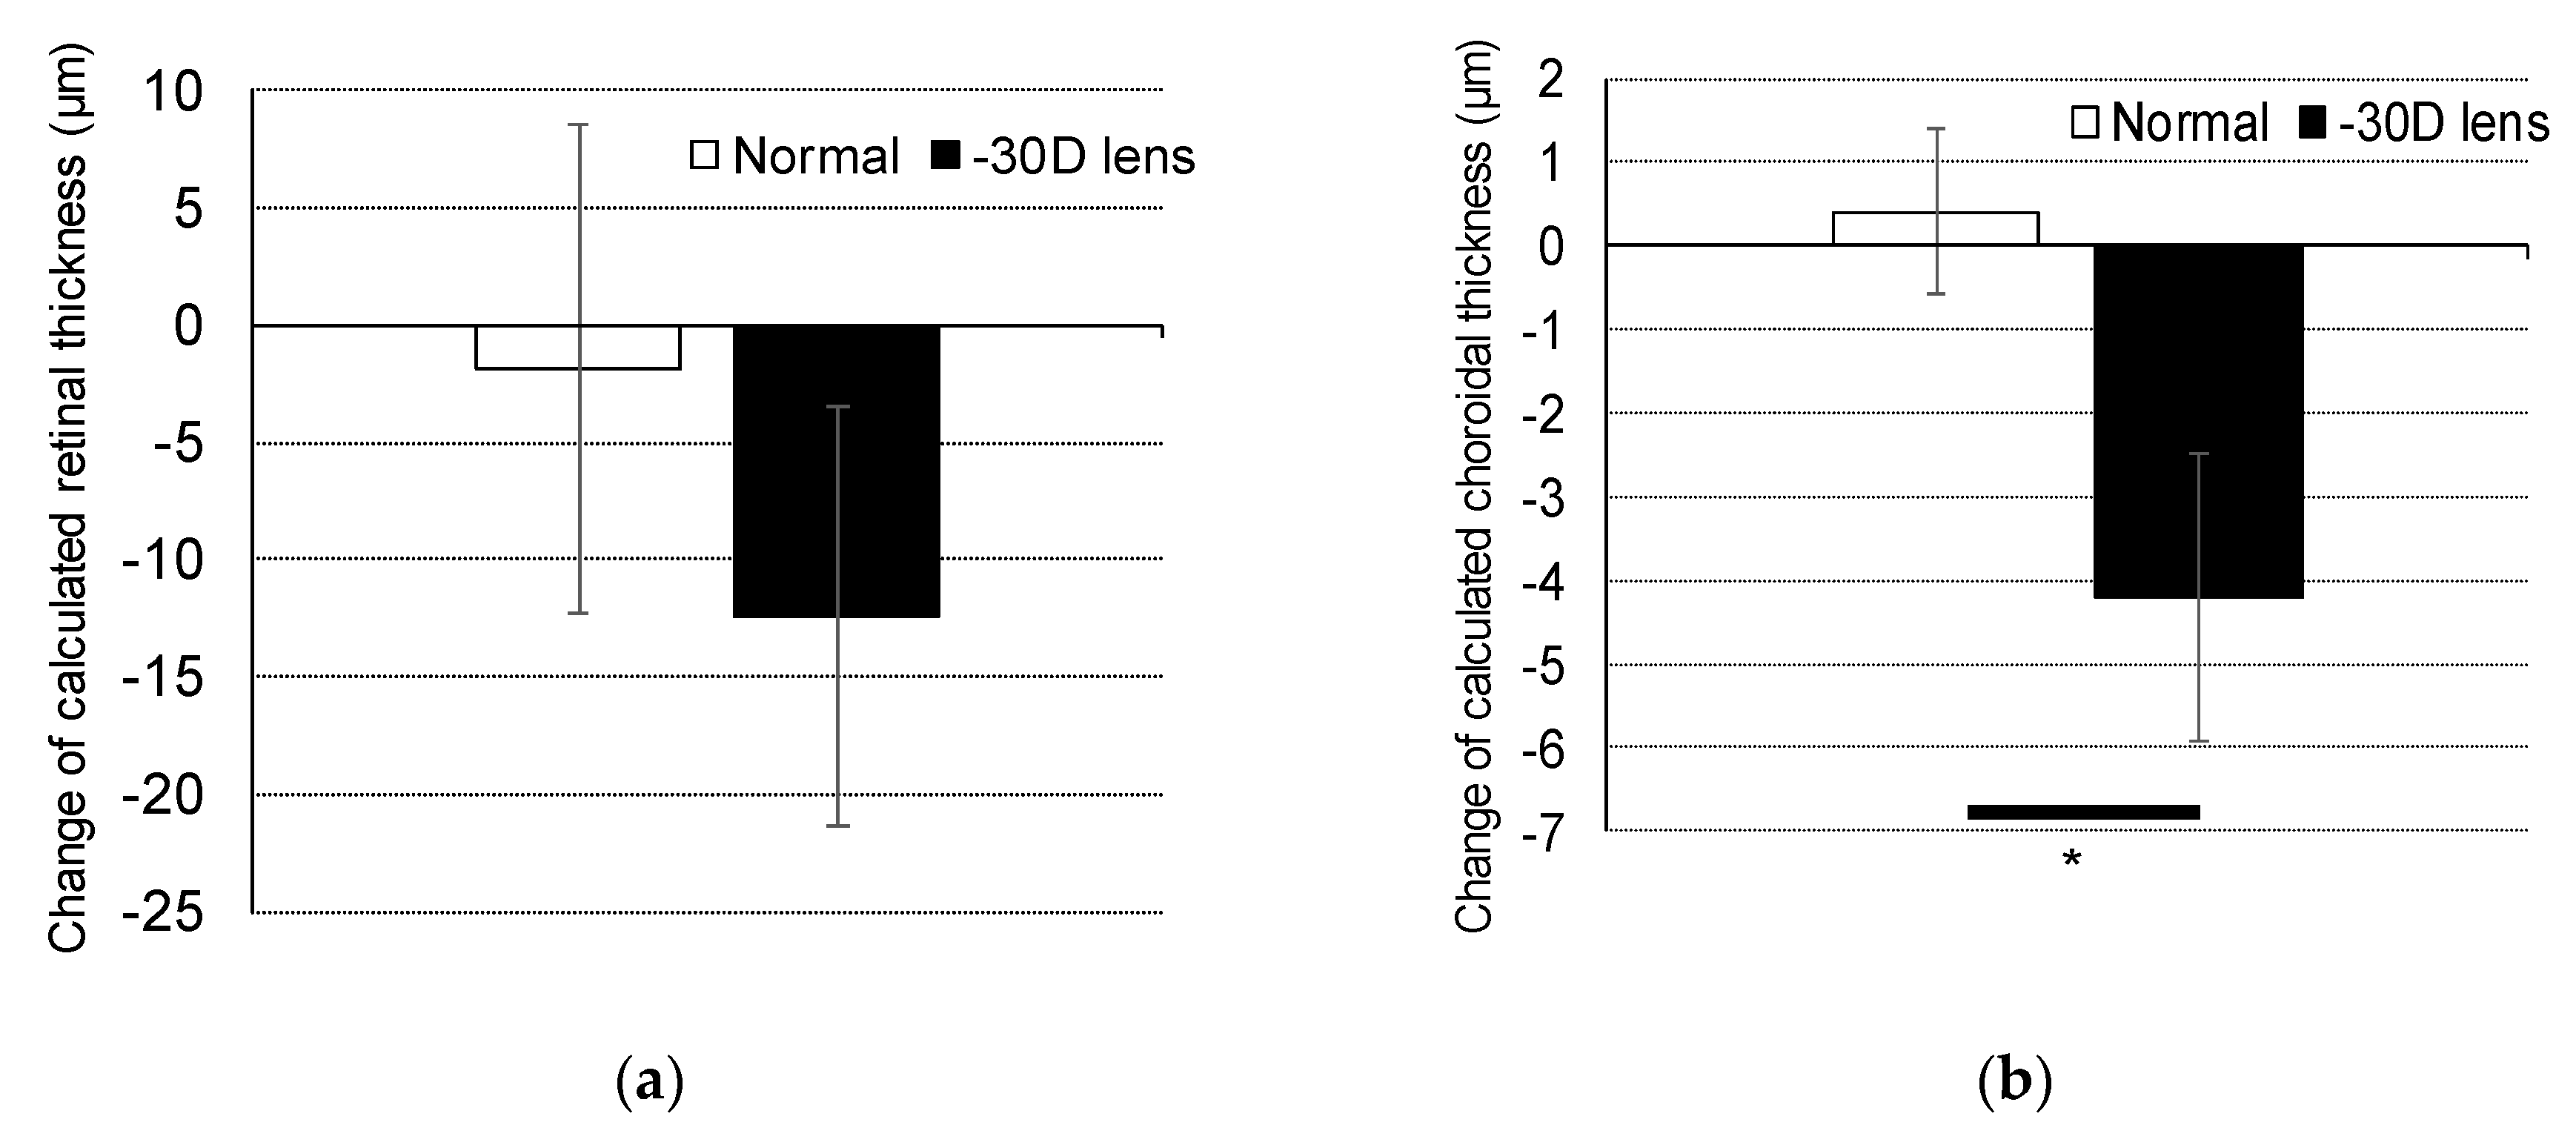
2.2. Change in Retinal and Choroidal Thickness

Three-week-old C57/BL/6J mice wore a negative 30 D lens on the right eye. After three weeks, the changes in retinal and choroidal thickness were evaluated. The naïve right eyes of the mice that were not wearing a lens were used as normal eyes. The eyes with lens-induced myopia showed a reduction in retinal thickness (−12.432 μm ± 8.937) compared to normal eyes (−1.887 μm ± 10.417) (Figure 2a). A significantly thinner choroid was also observed in eyes with lens-induced myopia (–4.196 μm ± 1.716) compared to normal eyes (0.405 μm ± 0.995) (p < 0.05, Figure 2b).

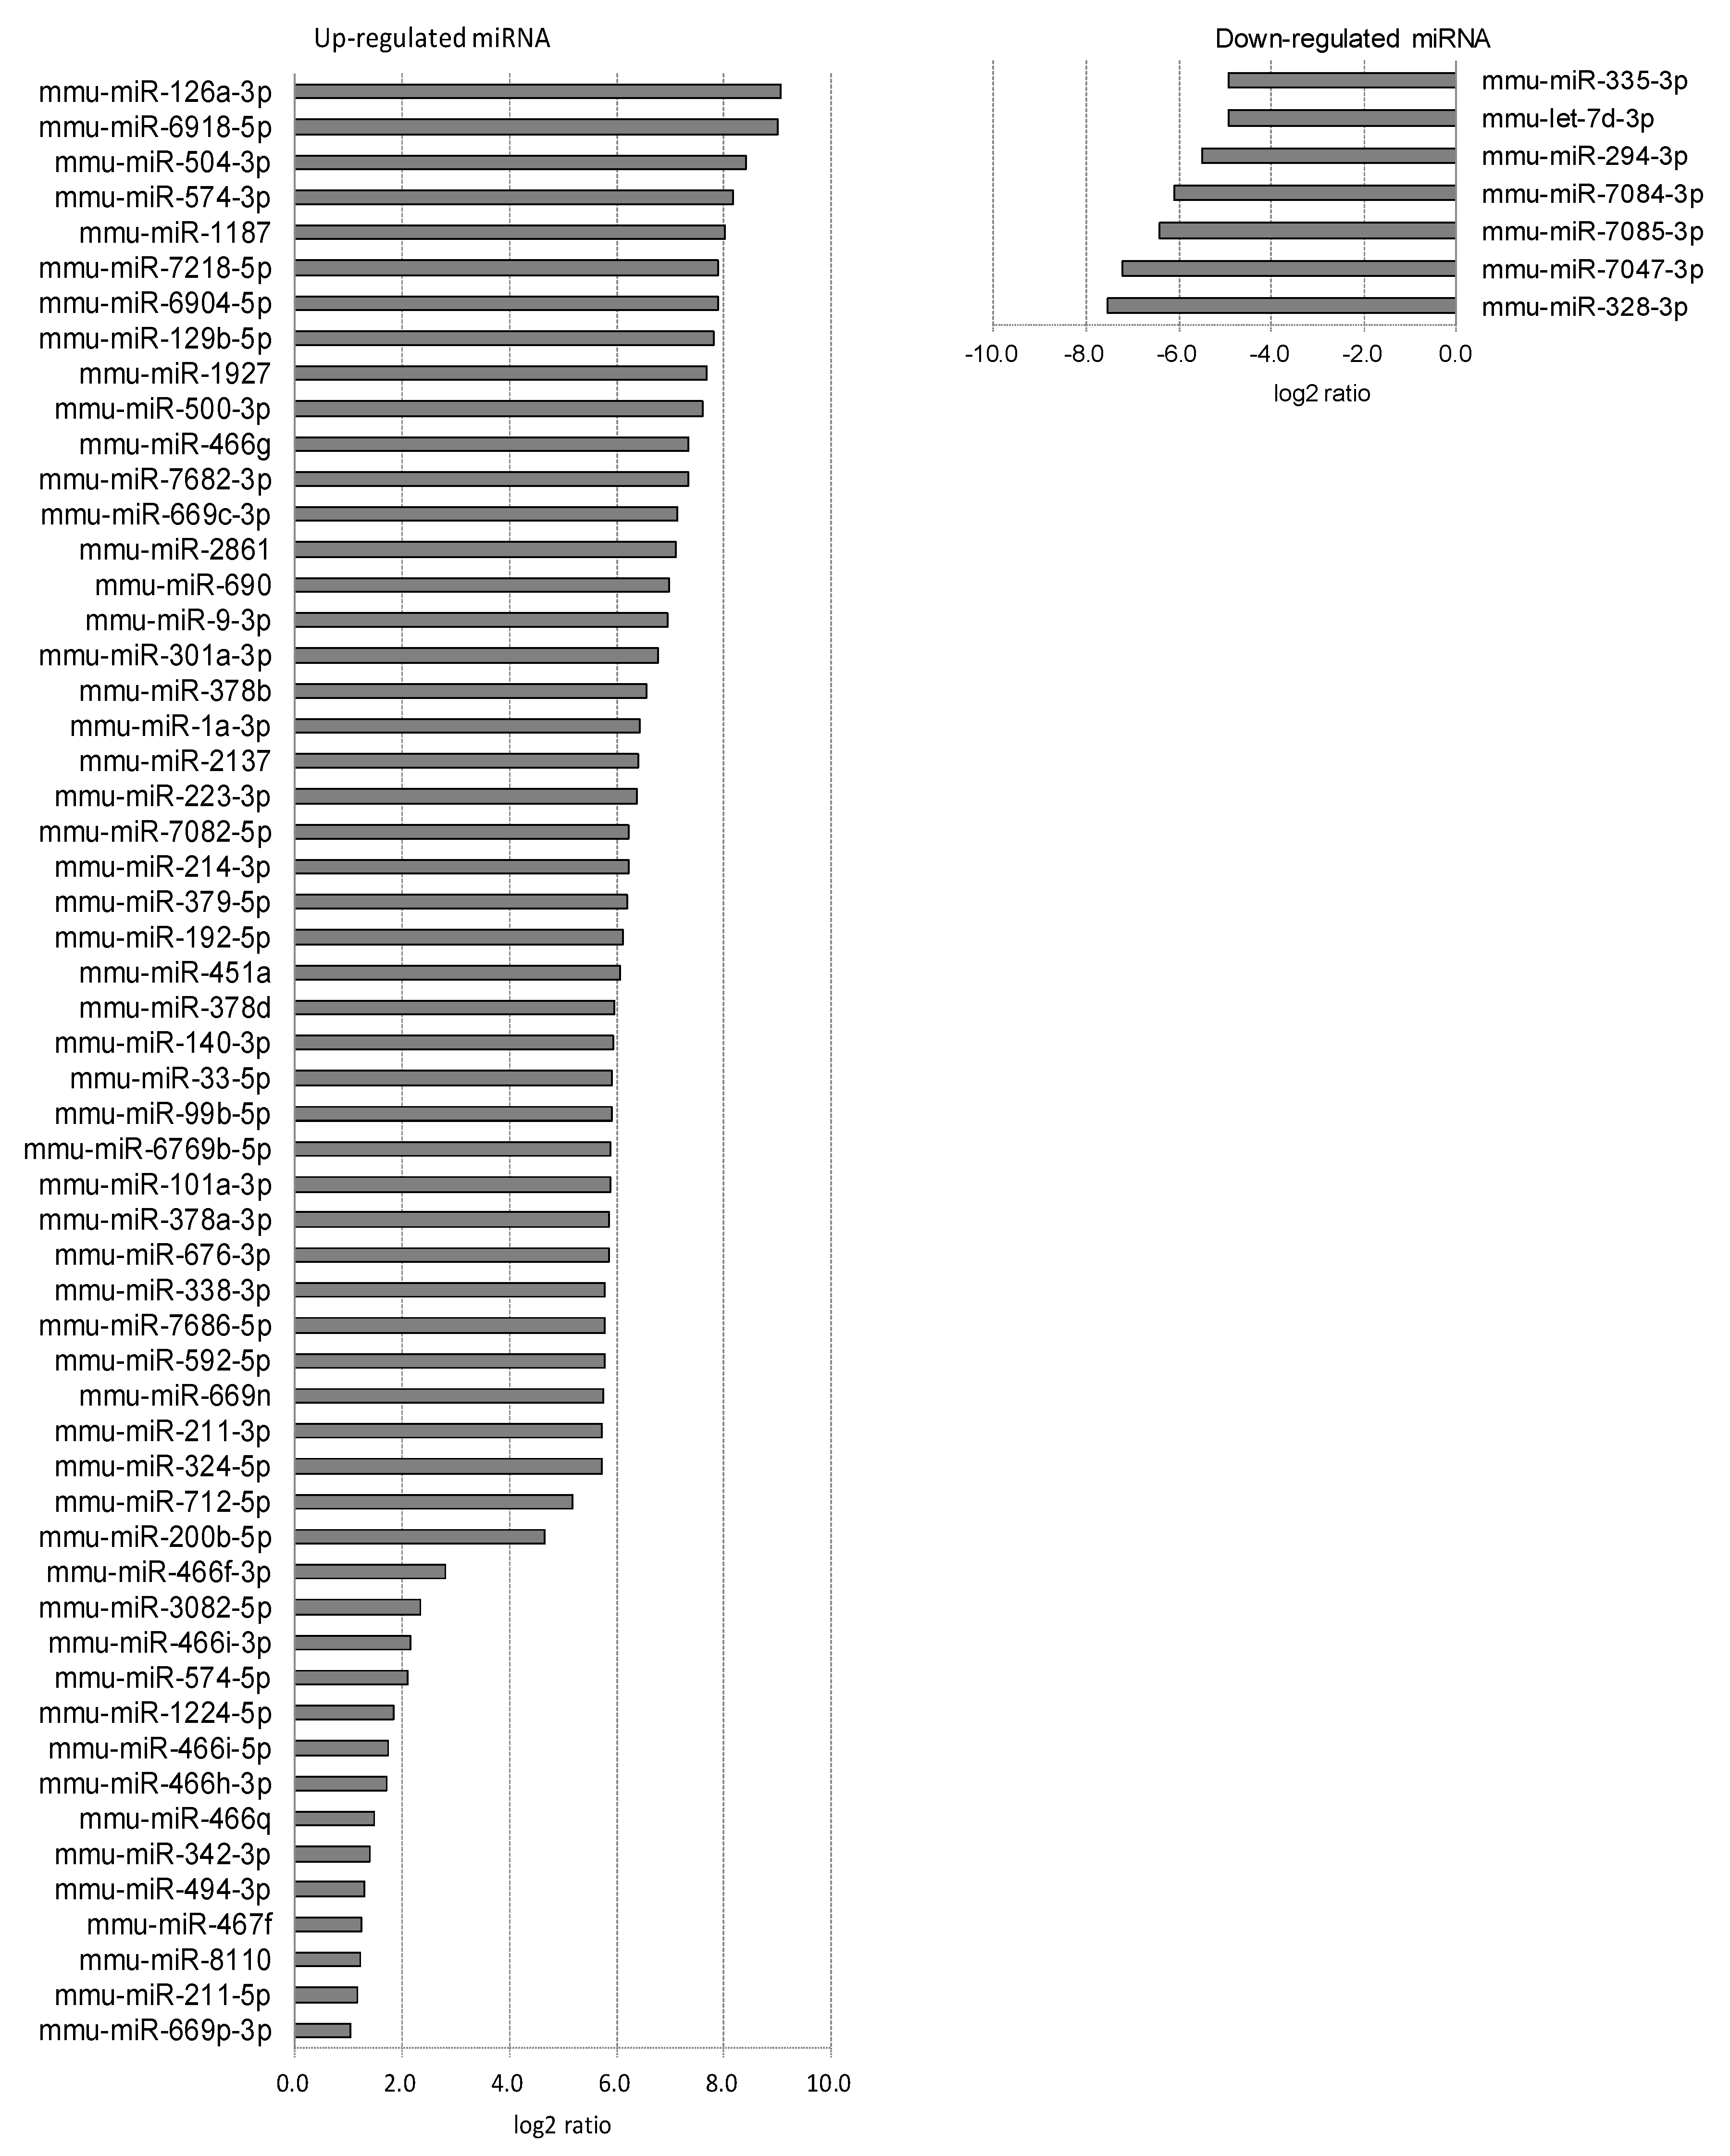
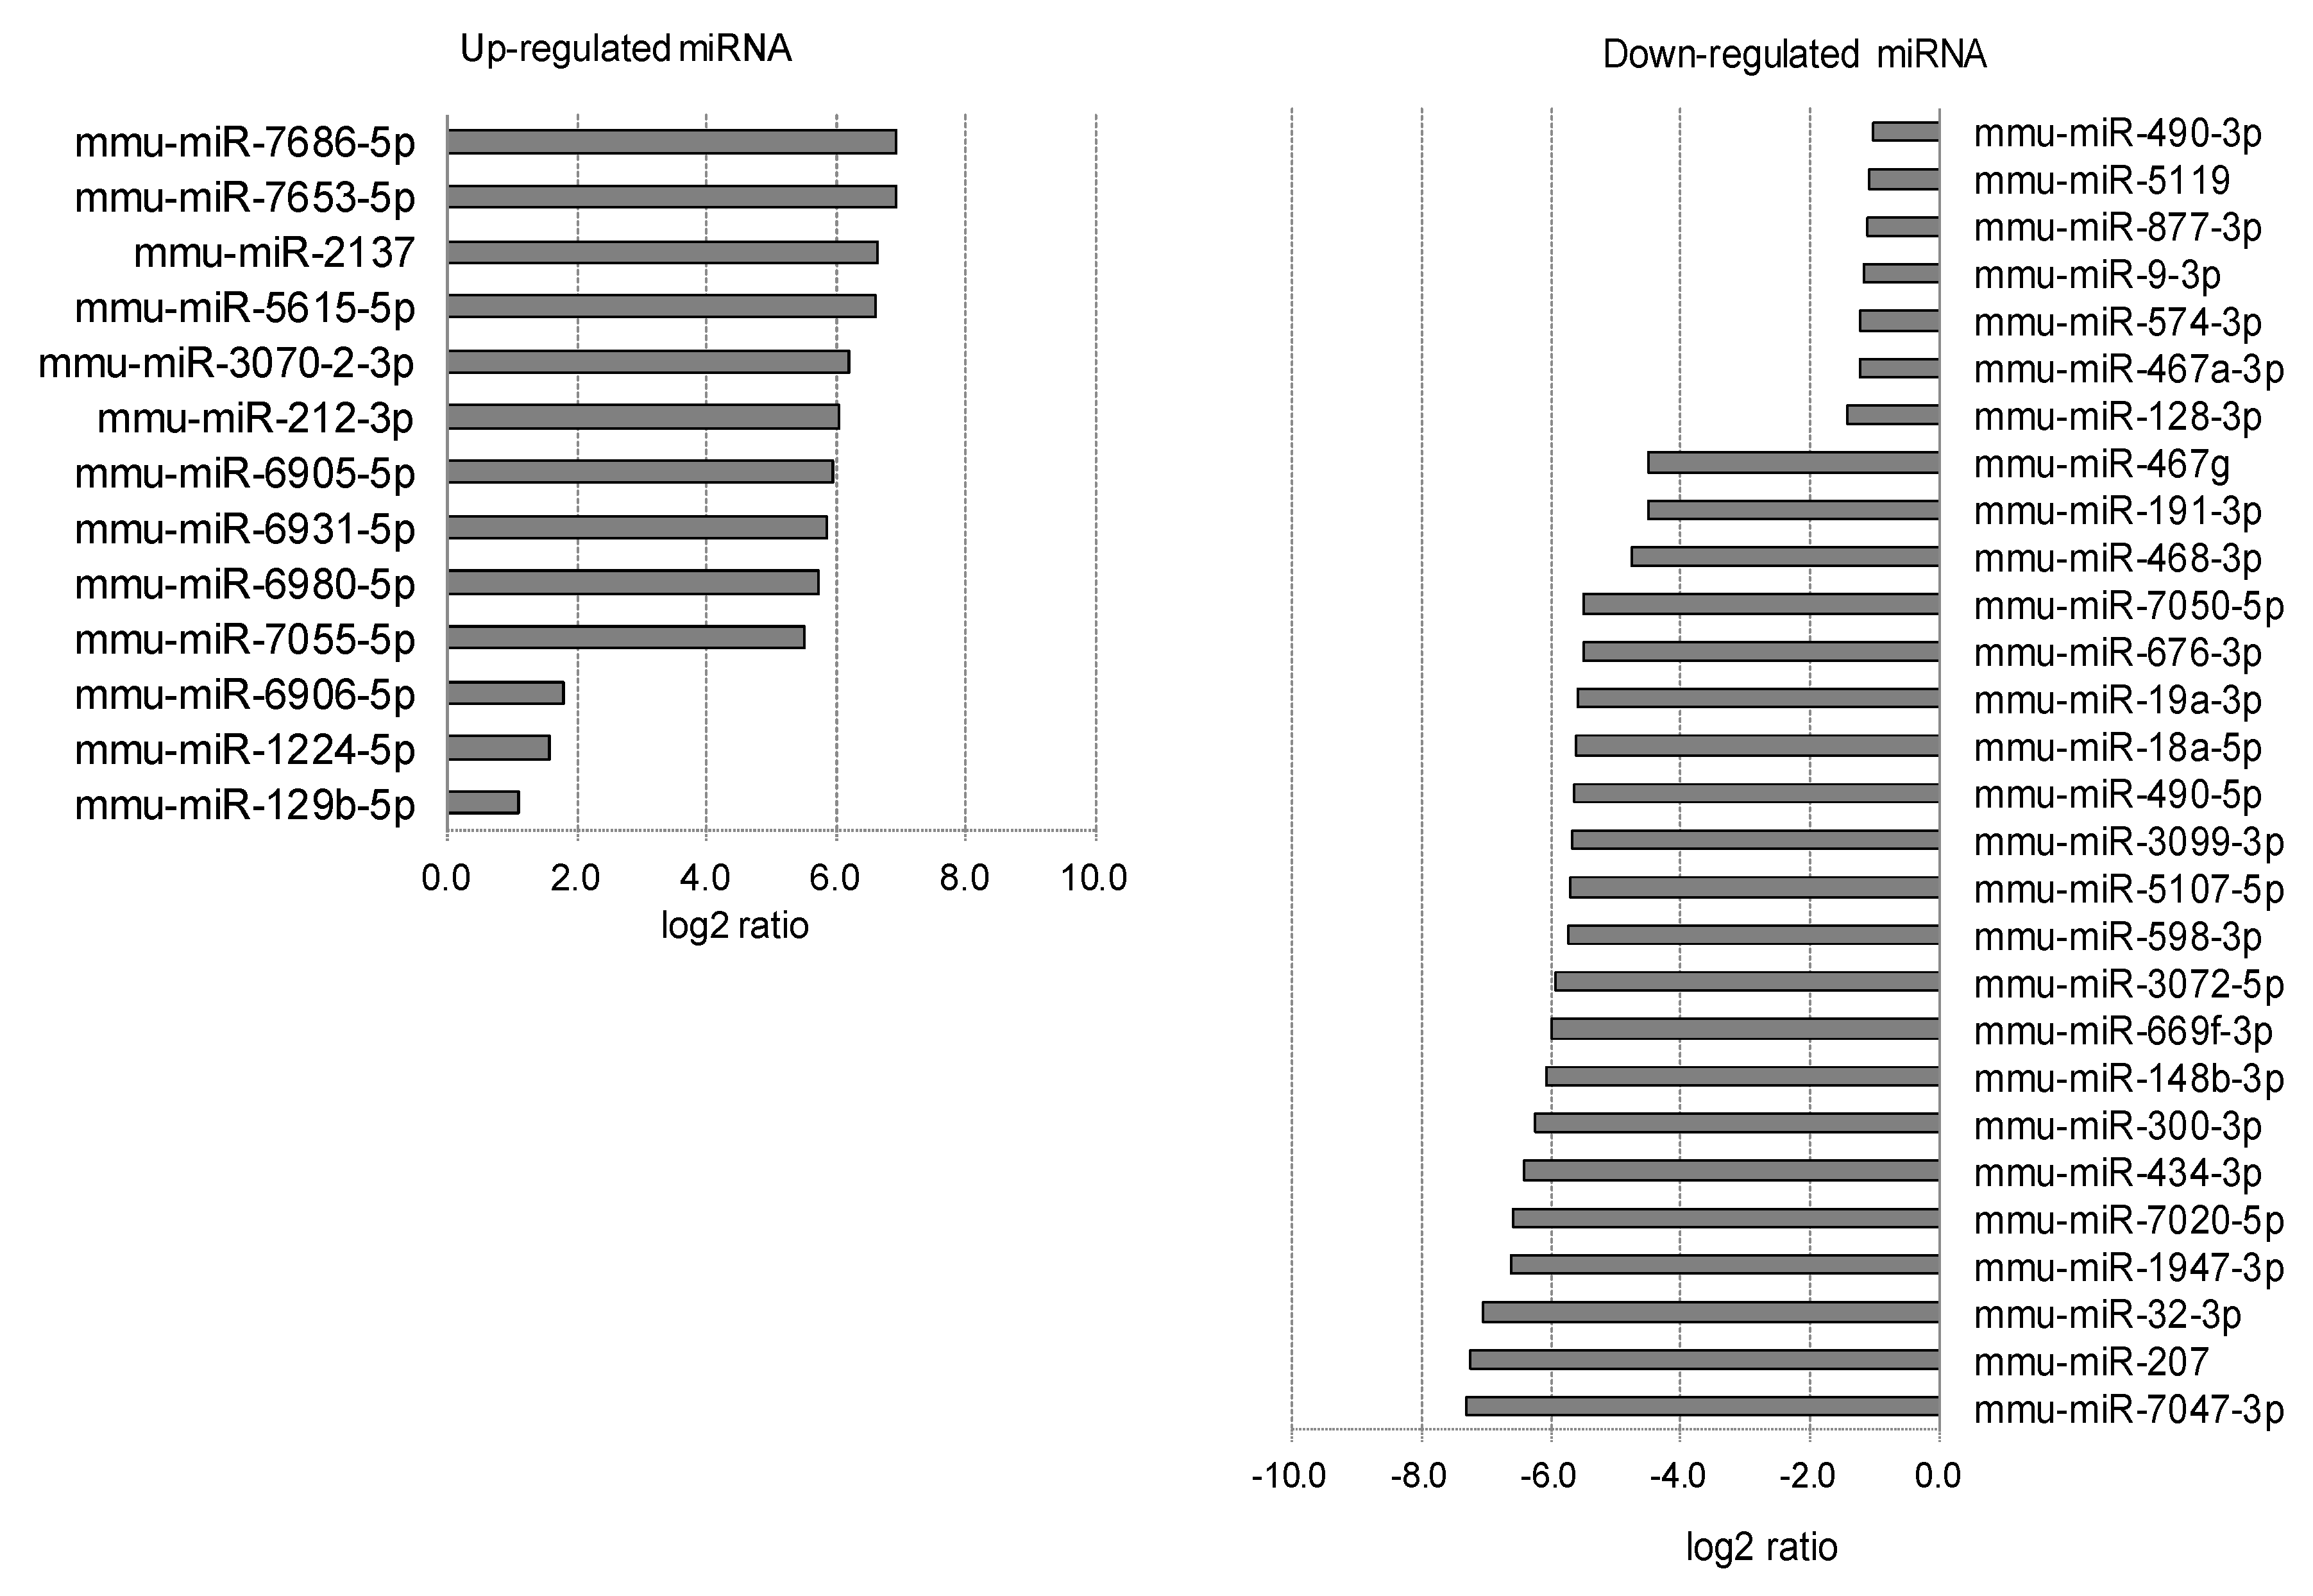
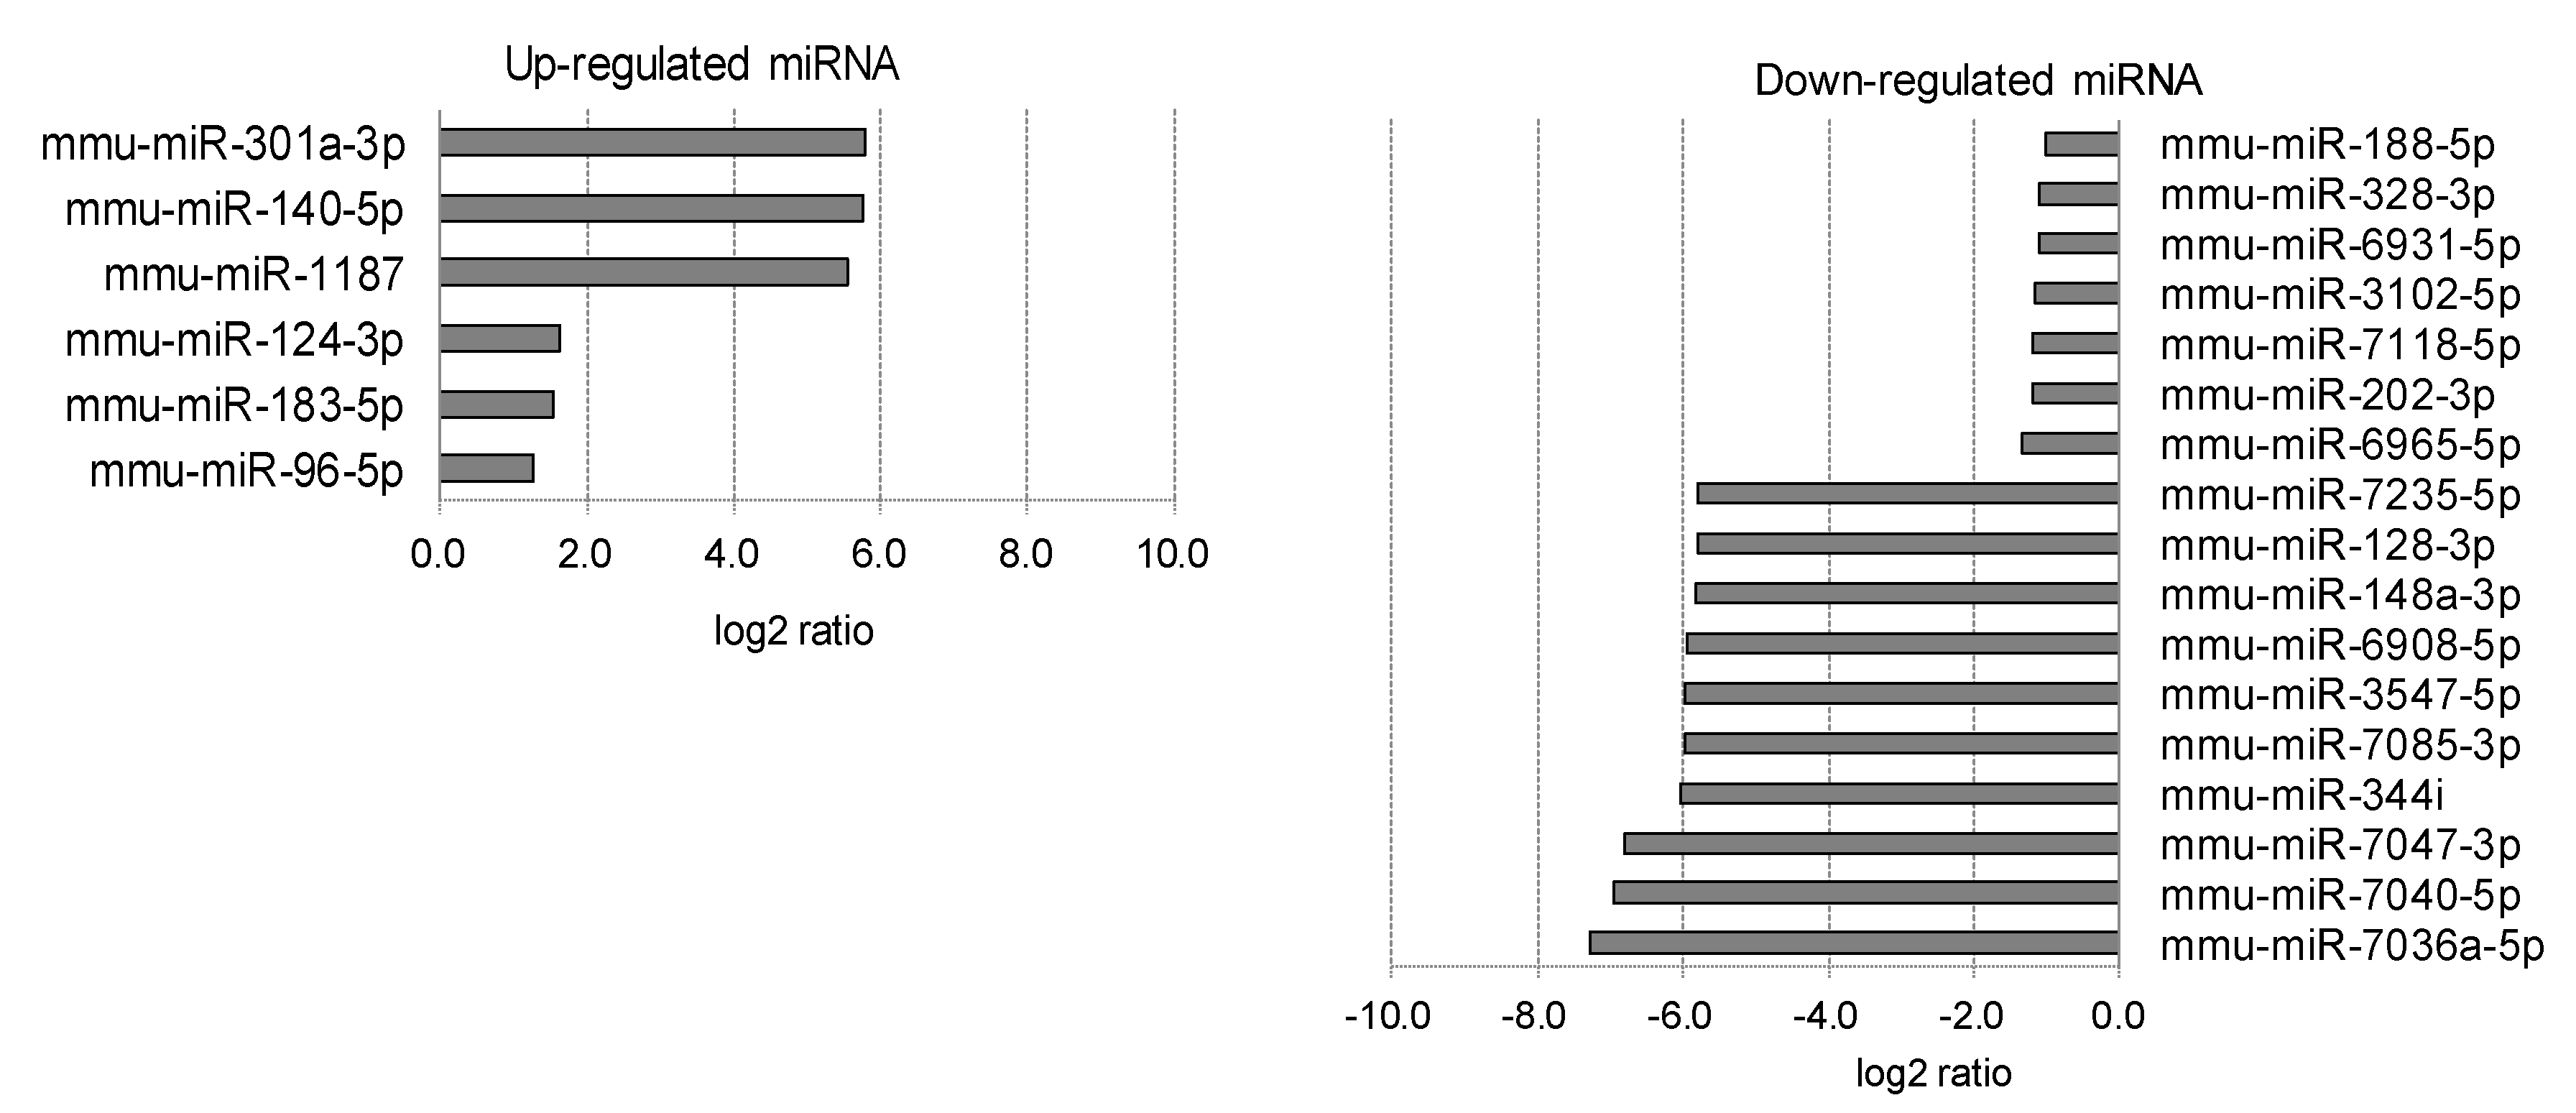
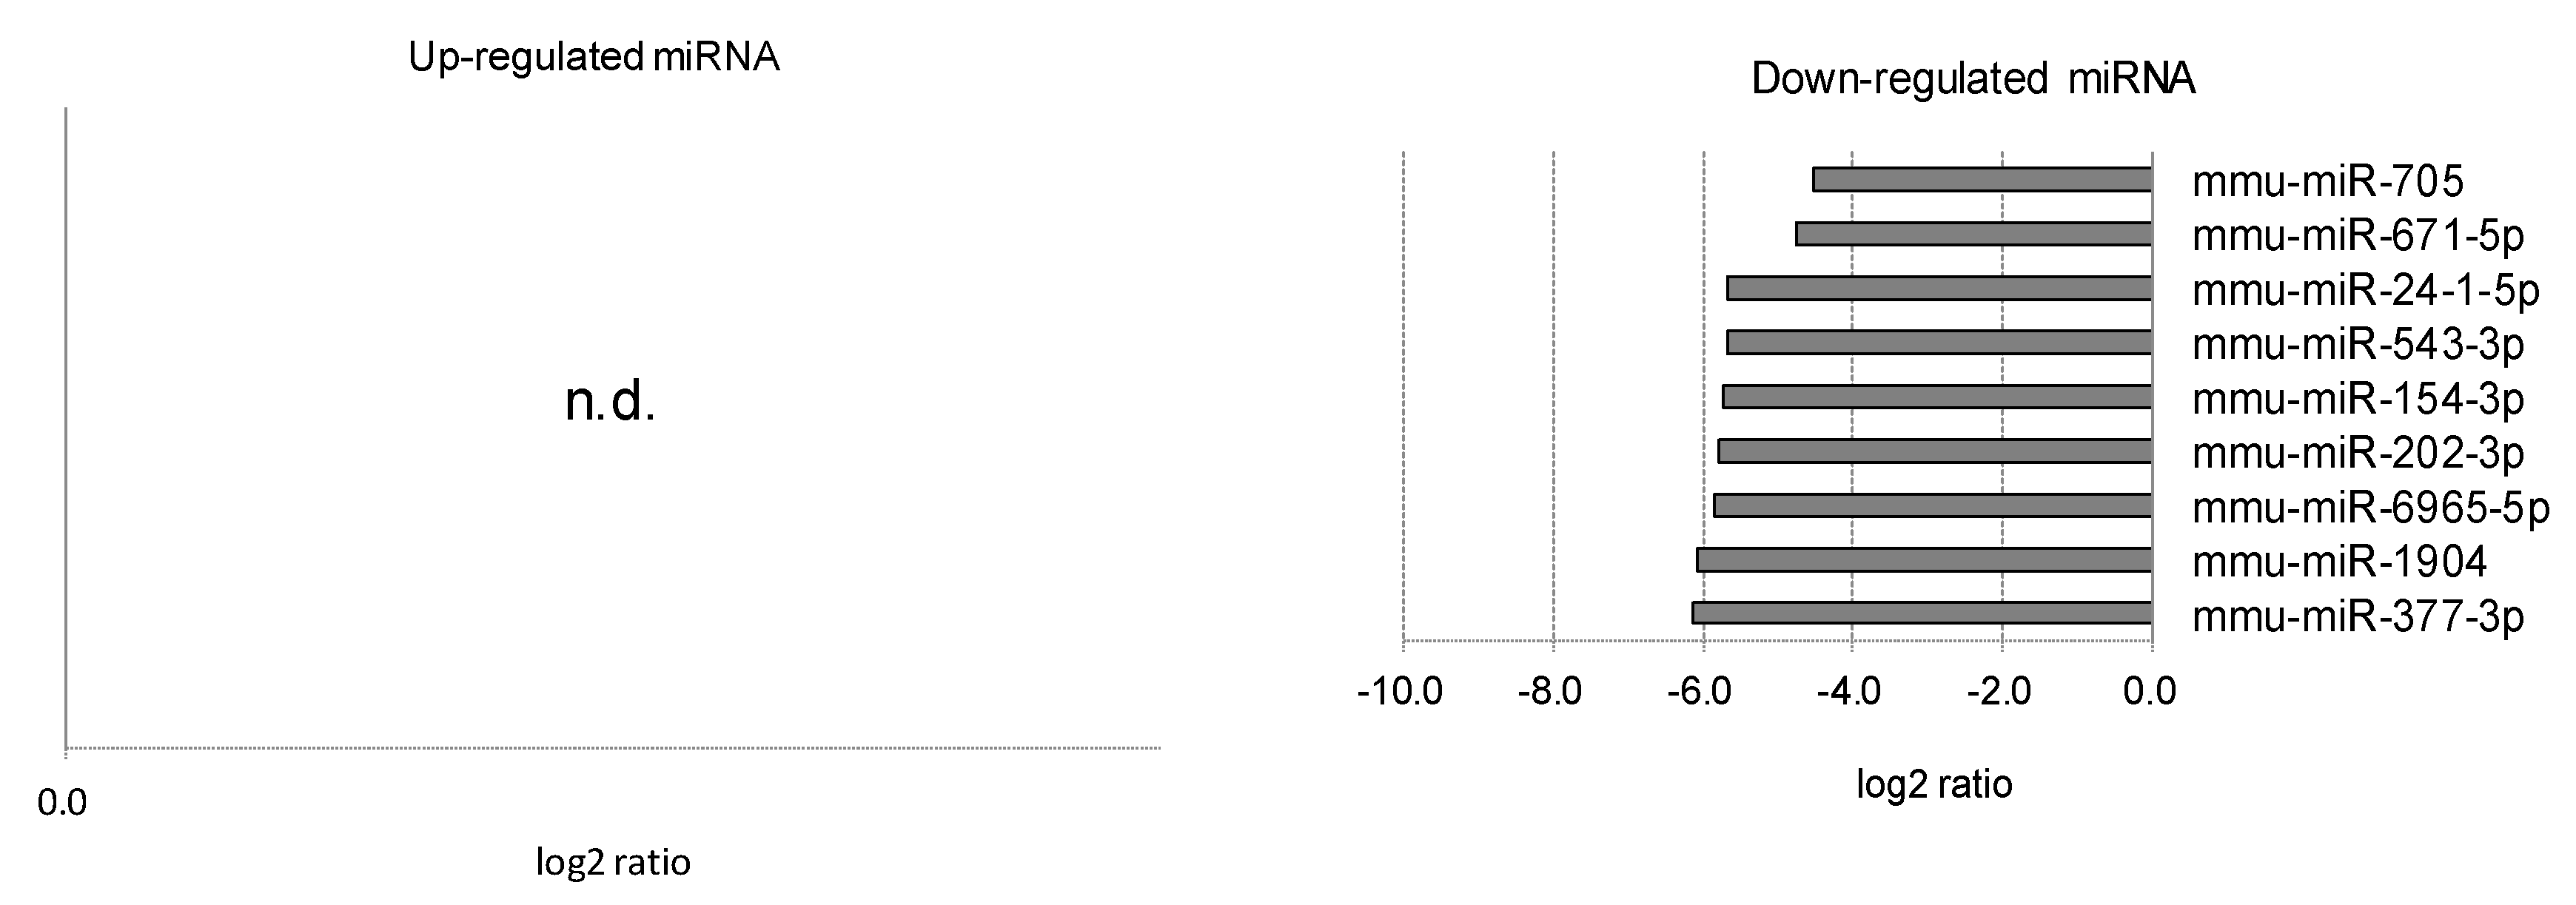
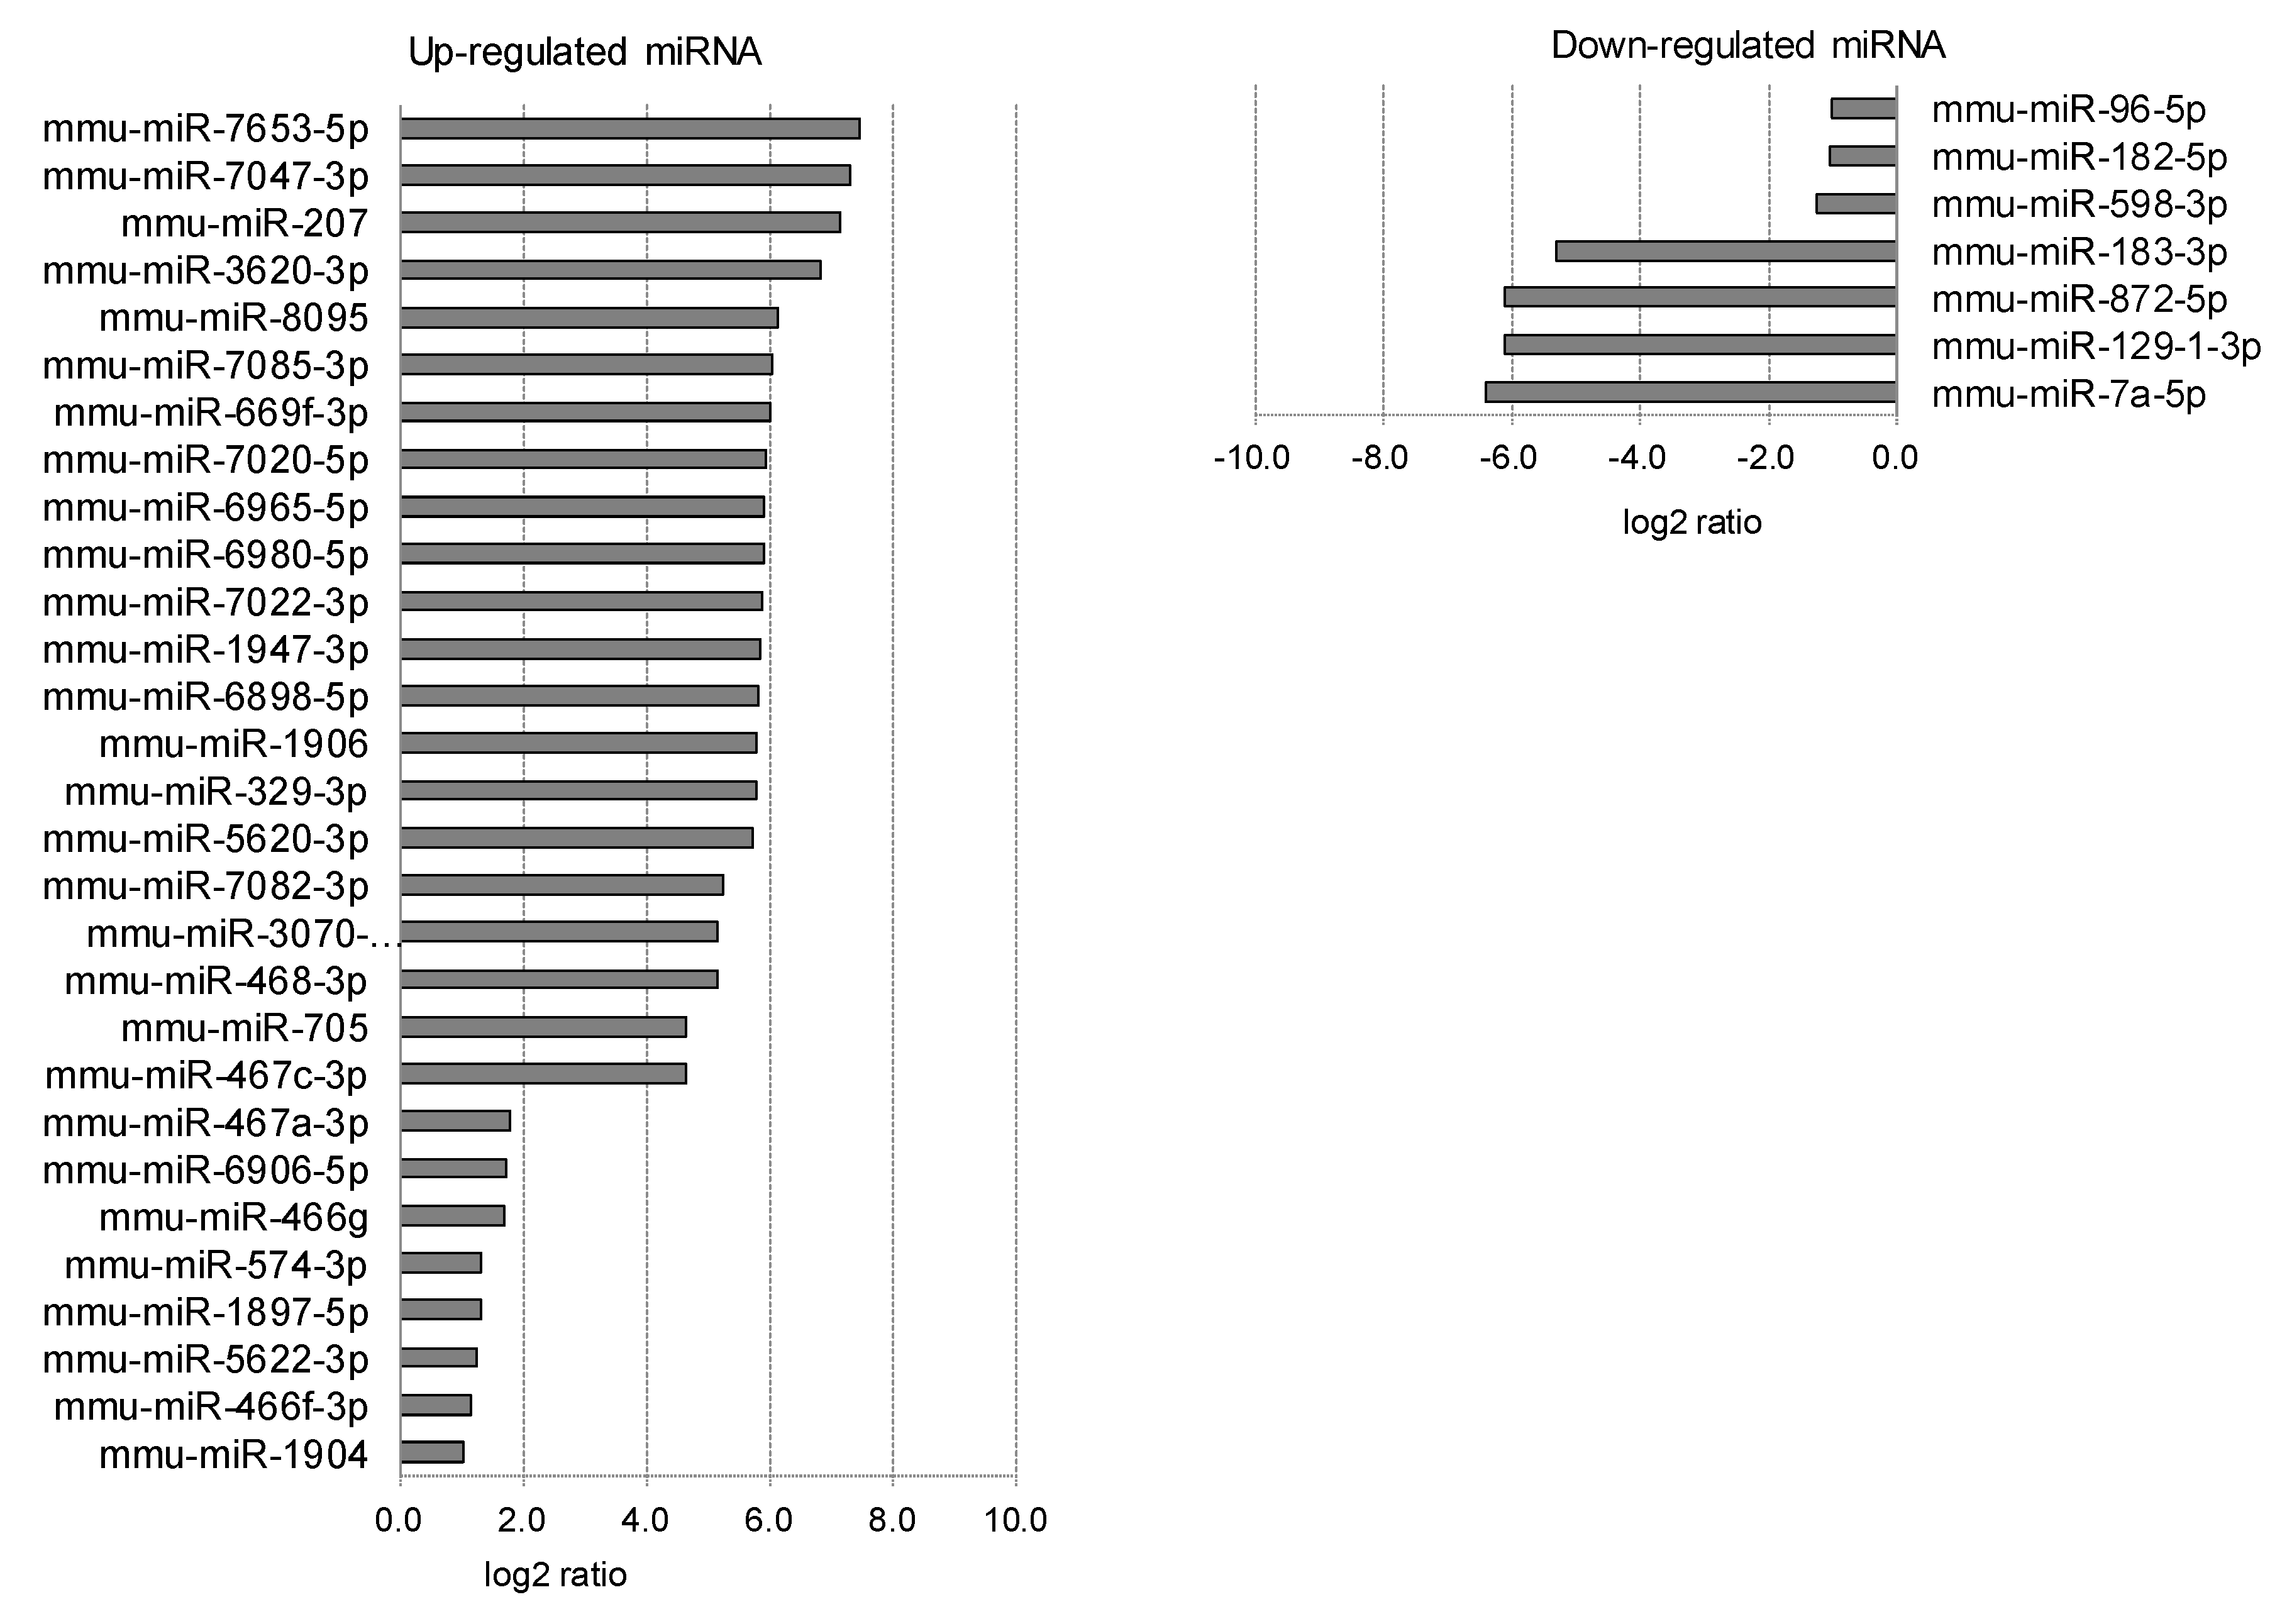
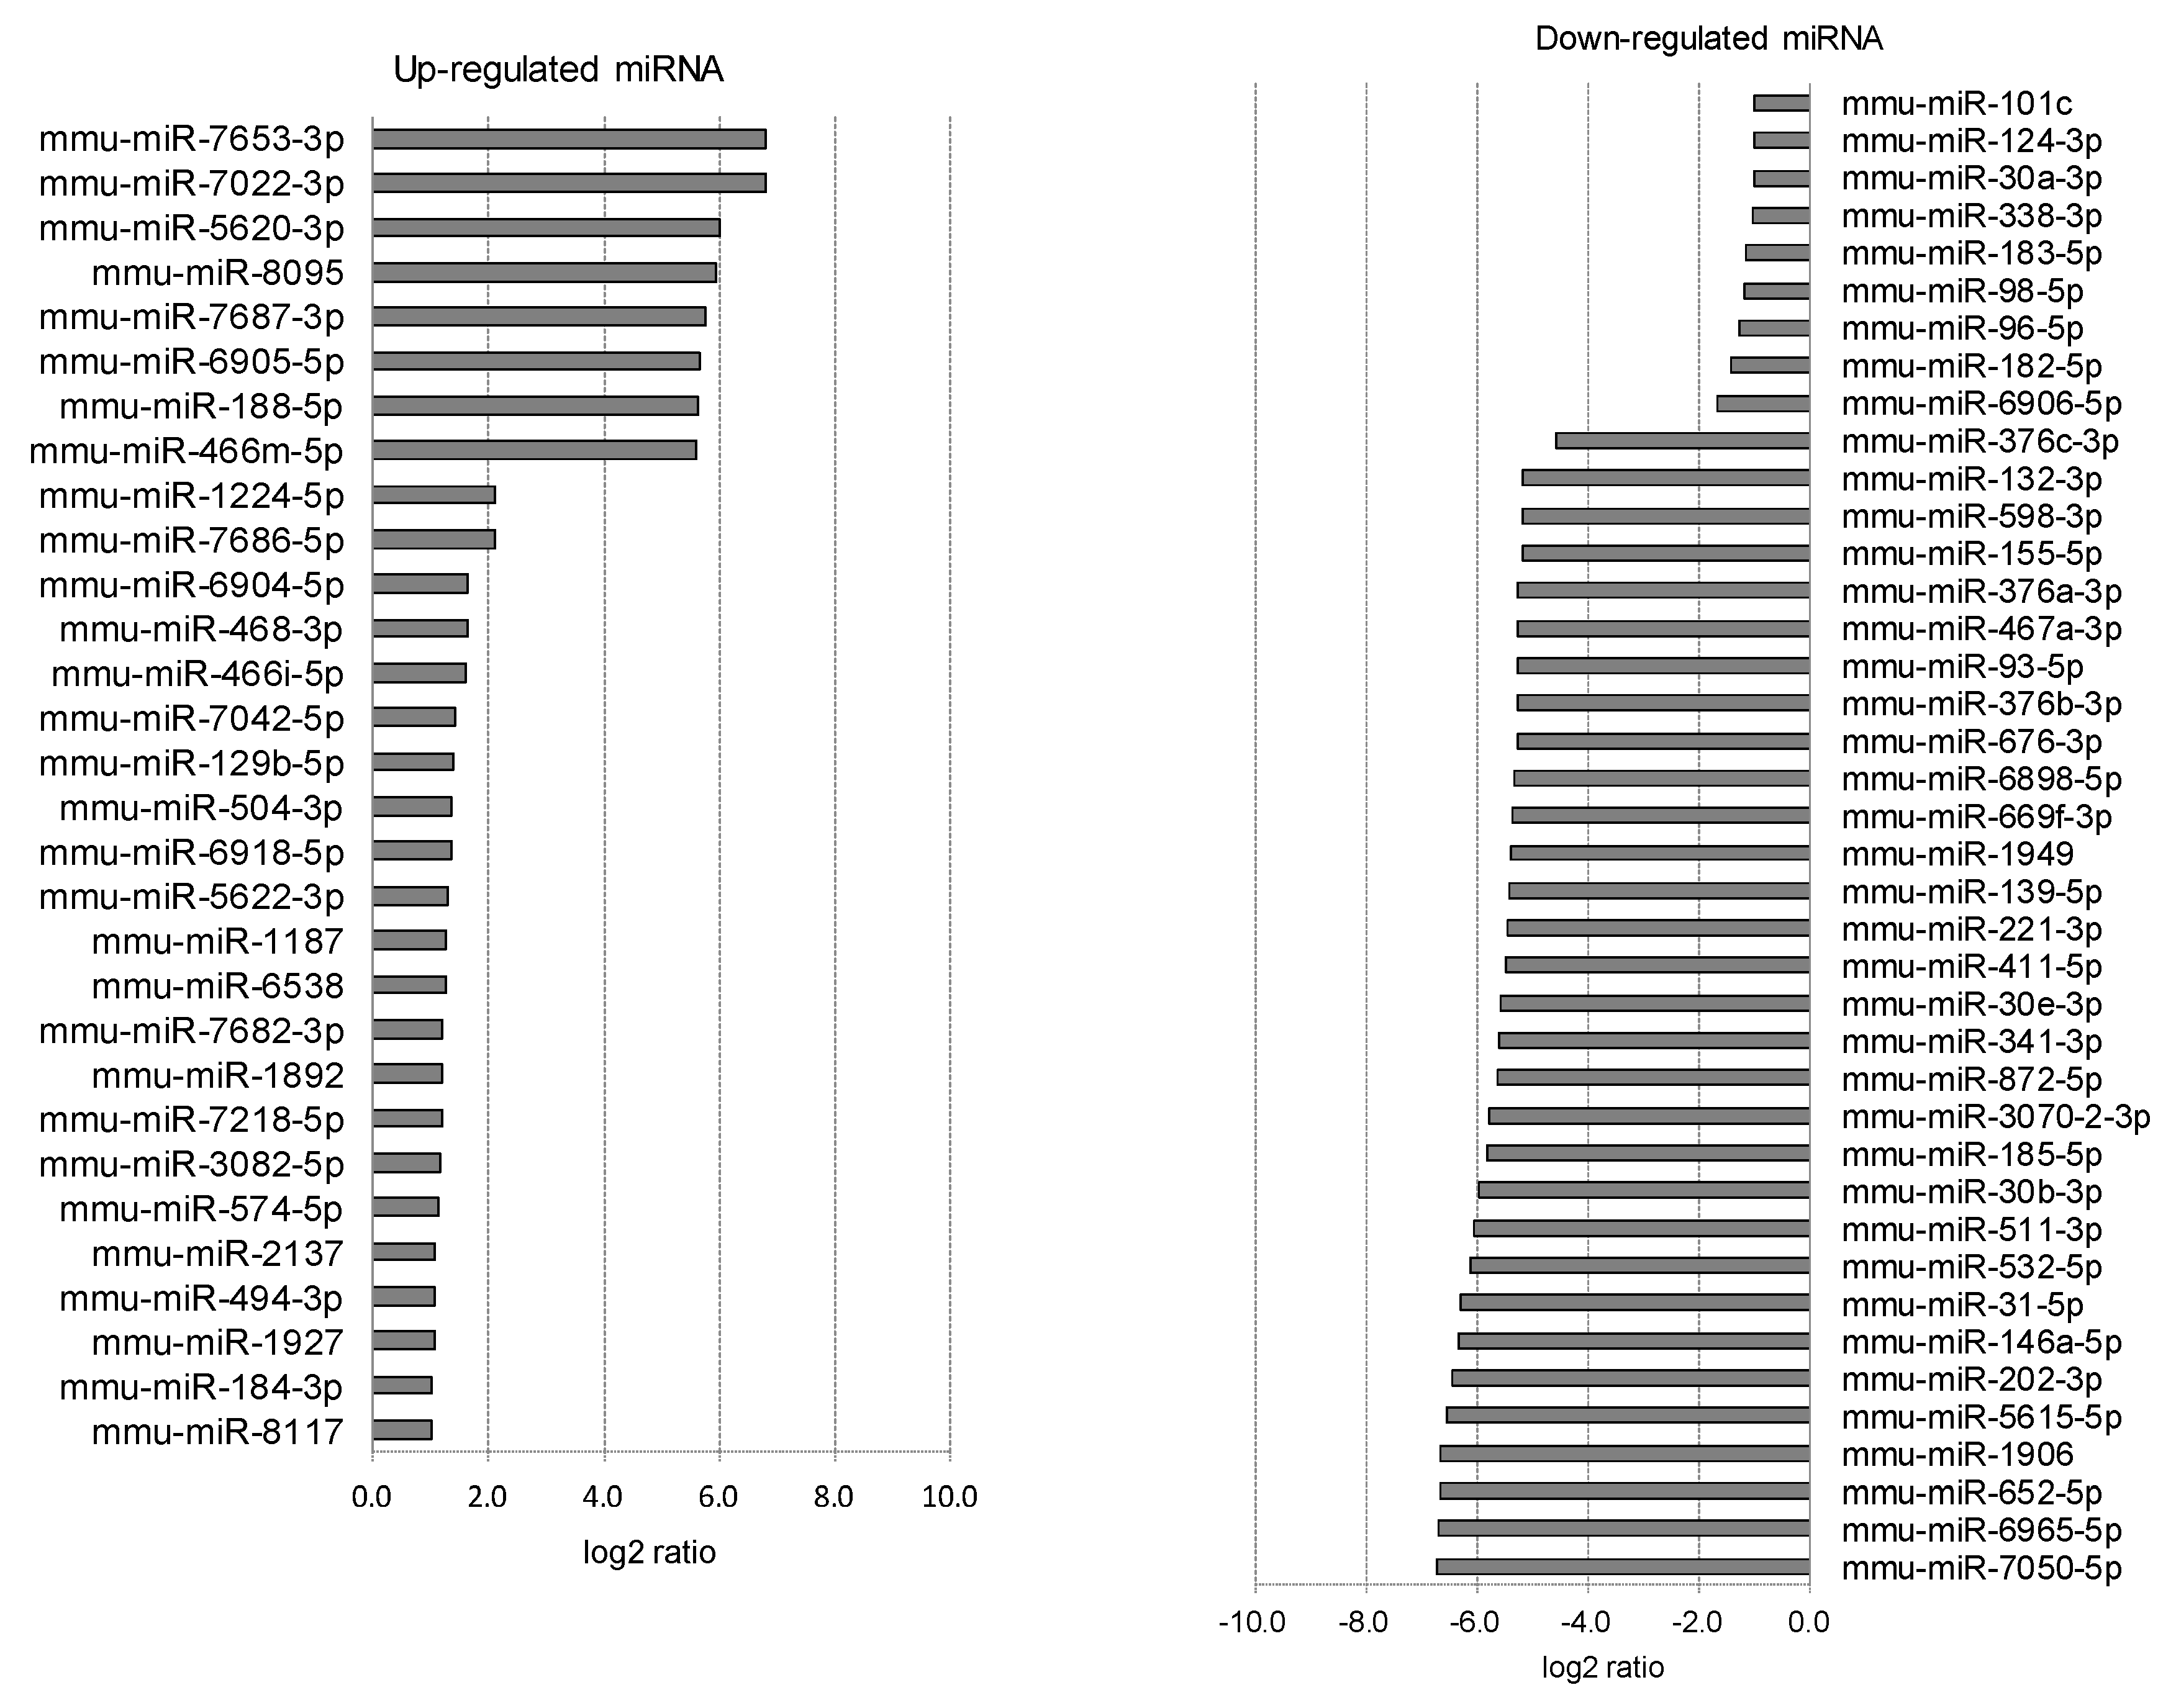
2.3. Differentially Expressed miRNAs in Individual Ocular Components During Myopia Progression

Each eyeball was separated into cornea, iris, lens, retina, RPE/choroid, and sclera (Figure 3). The miRNA array was evaluated using the tissues of the individual ocular components. A number of upregulated miRNAs (56 in cornea tissue, 13 in iris tissue, 6 in lens tissue, 0 in retina tissue, 29 in RPE/choroid tissue, and 30 in sclera tissue) and downregulated miRNAs (7 in cornea tissue, 28 in iris tissue, 17 in lens tissue, 9 in retina tissue, 7 in RPE/choroid tissue, and 40 in sclera tissue) were found in myopic tissues compared to normal tissues (Table 1, Figure 4, Figure 5, Figure 6, Figure 7, Figure 8 and Figure 9).

2.4. Overlapping Expression Changes in miRNAs in Different Ocular Component Tissues

Overlapping expression changes in miRNAs were found in different ocular tissues. Table 2 shows the miRNAs that were upregulated in both corneal and other tissues (4 in iris tissue, 2 in lens tissue, 3 in RPE/choroid tissue, and 15 in sclera tissue), the miRNAs that were upregulated in corneal tissue and downregulated in other tissues (three in iris tissue and two in sclera tissue), the miRNAs that were downregulated in corneal tissue and upregulated in other tissues (two in RPE/choroid tissue), and the miRNAs that were downregulated in both corneal tissue and other tissues (one in iris tissue and three in lens tissue). Table 3 shows the miRNAs that were upregulated in both iris and other tissues (four in RPE/choroid tissue and one in sclera tissue), the miRNAs that were upregulated in iris tissue and downregulated in other tissues (one in lens tissue and three in sclera tissue), the miRNAs that were downregulated in iris tissue and upregulated in other tissues (six in RPE/choroid tissue and one in sclera tissue), and the miRNAs that were downregulated in both iris tissue and other tissues (one in lens tissue, one in RPE/choroid tissue, and four in sclera tissue). Table 4 shows the one miRNA that was upregulated in both lens and RPE/choroid tissues, the three miRNAs that were upregulated in lens tissue and downregulated in sclera tissue, the miRNAs that were downregulated in lens tissue and upregulated in other tissues (one in RPE/choroid tissue and one in sclera tissue), and the miRNAs that were downregulated in both lens and other tissues (two in retina tissue and two in sclera tissue). Table 5 shows the two miRNAs that were downregulated in retina tissue and upregulated in RPE/choroid tissue. Table 6 shows the four miRNAs that were upregulated in both RPE/choroid tissue and sclera tissue, the two miRNAs that were upregulated in RPE/choroid tissue and downregulated in sclera tissue, and the two miRNAs that were downregulated in RPE/choroid tissue and upregulated in sclera tissue. In these expression changes in miRNAs, 18 miRNAs overlapped in more than three different types of ocular component tissue (Table 7).

2.5. Affected miRNAs and Their Predicted Target mRNA in Different Ocular Component Tissues

Based on the myopia-induced changes in miRNA expression, the target mRNA was predicted using MiRTarBase. Table 8, Table 9, Table 10, Table 11 and Table 12 show the target genes predicted from the change in miRNA expression in the cornea (73 genes from 20 miRNAs), the iris (27 genes from 11 miRNAs), the lens (32 genes from 8 miRNAs), the retina (no detection), the RPE/choroid (22 genes from 5 miRNAs) and the sclera (89 genes from 21 miRNAs). The genes shown in bold were overlapped in each ocular tissue. Overlapping expression changes in miRNAs were found in two and three types of ocular tissue, and their target genes are shown in Table 13 and Table 14.

3. Discussion

In this study, we performed a comprehensive miRNA analysis of ocular component tissues, including cornea, iris, lens, retina, RPE/choroid, and sclera tissues, from an experimental murine model of myopia. A number of differentially expressed miRNAs were observed in each ocular component. Overlapping expression changes were also found in different ocular components.
Several mRNA expression changes in FDM or LIM mice were previously reported, including an increase in fibroblast growth factor (FGF) 10 expression in sclera tissue [22] and a decrease in Wingless (WNT) 2b/Frizzled (FZD) 5/β-catenin expression in retina tissue [23]. An increase in Wnt3/b-catenin gene expression [24] and a decrease in TGF-β/Col1 gene expression [9] were also reported in FDM guinea pigs. Furthermore, previous studies showed that various gene expression changes may be functionally related to myopic phenotypes. A myopic shift in refractive errors and elongation of the axial length were reported in EGR1-deficient [25], M2-deficient [26], LRP2-overexpressed [27], APLP2-deficent [28] and Lumican-overexpressed [29] mice. Furthermore, studies in human cohorts have identified a number of genes related to myopia development [30]. In our study, a range of target mRNAs were predicted from expression changes in miRNA expression. The predicted genes were found to correspond to EGR-1 and TGF-β or be similar to FGF, WNT, and FZD, which were described in the abovementioned studies. Although the predicted genes were different between myopic induction models and species, these genes may play an important role in myopia progression. On the other hand, other genes, such as PTEN in the cornea and VSIVGP2, NOTCH1, STAT3, and CLICS in the sclera, were found to not correspond to previous reports, suggesting that these genes may have a function that is specific to each ocular component.
It has been reported that miR-200a/b/c expression overlaps in a range of tissues with a tubular structure, including kidney tissue (proximal tubule and collecting duct), lung tissue, pancreas tissue (duct cells), small intestine tissue (intestinal villus), bile duct tissue, and exocrine gland tissue (duct cells). Furthermore, miR-200a/b/c expression was found to be increased in plasma from the site of an acute kidney injury, suggesting that miR-200a/b/c may be used as a biomarker for kidney and other tubular structure organ injury [31]. In the current study, we found overlapping changes in miRNA expression in two and three types of ocular tissue (Table 2, Table 3, Table 4, Table 5, Table 6 and Table 7). These individual ocular components are in close proximity to and functionally connected with each other. Thus, we suggest that overlapping changes in miRNA expression among different ocular components can be used as myopic diagnosis markers.
In a previous study, eight miRNAs were found to be upregulated and to overlap with retinas and whole eyeballs in a murine model of form-deprivation myopia. The authors screened out 1805 target genes for the eight differentially expressed miRNAs, including MAPK-10 [32]. In the present study, we also found a number of overlapping miRNAs in individual ocular components together with predicted target genes (Table 13 and Table 14). Although these new target genes were found to not exactly correspond to previous reports, we speculate that these genes may be important factors in the suppression or acceleration of myopia progression.
Comprehensive approaches to the analysis of mRNA and miRNA expression have also been reported. In sclera from an FDM mice model, Let-7a, miR-16-2, Smok4a, Prph2, and Gnat1 expression were found to fluctuate [14]. Fifty-three (53) miRNAs were previously reported to be either upregulated or downregulated in the retina of LIM mice, and mmu-miR-671-5p was identified among them [33]. In this study, 18 miRNAs were identified as being differentially expressed in three different ocular components. These miRNAs may play an important role in myopia progression. Mmu-miR-7047-3p, mmu-miR-7085-3p, and mmu-miR-96-5p showed an opposite change in expression between the anterior (cornea, iris, and lens) and posterior (retina, RPE/choroid, and sclera) ocular components. Although some differences exist between animal species [34], the expression and functions of miRNAs are largely evolutionarily conserved [35]. In the present study, we identified both discrete and overlapping changes in miRNA expression in individual ocular components during myopia progression in a murine model. Further studies will be conducted to explore miRNA profiles in order to understand the molecular pathogenesis of human myopia progression in humans and to establish of biomarkers for its prediction.

4. Materials and Methods

4.1. Experimental Animals

The experimental protocol used in this study complied with the National Institutes of Health (NIH) guidelines for working with laboratory animals, the ARVO Statement for the Use of Animals in Ophthalmic and Vision Research, and the Animal Research: Reporting of In Vivo Experiments (ARRIVE) guidelines. The experimental protocol was approved by the Institutional Animal Care and Use Committee at Keio University. C57BL/6J male mice (CLEA Japan, Yokohama, Japan) were maintained by free intake of a standard diet (MF, Oriental Yeast Co., Ltd., Tokyo, Japan) and water, with three mice in one cage. The mice were raised in an environment with a 12 h/12 h light/dark cycle (the dark cycle from 8:00 p.m. to 8:00 a.m.) at 23 ± 3 °C. The light cycle was maintained using a 50-lux background. These conditions were based on a previously reported experimental murine model of myopia [5]. The animal trial was approved by the ethics committee of Keio University (ethics review number: 16017-(1), 25 October 2017).

4.2. Myopia Induction

Before and after the myopia induction, the refraction and axial length of all eyes were measured using a refractometer (Steinberis Transfer Center, Tübingen, Germany) and spectral domain optical coherent tomography (SD-OCT, Envisu R4310, Leica, Wetzlar, Germany), respectively, under anesthesia by medetomidine (0.75 mg/kg, Sandoz K.K., Tokyo, Japan), midazolam (4 mg/kg, Domitor®, Orion Corporation, Espoo, Finland), and butorphanol tartrate (5 mg/kg, Meiji Seika Pharma Co., Ltd., Tokyo, Japan) dissolved in normal saline (MMB). For the myopia induction group, a −30 D lens was fixed onto the right eye at postnatal three weeks old, and the mice were kept for three weeks. For the normal group, mice were prepared and kept without any special treatment. The induction of myopia and the ocular measurement were based on a previously reported experimental murine model of myopia [5]. Three mice were used for the myopia induction group and the normal group, respectively. In accordance with a previous report [36], the thickness of the retina and choroid was captured at points that were ±300 μm and ±400 μm from the optic nerve, respectively, and measured using the NIH ImageJ software.

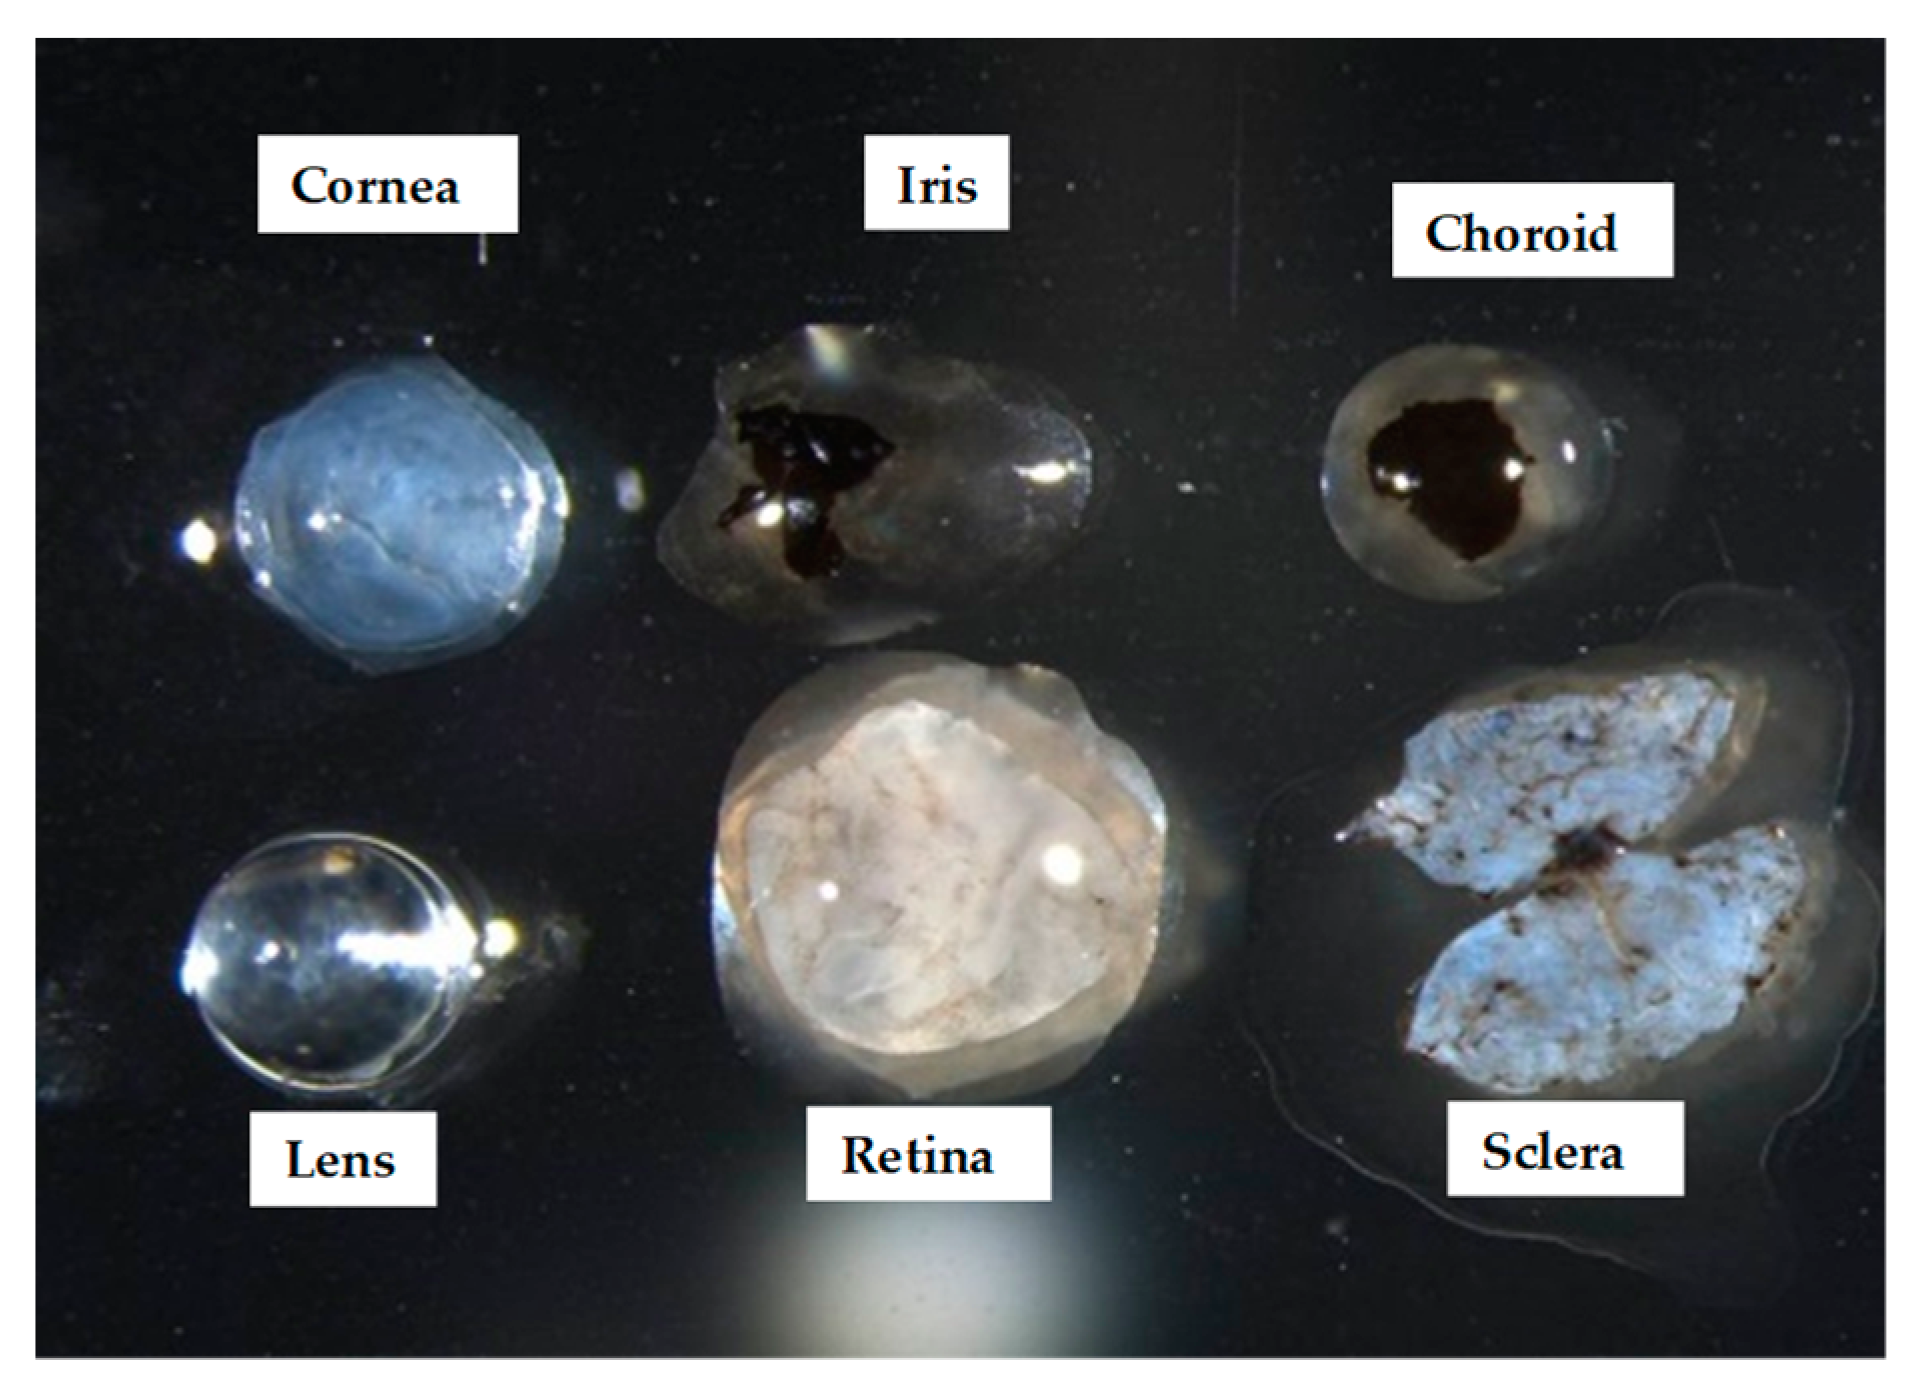
4.3. miRNA Extraction

After euthanasia was performed by intraperitoneal MMB injection of an overdose of anesthesia, right eyes from the myopia induction group and right eyes from the control group were enucleated and separated into cornea, iris, lens, retina, RPE/choroid, and sclera tissues. The separated ocular tissues were put into QIAzol and homogenized. Total RNA extraction was performed using a miRNeasy Micro kit (QIAGEN, Venlo, Netherlands) according to the manufacturer’s instructions.

4.4. miRNA Microarray

After mixing equal amounts of three samples extracted from the same eye tissues, a template of 100 ng total RNA was applied to Agilent Mouse miRNA Microarray (8 × 60 K) miRBase 21.0 (Agilent, Santa Clara, CA, USA). Cyamin-3 labeling samples were hybridized at 55 °C and 20 rpm for 17 h using a miRNA Complete Labeling and Hyb Kit (Agilent) and an Expression Hybridization Kit (Agilent). After hybridization, the microarrays were scanned using a DNA Microarray Scanner (Agilent). The scanning data were digitized using the Feature Extraction version 10.7.1.1 software (Agilent). The miRNA microarray protocols were applied by following each manufacturer’s instructions. The microarray datasets are displayed in the National Center for Biotechnology Information (NCBI) Gene Expression Omnibus with the accession number GSE131831.

4.5. Data Analysis

miRNA microarray data were analyzed using the Geneview Data module in GeneSpring GX 14.5 (Agilent). The expression ratio of sample molecules for the denominator was calculated according to the combination described in Table 1. A fold-change of >2 and <0.5 with a detected flag in both the denominator and the numerator or a fold-change of >5 and <0.2 with no detected flag in either the denominator or the numerator was used as criteria to select the differentially expressed miRNAs. The predicted genes from the changes in miRNA expression and miRNA–mRNA interaction was analyzed by MiRTarBase 7.0 (National Chiao Tung University, Hsinchu, Taiwan).

4.6. Statistical Analyses

The data in Figure 1 are expressed as the mean ± standard deviation. Statistical significance was assessed using the unpaired Student’s t-test (Microsoft Excel 2013). Results with p-values of less than 0.05 were considered statistically significant.

5. Conclusions

To the best of our knowledge, this study is the first report of a comprehensive analysis of miRNA expression in different ocular component tissues of LIM mice. Further analyses, such as a cluster analysis or a gene ontology (GO) analysis, are required for a full understanding of the function of differentially expressed miRNAs in different tissues. A comparison to changes in mRNA expression in myopia progression is also important to reveal interactions between miRNA and mRNA. Based on the findings in this study, miRNAs that play a critical role in myopia development and progression may be found and adopted for clinical use as therapeutic targets or diagnostic tools in the future.

Author Contributions

Conceptualization, T.K., K.T., S.I., and K.M.; Methodology, T.K., K.T., H.T., and Y.T.; Formal analysis, Y.T. and X.J.; investigation, Y.T. and X.J.; Data Curation, Y.T. and Y.H.; writing—original draft preparation, T.K. and Y.T.; Writing—review and editing, all authors; visualization, Y.T.; supervision, K.T.; project administration, K.T.; funding acquisition, T.K. and K.T.

Funding

This work was supported by Santen Pharmaceutical Co., LTD (Osaka, Japan), and was a collaborative study between Keio University and Santen.

Acknowledgments

We would like to thank Keiko Takahashi, a member of the Laboratory of Photobiology, Keio University School of Medicine and Masatsugu Nakamura, Masatomo Kato, Koushi Fujisawa, and Kenji Imoto of Santen Pharmaceutical Co., LTD (Osaka, Japan) for their technical and administrative support.

Conflicts of Interest

The authors declare no conflict of interest.

References

  1. Holden, B.A.; Fricke, T.R.; Wilson, D.A.; Jong, M.; Naidoo, K.S.; Sankaridurg, P.; Wong, T.Y.; Naduvilath, T.J.; Resnikoff, S. Global prevalence of myopia and high myopia and temporal trends from 2000 through 2050. Ophthalmology 2016, 123, 1036–1042. [Google Scholar] [CrossRef] [PubMed]
  2. Dolgin, E. The myopia boom. Nature 2015, 519, 276–278. [Google Scholar] [CrossRef] [PubMed] [Green Version]
  3. Yoshikawa, M.; Yamashiro, K.; Miyake, M.; Oishi, M.; Akagi-Kurashige, Y.; Kumagai, K.; Nakata, I.; Nakanishi, H.; Oishi, A.; Gotoh, N.; et al. Comprehensive replication of the relationship between myopia-related genes and refractive errors in a large Japanese cohort. Investig. Ophthalmol. Vis. Sci. 2014, 55, 7343–7354. [Google Scholar] [CrossRef] [PubMed]
  4. Verhoeven, V.J.; Hysi, P.G.; Wojciechowski, R.; Fan, Q.; Guggenheim, J.A.; Höhn, R.; Mac Gregor, S.; Hewitt, A.W.; Nag, A.; Cheng, C.Y.; et al. Genome-wide meta-analyses of multi-ethnic cohorts identify multiple new susceptibility loci for refractive error and myopia jointly conceived the project and supervised the work NIH public access author manuscript. Veluchamy A. Barathi 2013, 29, 314–318. [Google Scholar]
  5. Jiang, X.; Kurihara, T.; Kunimi, H.; Miyauchi, M.; Ikeda, S.-I.; Mori, K.; Tsubota, K.; Torii, H.; Tsubota, K. A highly efficient murine model of experimental myopia. Sci. Rep. 2018, 8, 2026. [Google Scholar] [CrossRef] [PubMed]
  6. Ashby, R.S.; Schaeffel, F. The effect of bright light on lens compensation in Chicks. Investig. Ophthalmol. Vis. Sci. 2010, 51, 5247–5253. [Google Scholar] [CrossRef] [PubMed]
  7. Ashby, R.; Kozulin, P.; Megaw, P.L.; Morgan, I.G. Alterations in ZENK and glucagon RNA transcript expression during increased ocular growth in chickens. Mol. Vis. 2010, 50, 639–649. [Google Scholar]
  8. Hui Xiao, Z.Y.F. Comparison of form-deprived myopia and lens-induced myopia in guinea pigs. Int J. Ophthalmol. 2014, 7, 245–250. [Google Scholar] [Green Version]
  9. Li, M.; Yuan, Y.; Chen, Q.; Me, R.; Gu, Q.; Yu, Y.; Sheng, M.; Ke, B. Expression of Wnt/β-catenin signaling pathway and its regulatory role in type I collagen with TGF-β1 in scleral fibroblasts from an experimentally induced myopia guinea pig model. J. Ophthalmol. 2016, 2016, 5126560. [Google Scholar] [CrossRef]
  10. He, L.; Frost, M.R.; Siegwart, J.T.; Norton, T.T. Gene expression signatures in tree shrew choroid in response to three myopiagenic conditions. Vision Res. 2014, 102, 52–63. [Google Scholar] [CrossRef] [Green Version]
  11. Gao, Q.; Liu, Q.; Ma, P.; Zhong, X.; Wu, J.; Ge, J. Effects of direct intravitreal dopamine injections on the development of lid-suture induced myopia in rabbits. Graefe’s Arch. Clin. Exp. Ophthalmol. 2006, 244, 1329–1335. [Google Scholar] [CrossRef] [PubMed]
  12. Huang, J.; Hung, L.F.; Iii, E.L.S. Recovery of peripheral refractive errors and ocular shape in rhesus monkeys (Macaca mulatta) with experimentally induced myopia. Vis. Res. 2012, 73, 30–39. [Google Scholar] [CrossRef] [PubMed]
  13. Riddell, N.; Faou, P.; Murphy, M.; Giummarra, L.; Downs, R.A.; Rajapaksha, H.; Crewther, S.G. The retina/RPE proteome in chick myopia and hyperopia models: Commonalities with inherited and age-related ocular pathologies. Mol. Vis. 2017, 23, 872–888. [Google Scholar] [PubMed]
  14. Metlapally, R.; Park, H.N.; Chakraborty, R.; Wang, K.K.; Tan, C.C.; Light, J.G.; Pardue, M.T.; Wildsoet, C.F. Genome-wide Scleral Micro-and messenger-RNA regulation during myopia development in the mouse. Investig. Ophthalmol. Vis. Sci. 2016, 57, 6089–6097. [Google Scholar] [CrossRef] [PubMed]
  15. Tarver, J.E.; Donoghue, P.C.J.; Peterson, K.J. Do miRNAs have a deep evolutionary history? Bioessays 2012, 34, 857–866. [Google Scholar] [CrossRef] [PubMed]
  16. Bhayani, M.K.; Calin, G.A.; Lai, S.Y. Functional relevance of miRNA * sequences in human disease. Mutat. Res. 2011, 731, 14–19. [Google Scholar] [CrossRef]
  17. Sethupathy, P. The promise and challenge of therapeutic MicroRNA silencing in diabetes and metabolic diseases. Curr. Diab. Rep. 2016, 16, 52. [Google Scholar] [CrossRef] [PubMed]
  18. Chim, S.S.C.; Shing, T.K.F.; Hung, E.C.W.; Leung, T.Y.; Lau, T.K.; Chiu, R.W.K.; Lo, Y.M.D. Detection and characterization of placental microRNAs in maternal plasma. Clin. Chem. 2008, 54, 482–490. [Google Scholar] [CrossRef]
  19. Gilad, S.; Meiri, E.; Yogev, Y.; Benjamin, S.; Lebanony, D.; Yerushalmi, N.; Benjamin, H.; Kushnir, M.; Cholakh, H.; Melamed, N.; et al. Serum microRNAs are promising novel biomarkers. PLoS ONE 2008, 3, e3148. [Google Scholar] [CrossRef]
  20. Chen, K.C.; Hsi, E.; Hu, C.Y.; Chou, W.W.; Liang, C.L.; Juo, S.H.H. MicroRNA-328 may influence myopia development by mediating the PAX6 Gene. Investig. Opthalmol. Vis. Sci. 2012, 53, 2732. [Google Scholar] [CrossRef]
  21. Xie, M.; Li, Y.; Wu, J.; Wu, J. Genetic variants in MiR-29a associated with high myopia. Ophthalmic Genet. 2016, 37, 456–458. [Google Scholar] [CrossRef] [PubMed]
  22. Hsi, E.; Chen, K.C.; Chang, W.S.; Yu, M.L.; Liang, C.L.; Juo, S.H.H. A Functional polymorphism at the FGF10 gene is associated with extreme myopia. Investig. Opthalmol. Vis. Sci. 2013, 54, 3265. [Google Scholar] [CrossRef] [PubMed]
  23. Ma, M.; Zhang, Z.; Du, E.; Zheng, W.; Gu, Q.; Xu, X.; Ke, B. Wnt signaling in form deprivation myopia of the mice retina. PLoS ONE 2014, 9, e91086. [Google Scholar] [CrossRef] [PubMed]
  24. Liu, H.; Mohamed, O.; Dufort, D.; Wallace, V.A. Characterization of Wnt signaling components and activation of the Wnt canonical pathway in the murine retina. Dev. Dyn. 2003, 227, 323–334. [Google Scholar] [CrossRef] [PubMed]
  25. Schippert, R.; Burkhardt, E.; Feldkaemper, M.; Schaeffel, F. Relative axial myopia in Egr-1 (ZENK) knockout mice. Investig. Opthalmol. Vis. Sci. 2007, 48, 11. [Google Scholar] [CrossRef] [PubMed]
  26. Barathi, V.A.; Kwan, J.L.; Tan, Q.S.W.; Weon, S.R.; Seet, L.F.; Goh, L.K.; Vithana, E.N.; Beuerman, R.W. Muscarinic cholinergic receptor (M2) plays a crucial role in the development of myopia in mice. Dis. Model. Mech. 2013, 6, 1146–1158. [Google Scholar] [CrossRef] [PubMed]
  27. Cases, O.; Joseph, A.; Obry, A.; Santin, M.D.; Ben-Yacoub, S.; Pâques, M.; Amsellem-Levera, S.; Bribian, A.; Simonutti, M.; Augustin, S.; et al. Foxg1-Cre mediated Lrp2 inactivation in the developing mouse neural retina, ciliary and retinal pigment epithelia models congenital high myopia. PLoS ONE 2015, 10, e0129518. [Google Scholar] [CrossRef]
  28. Tkatchenko, A.V.; Tkatchenko, T.V.; Guggenheim, J.A.; Verhoeven, V.J.; Hysi, P.G.; Wojciechowski, R.; Singh, P.K.; Kumar, A.; Thinakaran, G.; Consortium for Refractive Error and Myopia (CREAM); et al. APLP2 regulates refractive error and myopia development in mice and humans. PLoS Genet. 2015, 11, e1005432. [Google Scholar] [CrossRef] [PubMed]
  29. Song, Y.; Zhang, F.; Zhao, Y.; Sun, M.; Tao, J.; Liang, Y.; Ma, L.; Yu, Y.; Wang, J.; Hao, J. Enlargement of the axial length and altered ultrastructural features of the sclera in a mutant lumican transgenic mouse model. PLoS ONE 2016, 11, e0163165. [Google Scholar] [CrossRef]
  30. Cheng, C.Y.; Schache, M.; Ikram, M.K.; Young, T.L.; Guggenheim, J.A.; Vitart, V.; Mac Gregor, S.; Verhoeven, V.J.M.; Barathi, V.A.; Liao, J.; et al. Nine loci for ocular axial length identified through genome-wide association studies, including shared loci with refractive error. Am. J. Hum. Genet. 2013, 93, 264–277. [Google Scholar] [CrossRef]
  31. Kito, N.; Endo, K.; Ikesue, M.; Weng, H.; Iwai, N. miRNA profiles of tubular cells: Diagnosis of kidney injury. Biomed. Res. Int. 2015, 2015, 465479. [Google Scholar] [CrossRef] [PubMed]
  32. Mei, F.; Wang, J.; Chen, Z.; Yuan, Z. Potentially important MicroRNAs in form-deprivation myopia revealed by bioinformatics analysis of MicroRNA profiling. Ophthalmic Res. 2017, 57, 186–193. [Google Scholar] [CrossRef] [PubMed]
  33. Tkatchenko, A.V.; Luo, X.; Tkatchenko, T.V.; Vaz, C.; Tanavde, V.M.; Maurer-Stroh, S.; Zauscher, S.; Gonzalez, P.; Young, T.L. Large-scale microRNA expression profiling identifies putative retinal miRNA-mRNA signaling pathways underlying form-deprivation myopia in mice. PLoS ONE 2016, 11, e0162541. [Google Scholar] [CrossRef] [PubMed]
  34. Zorc, M.; Obsteter, J.; Dovc, P.; Kunej, T. Genetic variability of MicroRNA genes in 15 animal species. J. Genom. 2015, 3, 51–56. [Google Scholar] [CrossRef] [PubMed]
  35. Bartel, D.P. MicroRNAs: Target recognition and regulatory functions. Cell 2009, 136, 215–233. [Google Scholar] [CrossRef]
  36. Mori, K.; Kurihara, T.; Miyauchi, M.; Ishida, A.; Jiang, X.; Ikeda, S.I.; Torii, H.; Tsubota, K. Oral crocetin administration suppressed refractive shift and axial elongation in a murine model of lens-induced myopia. Sci. Rep. 2019, 9, 295. [Google Scholar] [CrossRef]
Figure 1. Myopia induction in mice using a negative 30 diopter (D) lens. Changes in (a) refraction and (b) axial length over three weeks are shown as a comparison between normal and negative 30 D lens-wearing eyes (n = 3). Data are presented as the mean ± SD. *** p < 0.001; Student’s t-test. (c) A representative optical coherent tomography (OCT) image showing each ocular component.
Ijms 20 03629 g001
Figure 2. Changes in retina and choroid thickness during the period of lens-induced myopia. The changes in (a) retina and (b) choroid thickness over a three-week-period are shown as a comparison between normal and negative 30 D lens-wearing eyes (n = 3). Data are presented as the mean ± SD. * p < 0.05; Student’s t-test.
Ijms 20 03629 g002
Figure 3. Ocular component tissues. The individual components of the eyeball are shown as separated into the cornea, iris, lens, retina, retinal pigment epithelium (RPE)/choroid, and sclera. The RPE/choroid and the sclera components were removed as delicately as possible using surgical scalpels.
Ijms 20 03629 g003
Figure 4. Corneal miRNAs affected by myopia induction. The corneal miRNAs whose expression was affected by myopia induction are listed as upregulated (left) and downregulated (right).
Ijms 20 03629 g004
Figure 5. Iris miRNAs affected by myopia induction. The iris miRNAs whose expression was affected by myopia induction are listed as upregulated (left) and downregulated (right).
Ijms 20 03629 g005
Figure 6. Lens miRNAs affected by myopia induction. The lens miRNAs whose expression was affected by myopia induction are listed as upregulated (left) and downregulated (right).
Ijms 20 03629 g006
Figure 7. Retinal miRNAs affected by myopia induction. The retinal miRNAs whose expression was affected by myopia induction are listed as upregulated (left) and downregulated (right). Note that no upregulated miRNAs were detected (n.d.).
Ijms 20 03629 g007
Figure 8. Retinal pigment epithelium (RPE)/choroidal miRNAs affected by myopia induction. The RPE/choroidal miRNAs whose expression was affected by myopia induction are listed as upregulated (left) and downregulated (right).
Ijms 20 03629 g008
Figure 9. Scleral miRNAs affected by myopia induction. The scleral miRNAs whose expression was affected by myopia induction are listed as upregulated (left) and downregulated (right).
Ijms 20 03629 g009
Table 1. The numbers of differentially expressed microRNAs (miRNAs) affected by myopia induction in the individual ocular components.
Combination 2 Times Over or 0.5 Times Less *15 Times Over *2 or 0.2 Times Less *3Total
1CorneaNumeratorLens-inducedUp144256
DenominatorNormalDown077
2IrisNumeratorLens-inducedUp31013
DenominatorNormalDown72128
3LensNumeratorLens-inducedUp336
DenominatorNormalDown71017
4RetinaNumeratorLens-inducedUp000
DenominatorNormalDown099
5RPE/choroidNumeratorLens-inducedUp82129
DenominatorNormalDown347
6ScleraNumeratorLens-inducedUp22830
DenominatorNormalDown93140
*1 Detected flag indicated and expression ratio 2 times over or 0.5 times less both groups. *2 Not detected flag was indicated in numerator, but detected flag in denominator and expression ratio of 5 times over. *3 Not detected flag was indicated in denominator, but detected flag in numerator and expression ratio of 0.2 times less was showed.
Table 2. Overlapping expression changes in miRNAs in corneal and other ocular tissues.
Cornea
Up
Each Eye-Tissues
Down
Each Eye-Tissues
updownupdown
IrisIris
mmu-miR-7686-5pmmu-miR-676-3p-mmu-miR-7047-3p
mmu-miR-2137mmu-miR-574-3pLens
mmu-miR-1224-5pmmu-miR-9-3p-mmu-miR-7047-3p
mmu-miR-129b-5p mmu-miR-7085-3p
Lensmmu-miR-328-3p
mmu-miR-301a-3p-Retina
mmu-miR-1187--
RetinaRPE/choroid
--mmu-miR-7085-3p-
RPE/choroidmmu-miR-7047-3p
mmu-miR-466f-3p-Sclera
mmu-miR-574-3p--
mmu-miR-466g
Sclera
mmu-miR-1927mmu-miR-676-3p
mmu-miR-338-3p
mmu-miR-494-3p
mmu-miR-2137
mmu-miR-574-5p
mmu-miR-3082-5p
mmu-miR-7218-5p
mmu-miR-7682-3p
mmu-miR-1187
mmu-miR-6918-5p
mmu-miR-504-3p
mmu-miR-129b-5p
mmu-miR-466i-5p
mmu-miR-6904-5p
mmu-miR-7686-5p
mmu-miR-1224-5p
Table 3. Overlapping expression changes in miRNAs in iris and other ocular tissues.
Iris
Up
Each Eye-Tissues
Down
Each Eye-Tissues
updownupdown
LensLens
mmu-miR-6931-5p-mmu-miR-128-3p
RetinaRetina
----
RPE/choroidRPE/choroid
mmu-miR-7653-5p-mmu-miR-207mmu-miR-598-3p
mmu-miR-3070-2-3pmmu-miR-1947-3p
mmu-miR-6980-5pmmu-miR-7020-5p
mmu-miR-6906-5pmmu-miR-669f-3p
Sclerammu-miR-468-3p
mmu-miR-6905-5pmmu-miR-5615-5pmmu-miR-467a-3p
mmu-miR-3070-2-3pSclera
mmu-miR-6906-5pmmu-miR-468-3pmmu-miR-598-3p
mmu-miR-7050-5p
mmu-miR-467a-3p
mmu-miR-669f-3p
Table 4. Overlapping expression changes in miRNAs in lens and other ocular tissues.
Lens
Up
Each Eye-Tissues
Down
Each Eye-Tissues
updownupdown
RetinaRetina
---mmu-miR-6965-5p
RPE/choroidmmu-miR-202-3p
mmu-miR-96-5p-RPE/choroid
Sclerammu-miR-6965-5p-
-mmu-miR-96-5pSclera
mmu-miR-183-5pmmu-miR-188-5pmmu-miR-6965-5p
mmu-miR-124-3pmmu-miR-202-3p
Table 5. Overlapping expression changes in miRNAs in retina and other ocular tissues.
Retina
Up
Each Eye-Tissues
DownEach Eye-Tissues
updownupdown
RPE/choroidRPE/choroid
--mmu-miR-1904-
Sclerammu-miR-705
--Sclera
--
Table 6. Overlapping expression changes in miRNAs in RPE/choroid and other ocular tissues.
RPE/Choroid
Up
Each Eye-Tissues
Down
Each Eye-Tissues
updownupdown
ScleraSclera
mmu-miR-5622-3pmmu-miR-1906
mmu-miR-6898-5p
-mmu-miR-872-5p
mmu-miR-8095mmu-miR-182-5p
mmu-miR-5620-3p
mmu-miR-7022-3p
Table 7. Overlapping expression changes in miRNAs between more than three types of ocular tissue. Note that grey highlights indicate downregulated miRNAs.
miRNAsOverlapping Tissues
mmu-miR-1187CorneaLensSclera
mmu-miR-1224-5pCorneaIrisSclera
mmu-miR-129b-5pCorneaIrisSclera
mmu-miR-202-3pLensRetinaSclera
mmu-miR-2137CorneaIrisSclera
mmu-miR-3070-2-3pIrisRPE/choroidSclera
mmu-miR-467a-3pIrisRPE/choroidSclera
mmu-miR-468-3pIrisRPE/choroidSclera
mmu-miR-574-3pCorneaIrisRPE/choroid
mmu-miR-598-3pIrisRPE/choroidSclera
mmu-miR-669f-3pIrisRPE/choroidSclera
mmu-miR-676-3pCorneaIrisSclera
mmu-miR-6906-5pIrisRPE/choroidSclera
mmu-miR-6965-5pLensRPE/choroidSclera
mmu-miR-7047-3pCorneaIrisLensRPE/choroid
mmu-miR-7085-3pCorneaLensRPE/choroid
mmu-miR-7686-5pCorneaIrisSclera
mmu-miR-96-5pLensRPE/choroidSclera
Table 8. The target genes predicted from the change in miRNA expression in the cornea.
Cornea
Upregulated miRNAsTarget geneDownregulated miRNAsTarget gene
mmu-miR-211-5pPPM1Kmmu-miR-328-3pBACE1
mmu-miR-494-3pFGFR2, ROCK1mmu-miR-294-3pCDKN1A
mmu-miR-200b-5pARHGDIA
mmu-miR-669nSENP6
mmu-miR-338-3pFGFR2, Runx2, TNFSF11
mmu-miR-378a-3pNrf1, GLI3, MAPK1
mmu-miR-101a-3pCOX2, DUSP1, ACKR3, NeuroD1
mmu-miR-99b-5pMFGE8
mmu-miR-33-5pABCG1, ABCA1, NRIP1, CCL2,
HMGA2
mmu-miR-451aMYC, YWHAZ, ANKRD46
mmu-miR-192-5pH3F3BH
mmu-miR-214-3pPOU4F2, SP7, DIO3, Atg12,
PTEN
mmu-miR-223-3pMEF2C, STAT3, GRIA2, GRIN2B,
FOXO3, IGF1R, LIF, IL6
mmu-miR-1a-3pCALM2, CALM1, MEF2A, IGF1,
HAND2, IRX5, GJA1, KLF4,
CDC42, TLX2, ANXA5, MKL1,
SMARCD2, CLCN3, SMARCB1, MAP4K3,
FZD7, MEOX2, NFAT5, RARB,
SH3BGR1, MYOCD, ADAR, BDNF
mmu-miR-301a-3pPIAS3, SOCS5, IRF1, PTEN
mmu-miR-9-3pSCN2B
mmu-miR-690VCAN, CTNNB1
mmu-miR-126a-3pPIK3R2, IRS1, ITGA11, ERRFI1,
FZD7
Table 9. The target genes predicted from the change in miRNA expression in the iris.
Iris
Upregulated miRNAsTarget geneDownregulated miRNAsTarget gene
mmu-miR-212-3pMMP9, HMGB1mmu-miR-434-3pVCAN, CTNNB1, EIF5A
 mmu-miR-148b-3pCAMK2A, DNMT1
mmu-miR-18a-5pHSF2, HIF1A
mmu-miR-19a-3pZFPM2, PTEN, TNF, FZD4,
LRP6
mmu-miR-468-3pHELLS
mmu-miR-467gRUNX2
mmu-miR-128-3pPOU4F2, NF1, PPARA, RUNX1,
PAX3, ABHD5, MAPK14, DCX
mmu-miR-9-3pSCN2B
mmu-miR-877-3pSMAD7
mmu-miR-490-3pNANOG
Table 10. The target genes predicted from the change in miRNA expression in the lens.
Lens
Upregulated miRNAsTarget geneDownregulated miRNAsTarget gene
mmu-miR-301a-3pPIAS3, SOCS5, IRF1, PTENmmu-miR-148a-3pCAMK2A, KDM6B, ROCK1, MET
mmu-miR-140-5pHDAC4, ASP1, TGFBR1,
WNT11, OSTM1
mmu-miR-128-3pPOU4F2, NF1, PPARA, RUNX1,
PAX3, ABHD5, MAPK14, DCX
mmu-miR-124-3pITGB1, FOXA2, SYCP1,
PTBP1, CTDSP1
mmu-miR-328-3pBACE1
mmu-miR-183-5pZEB2, LRP6
mmu-miR-96-5pCLIC5, INSIG2, AKT1S1
Table 11. The target genes predicted from the change in miRNA expression in the RPE/choroid.
RPE/choroid
Upregulated miRNAsTarget geneDownregulated miRNAsTarget gene
mmu-miR-468-3pHELLSmmu-miR-7a-5pHELLS, EIF4E, RPS6KB1, MAPKAP1,
MKNK2, MKNK1, Sp1, PARP1,
NLRP3, HERPUD2, MYRIP, PAX6,
KLF4, PTK2
mmu-miR-329-3pDLK1
mmu-miR-182-5pCLIC5, FBXW7, MYOD1, TLR4
mmu-miR-96-5pCLIC5, INSIG2, AKT1S1
Table 12. The target genes predicted from the change in miRNA expression in the sclera.
Sclera
Upregulated miRNAsTarget geneDownregulated miRNAsTarget gene
mmu-miR-184-3pFZD4, NUMBL, SLC25A22mmu-miR-146a-5pIRAK2, TRAF6, VSIVGP2, NOTCH1,
MED1, RELB, IRAK1, MAP1B,
RNF11, WNT1, WNT5A, EGR1,
PPP3R2, TGIF1, CAMK2D
mmu-miR-494-3pFGFR2, ROCK1
mmu-miR-468-3pHELLS
mmu-miR-31-5pHIF1A, PDGFB, FZD4, TGFB2,
VAV3
mmu-miR-30b-3pPPIF
mmu-miR-185-5pKDM6B, VCAN, CTNNB1
mmu-miR-30e-3pSPATA19, NPFFR2, MRPS30
mmu-miR-221-3pDDIT4, KIT, ARNT
mmu-miR-139-5pFOXO1, NOTCH1, IRS1
mmu-miR-376b-3pNFKBIZ, STAT3, HOXD10
mmu-miR-93-5pSTAT3, VSIVGP2, SQSTM1, NFE2L2,
BMPR2
mmu-miR-376a-3pPCNA
mmu-miR-155-5pRHOA, RHEB, SOCS1, AICDA,
PEA15A, MAF, SPI1, FGF7,
INPP5D, FOS, PMAIP1, CLDN1,
HDAC4, NR1H3, CISH, GSK3B,
CSNK1A1
mmu-miR-132-3pMECP2, EP300, KDM5A, BTG2,
PAIP2, MMP9, NR4A2, ARHGAP32,
MAPT, SOX4
mmu-miR-182-5pCLIC5, FBXW7, MYOD1, TLR4
mmu-miR-96-5pCLIC5, INSIG2, AKT1S1
mmu-miR-98-5pACVR1B, MMP11, IL6, WNT1
mmu-miR-183-5pZEB2, LRP6
mmu-miR-338-3pFGFR2, RUNX2, TNFSF11
mmu-miR-124-3pITGB1, FOXA2, SYCP1, PTBP1,
PTBP2, CTDSP1, CEBPA, DLX2,
SOX9, PTBP2, DLX5, CCNA2,
NR3C2, PIM1, CAV1
Table 13. The overlapping expression changes in miRNAs found in two ocular tissues and their target genes.
Overlapping Expression Changes of miRNAs in Two Tissues and Target Genes
Upregulated in both cornea and lensTarget gene
mmu-miR-301a-3pFGFR2, RUNX2, TNFSF11
Upregulated in both cornea and sclera
mmu-miR-494-3pFGFR2, ROCK1
Downregulated in both cornea and lens
mmu-miR-328-3pBACE1
Upregulated in cornea and downregulated in iris
mmu-miR-9-3pSCN2B
Upregulated in cornea and downregulated in sclera
mmu-miR-338-3pPIAS3, SOCS5, IRF1, PTEN
Downregulated in both iris and lens
mmu-miR-128-3pPOU4F2, NF1, PPARA, RUNX1,
PAX3, ABHD5, MAPK14, DCX
Upregulated in lens and downregulated in sclera
mmu-miR-124-3pITGB1, FOXA2, SYCP1, PTBP1,
CTDSP1
mmu-miR-183-5pZEB2, LRP6
Downregulated in both RPE/choroid and sclera
mmu-miR-182-5pCLIC5, FBXW7, MYOD1, TLR4
Table 14. The overlapping expression changes in miRNAs found in three ocular tissues and their target genes.
Overlapping Expression Changes of miRNAs in Three Tissues and Target Gene
Upregulated in lens and RPE/choroid, downregulated in scleraTarget gene
mmu-miR-96-5pCLIC5, INSIG2, AKT1S1
Upregulated in iris, RPE/choroid and sclera
mmu-miR-468-3pHELLS

