Article

Promoting Beneficial and Inhibiting Undesirable Biofilm Formation with Mangrove Extracts

1
Institute of Botany, Leibniz University Hannover, D-30419 Hannover, Germany
2
Department of Food Environmental and Nutritional Sciences, Università degli Studi di Milano, 20133 Milano, Italy
*
Author to whom correspondence should be addressed.
These authors contributed equally to this work.
Int. J. Mol. Sci. 2019, 20(14), 3549; https://doi.org/10.3390/ijms20143549
Submission received: 22 June 2019 / Revised: 17 July 2019 / Accepted: 18 July 2019 / Published: 19 July 2019
(This article belongs to the Section Molecular Plant Sciences)

Abstract

:
The extracts of two mangrove species, Bruguiera cylindrica and Laguncularia racemosa, have been analyzed at sub-lethal concentrations for their potential to modulate biofilm cycles (i.e., adhesion, maturation, and detachment) on a bacterium, yeast, and filamentous fungus. Methanolic leaf extracts were also characterized, and MS/MS analysis has been used to identify the major compounds. In this study, we showed the following. (i) Adhesion was reduced up to 85.4% in all the models except for E. coli, where adhesion was promoted up to 5.10-fold. (ii) Both the sum and ratio of extracellular polysaccharides and proteins in mature biofilm were increased up to 2.5-fold and 2.6-fold in comparison to the negative control, respectively. Additionally, a shift toward a major production of exopolysaccharides was found coupled with a major production of both intracellular and extracellular reactive oxygen species. (iii) Lastly, detachment was generally promoted. In general, the L. racemosa extract had a higher bioactivity at lower concentrations than the B. cylindrica extract. Overall, our data showed a reduction in cells/conidia adhesion under B. cylindrica and L. racemosa exposure, followed by an increase of exopolysaccharides during biofilm maturation and a variable effect on biofilm dispersal. In conclusion, extracts either inhibited or enhanced biofilm development, and this effect depended on both the microbial taxon and biofilm formation step.

Graphical Abstract

1. Introduction

Microorganisms, including fungi, adhere to surfaces and form complex and heterogeneous microbial communities called biofilms. It is well known that the formation of biofilms is undesirable in some systems, including water supply and food plants [1,2], heat exchangers and cooling towers, corrodible metal surfaces [3,4,5], and biomedical devices [6]. In contrast, the employment of biofilms in other environments, such as for bioremediation, in wastewater treatment plants [7,8], in other industrial settings [9], and for microbial fuel cells [10] is remarkably beneficial. In the former case, research has aimed at preventing adhesion, reducing maturation, and favoring detachment. In the latter case, the enhancement of initial adhesion to a substratum and the subsequent formation of robust mature biofilms are important goals to achieve.
Despite their beneficial roles in many fields, biofilms are mainly associated with negative impacts. In this direction, antimicrobial agents aimed at killing microorganisms have been extensively employed to control biofilm growth. However, since sessile cells can be up to 1000 times more resistant to antimicrobial agents than their planktonic counterpart, controlling their growth could be significantly challenging once they are formed [11]. Moreover, the emergence of resistant microorganisms is favored by the inappropriate use of antibiotics, as well as unsatisfactory infection prevention and control, posing serious concerns for public health and food security worldwide [12,13]. Thus, in recent years, researchers have focused their attention on alternative, safe, cost-effective and more eco-sustainable antibiofilm strategies employing non-toxic and biodegradable solutions. On the contrary, agents promoting biofilm development have been less investigated [14].
Plants have a long history of being a source of interesting compounds. Also at present, plant metabolites are the origin of newly developed drugs next to other natural sources and synthetic compounds [15]. These compounds are secondary metabolites that are synthesized by the plant to cope with environmental stress or for reproductive purposes. In most cases, these molecules display suitable environmental fate parameters such as high water solubility, low log P and bioaccumulation in the biological systems, and no ecotoxicity, which make them potential safe antibiofilm or biofilm-promoting agents [16,17]. Mangroves are trees and shrubs growing along tropical coasts with direct contact to seawater, which is an environment with many biotic and abiotic stress factors. In response to their surroundings, mangroves produce diverse secondary metabolites, including flavonoids, tannins, alkaloids, and terpenes [18]. They are used in ethnobotany for the treatment of several diseases, including infections, and also as pesticides [19].
In this study, mangrove extracts were employed to study their effects on biofilm formation (i.e., adhesion, maturation, and detachment) of three microbial models: a bacterium (Escherichia coli), a yeast (Candida albicans), and a filamentous fungus (Fusarium oxysporum). An advantage of using the extracts is their putative additive and synergistic activity, as they can act on multiple targets, which is an interesting strategy when dealing with the complex biofilm formation phenomenon, as several pathways are involved [20]. Mangroves were chosen as they have already been proven to be promising in interfering with planktonic and sessile bacteria and fungi [21,22].
Many researchers have proved that several phytochemicals show activity on the adhesion of different microorganisms. Lin et al. [23] showed the inhibitory effect of 1,2,3,4,6-penta-O-galloly-beta-D-glucopyranose on Staphylococcus aureus biofilm formation. In the study by Das et al. [24], the inhibition of Pseudomonas aeruginosa adhesion was achieved by using vitexin together with azithromycin and gentamicin. The effects of myricetin derivatives were studied on biofilms formed by many microorganisms. Lopes et al. [25] reported that myricetin, together with hesperetin and phloretin, inhibited Staphylococcus aureus RN4220 biofilm formation by more than 70%, and lower biofilm formation inhibition was recorded against S. aureus SA1199B. Similarly, Arita-Morioka et al. [26] examined activities of myricetin derivatives to reduce adhesion by E. coli K-12. In the case of P. aeruginosa PAO1, Pejin et al. [27] suggested the delphinidin scaffold for the design of the new potent antibiofilm agents. The inhibitory activity of tea catechin epigallocatechin-3-gallate against biofilms by Streptococcus mutans and a Lactobacillus sp. was observed by Wu et al. [28]. De Vita et al. [29] reported that caffeic acid and several acid derivatives were able to inhibit C. albicans adhesion.
Although in several papers the inhibition of biofilm formation has been discussed and some manuscripts reported an enhancement of biofilm formation upon exposure to phytochemicals [24,25,29,30], no manuscripts have reported biofilm inhibition and promotion in the same study. To the best of our knowledge, this work shows for the first time that the effects of non-lethal concentrations of plant extracts are dependent on the microbial strain and biofilm formation step.
Here, we compared biofilm features in response to phytochemicals on prokaryotic, yeast-like, and filamentous fungal cells. Notably, so far, a number of natural compounds have been proposed for controlling bacterial and yeast fungal biofilms, probably because these microorganisms have been recognized to have a large impact on human health and the economy. In contrast, only few studies have dealt with safe options for controlling filamentous fungal biofilm. In the past, they were generally assumed not to form biofilms, probably because they do not completely fit biofilm definitions based on bacterial and yeast models [31].

2. Results

2.1. Phytochemical Analysis of the Extracts

Total Phenol Content (TPC), Total Flavonoid Content (TFC) and Oxygen Radical Absorbance Capacity (ORAC)

Both mangrove species contained phenolic acids and flavonoids in the methanolic extract from fresh leaf material (Figure 1). The concentration of flavonoids and phenolic acids was higher in Lagunclaria racemosa (32.31 ± 3.41 µg catechin equivalent (CE) and 209.55 ± 4.97 µg gallic acid equivalent (GAE)/mg extract) compared to Bruguiera cylindrica leaf extract (17.00 ± 1.43 µg CE and 36.39 ± 0.59 GAE/mg extract). The ORAC value was similar for both species with 450.20 ± 23.09 mg Trolox equivalents (TE)/g extract for L. racemosa and 441.99 ± 20.23 mg TE/g extract for B. cylindrica.

2.2. LC-MS Analysis of Secondary Metabolites

Crude methanol (MetOH) extracts of B. cylindrica and L. racemosa leaves were further analyzed for their secondary metabolite composition by LC-MS (Table 1 and Figure S1). Mass signals in the range of 100 to 800 Da in ESI showed varying signals for both species. MS and MS/MS data obtained from the analysis were compared to publicly available databases. In both extracts, the sugar galactinol was identified. Another sugar, mannitol, was present in L. racemosa extract. Not all the peaks in the extract could be identified with the databases used. Of the identified signals, two belonged to the group of phenolic acids in the B. cylindrica extract, namely caffeic acid and 1-O-b-D-glucopyranosyl sinapate modified. Hirsutine, an indole alkaloid, was present as well, in addition to the flavones homoorientin, vitexin-2″-O-rhamnoside, and one of its isomeric forms. In the extract from L. racemosa leaves, the flavonoids (–)-epigallocatechin, epigallocatechin 3,5-digallate, delphinidin, and myricetin were detected, in addition to the flavones robinetin trimethyl ether, myricitrin, and two of its glycosidic forms. The signal of methyl gallate was likely a breakdown product from epigallocatechin 3,5-digallate. The tannin casuarinin was identified by the presence of the double-charged ion at m/z 467.03, and its fragments were compared to the data measured by Glasenapp et al. [21].

2.3. Mangrove Extracts do not Have Toxic Effects

2.3.1. Mangrove Extracts do not Have a Biocidal Effect

E. coli, C. albicans, and F. oxysporum growth were undisturbed in the presence of both mangrove extracts at all the concentrations tested, with no discernible inhibition halo around the disks. Both the negative controls gave the same negative result, indicating that the addition of 2% MetOH to each extract did not kill microorganisms. On the contrary, a visible inhibition halo was present around the disk imbibed with the positive controls (Figure S2).

2.3.2. Mangrove Extracts do not Modulate Planktonic Growth

The ability of mangrove extracts to modulate planktonic growth was tested by monitoring the microbial growth over time. The grow curves obtained for E. coli, C. albicans, and F. oxysporum in the presence of B. cylindrica and L. racemosa extracts at all the concentrations tested are reported in Figure S3. Furthermore, the interpolation of obtained data with the Gompertz growth model provided kinetic parameters is reported in Table S1. Experiments did not show differences in the duration of lag phase (λ), maximum specific growth rate (μm), and maximum growth (YM) when all the microbial models where grown with or without both mangrove extracts. Therefore, mangrove extracts did not modulate microbial growth up to 1000 mg/L.
No differences were observed between the phosphate buffer saline (PBS) and 2% MetOH negative controls for each of the microorganisms tested.

2.3.3. Mangrove Extracts do not Affect F. oxysporum Conidia Germination

Experiments showed that after 21 h of incubation with or without B. cylindrica and L. racemosa extracts, 100% of conidia were germinated. No differences were observed between the PBS and 2% MetOH negative controls.

2.4. Mangrove Extracts are not a Carbon and Energy Source

Both B. cylindrica and L. racemosa were not a carbon and energy source for E. coli, C. albicans, and F. oxysporum, as no microbial growth was detectable either when the two extracts were present as the sole carbon and energy source or in the control plates with no organic matter. On the contrary, in the control with sucrose, microbial growth was observed (Figure S4).

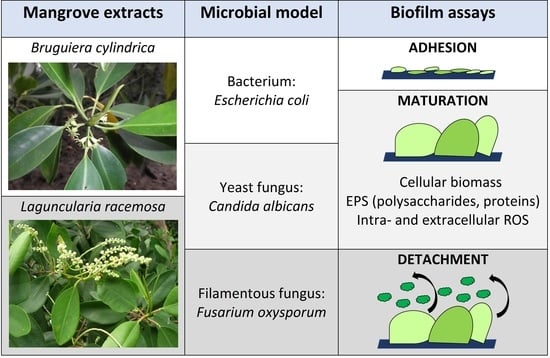
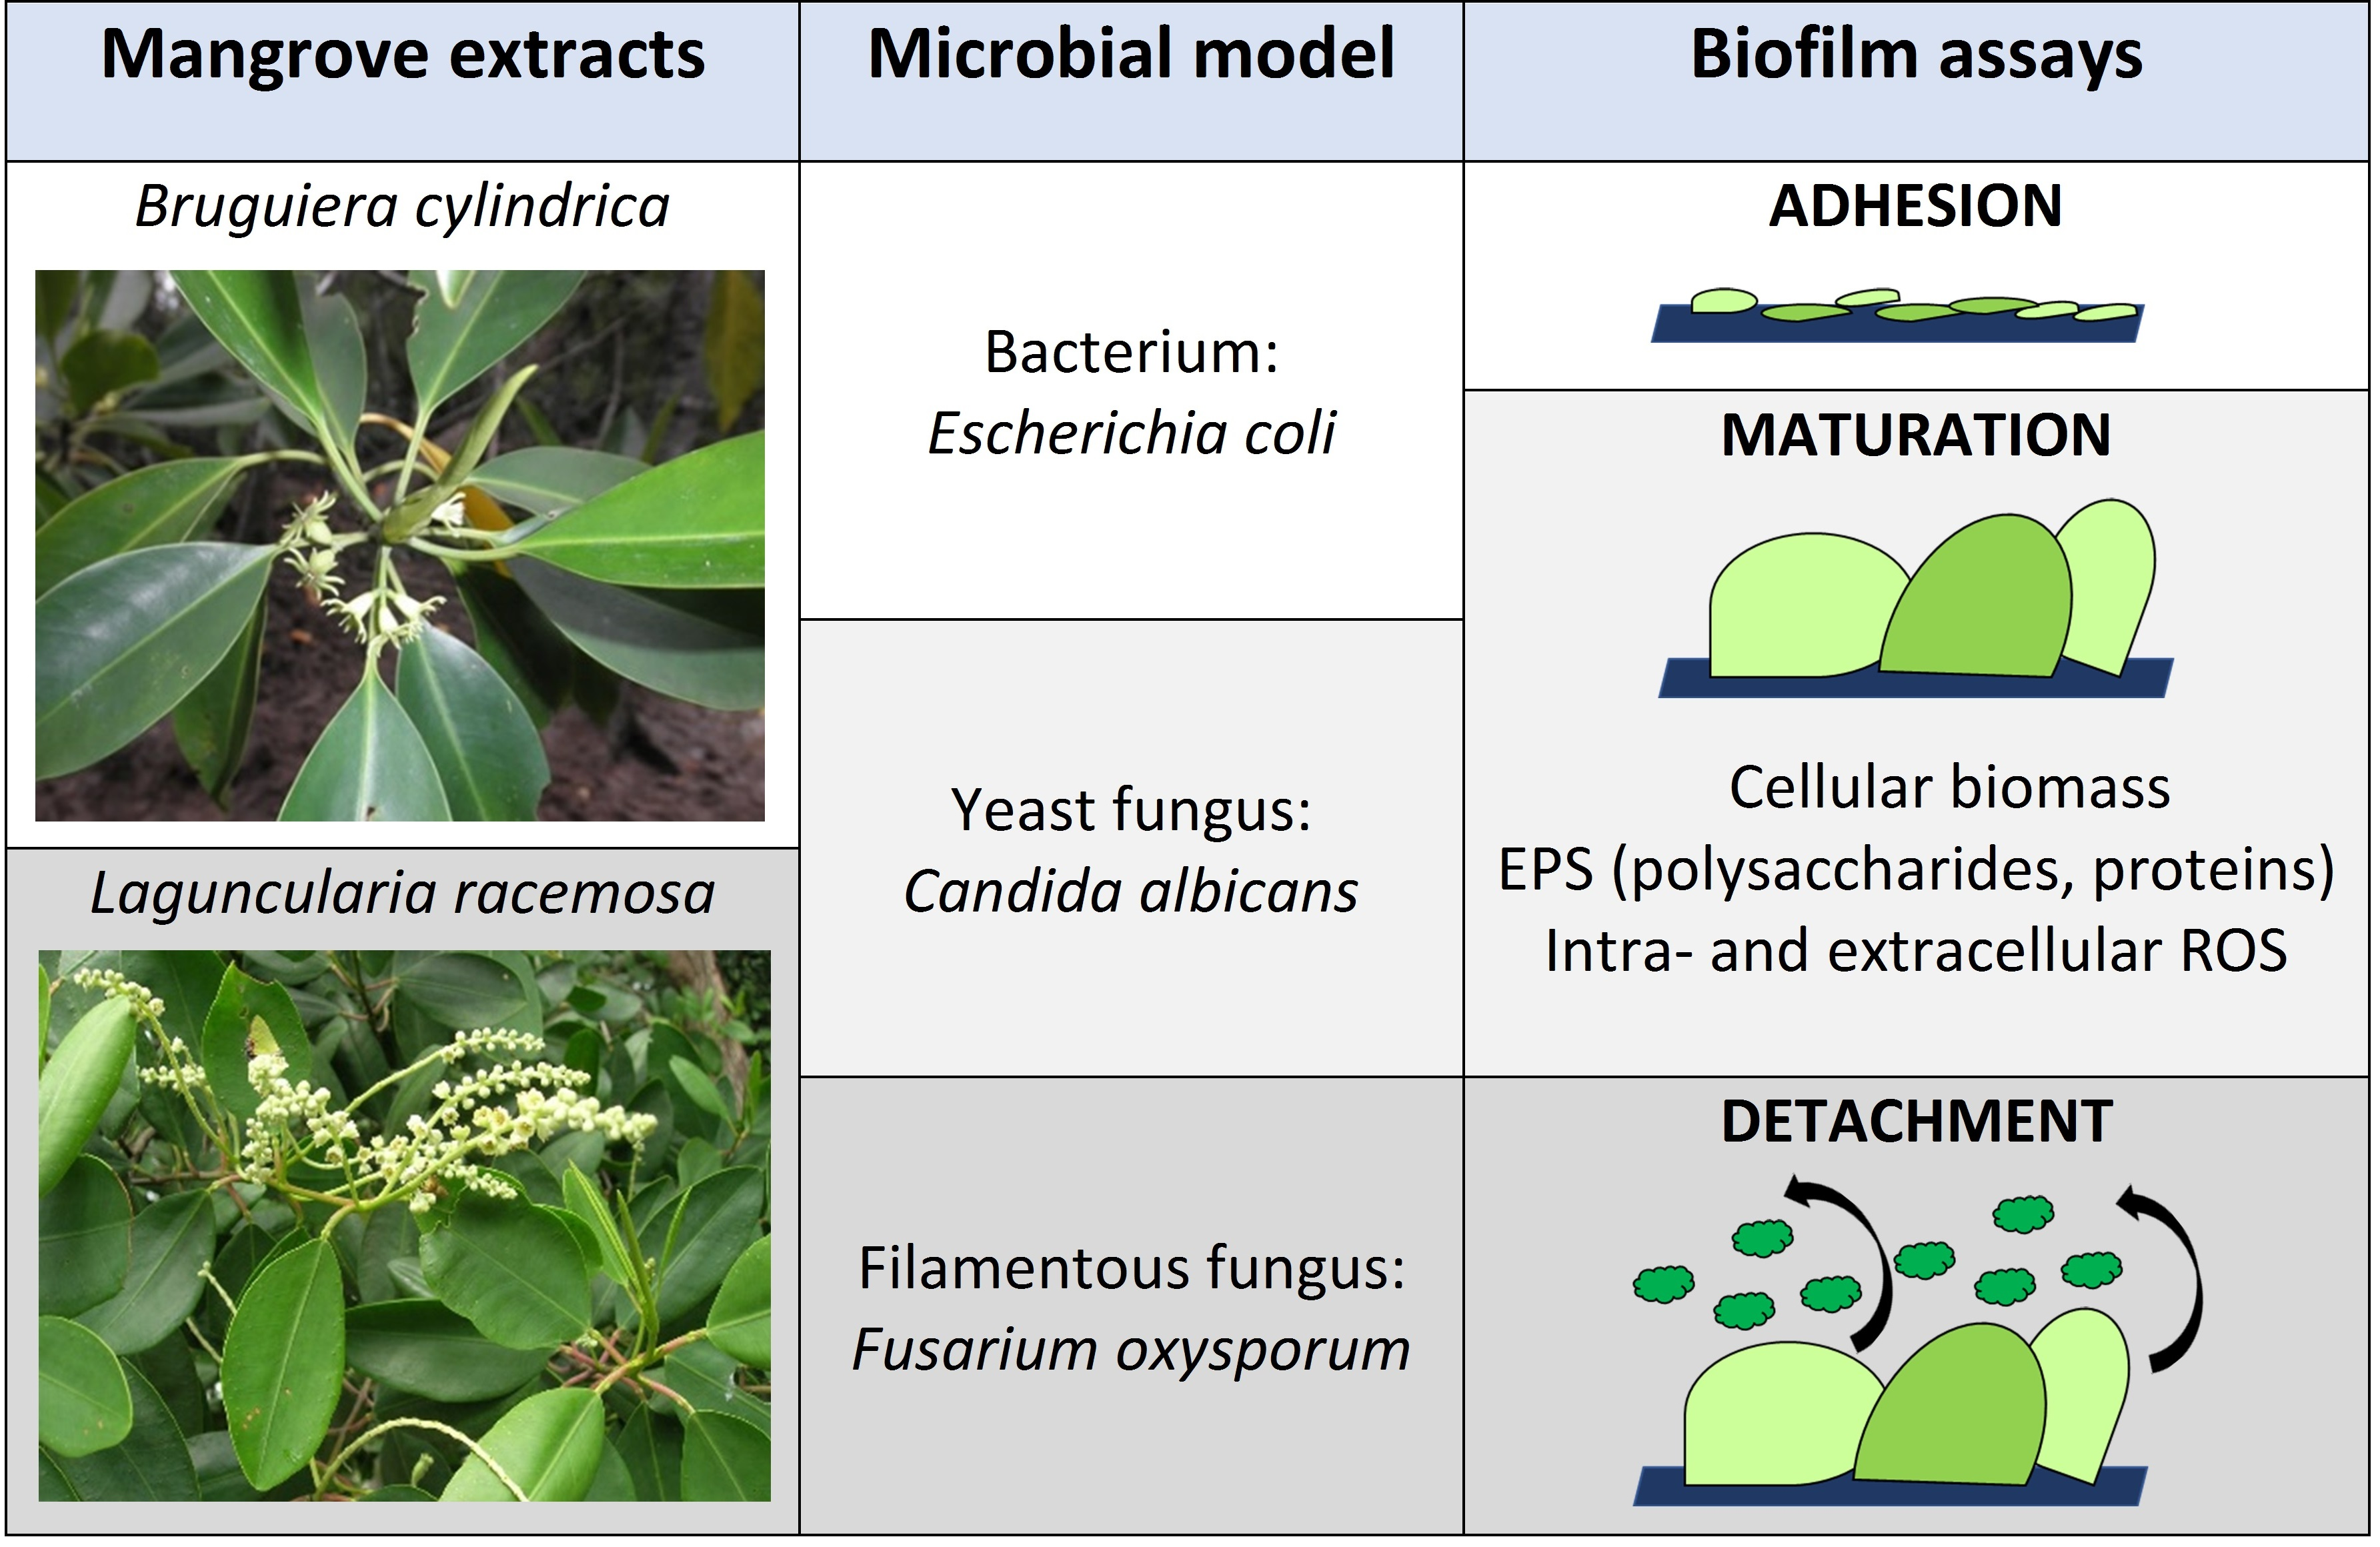
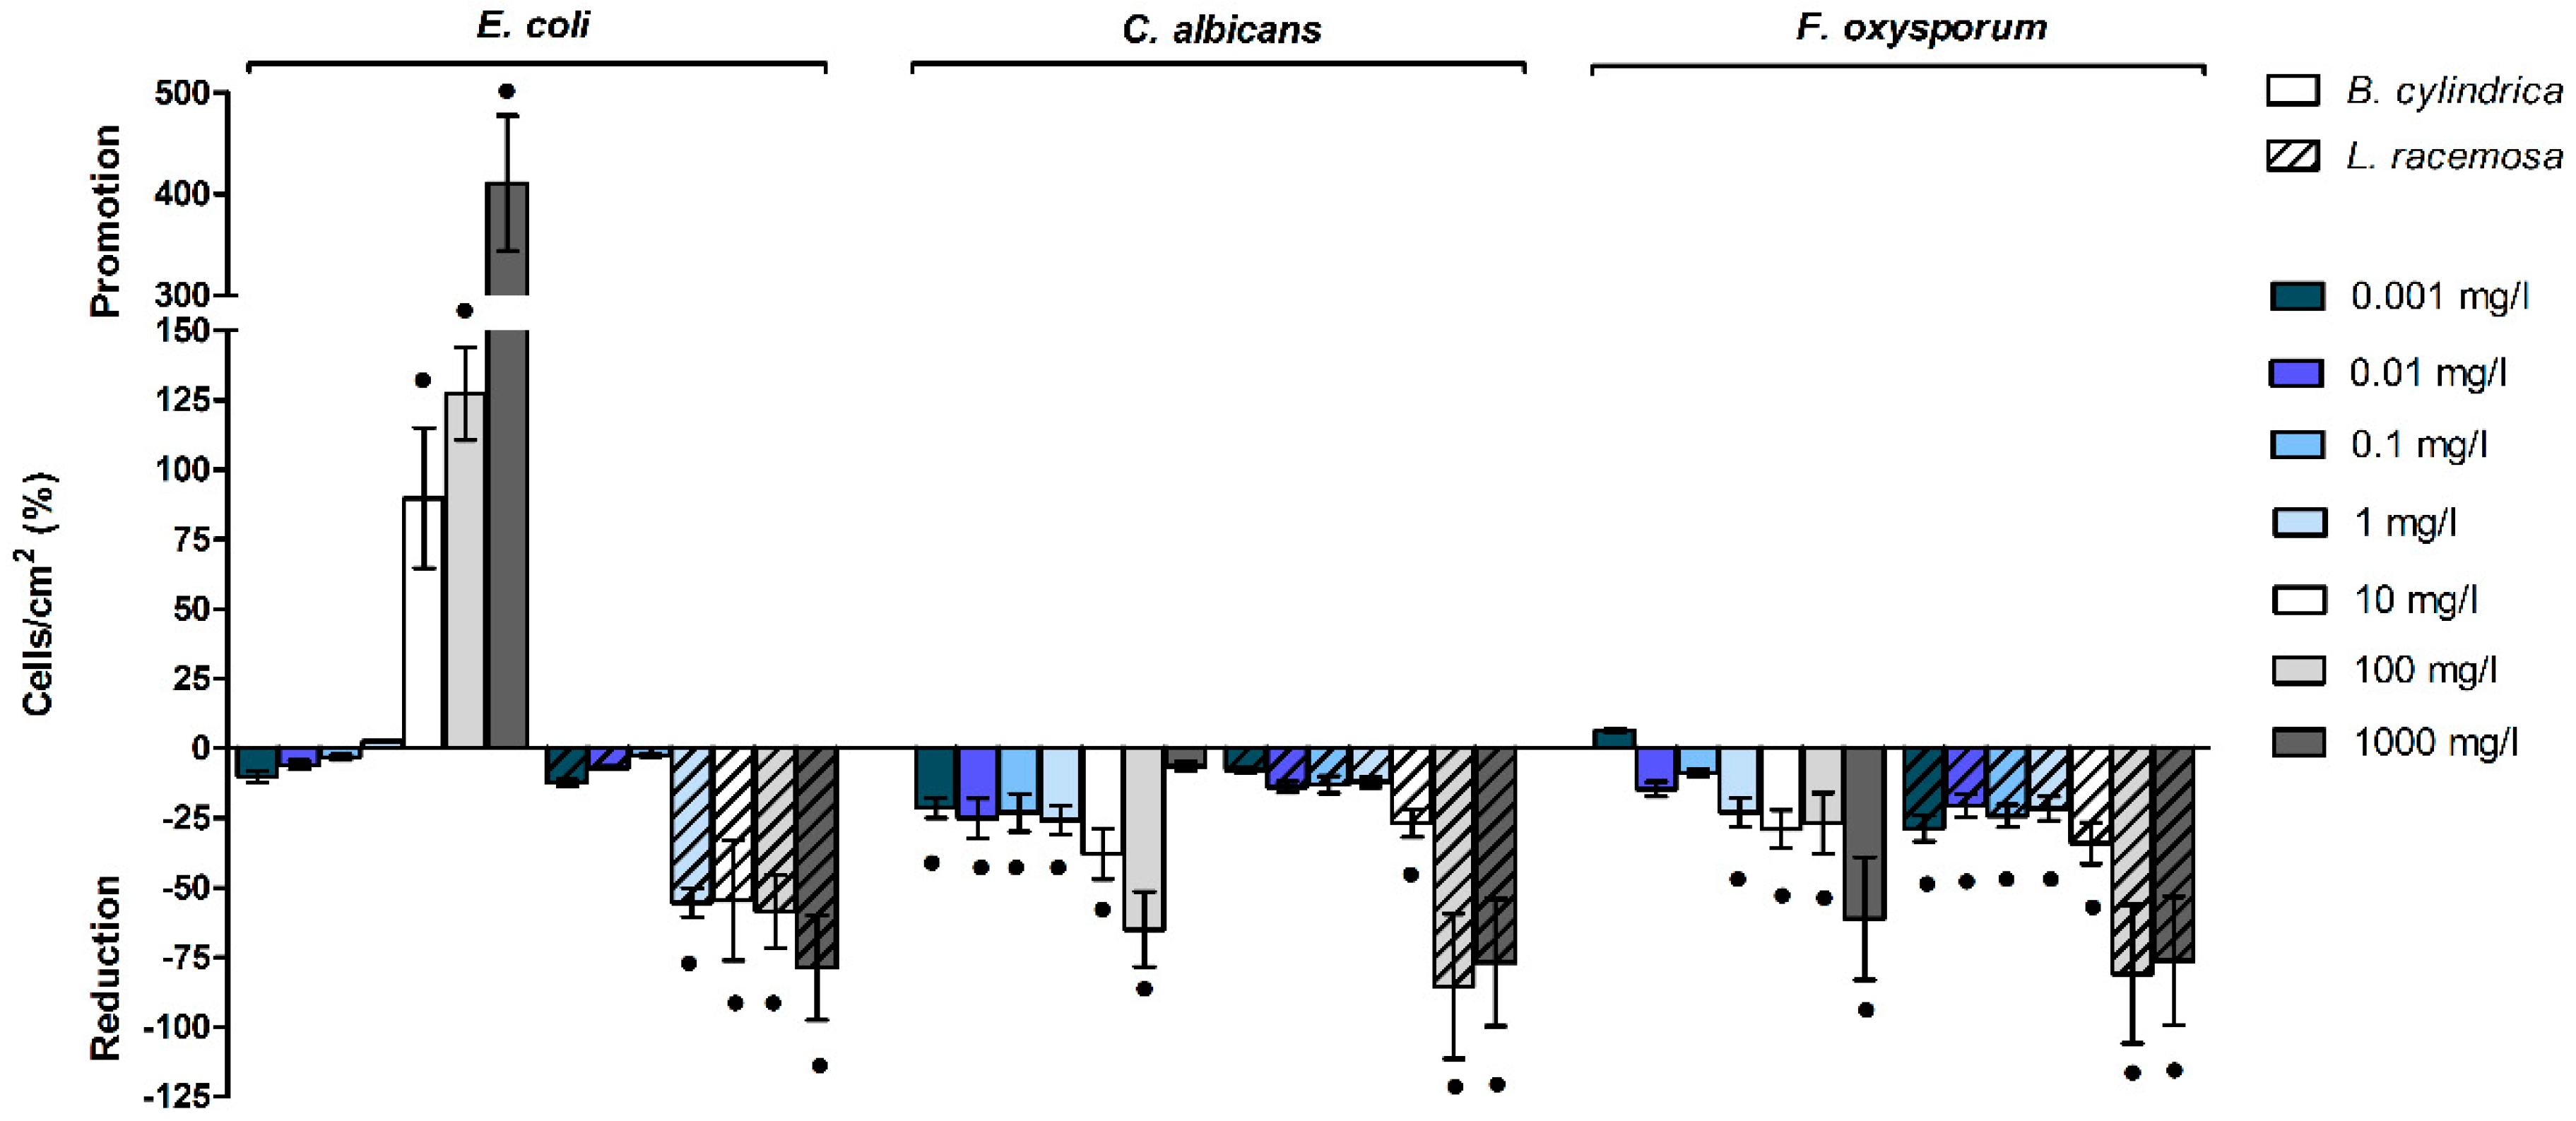
2.5. Mangrove Extracts Affect Cells/Conidia Adhesion

The effects of mangrove extract on cells or conidia adhesion and the percentage differences with respect to negative controls with 2% MetOH are reported in Figure 2 and Table S2.
Mangrove extracts showed an opposite effect on E. coli cells’ adhesion. Above 10 mg/L, B. cylindrica promoted microbial adhesion, up to 5.10 ± 0.66-fold in comparison to the 2% MetOH control sample. On the contrary, above 1 mg/L, L. racemosa abated the number of adhered cells up to the 78.7 ± 18.8% at the highest concentration tested.
Both mangrove extracts decreased C. albicans cells and F. oxysporum conidia adhesion, with a major effect of the L. racemosa extract in comparison to the B. cylindrica extract. Indeed, B. cylindrica displayed low activity between 0.001–1 mg/L, moderate activity at 10 mg/L, and excellent activity at 100 mg/L against C. albicans adhesion, whereas at 1000 mg/L, no effect was observed. L. racemosa slightly reduced C. albicans adhesion at 10 mg/L and severely decreased the number of adhered cells at 100 mg/L and 1000 mg/L.
As regards F. oxysporum, the B. cylindrica extract displayed low activity from 1 to 100 mg/L and excellent activity at 1000 mg/L. A major effect was shown in the presence of the L. racemosa extract, which exhibited low performances from 0.001 mg/L to 1 mg/L, moderate effect at 10 mg/L, and optimal anti-adhesion effects at 100 mg/L and 1000 mg/L.
No differences were shown between the PBS and 2% MetOH negative controls for each of the microorganisms tested.

2.6. Mangrove Extract Modulate Biofilm Maturation

2.6.1. Mangrove Extracts Affect Cellular Biomass Abundant

The effects of mangrove extracts on cellular biomass and the percentage differences with respect to negative controls prepared with 2% MetOH are reported in Figure 3 and Table S3.
Data showed that B. cylindrica and L. racemosa mangrove extracts did not affect or slightly affected the amount of cellular biomass only in the E. coli biofilm. On the contrary, mangrove extracts displayed an opposite effect on C. albicans biofilm. Indeed, B. cylindrica increased the biofilm biomass at the maximum concentration tested, whereas L. racemosa decreased biofilm biomass above 10 mg/L, with an optimal activity at 100 mg/L and 1000 mg/L. In F. oxysporum, no effect was shown when the biofilm was grown in the presence of B. cylindrica, whereas a decrease was measured in the presence of L. racemosa at 100 mg/L and 1000 mg/L.
No differences were shown between the PBS and 2% MetOH negative controls in each of the microorganisms tested.

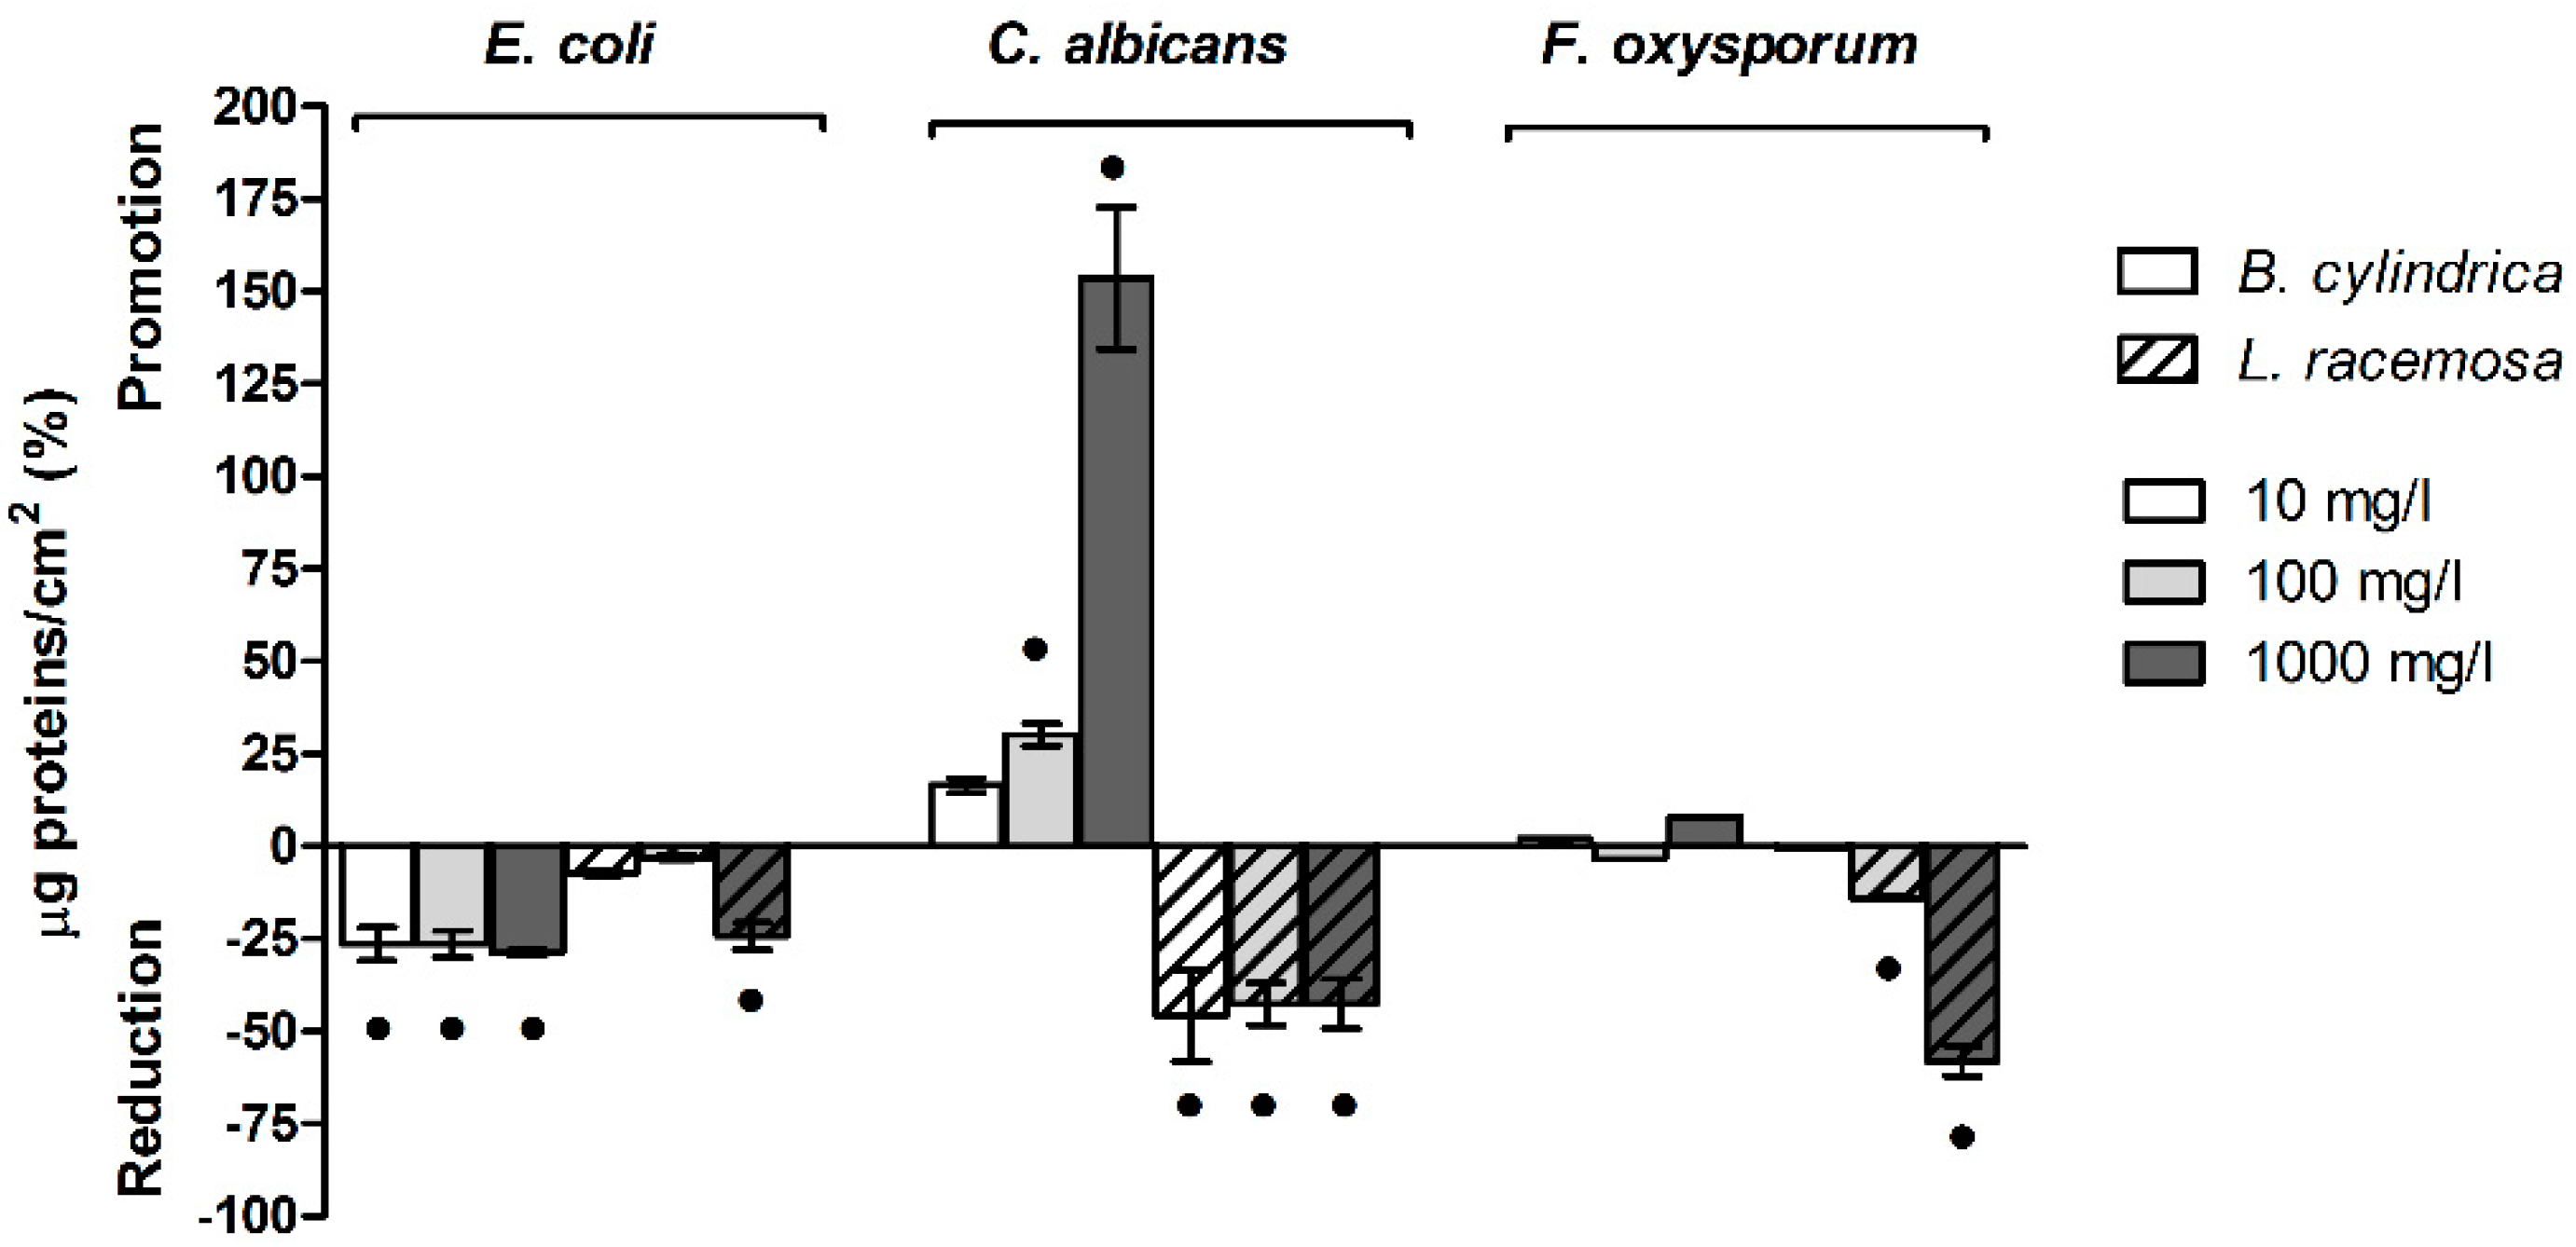
2.6.2. Mangrove Extracts Increase the Sum and Ratio of Extracellular Polysaccharides and Proteins

The abundance of polysaccharides and proteins are reported in Figures S5 and S6 respectively, whereas their sums and ratios are shown in Figure 4 and Table S4.
The results highlighted that the matrix, in terms of proteins plus polysaccharides, increased in the presence of both extracts with respect to the negative controls prepared with 2% MetOH. The highest increase in the polysaccharides and proteins sum was measured in the E. coli biofilm when treated with both B. cylindrica and L. racemosa extracts at the maximum concentrations. In the C. albicans biofilm, L. racemosa displayed a larger effect than B. cylindrica. Indeed, the first increased the ratio at 1000 mg/L, whereas the latter did not affect the ratio value. The sum of extracellular polysaccharides and proteins was also increased in the F. oxysporum biofilm when treated with both B. cylindrica and L. racemosa at 100 mg/L (Figure 4A and Table S4).
The polysaccharides/proteins ratio highlighted that B. cylindrica and L. racemosa modulated the chemical composition of the biofilm matrix, with a shift toward the increase of exopolysaccharides versus the extracellular proteins. In the E. coli and C. albicans biofilms, B. cylindrica and L. racemosa increased the polysaccharides/proteins ratio only at the maximum concentration tested. The effect was more evident in the F. oxysporum biofilm. In this biofilm, B. cylindrica increased the exopolysaccharides/proteins ratio at 100 mg/L and 1000 mg/L, whereas L. racemosa displayed its effect at all the tested concentrations (Figure 4B and Table S4).
No differences in the extracellular polysaccharides and proteins content, sum, and ratio were shown between the PBS and 2% MetOH negative controls, for each of the microorganisms tested.

2.6.3. Mangrove Extracts Increase the Intracellular and Extracellular Amount of Reactive Oxygen Species (ROS)

The effects of mangrove extracts on the intracellular and extracellular amounts of ROS and the percentage differences in comparison to negative controls prepared with 2% MetOH are shown in Figure 5 and Table S5.
Both mangrove extracts increased the level of intracellular ROS in E. coli and F. oxysporum, with a major effect of L. racemosa in comparison to B. cylindrica. The level of intracellular ROS was significantly increased when E. coli biofilm was grown in the presence of B. cylindrica at 1000 mg/L and L. racemosa at 100 mg/L and 1000 mg/L. In F. oxysporum, the B. cylindrica extract significantly increased the ROS at 1000 mg/L, whereas the L. racemosa extract affected the level of ROS at all the concentrations tested. In the C. albicans biofilm, both extracts increased the level of ROS at 1000 mg/L. However, at 10 mg/L and 100 mg/L, the level of ROS was significantly abated in the presence of B. cylindrica or remained undisturbed with the L. racemosa extract.
Similarly to the intracellular ones, extracellular ROS increased in E. coli and F. oxysporum when biofilms were treated with both mangrove extracts. Indeed, in E. coli, the extracellular level of ROS was slightly affected in the presence of B. cylindrica at all the concentrations. A high effect was observed in the presence of L. racemosa at 100 mg/L and 1000 mg/L. Additionally, both extracts—except for L. racemosa at 10 mg/L—significantly increased the extracellular ROS in F. oxysporum. B. cylindrica, and L. racemosa extracts displayed the opposite effect on the C. albicans biofilm. Indeed, B. cylindrica significantly decreased the extracellular ROS at 1000 mg/L. On the contrary, when the C. albicans biofilm was grown in the presence of L. racemosa, the extracellular level of ROS increased at 100 mg/L and 1000 mg/L.
For all the microorganisms tested, no differences were shown between the intracellular and extracellular ROS in the PBS and 2% MetOH negative controls.

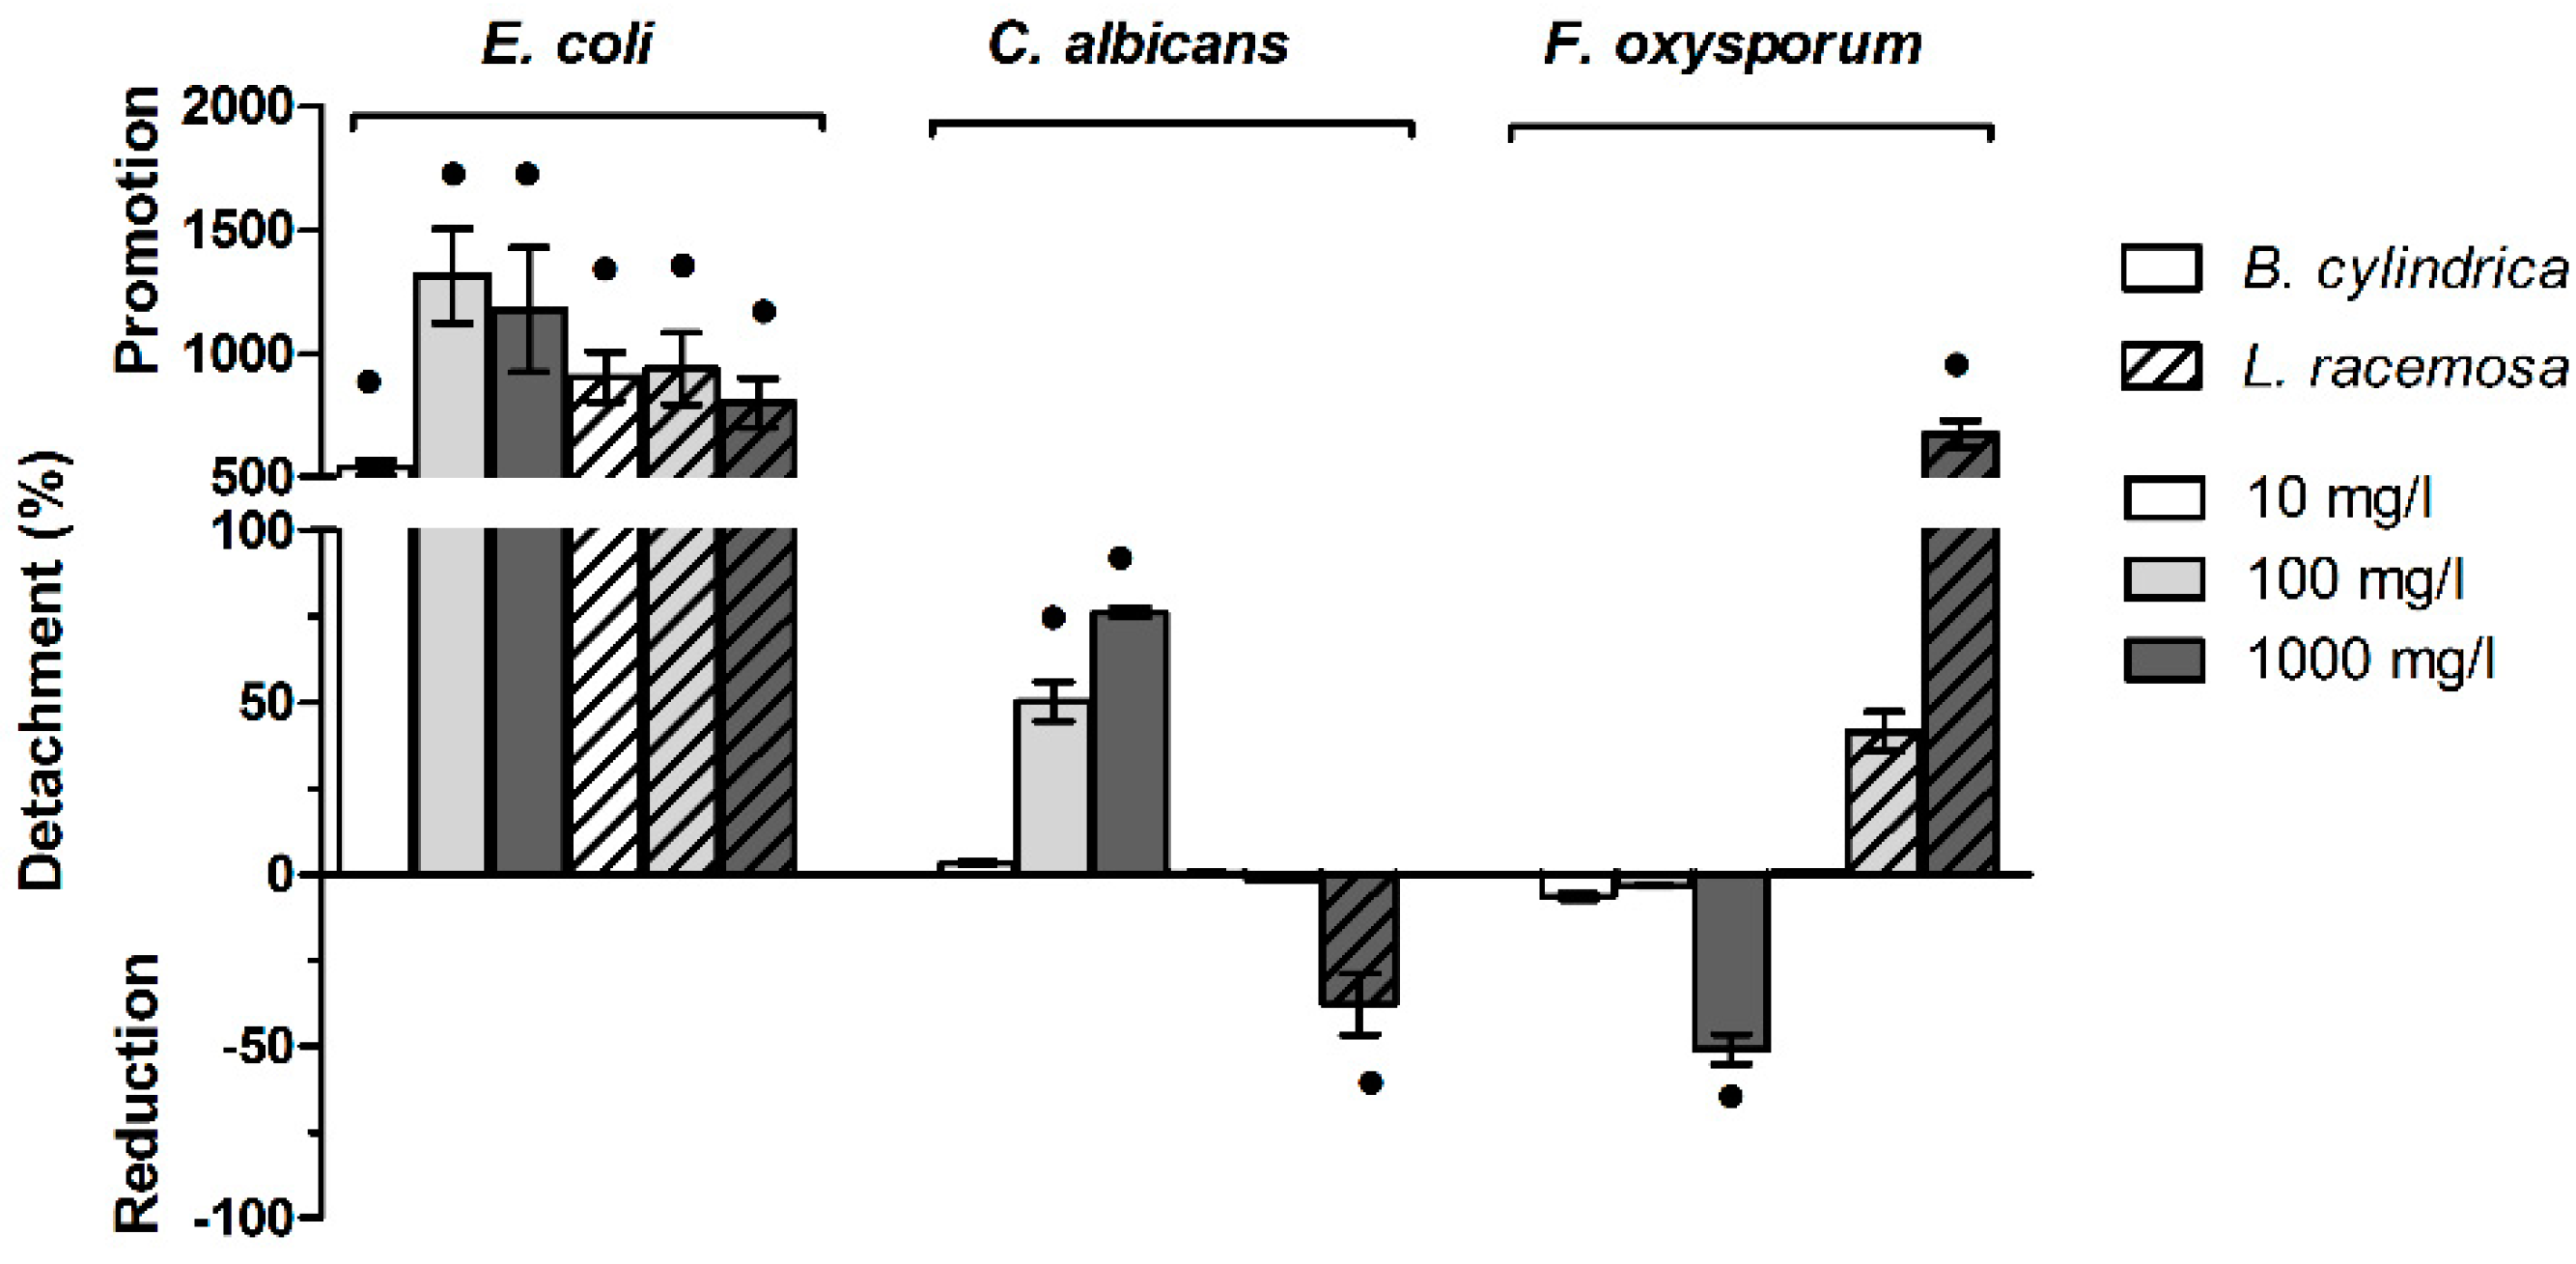
2.7. Mangrove Extract Modulate the Biofilm Detachment

Detachment indexes and the percentage differences with respect to negative controls prepared with 2% MetOH are reported in Figure 6 and Table S6.
When E. coli biofilm was pre-grown and subsequently treated with both B. cylindrica and L. racemosa extracts, the detachment index appeared to increase for all the concentrations tested. Indeed, a maximum increased was observed under the treatment with B. cylindrica and L. racemosa. As regards C. albicans biofilm, the treatment with B. cylindrica at 100 mg/L and 1000 mg/L increased the detachment index, whereas the same concentrations of L. racemosa did not (100 mg/L) or slightly (1000 mg/L) affected the biofilm detachment. An opposite trend was observed for F. oxisporum when treated with mangrove extracts at 1000 mg/L. B. cylindrica decreased the detachment index, whereas at the same concentration of L. racemosa increased the index.

3. Discussion

In this research, we have proved that sub-lethal concentrations of phytochemicals can either inhibit or enhance biofilm formation, and this behavior depends on the microbial taxon and biofilm formation step (Table 2). Thus, plant compounds are used as signaling molecules with regulatory functions [32].
To obtain a general impression of the phytochemical composition of the mangrove material, the total phenol and flavonoid contents as well as the oxygen radical absorbance capacity (ORAC) were analyzed. The crude methanolic leaf extract from L. racemosa contained significantly higher amounts of phenols and flavonoids. The ORAC values of both species showed no significant difference, which indicates the presence of antioxidant compounds in B. cylindrica that do not belong to the group of phenols. Indeed, B. cylindrica is known to contain numerous triterpenoids, which possess antioxidant capacities [33].
Most of the experiments were conducted with the extracts at 10 mg/L, 100 mg/L, and 1000 mg/L concentrations, as these values showed the highest activity on cells/conidia adhesion. In general, the L. racemosa extract had a significant bioactivity at lower concentrations than the B. cylindrica extract. Disk diffusion assays, planktonic growth experiments, and conidia germination assays were performed with the sole goal of proving that the possible effects on cells/conidia adhesion, biofilm maturation, and detachment were not a consequence of the lethal effect of mangrove extracts, but rather of a specific antibiofilm mechanism that is able to sabotage the propensity for a sessile lifestyle. Moreover, we have shown that at the concentrations tested, mangrove extracts were not a carbon and energy source. Thus, the promotion of microbial biofilm was not due to a supply of nutrients.
The effects of the mangrove extracts were observed on the three steps of the biofilm formation cycle. Adhesion has been reduced in all the models except for E. coli, where adhesion was promoted in the presence of the B. cylindrica extract. Glasenapp et al. reported an inhibitory activity of tannins extracted from L. racemosa against C. albicans cell adhesion [21]. The tannin casuarinin was also present in the crude extract used in this study, and was therefore likely important in the observed reduction of biofilm cell adhesion.
In the maturation phase, the mangrove extracts affected cellular biomass quantity in different ways according to the microbial model used. The amount of cellular biomass within the E. coli biofilm was not or was slightly affected with the two extracts. At the highest concentrations, C. albicans increased its biofilm biomass in the presence of B. cylindrica, and decreased biofilm biomass in presence of L. racemosa. F. oxysporum did not show changes in biofilm biomass in the presence of the B. cylindrica extract, but decreased when the L. racemosa was present. Among the phenolic compounds and flavonoids identified in the extracts of this study, delphinidin-3-pentoside and delphinidin-3glucoside have been already shown to have activity against mature Lactobacillus acidophilus biofilm [34]. Wu et al. [35] found that myricetin, which was also retrieved in mangrove extracts, disintegrated the complex architecture biofilm of S. aureus biofilm. Rocha et al. [36] found that the combination of myricetin plus farnesol significantly decreased water-soluble exopolysaccharides in a C. albicans biofilm that was 67 hours old.
Many works have claimed that sessile cells produce a biofilm with a highly ordered and complex matrix that gives the three-dimensional structure necessary for biofilm stability [37,38]. The C. albicans biofilm matrix mediates adhesive and cohesive interactions, and controls cell detachment from the biofilm [39]. Fusarium spp. assembles a self-secreted extracellular matrix (composed also by polysaccharides and proteins) that is fundamental to the biofilm lifestyle, protecting and changing the cell environment [40,41]. For the microorganisms considered in this research, the amount of polysaccharides was always higher than the quantity of proteins (approximately 3:1 in E. coli, 4:1 in C. albicans, and 20:1 in F. oxysporum). At the highest extract concentrations, an increase of the extracellular polymeric substances (EPS) amount—calculated as the sum of exopolysaccharides and extracellular proteins, which was used as a proxy of total EPS [42]—was recorded for all the models with the exception of C. albicans with the B. cylindrica extract, which showed no change. However, even if the total amount of EPS did not vary, in some cases, the ratio between exopolysaccharides and extracellular proteins changed in favor of an increased amount of polysaccharides. This happened to C. albicans and F. oxysporum when treated with the B. cylindrica and L. racemosa extracts at 10 mg/L, respectively. Changes in the structural composition of the biofilm could impact its development even if massive changes in the total amount of EPS are not observed. Indeed, it has been reported that the cohesive energy per unit volume of biofilm strongly correlates with both the polysaccharides concentration and the ratio of polysaccharides to proteins [42]. Polysaccharides were also reportedly involved in E. coli adhesion during the transition from planktonic to sessile growth [43].
Among the other extracellular polymeric substances, exopolysaccharides are often engaged in the oxidative stress response [44], as in the case of Azotobacter vinelandii [45], Campylobacter jejuni [46], or P. putida when exposed to oxidative stress [47]. In agreement with the current literature, in this study, the extracts and concentrations involved in the major production of both intracellular and extracellular ROS were always found coupled with a significant shift toward a major production of polysaccharides in the matrix. This effect was evident for all the microbial models, suggesting that exopolysaccharides production could be a common behavior among biofilms to provide tolerance toward environmental stressors. Indeed, in the E. coli and F. oxysporum biofilms, the trends of intracellular ROS fully overlapped those of extracellular polysaccharides/proteins ratios for all the concentrations of both extracts, whereas in C. albicans, this superimposition was evident only at the highest concentration tested. On the contrary, when a reduction of ROS was observed, i.e., in the C. albicans biofilm under exposure to B. cylindrica at 10 mg/L and 100 mg/L, no shift in the matrix composition was observed. Notably, beside the correlation between ROS and exopolysaccharides that is well known in bacterial biofilms, very few research studies have observed this response in yeast and filamentous fungal biofilms.
Detachment was generally promoted except for C. albicans when the L. racemosa was present, and for F. oxysporum with the B. cylindrica extract at 1000 mg/L. In both cases, the detachment observed was the result of a biofilm so thick, it was no longer sufficiently stable.
Over the last few decades, we have learned that microbial biofilms on leaves either positively affect the fitness of the plant and the yield of agricultural crops, or can be the cause of plant diseases [30,48]. Here, we have seen that both the inhibition and stimulation of biofilm steps was possible with the same leave extracts. So far, phytochemicals that promote beneficial biofilm development in the phyllosphere have been less investigated than those that discourage the sessile lifestyle of deleterious microorganisms [49,50,51]. In contrast, it is well known that the plant stimulates the production of beneficial rhizobacterial biofilms on roots through a chemotaxis-mediated response mechanism involving the production of root exudates [52]. Not all microorganisms that come into contact with the phyllosphere are able to colonize the surface and grow. Indeed, a sophisticated machinery allows plants to set up an intimate interaction with microorganisms, providing selective advantage only to specific beneficial microorganisms over the detrimental ones [51]. Among others, attracting mechanisms include the release of a broad range of molecules from leaves, such as phenolic compounds [48,53,54]. For decades, the production of phenolic compounds by leaves has been only associated with plant defense against pathogenic microorganisms [53]. However, notably, these molecules can be either more suitable as a carbon source or produced as signals to recruit only specific taxa and modulate cell genetic and biochemical activities [48,49,55].

4. Materials and Methods

4.1. Plant Material and Extraction

L. racemosa (L.) C.F. Gaertn. and B. cylindrica (L.) Blume were grown in the greenhouse of the Institute of Botany, Germany, so that fresh plant material has been always available during this research [21]. The leaves of adult plants were collected in February 2016, directly frozen in liquid nitrogen, and ground to a fine powder. The plant material was extracted with 20 mL of MetOH per 1 g of fresh leaf material. The first extraction step was conducted for 1 h at room temperature (RT) with constant stirring. Afterwards, the extract was filtered (Macherey-Nagel, Düren, Germany) into a round-bottom flask. This step was repeated two times, the first with one-hour duration and the second overnight. The extraction solvent was evaporated in a rotary evaporator (Büchi, Flawil, Switzerland) with 60 °C water bath temperature. The dried extract was re-dissolved in 100% MetOH and filled in reaction tubes, which were subsequently evaporated in a speedvac (Eppendorf, Hamburg, Germany). The reaction tubes were weighed empty and with the dried extract to measure the resulting extract mass. Finally, the extract was dissolved in MetOH to the desired concentration.

4.2. Total Flavonoid Content (TFC)

To analyze the total flavonoid content in the extracts from L. racemosa and B. cylindrica, dilutions of 1 mg/mL were prepared in 80% MetOH. The method used was based on a protocol from Dudonné et al. [56]. In a clear 96-well plate, each well was filled with 150 µL of water. Next, 25 µL of either the extract sample or catechin hydrate standard were added, with five replicates for the extracts and three replicates for the standard. The catechin hydrate calibration standards had the following concentrations: 0 µg/mL, 10 µg/mL, 25 µg/mL, 50 µg/mL, 100 µg/mL, 125 µg/mL, 250 µg/mL, and 400 µg/mL in 80% MetOH. After the addition of 10 µL of NaNO2 (3.75%), the plate was incubated at RT for 6 min. Next, 15 µL of AlCl3 (10%) was added and incubated for 5 min at RT. In the last step, 50 µL of NaOH (1 M) was added, and the absorption was measured at 510 nm in a microplate reader (Biotek, Winooski, VT, USA). The concentration of the TFC was calculated with the catechin hydrate calibration curve.

4.3. Total Phenol Content (TPC)

Dilutions of 1 mg/mL in 80% MetOH of the L. racemosa and B. cylindrica extracts were used to measure the total phenol content. The protocol was modified based on Dewanto et al. [57]. In each well of a clear 96-well plate, 100 µL water were filled. To the sample and a gallic acid calibration standard, 10 µL was added into the wells, with five replicates for the extracts and three replicates for the standard. The gallic acid calibration standards were used in the following concentrations: 0 µg/mL, 5 µg/mL, 10 µg/mL, 25 µg/mL, 50 µg/mL, 75 µg/mL, 100 µg/mL, 125 µg/mL, and 250 µg/mL in 80% MetOH. First, 10 µL of Folin reagent was added to each well and incubated for 8 min at RT in the dark. In the second step, 100 µL of Na2CO3 (7%) was added, and the plate was incubated for 100 min in the dark. Finally, the absorption was measured at 765 nm in a microplate reader (Biotek, Winooski, VT, USA). The gallic acid calibration curve was used to calculate the concentration of total phenols.

4.4. Oxygen Radical Absorbance Capacity (ORAC)

The ORAC value was measured with diluted mangrove extracts with a concentration of 0.0125 mg/mL in phosphate buffer (75 mM, pH 7.4). This method is based on the protocol described by Huang et al. [58] and Gillespie et al. [59]. In a black 96-well microtiter plate, 120 µL of fluorescein (112 nM) were mixed with 20 µL of mangrove extract or 6-hydroxy-2,5,7,8-tetramethylchroman-2-carboxylic acid (trolox) standard. The extract samples and the trolox standard were analyzed in triplicate. The following concentrations of the trolox calibration standard curve were prepared in phosphate buffer: 6.25 µM, 12.5 µM, 25 µM, and 50 µM. Then, the plate was incubated for 15 min at 37 °C, and after the incubation time, the fluorescence was measured at 485/520 nm as time point zero. In the next step, 80 µL of 2,2′-azobis(2-amidino-propane) dihydrochloride (62 mM) was added to each well, and the fluorescent signal was measured over 80 min at 485/520 nm. The ORAC value was calculated using the trolox calibration curve with the difference between the signal at time point zero and 80 min.

4.5. LC-MS Analysis

For LC-MS analysis, an HPLC (Shimadzu, Darmstadt, Germany) coupled to a triple TOF mass spectrometer (AB Sciex, Canby, USA) was used. Water (A) and methanol (B) supplemented with 2 mM of ammonium acetate and 0.01% acetic acid were used as solvents. The flow rate was 0.8 mL/min, and a gradient was applied with 10% to 90% B over 35 min, two min of 90% B, and switching to 10% B in one min, followed by two min of 10% B. The column oven temperature was 30 °C, and 10 µL of the sample was injected into a Knauer Vertex Plus column (250 × 4 mm, 5 µm particle size, packing material ProntoSIL 120-5 C18-H) with precolumn (Knauer, Berlin, Germany). The ion source was set to negative electrospray ionization mode (ESI–) and mass spectra were recorded between 100–1000 Da. MS/MS spectra were measured at a collision energy of −30 eV between 50–800 Da. Precursor masses and MS/MS peaks were compared to database entries in MassBank [60] and ReSpect [61] for identification.

4.6. Microbial Strains and Growth Media

E. coli ATCC 25404, C. albicans ATCC MYA-2876, and F. oxysporum D221 (from the collection of the Department of Food, Environmental, and Nutritional Sciences, Università degli Studi di Milano collection) were used as model systems for the bacterial, yeast, and filamentous fungal biofilms, respectively. E. coli was chosen, being a K-12 cosmopolitan strain [62]; C. albicans is a widespread polymorphic yeast fungus responsible of important human infections [63], whereas F. oxysporum is in the top 10 fungal plant pathogen list, which is accountable for serious crop losses around the world [64].
The strains (conidia for F. oxysporum) were stored at −80 °C in suspensions containing 20% glycerol and 2% peptone.
E. coli was grown in tryptic soy broth (TSB, Sigma Aldrich, USA) at 30 °C for 24 h, C. albicans was grown in yeast nitrogen base broth supplemented with 50 mM of glucose (YNBg, Sigma Aldrich, USA) at 30 °C for 24 h, and F. oxysporum was grown on potato dextrose agar (PDA, Sigma Aldrich, USA) at 21 °C for 7 days. After being routinely grown, E. coli and C. albicans cells were washed three times in PBS (Sigma Aldrich, St. Louis, MO, USA) and used in the subsequent experiments. F. oxysporum conidia were collected by suspending them in PBS and filtering using a double-layered sterile gauze. A light microscope (Leica DM4000 M, Leica Microsystems, Wetzlar, Germany) and a Thoma counting chamber have been used to quantify E. coli cells, C. albicans cells, and F. oxysporum conidia concentration.
The pH of each medium added with each extract was evaluated employing a Jenway 3510 pH meter (pH 7.5).

4.7. Mangrove Extract Toxicity

4.7.1. Biocidal Activity

The disk diffusion assay has been used to evaluate the biocidal activity of mangrove extracts [65]. First, 200 µL of a suspension of 106 E. coli cells, C. albicans cells, or F. oxysporum conidia were spread uniformly on Petri plates (80 mm diameter) filled with tryptic soy agar (TSA, Sigma Aldrich, USA) for E. coli, YNBg agar medium for C. albicans and PDA for F. oxysporum. Filter-paper discs (6-mm diameter, Oxoid, United Kingdom) were soaked with 0.001 mg/L, 0.01 mg/L, 0.1 mg/L, 1 mg/L, 10 mg/L, 100 mg/L, and 1000 mg/L of both extracts with 2% MetOH. Then, the discs were put in the center of the Petri dishes. Negative controls were obtained by loading filter paper discs with 20 µL of PBS or 2% MetOH instead of each extract, whereas positive controls were performed by loading filter paper discs with 20 µL of chloramphenicol (30 µg/mL in water, Sigma Aldrich, USA), sodium hypochlorite (5% in water, Sigma Aldrich, USA), or Procloraz (0.01% in water, Sportak, BASF, Germany) for E. coli, C. albicans, and F. oxysporum, respectively. E. coli and C. albicans were incubated at 30 °C for 24 h, whereas F. oxysporum was incubated 21 °C for 7 days. In case the extracts inhibited microbial growth, a halo was present around the disks [65].

4.7.2. Modulation of Planktonic Growth

E. coli and C. albicans planktonic growth assays were carried out according to Cattò et al. [66]. Briefly, 106 cells/mL of E. coli and C. albicans were grown respectively in TSB or YNBg medium supplemented with 0.001 mg/L, 0.01 mg/L, 0.1 mg/L, 1 mg/L, 10 mg/L, 100 mg/L, and 1000 mg/L of both extracts with 2% MetOH in 96-well microtiter plates at 30 °C. Negative controls were prepared by growing microbial strains in TSB or YNBg medium supplemented with PBS or 2% MetOH. Microbial growths were obtained by measuring the absorbance at 600 nm (A600) every 15 min for over 24 h using the Infinite 200 PRO Microplate Reader (Tecan, Männedorf, Switzerland). Absorbance-based growth kinetics were obtained considering the A600 of suspensions minus the A600 of the non-inoculated medium as a function of time.
F. oxysporum planktonic growth was assessed by measuring the colony radial growth. Briefly, 6-mm diameter discs were cut from the peripheral region of a 7-day-old F. oxysporum culture and transferred to other plates prepared with PDA added with 0.001 mg/L, 0.01 mg/L, 0.1 mg/L, 1 mg/L, 10 mg/L, 100 mg/L, and 1000 mg/L of both extracts supplemented with 2% MetOH. Negative controls were prepared by growing fungal strain in PDA supplemented with PBS or 2% MetOH. Growth was recorded by measuring the radius of colonies in four directions every 24 h for 9 days. Growth kinetic curves were constructed by plotting the average values of the radius against the time.
The polynomial Gompertz model adapted for microbial growth by Zwietering [67] was used to fit the growth curves, and the λ, the μm, and the YM were determined employing the GraphPad Prism software (version 5.0, San Diego, CA, USA). Three biological replicates were performed for each treatment, and four technical replicates were carried out for each experiment.

4.7.3. Effect on Conidia Germination

The ability of mangrove extracts to modulate the germination of F. oxysporum conidia was tested by plating 30 µL of 106/mL conidia on PDA with the addition of 0.001 mg/L, 0.01 mg/L, 0.1 mg/L, 1 mg/L, 10 mg/L, 100 mg/L, and 1000 mg/L of each extract and 2% MetOH. Negative controls were prepared by plating conidia in PDA with the addition of only PBS and 2% MetOH. After 21 h of incubation at 21 °C, the germinated conidia percentage was determined by direct microscope counting (10 random view fields for each replicate).

4.8. Mangrove Extracts as Carbon and Energy Source

The ability of E. coli and C. albicans to grow with mangrove extract as the sole energy and carbon source was evaluated according to Cattò et al. [68]. Briefly, 106 cells/mL were grown in a mineral medium (KH2PO4 30 g/L, Na2HPO4 70 g/L, NH4Cl 10 g/L) prepared with the addition of 1000 mg/L of each extract and 2% MetOH. The incubation was carried out at 30 °C for 48 h. Then, the A600 was estimated by a UV/VIS 7315 spectrophotometer (Jenway, Essex, UK) and compared with controls. The positive controls were prepared by growing microbial strains in the mineral medium supplemented with 30 g/L of sucrose, whereas the negative controls were prepared by growing them in the mineral medium supplemented with PBS or 2% MetOH.
The ability of F. oxysporum to grow with the mangrove extracts as a unique carbon source was investigated by inoculating 200 µL of 106/mL conidia on Petri dishes filled with a mineral medium agar (3 g/L of NaNO3, 1 g/L of K2HPO4, 0.5 g/L of MgSO4x7H2O, 0.5 g/L of KCl, and 0.01 g/L of FeSO4·7H2O) with the addition of 1000 mg/L of each extract and 2% MetOH as the unique energy and carbon source, respectively. Negative controls were also prepared with the addition of only PBS or 2% MetOH, whereas positive controls were performed with the addition of 30 g/L sucrose. Fungi were incubated at 21 °C for 7 days. The fungal growth was investigated by comparison with controls.
Mangrove extracts were the only possible source of energy and carbon available for the microbial strains. Therefore, microbial growth was possible only in case microorganisms were able to use the added extract as energy and carbon source.

4.9. Mangrove Effect on Cells/Conidia Adhesion

E. coli and C. albicans cells or F. oxysporum conidia adhesion was evaluated in hydrophobic black-sided plates. Briefly, 200 μL of PBS containing 106 cells or conidia with the addition of 0.001 mg/L, 0.01 mg/L, 0.1 mg/L, 1 mg/L, 10 mg/L, 100 mg/L, and 1000 mg/L of each extract and 2% MetOH were placed in microtiter plate wells and incubated at 30 °C (E. coli and C. albicans) or 21 °C (F. oxysporum). Experiments were also carried out with PBS and 2% MetOH as negative controls. The incubation lasted 24 h. Then, the wells were washed twice with 200 μL of PBS, and adhered cells or conidia were stained with either 4′,6-diamidino-2-phenylindole (E. coli) (Sigma Aldrich, USA) [68] or Fluorescent Brightener 28 (C. albicans and F. oxysporum) (Sigma Aldrich, USA) [69] for 20 min in the dark at room temperature. The Infinite 200 PRO Microplate Reader (Tecan, Männedorf, Switzerland) was employed to measure the fluorescence intensity under a 335-nm excitation wavelength and a 433-nm emission wavelength. The number of adhered cells or conidia was calculated using a standard curve of fluorescence intensity. After data normalization to the area, the means were reported. Three biological replicates were performed for each treatment, and at least eight technical replicates were performed for each experiment. Only the best anti-adhesion sub-lethal concentrations were used in the subsequent experiments to further study the mangrove effect on biofilm maturation.

4.10. Mangrove Effect on Biofilm Maturation

4.10.1. Biofilm Culture

Two hundred µL of 106 E. coli cells, C. albicans cells, or F. oxysporum conidia were inoculated in Petri dishes (35-mm diameter) containing 2 mL of 10% diluted TBS for E. coli, 10% diluted YNBg for C. albicans, and 10% diluted potato dextrose broth (PDB) for F. oxysporum with the addition of 10 mg/L, 100 mg/L, and 1000 mg/L of each extract and 2% MetOH. Negative controls were performed by growing biofilms with only PBS or 2% MetOH. Petri dishes containing E. coli and C. albicans were incubated at 30 °C for 48 h, whereas those containing F. oxysporum were placed at 21 °C for 7 days, allowing mature biofilm development. The media were replaced every 48 h to avoid any change in the experimental conditions, and consequently of the biofilm growth rate due to nutrient deficiency and the build-up of metabolic products [70].

4.10.2. Biomass and EPS Extraction

After incubation, the media were displaced from the Petri dishes, and the biofilm was resuspended in 1 mL of 2% ethylenediaminetetraacetic acid (EDTA) and transferred into new tubes. To avoid aggregates, biofilm suspensions were homogenized by a 30-s cycle at 14,500 rpm (T 10 basic Ultra-Turrax) and sonicated for 15 s (15% amplitude, in water-bath; Branson 3510, Branson Ultrasonic Corporation, Dunburry, CT) and 30 s of vortex mixing. EPS was extracted from biofilm suspensions after an overnight incubation at 4 °C with gentle shaking (300 rpm). Then, biofilm suspensions were centrifuged (11,000× g) for 30 min at 4 °C. The EPS-containing supernatants were filtered using a 0.2-µm filter, while the pellets were used in further experiments (see Section 4.10.3 and Section 4.10.5).

4.10.3. Biomass Abundance

Cellular biomass was indirectly estimated by quantifying cellular proteins under the assumption that their content is similar between cells [71].
EDTA traces were removed, washing the pellets with distilled water twice. Then, cells were resuspended in 1 mL of PBS. Samples were transferred in screw-cap 2-mL vials containing approximately 100 μL of glass beads (diameter <106 μm and between 425–600 μm, Sigma Aldrich, USA). Cells were subjected to a mechanical disruption using a Precellys bead beater (Bertin Instrument, Montigny-le-Bretonneux, France) performing six cycles of 30 s at 6500 rpm, with a 30-s period of cooling between cycles. Then, each sample was centrifuged (11,000× g) for 30 min at 4 °C. The supernatants were recovered, and the proteins that were released from the broken cells were quantified by the Bradford assay [72] using bovine serum albumin as standard. After data normalization to the area, the means were reported.

4.10.4. Extracellular Polymeric Substances (EPS) Composition

The phenol–sulfuric acid assay was applied for polysaccharides evaluation using glucose as the standard [73], whereas the Bradford method [72] was applied to analyze the protein concentrations in the filtered soluble EPS. Absorbance was determined using a UV/VIS 7315 spectrophotometer (Jenway, Essex, UK). After data normalization to the area, the polysaccharides and proteins abundance and their sums and ratios were reported [42].

4.10.5. Level of Intracellular and Extracellular Oxidative Stress

The 2′,7′-dichlorodihydrofluorescein diacetate (H2DCFDA) assay was used to determine the oxidative stress level within the cellular biomass and the EPS component [74]. Briefly, 300 µL of each sample was incubated at 30 °C with 5 mM of H2DCFDA (final concentration of 10 µM). After 30 min, fluorescence was assessed using the Infinite 200 PRO Microplate Reader (Tecan, Männedorf, Switzerland) with excitation at 488 nm and emission at 520 nm. Obtained data were normalized to the amount of proteins, and the means are reported.

4.11. Mangrove Effect on Biofilm Dispersion

Mature biofilms were grown as reported in Section 4.10.1 in the absence of mangrove extract. After being grown, the media were removed, and the biofilms were treated with 1 mL of PBS containing 10 mg/L, 100 mg/L, and 1000 mg/L of each extract and 2% MetOH. Biofilms were also treated with only PBS or 2% MetOH for negative controls. After 3 h at room temperature, biofilms were dispersed in the bulk, and those that remained on the surface were recovered, and the biomass was indirectly estimated by protein quantification, as reported in Section 4.10.3. The biofilm tendency to surface detachment was calculated as (proteins from biofilm dispersed in the bulk × 100)/(proteins from biofilm dispersed in the bulk + proteins from biofilm remained on the surface) [75], and means were reported.

4.12. Statistical Analysis

If not specified otherwise, three biological replicates for each treatment and three technical replicates were carried out for each experiment, and the data were reported as mean ± standard deviation.
The percentage variation of cells/conidia adhesion, cellular biomass abundance, extracellular proteins and polysaccharides, and detachment index in comparison to the negative control prepared with 2% MetOH was calculated as (treated sample data − negative control data) × 100/negative control data. With respect to the negative control, mangrove extract concentrations that were able to affect the above biofilm parameters by less than 20% were considered without activity, and with low, moderate, and excellent activity in the ranges of 20% to 30%, 30% to 50%, and >50%, respectively [68].
First, we verified that the data satisfied the assumptions of (i) independence, (ii) normal distribution, and iii) homogeneity of variance. Then, using MATLAB (Version 7.0, The MathWorks Inc., Natick, MA, USA), the analysis of variance (ANOVA) was applied to statistically evaluate significant differences among the samples. Tukey’s honestly significant different test (HSD) was used for pairwise comparison to determine the significance of the data (p < 0.05).

5. Conclusions

In this work, we proved that each new compound or extract needs to be investigated, taking into account the multiple steps of biofilm formation, in order to assess its real behavior in the environment. Consequently, this study adds another layer of complexity to the mode of action of plant extracts, supporting that it is not sufficient information that some of the literature on a specific extract shows its antibiofilm activity or biofilm promotion. Instead, the phytochemical effects have to be proved on the target microorganism in all three phases of biofilm development.
The behavior of different extracts on the microbial taxon could be positively exploited in those fields where it is necessary at the same time to reduce some microbial strains and improve the development of others.

Supplementary Materials

Supplementary materials can be found at https://www.mdpi.com/1422-0067/20/14/3549/s1.

Author Contributions

All authors conceptualization; Y.G. and C.C. methodology, formal analysis, data curation, writing—original draft preparation; F.V. and M.S. data curation, writing—review and editing; F.C. and J.P. supervision, writing—review and editing, funding acquisition.

Funding

This research was funded by MIUR-DAAD Joint Mobility Program, German-Italian bilateral project “Bioactive secondary compounds from halophyte species inhibit biofilm formation of plant-pathogenic microorganisms on plant surfaces” (SAB-HAL), grant number 57265315. The publication of this article was funded by the Open Access Fund of the Leibniz Universität Hannover.

Conflicts of Interest

The authors declare no conflict of interest.

References

  1. Galie, S.; Garcia-Gutierrez, C.; Miguelez, E.M.; Villar, C.J.; Lombo, F. Biofilms in the food industry: Health aspects and control methods. Front. Microbiol. 2018, 9, 898. [Google Scholar] [CrossRef] [PubMed]
  2. Chan, S.; Pullerits, K.; Keucken, A.; Perssonz, K.M.; Paul, C.J.; Radstrom, P. Bacterial release from pipe biofilm in a full-scale drinking water distribution system. NPJ Biofilms Microbiomes 2019, 5, 9. [Google Scholar] [CrossRef] [PubMed]
  3. Di Pippo, F.; Di Gregorio, L.; Congestri, R.; Tandoi, V.; Rossetti, S. Biofilm growth and control in cooling water industrial systems. FEMS Microbiol. Ecol. 2018, 94, fiy044. [Google Scholar] [CrossRef] [PubMed]
  4. Jindal, S.; Anand, S.; Metzger, L.; Amamcharla, J. Short communication: A comparison of biofilm development on stainless steel and modified-surface plate heat exchangers during a 17-h milk pasteurization run. J. Dairy Sci. 2018, 101, 2921–2926. [Google Scholar] [CrossRef] [PubMed] [Green Version]
  5. Khouzani, M.K.; Bahrami, A.; Hosseini-Abari, A.; Khandouzi, M.; Taheri, P. Microbiologically influenced corrosion of a pipeline in a petrochemical plant. Metals 2019, 9, 459. [Google Scholar] [CrossRef]
  6. Percival, S.L.; Suleman, L.; Vuotto, C.; Donelli, G. Healthcare-associated infections, medical devices and biofilms: Risk, tolerance and control. J. Med. Microbiol. 2015, 64, 323–334. [Google Scholar] [CrossRef] [PubMed]
  7. Karn, S.K.; Duan, J.; Jenkinson, I.R. Book review: Role of biofilms in bioremediation. Front. Environ. Sci. 2017, 5, 22. [Google Scholar] [CrossRef]
  8. Turki, Y.; Mehri, I.; Lajnef, R.; Ben Rejab, A.; Khessairi, A.; Cherif, H.; Ouzari, H.; Hassen, A. Biofilms in bioremediation and wastewater treatment: Characterization of bacterial community structure and diversity during seasons in municipal wastewater treatment process. Environ. Sci. Pollut. Res. 2017, 24, 3519–3530. [Google Scholar] [CrossRef] [PubMed]
  9. Morikawa, M. Beneficial biofilm formation by industrial bacteria Bacillus subtilis and related species. J. Biosci. Bioeng. 2006, 101, 1–8. [Google Scholar] [CrossRef]
  10. Angelaalincy, M.J.; Krishnaraj, R.N.; Shakambari, G.; Ashokkumar, B.; Kathiresan, S.; Varalakshmi, P. Biofilm engineering approaches for improving the performance of microbial fuel cells and bioelectrochemical systems. Front. Energy Res. 2018, 6, 63. [Google Scholar] [CrossRef]
  11. Van Duijkeren, E.; Schink, A.K.; Roberts, M.C.; Wang, Y.; Schwarz, S. Mechanisms of bacterial resistance to antimicrobial agents. Microbiol. Spectr. 2018, 6. [Google Scholar] [CrossRef] [PubMed]
  12. Ventola, C.L. The antibiotic resistance crisis: Part 1: Causes and threats. Pharm. Ther. 2015, 40, 277–283. [Google Scholar]
  13. Peterson, E.; Kaur, P. Antibiotic resistance mechanisms in bacteria: Relationships between resistance determinants of antibiotic producers, environmental bacteria, and clinical pathogens. Front. Microbiol. 2018, 9, 2928. [Google Scholar] [CrossRef] [PubMed]
  14. Cornejo, J.A.; Lopez, C.; Babanova, S.; Santoro, C.; Artyushkoya, K.; Ista, L.; Schuler, A.J.; Atanassov, P. Surface modification for enhanced biofilm formation and electron transport in shewanella anodes. J. Electrochem. Soc. 2015, 162, H597–H603. [Google Scholar] [CrossRef]
  15. Newman, D.J.; Cragg, G.M. Natural products as sources of new drugs from 1981 to 2014. J. Nat. Prod. 2016, 79, 629–661. [Google Scholar] [CrossRef]
  16. Polo, A.; Foladori, P.; Ponti, B.; Bettinetti, R.; Gambino, M.; Villa, F.; Cappitelli, F. Evaluation of zosteric acid for mitigating biofilm formation of pseudomonas putida isolated from a membrane bioreactor system. Int. J. Mol. Sci. 2014, 15, 9497–9518. [Google Scholar] [CrossRef] [PubMed]
  17. Adnan, M.; Alshammari, E.; Patel, M.; Ashraf, S.A.; Khan, S.; Hadi, S. Significance and potential of marine microbial natural bioactive compounds against biofilms/biofouling: Necessity for green chemistry. PeerJ 2018, 6, e5049. [Google Scholar] [CrossRef]
  18. Bandaranayake, W.M. Bioactivities, bioactive compounds and chemical constituents of mangrove plants. Wetl. Ecol. Manag. 2002, 10, 421–452. [Google Scholar] [CrossRef]
  19. Rastegar, S.; Gozari, M. Effect of mangrove plant extract on growth of four fungal pathogens. J. Paramed. Sci. 2017, 8, 2008–4978. [Google Scholar] [CrossRef]
  20. Boik, J.; Kirakosyan, A.; Kaufman, P.B.; Mitchell Seymour, E.; Spelman, K. Interactions of bioactive plant metabolites: Synergism, antagonism, and additivity. In Recent Advances in Plant Biotechnology; Kirakosyan, A., Kaufman, P.B., Eds.; Springer: Boston, MA, USA, 2009; pp. 213–230. [Google Scholar]
  21. Glasenapp, Y.; Korth, I.; Nguyen, X.V.; Papenbrock, J. Sustainable use of mangroves as sources of valuable medicinal compounds: Species identification, propagation and secondary metabolite composition. S. Afr. J. Bot. 2019, 121, 317–328. [Google Scholar] [CrossRef]
  22. Rodriguez-Garcia, C.M.; Ruiz-Ruiz, J.C.; Peraza-Echeverria, L.; Peraza-Sanchez, S.R.; Torres-Tapia, L.W.; Perez-Brito, D.; Tapia-Tussell, R.; Herrera-Chale, F.G.; Segura-Campos, M.R.; Quijano-Ramayo, A.; et al. Antioxidant, antihypertensive, anti-hyperglycemic, and antimicrobial activity of aqueous extracts from twelve native plants of the Yucatan coast. PLoS ONE 2019, 14, e0213493. [Google Scholar] [CrossRef] [PubMed]
  23. Lin, M.H.; Chang, F.R.; Hua, M.Y.; Wu, Y.C.; Liu, S.T. Inhibitory effects of 1,2,3,4,6-Penta-O-Galloyl-beta-D-Glucopyranose on biofilm formation by Staphylococcus aureus. Antimicrob. Agents Chemother. 2011, 55, 1021–1027. [Google Scholar] [CrossRef]
  24. Das, M.C.; Sandhu, P.; Gupta, P.; Rudrapaul, P.; De, U.C.; Tribedi, P.; Akhter, Y.; Bhattacharjee, S. Attenuation of Pseudomonas aeruginosa biofilm formation by vitexin: A combinatorial study with azithromycin and gentamicin. Sci. Rep. 2016, 6, 23347. [Google Scholar] [CrossRef] [PubMed]
  25. Lopes, L.A.A.; Rodrigues, J.B.D.; Magnani, M.; de Souza, E.L.; de Siqueira, J.P. Inhibitory effects of flavonoids on biofilm formation by Staphylococcus aureus that overexpresses efflux protein genes. Microb. Pathog. 2017, 107, 193–197. [Google Scholar] [CrossRef]
  26. Arita-Morioka, K.; Yamanaka, K.; Mizunoe, Y.; Tanaka, Y.; Ogura, T.; Sugimoto, S. Inhibitory effects of myricetin derivatives on curli-dependent biofilm formation in Escherichia coli. Sci. Rep. 2018, 8, 8452. [Google Scholar] [CrossRef] [PubMed]
  27. Pejin, B.; Ciric, A.; Markovic, J.D.; Glamoclija, J.; Nikolic, M.; Sokovic, M. An insight into anti-biofilm and anti-quorum sensing activities of the selected anthocyanidins: The case study of Pseudomonas aeruginosa PAO1. Nat. Prod. Res. 2017, 31, 1177–1180. [Google Scholar] [CrossRef]
  28. Wu, C.Y.; Su, T.Y.; Wang, M.Y.; Yang, S.F.; Mar, K.; Hung, S.L. Inhibitory effects of tea catechin epigallocatechin-3-gallate against biofilms formed from Streptococcus mutans and a probiotic lactobacillus strain. Arch. Oral Biol. 2018, 94, 69–77. [Google Scholar] [CrossRef] [PubMed]
  29. De Vita, D.; Friggeri, L.; D’Auria, F.D.; Pandolfi, F.; Piccoli, F.; Panella, S.; Palamara, A.T.; Simonetti, G.; Scipione, L.; Santo, R.; et al. Activity of caffeic acid derivatives against Candida albicans biofilm. Bioorg. Med. Chem. Lett. 2014, 24, 1502–1505. [Google Scholar] [CrossRef] [PubMed]
  30. Lindow, S.E.; Brandl, M.T. Microbiology of the phyllosphere. Appl. Environ. Microbiol. 2003, 69, 1875–1883. [Google Scholar] [CrossRef]
  31. Harding, M.W.; Marques, L.L.R.; Howard, R.J.; Olson, M.E. Can filamentous fungi form biofilms? Trends Microbiol. 2009, 17, 475–480. [Google Scholar] [CrossRef]
  32. Borges, A.; Abreu, A.C.; Dias, C.; Saavedra, M.J.; Borges, F.; Simoes, M. New perspectives on the use of phytochemicals as an emergent strategy to control bacterial infections including biofilms. Molecules 2016, 21, 877. [Google Scholar] [CrossRef]
  33. Nebula, M.; Harisankar, H.S.; Chandramohanakumar, N. Metabolites and bioactivities of Rhizophoraceae mangroves. Nat. Prod. Bioprospect. 2013, 3, 207–232. [Google Scholar] [CrossRef] [Green Version]
  34. Lazarini, J.G.; Sardi, J.D.O.; Franchin, M.; Nani, B.D.; Freires, I.A.; Infante, J.; Paschoal, J.A.R.; de Alencar, S.M.; Rosalen, P.L. Bioprospection of Eugenia brasiliensis, a Brazilian native fruit, as a source of anti-inflammatory and antibiofilm compounds. Biomed. Pharmacother. 2018, 102, 132–139. [Google Scholar] [CrossRef]
  35. Wu, Y.P.; Bai, J.R.; Grosu, E.; Zhong, K.; Liu, L.J.; Tang, M.M.; Huang, Y.N.; Gao, H. Inhibitory effect of 2r,3r-dihydromyricetin on biofilm formation by Staphylococcus aureus. Foodborne Pathog. Dis. 2018, 15, 475–480. [Google Scholar] [CrossRef]
  36. Rocha, G.R.; Salamanca, E.J.F.; de Barros, A.L.; Lobo, C.I.V.; Klein, M.I. Effect of tt-farnesol and myricetin on in vitro biofilm formed by Streptococcus mutans and Candida albicans. BMC Complement Altern. Med. 2018, 18, 61. [Google Scholar] [CrossRef]
  37. Hung, C.; Zhou, Y.Z.; Pinkner, J.S.; Dodson, K.W.; Crowley, J.R.; Heuser, J.; Chapman, M.R.; Hadjifrangiskou, M.; Henderson, J.P.; Hultgren, S.J. Escherichia coli biofilms have an organized and complex extracellular matrix structure. MBio 2013, 4, e00645-13. [Google Scholar] [CrossRef]
  38. Yang, G.Q.; Lin, J.; Zeng, E.Y.; Zhuang, L. Extraction and characterization of stratified extracellular polymeric substances in Geobacter biofilms. Bioresour. Technol. 2019, 276, 119–126. [Google Scholar] [CrossRef]
  39. Pierce, C.G.; Vila, T.; Romo, J.A.; Montelongo-Jauregui, D.; Wall, G.; Ramasubramanian, A.; Lopez-Ribot, J.L. The Candida albicans biofilm matrix: Composition, structure and function. J. Fungi 2017, 3, 14. [Google Scholar] [CrossRef]
  40. Reichhardt, C.; Joubert, L.M.; Clemons, K.V.; Stevens, D.A.; Cegelski, L. Integration of electron microscopy and solid-state NMR analysis for new views and compositional parameters of Aspergillus fumigatus biofilms. Med. Mycol. 2019, 57, S239–S244. [Google Scholar] [CrossRef]
  41. Calvillo-Medina, R.P.; Reyes-Grajeda, J.P.; Barba-Escoto, L.; Bautista-Hernandez, L.A.; Campos-Guillen, J.; Jones, G.H.; Bautist-de Lucio, V.M. Proteome analysis of biofilm produced by a Fusarium falciforme keratitis infectious agent. Microb. Pathog. 2019, 130, 232–241. [Google Scholar] [CrossRef]
  42. Ahimou, F.; Semmens, M.J.; Haugstad, G.; Novak, P.J. Effect of protein, polysaccharide, and oxygen concentration profiles on biofilm cohesiveness. Appl. Environ. Microbiol. 2007, 73, 2905–2910. [Google Scholar] [CrossRef] [PubMed]
  43. Danese, P.N.; Pratt, L.A.; Kolter, R. Exopolysaccharide production is required for development of Escherichia coli K-12 biofilm architecture. J. Bacteriol. 2000, 182, 3593–3596. [Google Scholar] [CrossRef] [PubMed]
  44. Gambino, M.; Cappitelli, F. Mini-review: Biofilm responses to oxidative stress. Biofouling 2016, 32, 167–178. [Google Scholar] [CrossRef] [PubMed]
  45. Villa, F.; Remelli, W.; Forlani, F.; Gambino, M.; Landini, P.; Cappitelli, F. Effects of chronic sub-lethal oxidative stress on biofilm formation by Azotobacter vinelandii. Biofouling 2012, 28, 823–833. [Google Scholar] [CrossRef] [PubMed]
  46. Oh, E.; Andrews, K.J.; Jeon, B. Enhanced biofilm formation by ferrous and ferric iron through oxidative stress in Campylobacter jejuni. Front. Microbiol. 2018, 9, 1204. [Google Scholar] [CrossRef] [PubMed]
  47. Svenningsen, N.B.; Martinez-Garcia, E.; Nicolaisen, M.H.; de Lorenzo, V.; Nybroe, O. The biofilm matrix polysaccharides cellulose and alginate both protect Pseudomonas putida mt-2 against reactive oxygen species generated under matric stress and copper exposure. Microbiology 2018, 164, 883–888. [Google Scholar] [CrossRef] [PubMed]
  48. Whipps, J.M.; Hand, P.; Pink, D.; Bending, G.D. Phyllosphere microbiology with special reference to diversity and plant genotype. J. Appl. Microbiol. 2008, 105, 1744–1755. [Google Scholar] [CrossRef] [Green Version]
  49. Vorholt, J.A. Microbial life in the phyllosphere. Nat. Rev. Microbiol. 2012, 10, 828–840. [Google Scholar] [CrossRef]
  50. Rastogi, G.; Coaker, G.L.; Leveau, J.H.J. New insights into the structure and function of phyllosphere microbiota through high-throughput molecular approaches. FEMS Microbiol. Lett. 2013, 348, 1–10. [Google Scholar] [CrossRef] [Green Version]
  51. Carvalho, S.D.; Castillo, J.A. Influence of light on plant-phyllosphere interaction. Front. Plant Sci. 2018, 9, 1482. [Google Scholar] [CrossRef]
  52. Rosier, A.; Medeiros, F.H.V.; Bais, H.P. Defining plant growth promoting rhizobacteria molecular and biochemical networks in beneficial plant-microbe interactions. Plant Soil 2018, 428, 35–55. [Google Scholar] [CrossRef] [Green Version]
  53. Hunter, P.J.; Hand, P.; Pink, D.; Whipps, J.M.; Bending, G.D. Both leaf properties and microbe-microbe interactions influence within-species variation in bacterial population diversity and structure in the lettuce (Lactuca species) phyllosphere. Appl. Environ. Microbiol. 2010, 76, 8117–8125. [Google Scholar] [CrossRef] [PubMed]
  54. Bringel, F.; Couee, I. Pivotal roles of phyllosphere microorganisms at the interface between plant functioning and atmospheric trace gas dynamics. Front. Microbiol. 2015, 6, 486. [Google Scholar] [CrossRef] [PubMed] [Green Version]
  55. Smith, D.L.; Subramanian, S.; Lamont, J.R.; Bywater-Ekegard, M. Signaling in the phytomicrobiome: Breadth and potential. Front. Plant Sci. 2015, 6, 709. [Google Scholar] [CrossRef] [PubMed]
  56. Dudonne, S.; Vitrac, X.; Coutiere, P.; Woillez, M.; Merillon, J.M. Comparative Study of Antioxidant Properties and Total Phenolic Content of 30 Plant Extracts of Industrial Interest Using DPPH, ABTS, FRAP, SOD, and ORAC Assays. J. Agric. Food Chem. 2009, 57, 1768–1774. [Google Scholar] [CrossRef] [PubMed]
  57. Dewanto, V.; Wu, X.Z.; Adom, K.K.; Liu, R.H. Thermal processing enhances the nutritional value of tomatoes by increasing total antioxidant activity. J. Agric. Food Chem. 2002, 50, 3010–3014. [Google Scholar] [CrossRef]
  58. Huang, D.J.; Ou, B.X.; Hampsch-Woodill, M.; Flanagan, J.A.; Prior, R.L. High-throughput assay of oxygen radical absorbance capacity (ORAC) using a multichannel liquid handling system coupled with a microplate flourescence reader in 96-well format. J. Agric. Food Chem. 2002, 50, 4437–4444. [Google Scholar] [CrossRef]
  59. Gillespie, K.M.; Chae, J.M.; Ainsworth, E.A. Rapid measurement of total antioxidant capacity in plants. Nat. Protoc. 2007, 2, 867–870. [Google Scholar] [CrossRef]
  60. Horai, H.; Arita, M.; Kanaya, S.; Nihei, Y.; Ikeda, T.; Suwa, K.; Ojima, Y.; Tanaka, K.; Tanaka, S.; Aoshima, K.; et al. MassBank: A public repository for sharing mass spectral data for life sciences. J. Mass Spectrom. 2010, 45, 703–714. [Google Scholar] [CrossRef]
  61. Sawada, Y.; Nakabayashi, R.; Yamada, Y.; Suzuki, M.; Sato, M.; Sakata, A.; Akiyama, K.; Sakurai, T.; Matsuda, F.; Aoki, T.; et al. RIKEN tandem mass spectral database (ReSpect) for phytochemicals: A plant-specific MS/MS-based data resource and database. Phytochemistry 2012, 82, 38–45. [Google Scholar] [CrossRef] [Green Version]
  62. Faucher, S.P.; Charette, S.J. Editorial on: Bacterial pathogens in the non-clinical environment. Front. Microbiol. 2015, 6, 331. [Google Scholar] [CrossRef] [PubMed]
  63. Mayer, F.L.; Wilson, D.; Hube, B. Candida albicans pathogenicity mechanisms. Virulence 2013, 4, 119–128. [Google Scholar] [CrossRef] [PubMed]
  64. Dean, R.; Van Kan, J.A.; Pretorius, Z.A.; Hammond-Kosack, K.E.; Di Pietro, A.; Spanu, P.D.; Rudd, J.J.; Dickman, M.; Kahmann, R.; Ellis, J.; et al. The Top 10 fungal pathogens in molecular plant pathology. Mol. Plant Pathol. 2012, 13, 414–430. [Google Scholar] [CrossRef] [PubMed] [Green Version]
  65. Balouiri, M.; Sadiki, M.; Ibnsouda, S.K. Methods for in vitro evaluating antimicrobial activity: A review. J. Pharm. Anal. 2016, 6, 71–79. [Google Scholar] [CrossRef] [PubMed]
  66. Cattò, C.; Grazioso, G.; Dell’Orto, S.; Gelain, A.; Villa, S.; Marzano, V.; Vitali, A.; Villa, F.; Cappitelli, F.; Forlani, F. The response of Escherichia coli biofilm to salicylic acid. Biofouling 2017, 33, 235–251. [Google Scholar] [CrossRef] [PubMed]
  67. Zwietering, M.H.; Jongenburger, I.; Rombouts, F.M.; Vantriet, K. Modeling of the bacterial-growth curve. Appl. Environ. Microbiol. 1990, 56, 1875–1881. [Google Scholar] [PubMed]
  68. Cattò, C.; Dell’Orto, S.; Villa, F.; Villa, S.; Gelain, A.; Vitali, A. Unravelling the structural and molecular basis responsible for the anti-biofilm activity of zosteric acid. PLoS ONE 2015, 10, e0136124. [Google Scholar] [CrossRef] [PubMed]
  69. Villa, F.; Borgonovo, G.; Cappitelli, F.; Giussani, B.; Bassoli, A. Sub-lethal concentrations of Muscari comosum bulb extract suppress adhesion and induce detachment of sessile yeast cells. Biofouling 2012, 28, 1107–1117. [Google Scholar] [CrossRef] [PubMed]
  70. Azeredo, J.; Azevedo, N.F.; Briandet, R.; Cerca, N.; Coenye, T.; Costa, A.R.; Desvaux, M.; Di Bonaventura, G.; Hébraud, M.; Jaglic, Z.; et al. Critical review on biofilm methods. Crit. Rev. Microbiol. 2017, 43, 313–351. [Google Scholar] [CrossRef] [PubMed]
  71. Wilson, C.; Lukowicz, R.; Merchant, S.; Valquier-Flynn, H.; Caballero, J.; Sandoval, J.; Okuom, M.; Huber, C.; Brooks, T.D.; Wilson, E.; et al. Quantitative and qualitative assessment methods for biofilm growth: A mini-review. Res. Rev. J. Eng. Technol. 2017, 6. [Google Scholar]
  72. Bradford, M.M. A rapid and sensitive method for the quantitation of microgram quantities of protein utilizing the principle of protein-dye binding. Anal. Biochem. 1976, 72, 248–254. [Google Scholar] [CrossRef]
  73. Masuko, T.; Minami, A.; Iwasaki, N.; Majima, T.; Nishimura, S.I.; Lee, Y.C. Carbohydrate analysis by a phenol-sulfuric acid method in microplate format. Anal. Biochem. 2005, 339, 69–72. [Google Scholar] [CrossRef] [PubMed]
  74. Jakubowski, W.; Bilinski, T.; Bartosz, G. Oxidative stress during aging of stationary cultures of the yeast Saccharomyces cerevisiae. Free Radic. Biol. Med. 2000, 28, 659–664. [Google Scholar] [CrossRef]
  75. Spadoni-Andreani, E.; Villa, F.; Cappitelli, F.; Krasowska, A.; Biniarz, P.; Lukaszewicz, M.; Secundo, F. Coating polypropylene surfaces with protease weakens the adhesion and increases the dispersion of Candida albicans cells. Biotechnol. Lett. 2017, 39, 423–428. [Google Scholar] [CrossRef] [PubMed]
Figure 1. Crude methanolic extracts were analyzed for total phenols in mg gallic acid equivalent (GAE) per mg extract (A), total flavonoids in mg catechin equivalent (CE) per mg extract (B), and oxygen radical absorbance capacity (ORAC) in mg Trolox equivalents (TE) per g extract (C). Data represent the mean ± SDs and different superscript letters indicate statistically significant differences (Tukey’s HSD, p ≤ 0.05) between the means of three independent measurements.
Ijms 20 03549 g001
Figure 2. Cells/conidia adhesion in the presence of B. cylindrica and L. racemosa extracts. Percentage differences with respect to the negative control plus 2% MetOH are reported. Black dots indicate statistically significant differences with the 2% MetOH negative control.
Ijms 20 03549 g002
Figure 3. Cellular biomass within the biofilm in the presence of B. cylindrica and L. racemosa extracts. Percentage differences with respect to the negative control plus 2% MetOH are reported. Black dots indicate statistically significant differences with the 2% MetOH negative control.
Ijms 20 03549 g003
Figure 4. Extracellular polysaccharides and proteins within the biofilm in the presence of B. cylindrica and L. racemosa extracts. Percentage differences of polysaccharides and proteins sum (A) and ratio (B) with respect to the negative control plus 2% MetOH are reported. Black dots indicate statistically significant differences with the 2% MetOH negative control.
Ijms 20 03549 g004
Figure 5. Reactive oxygen species (ROS) within the biofilm in the presence of B. cylindrica and L. racemosa extracts. In panels (A) and (B), the percentage differences with respect to the negative control plus 2% MetOH are reported. Black dots indicate statistically significant differences with the 2% MetOH negative control.
Ijms 20 03549 g005
Figure 6. Detachment of biofilm pre-grown without extract and subsequently treated with B. cylindrica and L. racemosa. Percentage differences with respect to the negative control plus 2% MetOH are reported. Black dots indicate statistically significant differences with the 2% MetOH negative control.
Ijms 20 03549 g006
Table 1. Individual compounds identified by comparison of MS/MS spectra with database entries in B. cylindrica leaf extract and L. racemosa leaf extract.
B. Cylindrica Leaf Extract
NoRTMassMS/MSNameAccessionSource
12.5341.11179.0, 161.0, 119.0, 89.0, 71.0GalactinolPT211910ReSpect
27.8353.08191.05, 179.03, 135.04Caffeic acid mod.--
39.1372.13132.04, 59.01n. i.--
411.0427.18367.16, 221.10HirsutineTY000056MassBank
511.9456.15310.09, 148.04, 132.04, 121.03n. i.--
614.2535.16475.14, 323.09, 221.06, 179.05, 151.04n. i.--
715.8445.2385.18, 205.12, 161.04, 153.091-O-b-D-glucopyranosyl sinapate mod.PS118108ReSpect
817.1475.18415.16, 269.10, 161.04n. i.--
919.2447.09429.08, 357.06, 327.05, 285.04HomoorientinPT204250ReSpect
1019.8577.16413.09, 311.05, 293.04Vitexin-2″-O-rhamnosidePT208750ReSpect
1121.0577.15413.09, 311.05, 293.04Vitexin-2″-O-rhamnoside IsomerPT208750ReSpect
1224.3461.11341.06, 299.05, 283.02n. i.TY000253MassBank
1331.4293.17236.10, 221.15, 205.12n. i.--
1432.0339.22307.19, 289.18, 245.19n. i.--
L. racemosa Leaf Extract
NoRTMassMS/MSNameAccessionSource
12.7181.07163.06, 119.03, 101.02, 89.02, 71.01MannitolPT211960Respect
22.9341.10179.05, 161.04, 119.03, 89.02GalactinolPT211910Respect
35.3331.06271.04, 211.02, 169.01, 151.00n. i.
48.4305.06261.07, 219.06, 165.01, 125.02(–)-EpigallocatechinML000151MassBank
510.7467.03458.03, 343.01, 301.00, 275.02, 249.04, 169.01, 125.02Casuarinin-[21]
611.7305.07225.11, 96.96n. i.--
713.3183.03168.00, 124.01, 106.00, 78.01(galloyl) Methyl gallatePM012531, PM012533Respect
814.2457.08305.06, 169.01, 125.02Epigallocatechin 3,5-digallate43930Metlin
915.0319.04301.03, 257.04, 215.03, 193.01, 175.00, 125.02DelphinidinStandard
1016.1303.0996.96, 79.95n. i.--
1121.1463.09316.02, 287.02, 271.02MyricitrinPR040144MassBank
1222.2601.09449.07, 316.02, 179.00Myricetin-3-xyloside glycosidePS093009Respect
1322.9615.10463.08, 317.03, 179.00Myricitrin glycosidePR040144MassBank
1424.8423.00343.05, 328.02, 313.00, 297.97Robinetin trimethyl ether mod.BML01849MassBank
1531.4293.17236.10, 221.15, 205.12, 192.11n. i.--
No = number of peak in Figure S1, RT = retention time, Mass = mass of precursor ion, MS/MS= fragment spectra obtained at −30 eV, Accession = accession number in database, Source = database used, n. i. = not identified, mod. = modified.
Table 2. Summary of the effects of B. cylindrica and L. racemosa on the three steps of E. coli, C. albicans, and F. oxysporum biofilm formation. Increase (+), decrease (–), and no differences (=) in comparison to the negative control prepared with 2% MetOH with the addition of each microbial strain. EPS: extracellular polymeric substances.
E. coliC. albicansF. oxysporum
B. cyl.L. rac.B. cyl.L. rac.B. cyl.L. rac.
ADHESION+
MATURATION
Cellular biomass+=
EPS (polysaccharides + proteins)++=+++
EPS (polysaccharides/proteins)++++++
Intracellular ROS++++++
Extracellular ROS+++++
DETACHMENT++++

