Alteration of the Total Cellular Glycome during Late Differentiation of Chondrocytes

 , , , and
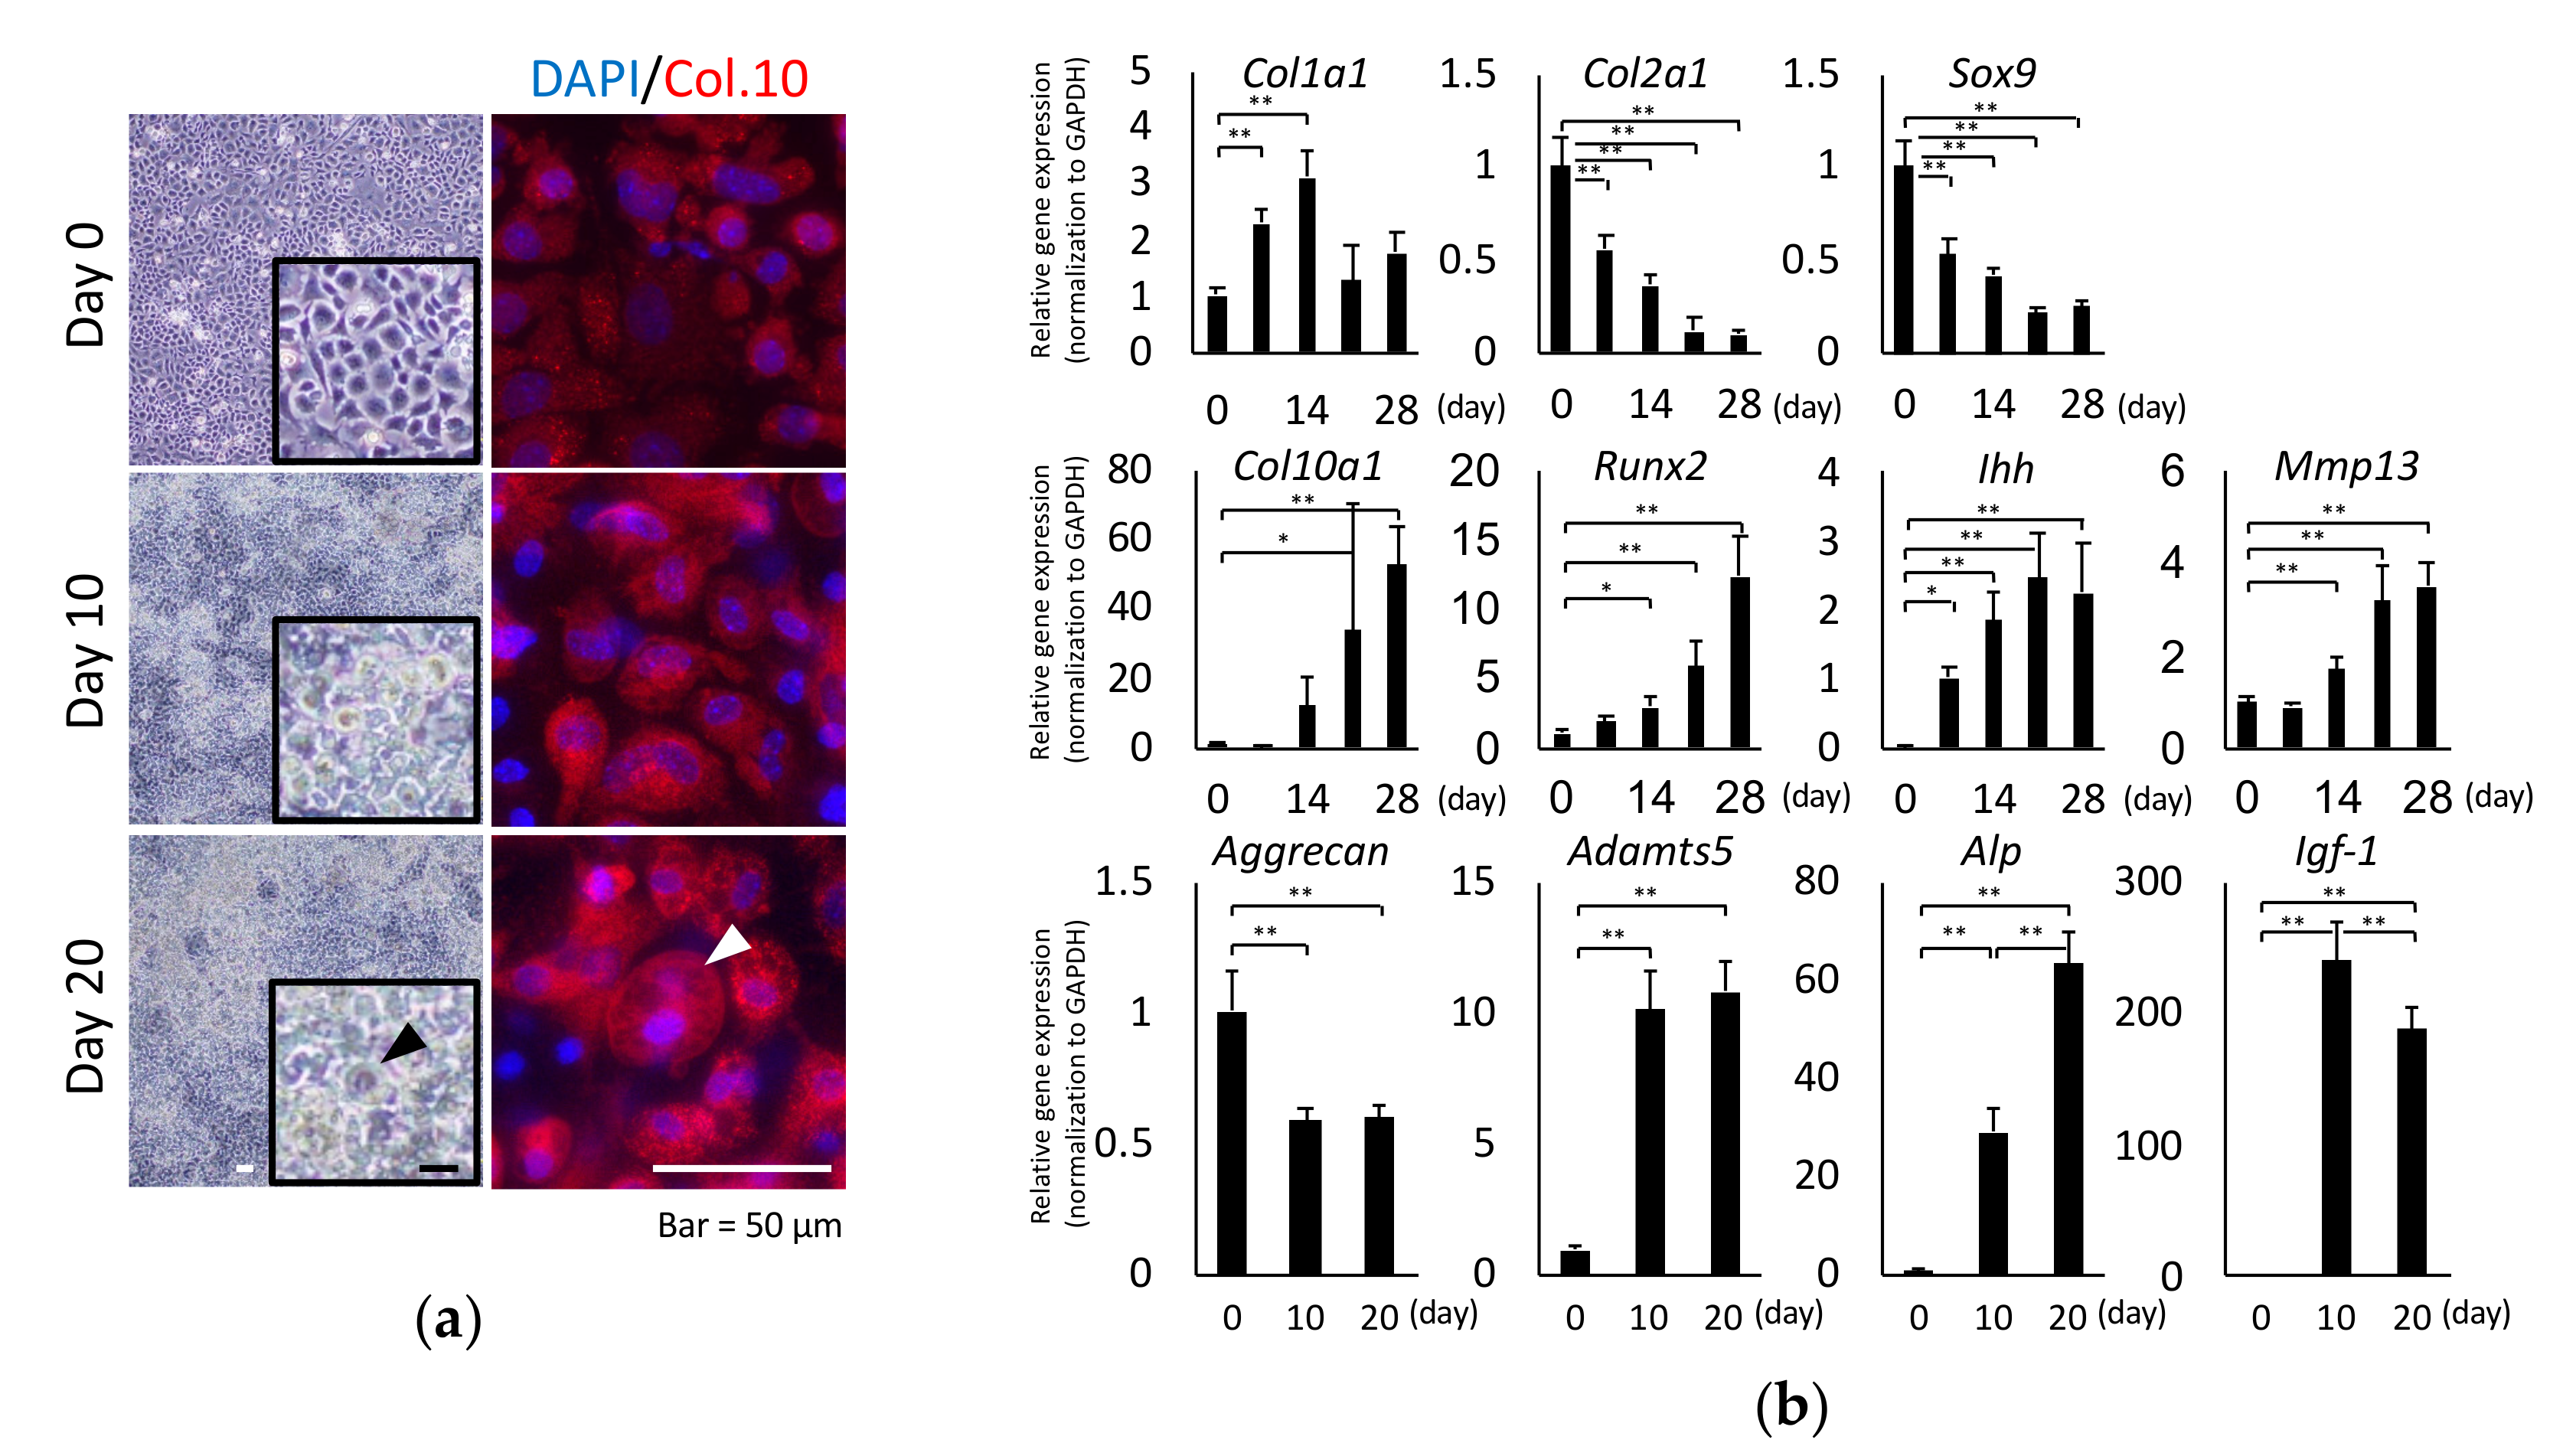
Abstract
1. Introduction
2. Results
2.1. Chondrocyte Hypertrophy Culture Model
2.2. Total Glycomic Analysis of Chondrocytes During Hypertrophy
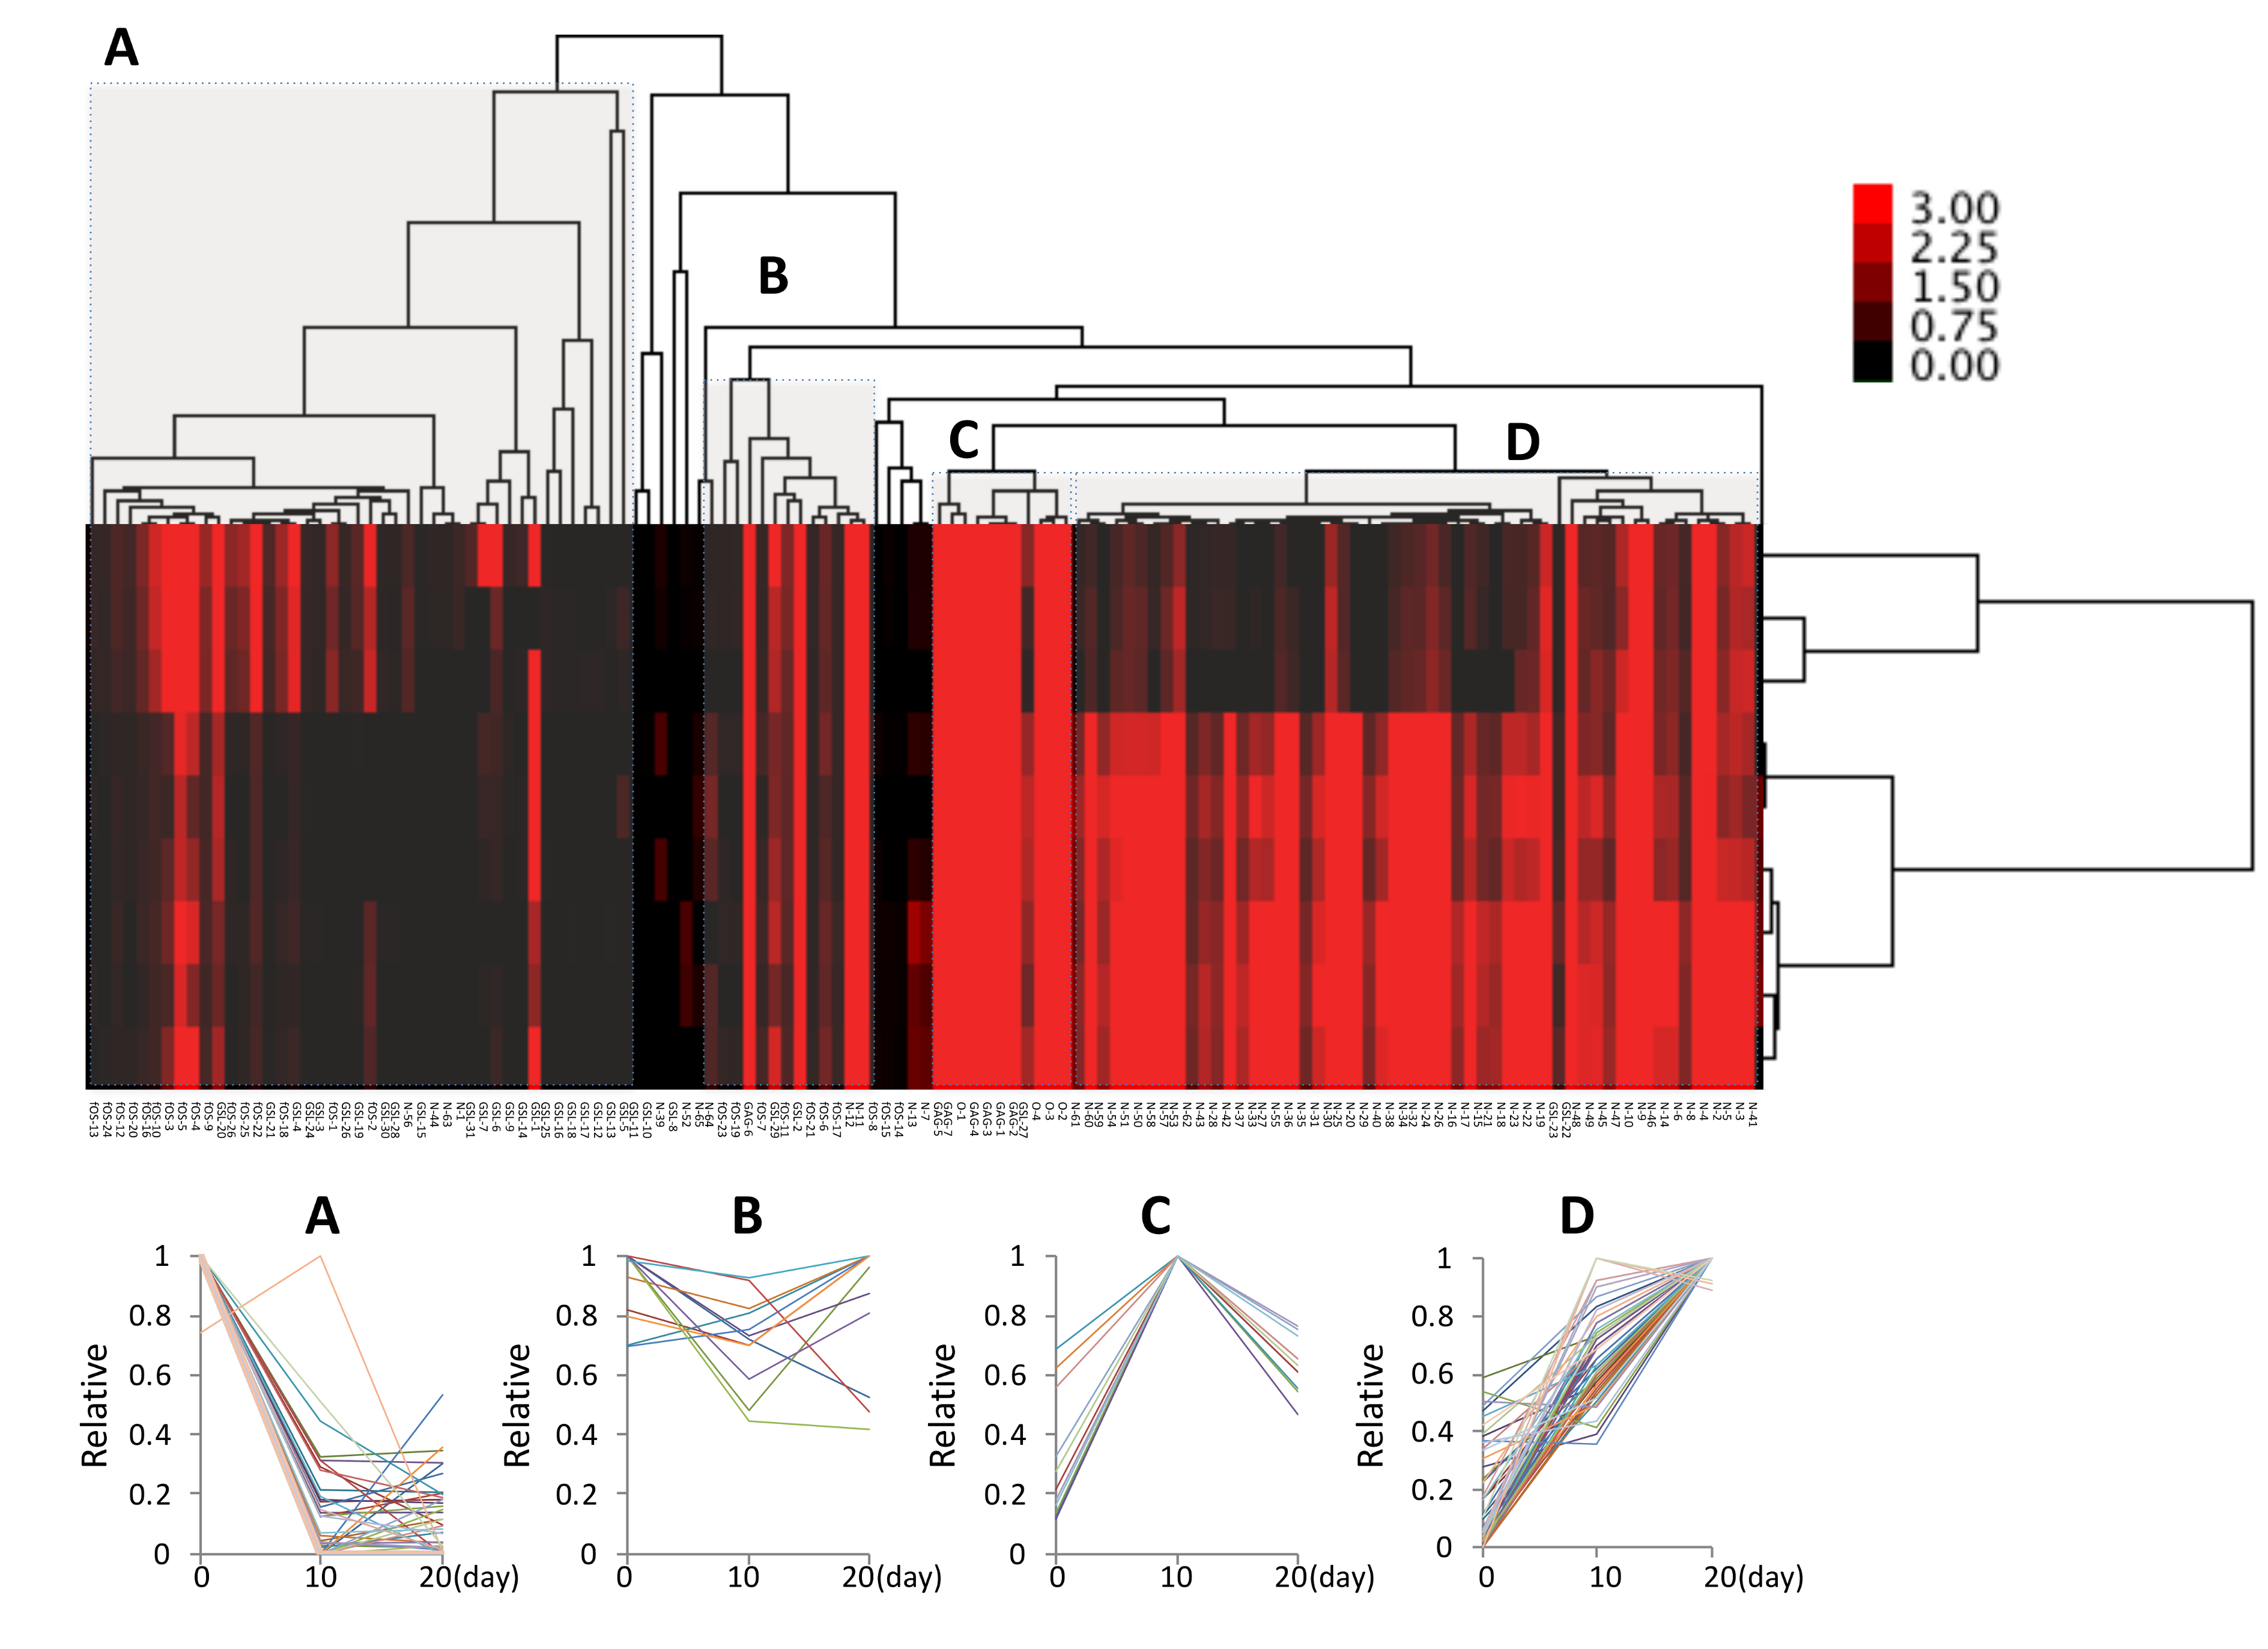
2.3. Cluster Analysis
2.4. N-Glycans during Hypertrophic Differentiation
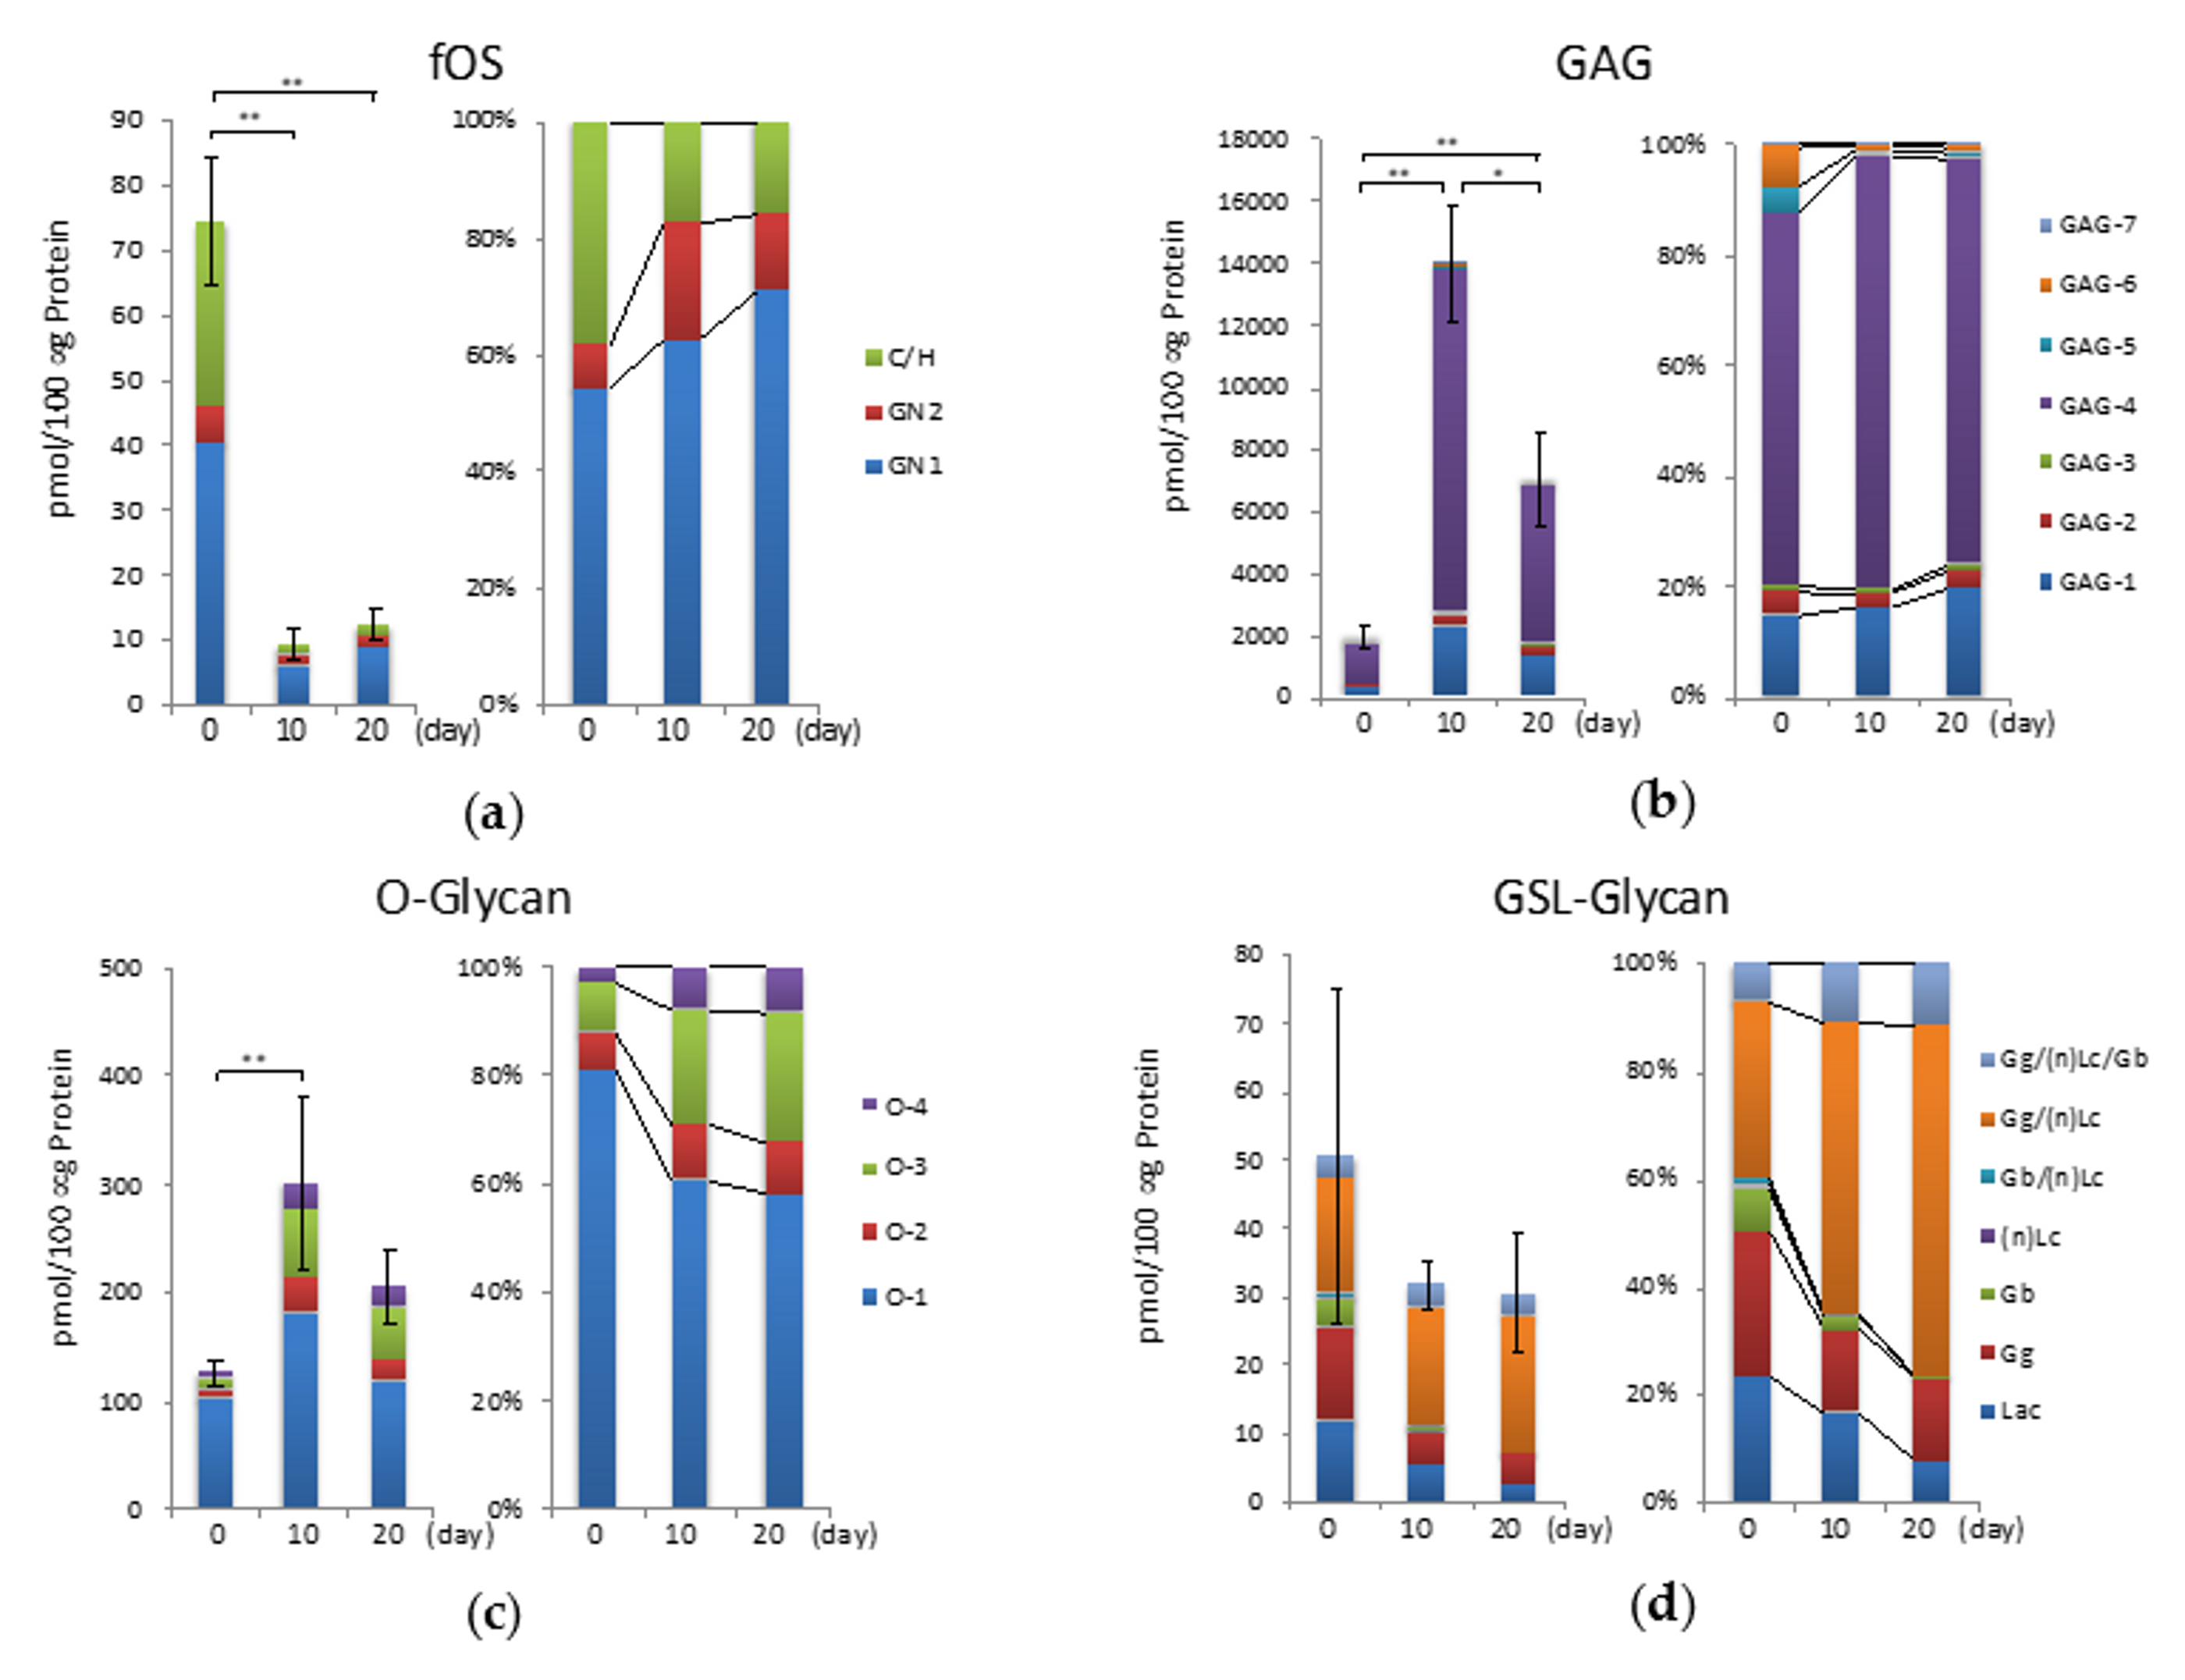
2.5. fOSs during Hypertrophic Differentiation
2.6. GAGs during Hypertrophic Differentiation
2.7. O-Glycans During Hypertrophic Differentiation
2.8. GSL-Glycans during Hypertrophic Differentiation
3. Discussion
4. Materials and Methods
4.1. Experimental Animals and Materials
4.2. In Vitro Differentiation
4.3. qRT-PCR Analysis
4.4. Immunostaining for Type X Collagen
4.5. Extraction of Glycoproteins, GSLs, and fOSs
4.6. Extraction of GAGs
4.7. Extraction of O-Glycans
4.8. Glycoblotting
4.9. Quantitative Analysis by MALDI-TOF-MS
4.10. HPLC Analysis
4.11. Statistical Analysis
5. Conclusions
Supplementary Materials
Author Contributions
Funding
Conflicts of Interest
References
- Kronenberg, H.M. Developmental regulation of the growth plate. Nature 2003, 423, 332–336. [Google Scholar] [CrossRef] [PubMed]
- Mackie, E.J.; Tatarczuch, L.; Mirams, M. The skeleton: A multi-functional complex organ: The growth plate chondrocyte and endochondral ossification. J. Endocrinol. 2011, 211, 109–121. [Google Scholar] [CrossRef] [PubMed]
- Van der Kraan, P.M.; van den Berg, W.B. Chondrocyte hypertrophy and osteoarthritis: Role in initiation and progression of cartilage degeneration? Osteoarthr. Cartil. 2012, 20, 223–232. [Google Scholar] [CrossRef] [PubMed]
- Martel-Pelletier, J.; Barr, A.J.; Cicuttini, F.M.; Conaghan, P.G.; Cooper, C.; Goldring, M.B.; Goldring, S.R.; Jones, G.; Teichtahl, A.J.; Pelletier, J.-P. Osteoarthritis. Nat. Rev. Dis. Primer 2016, 2, 16072. [Google Scholar] [CrossRef] [PubMed]
- Pap, T.; Korb-Pap, A. Cartilage damage in osteoarthritis and rheumatoid arthritis—Two unequal siblings. Nat. Rev. Rheumatol. 2015, 11, 606–615. [Google Scholar] [CrossRef] [PubMed]
- Li, J.; Dong, S. The Signaling Pathways Involved in Chondrocyte Differentiation and Hypertrophic Differentiation. Stem Cells Int. 2016, 2016, 2470351. [Google Scholar] [CrossRef]
- De la Fuente, A.; Mateos, J.; Lesende-Rodríguez, I.; Calamia, V.; Fuentes-Boquete, I.; de Toro, F.J.; Arufe, M.C.; Blanco, F.J. Proteome analysis during chondrocyte differentiation in a new chondrogenesis model using human umbilical cord stroma mesenchymal stem cells. Mol. Cell. Proteom. MCP 2012, 11, M111.010496. [Google Scholar] [CrossRef]
- Buckland, J. Osteoarthritis: Control of human cartilage hypertrophic differentiation. Nat. Rev. Rheumatol. 2012, 8, 368. [Google Scholar] [CrossRef]
- van Donkelaar, C.C.; Wilson, W. Mechanics of chondrocyte hypertrophy. Biomech. Model. Mechanobiol. 2012, 11, 655–664. [Google Scholar] [CrossRef]
- Sun, M.M.-G.; Beier, F. Chondrocyte hypertrophy in skeletal development, growth, and disease. Birth Defects Res. Part C Embryo Today Rev. 2014, 102, 74–82. [Google Scholar] [CrossRef]
- Dreier, R. Hypertrophic differentiation of chondrocytes in osteoarthritis: The developmental aspect of degenerative joint disorders. Arthritis Res. Ther. 2010, 12, 216. [Google Scholar] [CrossRef] [PubMed]
- Reynard, L.N.; Loughlin, J. Insights from human genetic studies into the pathways involved in osteoarthritis. Nat. Rev. Rheumatol. 2013, 9, 573–583. [Google Scholar] [CrossRef] [PubMed]
- Gao, C.; Maeno, T.; Ota, F.; Ueno, M.; Korekane, H.; Takamatsu, S.; Shirato, K.; Matsumoto, A.; Kobayashi, S.; Yoshida, K.; et al. Sensitivity of heterozygous α1,6-fucosyltransferase knock-out mice to cigarette smoke-induced emphysema: Implication of aberrant transforming growth factor-β signaling and matrix metalloproteinase gene expression. J. Biol. Chem. 2012, 287, 16699–16708. [Google Scholar] [CrossRef] [PubMed]
- Go, S.; Go, S.; Veillon, L.; Ciampa, M.G.; Mauri, L.; Sato, C.; Kitajima, K.; Prinetti, A.; Sonnino, S.; Inokuchi, J.-I. Altered expression of ganglioside GM3 molecular species and a potential regulatory role during myoblast differentiation. J. Biol. Chem. 2017, 292, 7040–7051. [Google Scholar] [CrossRef] [PubMed]
- Ishihara, T.; Kakiya, K.; Takahashi, K.; Miwa, H.; Rokushima, M.; Yoshinaga, T.; Tanaka, Y.; Ito, T.; Togame, H.; Takemoto, H.; et al. Discovery of novel differentiation markers in the early stage of chondrogenesis by glycoform-focused reverse proteomics and genomics. Biochim. Biophys. Acta 2014, 1840, 645–655. [Google Scholar] [CrossRef] [PubMed]
- Urita, A.; Matsuhashi, T.; Onodera, T.; Nakagawa, H.; Hato, M.; Amano, M.; Seito, N.; Minami, A.; Nishimura, S.-I.; Iwasaki, N. Alterations of high-mannose type N-glycosylation in human and mouse osteoarthritis cartilage. Arthritis Rheum. 2011, 63, 3428–3438. [Google Scholar] [CrossRef] [PubMed]
- Matsuoka, M.; Onodera, T.; Homan, K.; Sasazawa, F.; Furukawa, J.-I.; Momma, D.; Baba, R.; Hontani, K.; Joutoku, Z.; Matsubara, S.; et al. Depletion of Gangliosides Enhances Articular Cartilage Repair in Mice. Sci. Rep. 2017, 7, 43729. [Google Scholar] [CrossRef] [PubMed]
- David, M.J.; Hellio, M.P.; Portoukalian, J.; Richard, M.; Caton, J.; Vignon, E. Gangliosides from normal and osteoarthritic joints. J. Rheumatol. Suppl. 1995, 43, 133–135. [Google Scholar]
- David, M.J.; Portoukalian, J.; Rebbaa, A.; Vignon, E.; Carret, J.P.; Richard, M. Characterization of gangliosides from normal and osteoarthritic human articular cartilage. Arthritis Rheum. 1993, 36, 938–942. [Google Scholar] [CrossRef]
- Sasazawa, F.; Onodera, T.; Yamashita, T.; Seito, N.; Tsukuda, Y.; Fujitani, N.; Shinohara, Y.; Iwasaki, N. Depletion of gangliosides enhances cartilage degradation in mice. Osteoarthr. Cartil. 2014, 22, 313–322. [Google Scholar] [CrossRef]
- Apweiler, R.; Hermjakob, H.; Sharon, N. On the frequency of protein glycosylation, as deduced from analysis of the SWISS-PROT database. Biochim. Biophys. Acta 1999, 1473, 4–8. [Google Scholar] [CrossRef]
- Furukawa, J.; Shinohara, Y.; Kuramoto, H.; Miura, Y.; Shimaoka, H.; Kurogochi, M.; Nakano, M.; Nishimura, S.-I. Comprehensive approach to structural and functional glycomics based on chemoselective glycoblotting and sequential tag conversion. Anal. Chem. 2008, 80, 1094–1101. [Google Scholar] [CrossRef] [PubMed]
- Fujitani, N.; Furukawa, J.; Araki, K.; Fujioka, T.; Takegawa, Y.; Piao, J.; Nishioka, T.; Tamura, T.; Nikaido, T.; Ito, M.; et al. Total cellular glycomics allows characterizing cells and streamlining the discovery process for cellular biomarkers. Proc. Natl. Acad. Sci. USA 2013, 110, 2105–2110. [Google Scholar] [CrossRef] [PubMed]
- Yoshida, Y.; Furukawa, J.-I.; Naito, S.; Higashino, K.; Numata, Y.; Shinohara, Y. Quantitative analysis of total serum glycome in human and mouse. Proteomics 2016, 16, 2747–2758. [Google Scholar] [CrossRef] [PubMed]
- Furukawa, J.; Fujitani, N.; Araki, K.; Takegawa, Y.; Kodama, K.; Shinohara, Y. A versatile method for analysis of serine/threonine posttranslational modifications by β-elimination in the presence of pyrazolone analogues. Anal. Chem. 2011, 83, 9060–9067. [Google Scholar] [CrossRef] [PubMed]
- Furukawa, J.; Piao, J.; Yoshida, Y.; Okada, K.; Yokota, I.; Higashino, K.; Sakairi, N.; Shinohara, Y. Quantitative O-Glycomics by Microwave-Assisted β-Elimination in the Presence of Pyrazolone Analogues. Anal. Chem. 2015, 87, 7524–7528. [Google Scholar] [CrossRef] [PubMed]
- Hall, K.C.; Hill, D.; Otero, M.; Plumb, D.A.; Froemel, D.; Dragomir, C.L.; Maretzky, T.; Boskey, A.; Crawford, H.C.; Selleri, L.; et al. ADAM17 controls endochondral ossification by regulating terminal differentiation of chondrocytes. Mol. Cell. Biol. 2013, 33, 3077–3090. [Google Scholar] [CrossRef]
- Shukunami, C.; Ishizeki, K.; Atsumi, T.; Ohta, Y.; Suzuki, F.; Hiraki, Y. Cellular hypertrophy and calcification of embryonal carcinoma-derived chondrogenic cell line ATDC5 in vitro. J. Bone Miner. Res. Off. J. Am. Soc. Bone Miner. Res. 1997, 12, 1174–1188. [Google Scholar] [CrossRef] [PubMed]
- Furukawa, J.-I.; Soga, M.; Okada, K.; Yokota, I.; Piao, J.; Irie, T.; Era, T.; Shinohara, Y. Impact of the Niemann-Pick c1 Gene Mutation on the Total Cellular Glycomics of CHO Cells. J. Proteome Res. 2017, 16, 2802–2810. [Google Scholar] [CrossRef]
- Watanabe, Y.; Takeuchi, K.; Higa Onaga, S.; Sato, M.; Tsujita, M.; Abe, M.; Natsume, R.; Li, M.; Furuichi, T.; Saeki, M.; et al. Chondroitin sulfate N-acetylgalactosaminyltransferase-1 is required for normal cartilage development. Biochem. J. 2010, 432, 47–55. [Google Scholar] [CrossRef]
- Yoshida, C.A.; Kawane, T.; Moriishi, T.; Purushothaman, A.; Miyazaki, T.; Komori, H.; Mori, M.; Qin, X.; Hashimoto, A.; Sugahara, K.; et al. Overexpression of Galnt3 in chondrocytes resulted in dwarfism due to the increase of mucin-type O-glycans and reduction of glycosaminoglycans. J. Biol. Chem. 2014, 289, 26584–26596. [Google Scholar] [CrossRef] [PubMed]
- Jikko, A.; Aoba, T.; Murakami, H.; Takano, Y.; Iwamoto, M.; Kato, Y. Characterization of the mineralization process in cultures of rabbit growth plate chondrocytes. Dev. Biol. 1993, 156, 372–380. [Google Scholar] [CrossRef] [PubMed]
- Alini, M.; Carey, D.; Hirata, S.; Grynpas, M.D.; Pidoux, I.; Poole, A.R. Cellular and matrix changes before and at the time of calcification in the growth plate studied in vitro: Arrest of type X collagen synthesis and net loss of collagen when calcification is initiated. J. Bone Miner. Res. Off. J. Am. Soc. Bone Miner. Res. 1994, 9, 1077–1087. [Google Scholar] [CrossRef] [PubMed]
- Kato, Y.; Iwamoto, M.; Koike, T.; Suzuki, F.; Takano, Y. Terminal differentiation and calcification in rabbit chondrocyte cultures grown in centrifuge tubes: Regulation by transforming growth factor beta and serum factors. Proc. Natl. Acad. Sci. USA 1988, 85, 9552–9556. [Google Scholar] [CrossRef] [PubMed]
- Yano, F.; Hojo, H.; Ohba, S.; Fukai, A.; Hosaka, Y.; Ikeda, T.; Saito, T.; Hirata, M.; Chikuda, H.; Takato, T.; et al. A novel disease-modifying osteoarthritis drug candidate targeting Runx1. Ann. Rheum. Dis. 2013, 72, 748–753. [Google Scholar] [CrossRef] [PubMed]
- Narcisi, R.; Quarto, R.; Ulivi, V.; Muraglia, A.; Molfetta, L.; Giannoni, P. TGF β-1 administration during ex vivo expansion of human articular chondrocytes in a serum-free medium redirects the cell phenotype toward hypertrophy. J. Cell. Physiol. 2012, 227, 3282–3290. [Google Scholar] [CrossRef]
- Steinert, A.F.; Proffen, B.; Kunz, M.; Hendrich, C.; Ghivizzani, S.C.; Nöth, U.; Rethwilm, A.; Eulert, J.; Evans, C.H. Hypertrophy is induced during the in vitro chondrogenic differentiation of human mesenchymal stem cells by bone morphogenetic protein-2 and bone morphogenetic protein-4 gene transfer. Arthritis Res. Ther. 2009, 11, R148. [Google Scholar] [CrossRef]
- Roy, R.; Kudryashov, V.; Doty, S.B.; Binderman, I.; Boskey, A.L. Differentiation and mineralization of murine mesenchymal C3H10T1/2 cells in micromass culture. Differ. Res. Biol. Divers. 2010, 79, 211–217. [Google Scholar] [CrossRef]
- Chua, K.H.; Aminuddin, B.S.; Fuzina, N.H.; Ruszymah, B.H.I. Insulin-transferrin-selenium prevent human chondrocyte dedifferentiation and promote the formation of high quality tissue engineered human hyaline cartilage. Eur. Cell Mater. 2005, 9, 58–67, discussion 67. [Google Scholar] [CrossRef]
- Stanton, L.-A.; Underhill, T.M.; Beier, F. MAP kinases in chondrocyte differentiation. Dev. Biol. 2003, 263, 165–175. [Google Scholar] [CrossRef]
- Krug, D.; Klinger, M.; Haller, R.; Hargus, G.; Büning, J.; Rohwedel, J.; Kramer, J. Minor cartilage collagens type IX and XI are expressed during embryonic stem cell-derived in vitro chondrogenesis. Ann. Anat. Anat. Anz. Off. Organ Anat. Ges. 2013, 195, 88–97. [Google Scholar] [CrossRef]
- Gartland, A.; Mechler, J.; Mason-Savas, A.; MacKay, C.A.; Mailhot, G.; Marks, S.C.; Odgren, P.R. In vitro chondrocyte differentiation using costochondral chondrocytes as a source of primary rat chondrocyte cultures: An improved isolation and cryopreservation method. Bone 2005, 37, 530–544. [Google Scholar] [CrossRef] [PubMed]
- Yan, W.; Pan, H.; Ishida, H.; Nakashima, K.; Suzuki, F.; Nishimura, M.; Jikko, A.; Oda, R.; Kato, Y. Effects of concanavalin A on chondrocyte hypertrophy and matrix calcification. J. Biol. Chem. 1997, 272, 7833–7840. [Google Scholar] [CrossRef] [PubMed]
- Yan, W.Q.; Nakashima, K.; Iwamoto, M.; Kato, Y. Stimulation by concanavalin A of cartilage-matrix proteoglycan synthesis in chondrocyte cultures. J. Biol. Chem. 1990, 265, 10125–10131. [Google Scholar] [PubMed]
- Toegel, S.; Bieder, D.; André, S.; Altmann, F.; Walzer, S.M.; Kaltner, H.; Hofstaetter, J.G.; Windhager, R.; Gabius, H.-J. Glycophenotyping of osteoarthritic cartilage and chondrocytes by RT-qPCR, mass spectrometry, histochemistry with plant/human lectins and lectin localization with a glycoprotein. Arthritis Res. Ther. 2013, 15, R147. [Google Scholar] [CrossRef] [PubMed]
- Sato, T.; Gotoh, M.; Kiyohara, K.; Akashima, T.; Iwasaki, H.; Kameyama, A.; Mochizuki, H.; Yada, T.; Inaba, N.; Togayachi, A.; et al. Differential roles of two N-acetylgalactosaminyltransferases, CSGalNAcT-1, and a novel enzyme, CSGalNAcT-2. Initiation and elongation in synthesis of chondroitin sulfate. J. Biol. Chem. 2003, 278, 3063–3071. [Google Scholar] [CrossRef] [PubMed]
- Momma, D.; Onodera, T.; Homan, K.; Matsubara, S.; Sasazawa, F.; Furukawa, J.; Matsuoka, M.; Yamashita, T.; Iwasaki, N. Coordinated existence of multiple gangliosides is required for cartilage metabolism. Osteoarthr. Cartil. 2019, 27, 314–325. [Google Scholar] [CrossRef]
- Seito, N.; Yamashita, T.; Tsukuda, Y.; Matsui, Y.; Urita, A.; Onodera, T.; Mizutani, T.; Haga, H.; Fujitani, N.; Shinohara, Y.; et al. Interruption of glycosphingolipid synthesis enhances osteoarthritis development in mice. Arthritis Rheum. 2012, 64, 2579–2588. [Google Scholar] [CrossRef]
- Tsukuda, Y.; Iwasaki, N.; Seito, N.; Kanayama, M.; Fujitani, N.; Shinohara, Y.; Kasahara, Y.; Onodera, T.; Suzuki, K.; Asano, T.; et al. Ganglioside GM3 has an essential role in the pathogenesis and progression of rheumatoid arthritis. PLoS ONE 2012, 7, e40136. [Google Scholar] [CrossRef][Green Version]
- Varki, A.; Cummings, R.D.; Esko, J.D.; Stanley, P.; Hart, G.W.; Aebi, M.; Darvill, A.G.; Kinoshita, T.; Packer, N.H.; Prestegard, J.H.; et al. (Eds.) Essentials of Glycobiology, 3rd ed.; Cold Spring Harbor Laboratory Press: Cold Spring Harbor, NY, USA, 2015. [Google Scholar]
- Ishibashi, Y.; Kobayashi, U.; Hijikata, A.; Sakaguchi, K.; Goda, H.M.; Tamura, T.; Okino, N.; Ito, M. Preparation and characterization of EGCase I, applicable to the comprehensive analysis of GSLs, using a rhodococcal expression system. J. Lipid Res. 2012, 53, 2242–2251. [Google Scholar] [CrossRef]
- Mailhot, G.; Yang, M.; Mason-Savas, A.; Mackay, C.A.; Leav, I.; Odgren, P.R. BMP-5 expression increases during chondrocyte differentiation in vivo and in vitro and promotes proliferation and cartilage matrix synthesis in primary chondrocyte cultures. J. Cell. Physiol. 2008, 214, 56–64. [Google Scholar] [CrossRef] [PubMed]
- Gosset, M.; Berenbaum, F.; Thirion, S.; Jacques, C. Primary culture and phenotyping of murine chondrocytes. Nat. Protoc. 2008, 3, 1253–1260. [Google Scholar] [CrossRef] [PubMed]
- Rao, X.; Huang, X.; Zhou, Z.; Lin, X. An improvement of the 2ˆ (-delta delta CT) method for quantitative real-time polymerase chain reaction data analysis. Biostat. Bioinform. Biomath. 2013, 3, 71–85. [Google Scholar]
- Fujitani, N.; Takegawa, Y.; Ishibashi, Y.; Araki, K.; Furukawa, J.; Mitsutake, S.; Igarashi, Y.; Ito, M.; Shinohara, Y. Qualitative and quantitative cellular glycomics of glycosphingolipids based on rhodococcal endoglycosylceramidase-assisted glycan cleavage, glycoblotting-assisted sample preparation, and matrix-assisted laser desorption ionization tandem time-of-flight mass spectrometry analysis. J. Biol. Chem. 2011, 286, 41669–41679. [Google Scholar] [PubMed]
- Takegawa, Y.; Araki, K.; Fujitani, N.; Furukawa, J.; Sugiyama, H.; Sakai, H.; Shinohara, Y. Simultaneous analysis of heparan sulfate, chondroitin/dermatan sulfates, and hyaluronan disaccharides by glycoblotting-assisted sample preparation followed by single-step zwitter-ionic-hydrophilic interaction chromatography. Anal. Chem. 2011, 83, 9443–9449. [Google Scholar] [CrossRef] [PubMed]
- Furukawa, J.; Sakai, S.; Yokota, I.; Okada, K.; Hanamatsu, H.; Kobayashi, T.; Yoshida, Y.; Higashino, K.; Tamura, T.; Igarashi, Y.; et al. Quantitative GSL-glycome analysis of human whole serum based on an EGCase digestion and glycoblotting method. J. Lipid Res. 2015, 56, 2399–2407. [Google Scholar] [CrossRef]
- Miura, Y.; Shinohara, Y.; Furukawa, J.; Nagahori, N.; Nishimura, S.-I. Rapid and simple solid-phase esterification of sialic acid residues for quantitative glycomics by mass spectrometry. Chem. Weinh. Bergstr. Ger. 2007, 13, 4797–4804. [Google Scholar] [CrossRef]
- Eisen, M.B.; Spellman, P.T.; Brown, P.O.; Botstein, D. Cluster analysis and display of genome-wide expression patterns. Proc. Natl. Acad. Sci. USA 1998, 95, 14863–14868. [Google Scholar] [CrossRef]


© 2019 by the authors. Licensee MDPI, Basel, Switzerland. This article is an open access article distributed under the terms and conditions of the Creative Commons Attribution (CC BY) license (http://creativecommons.org/licenses/by/4.0/).
Share and Cite
Homan, K.; Hanamatsu, H.; Furukawa, J.-i.; Okada, K.; Yokota, I.; Onodera, T.; Iwasaki, N. Alteration of the Total Cellular Glycome during Late Differentiation of Chondrocytes. Int. J. Mol. Sci. 2019, 20, 3546. https://doi.org/10.3390/ijms20143546
Homan K, Hanamatsu H, Furukawa J-i, Okada K, Yokota I, Onodera T, Iwasaki N. Alteration of the Total Cellular Glycome during Late Differentiation of Chondrocytes. International Journal of Molecular Sciences. 2019; 20(14):3546. https://doi.org/10.3390/ijms20143546
Chicago/Turabian StyleHoman, Kentaro, Hisatoshi Hanamatsu, Jun-ichi Furukawa, Kazue Okada, Ikuko Yokota, Tomohiro Onodera, and Norimasa Iwasaki. 2019. "Alteration of the Total Cellular Glycome during Late Differentiation of Chondrocytes" International Journal of Molecular Sciences 20, no. 14: 3546. https://doi.org/10.3390/ijms20143546
APA StyleHoman, K., Hanamatsu, H., Furukawa, J.-i., Okada, K., Yokota, I., Onodera, T., & Iwasaki, N. (2019). Alteration of the Total Cellular Glycome during Late Differentiation of Chondrocytes. International Journal of Molecular Sciences, 20(14), 3546. https://doi.org/10.3390/ijms20143546