Free-Energy Calculations for Bioisosteric Modifications of A3 Adenosine Receptor Antagonists

 , , , and
Abstract
:
1. Introduction
2. Results and Discussion
3. Materials and Methods
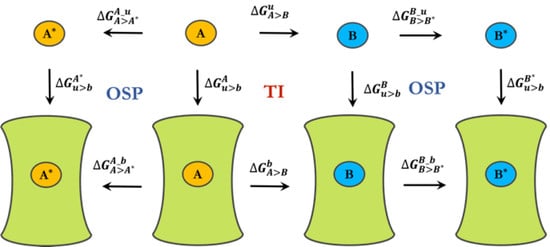
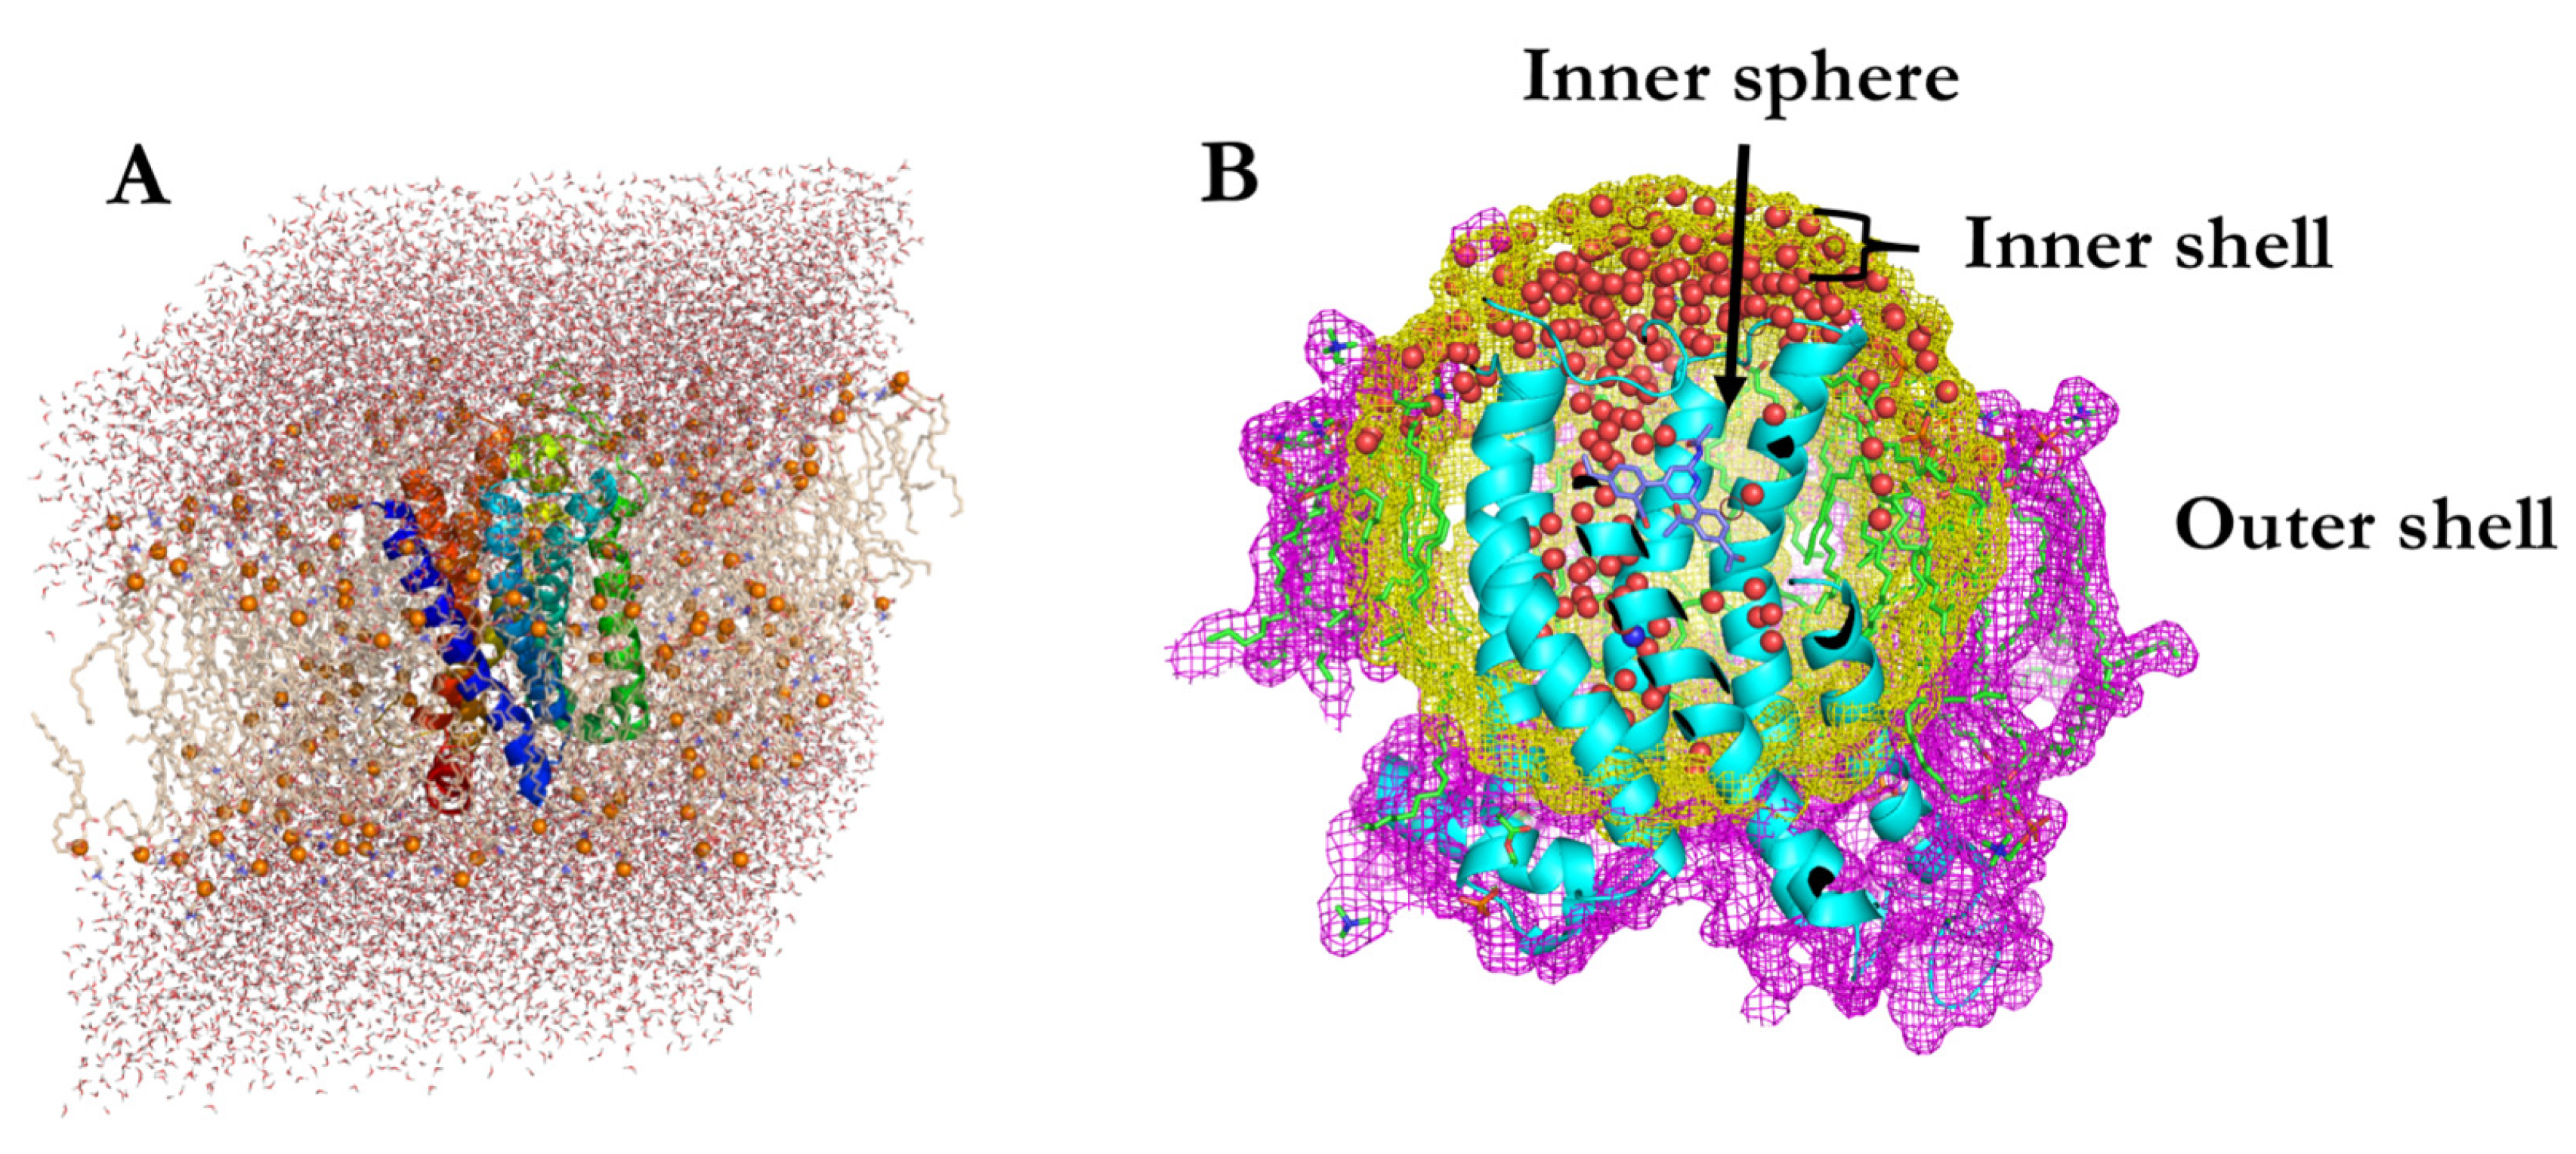
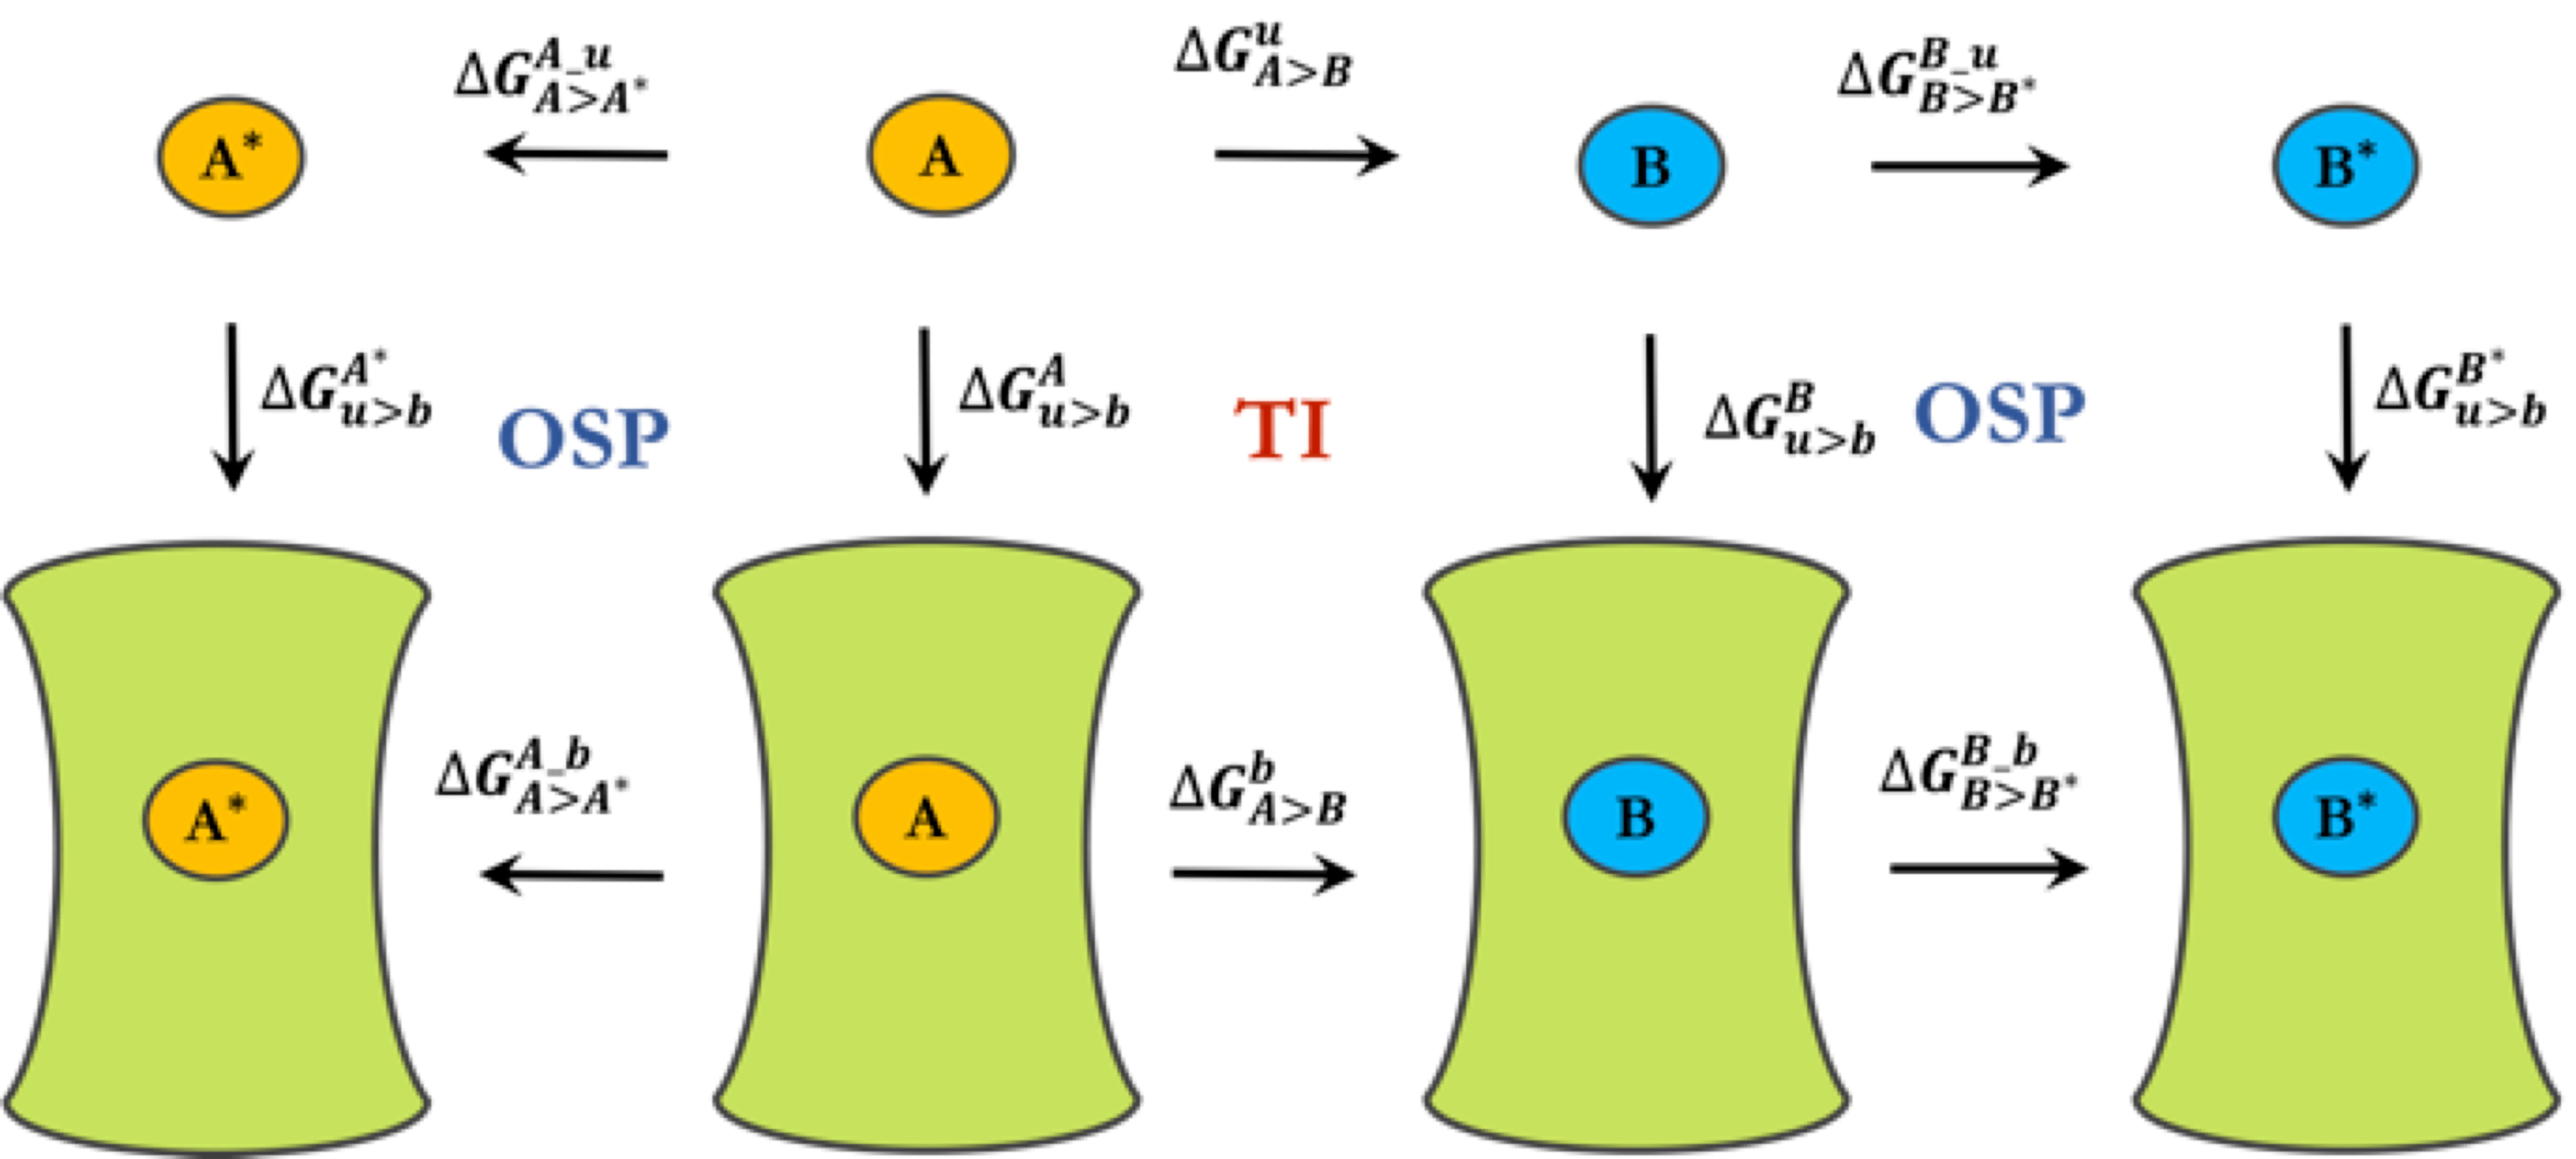
3.1. Spherical Boundary Conditions
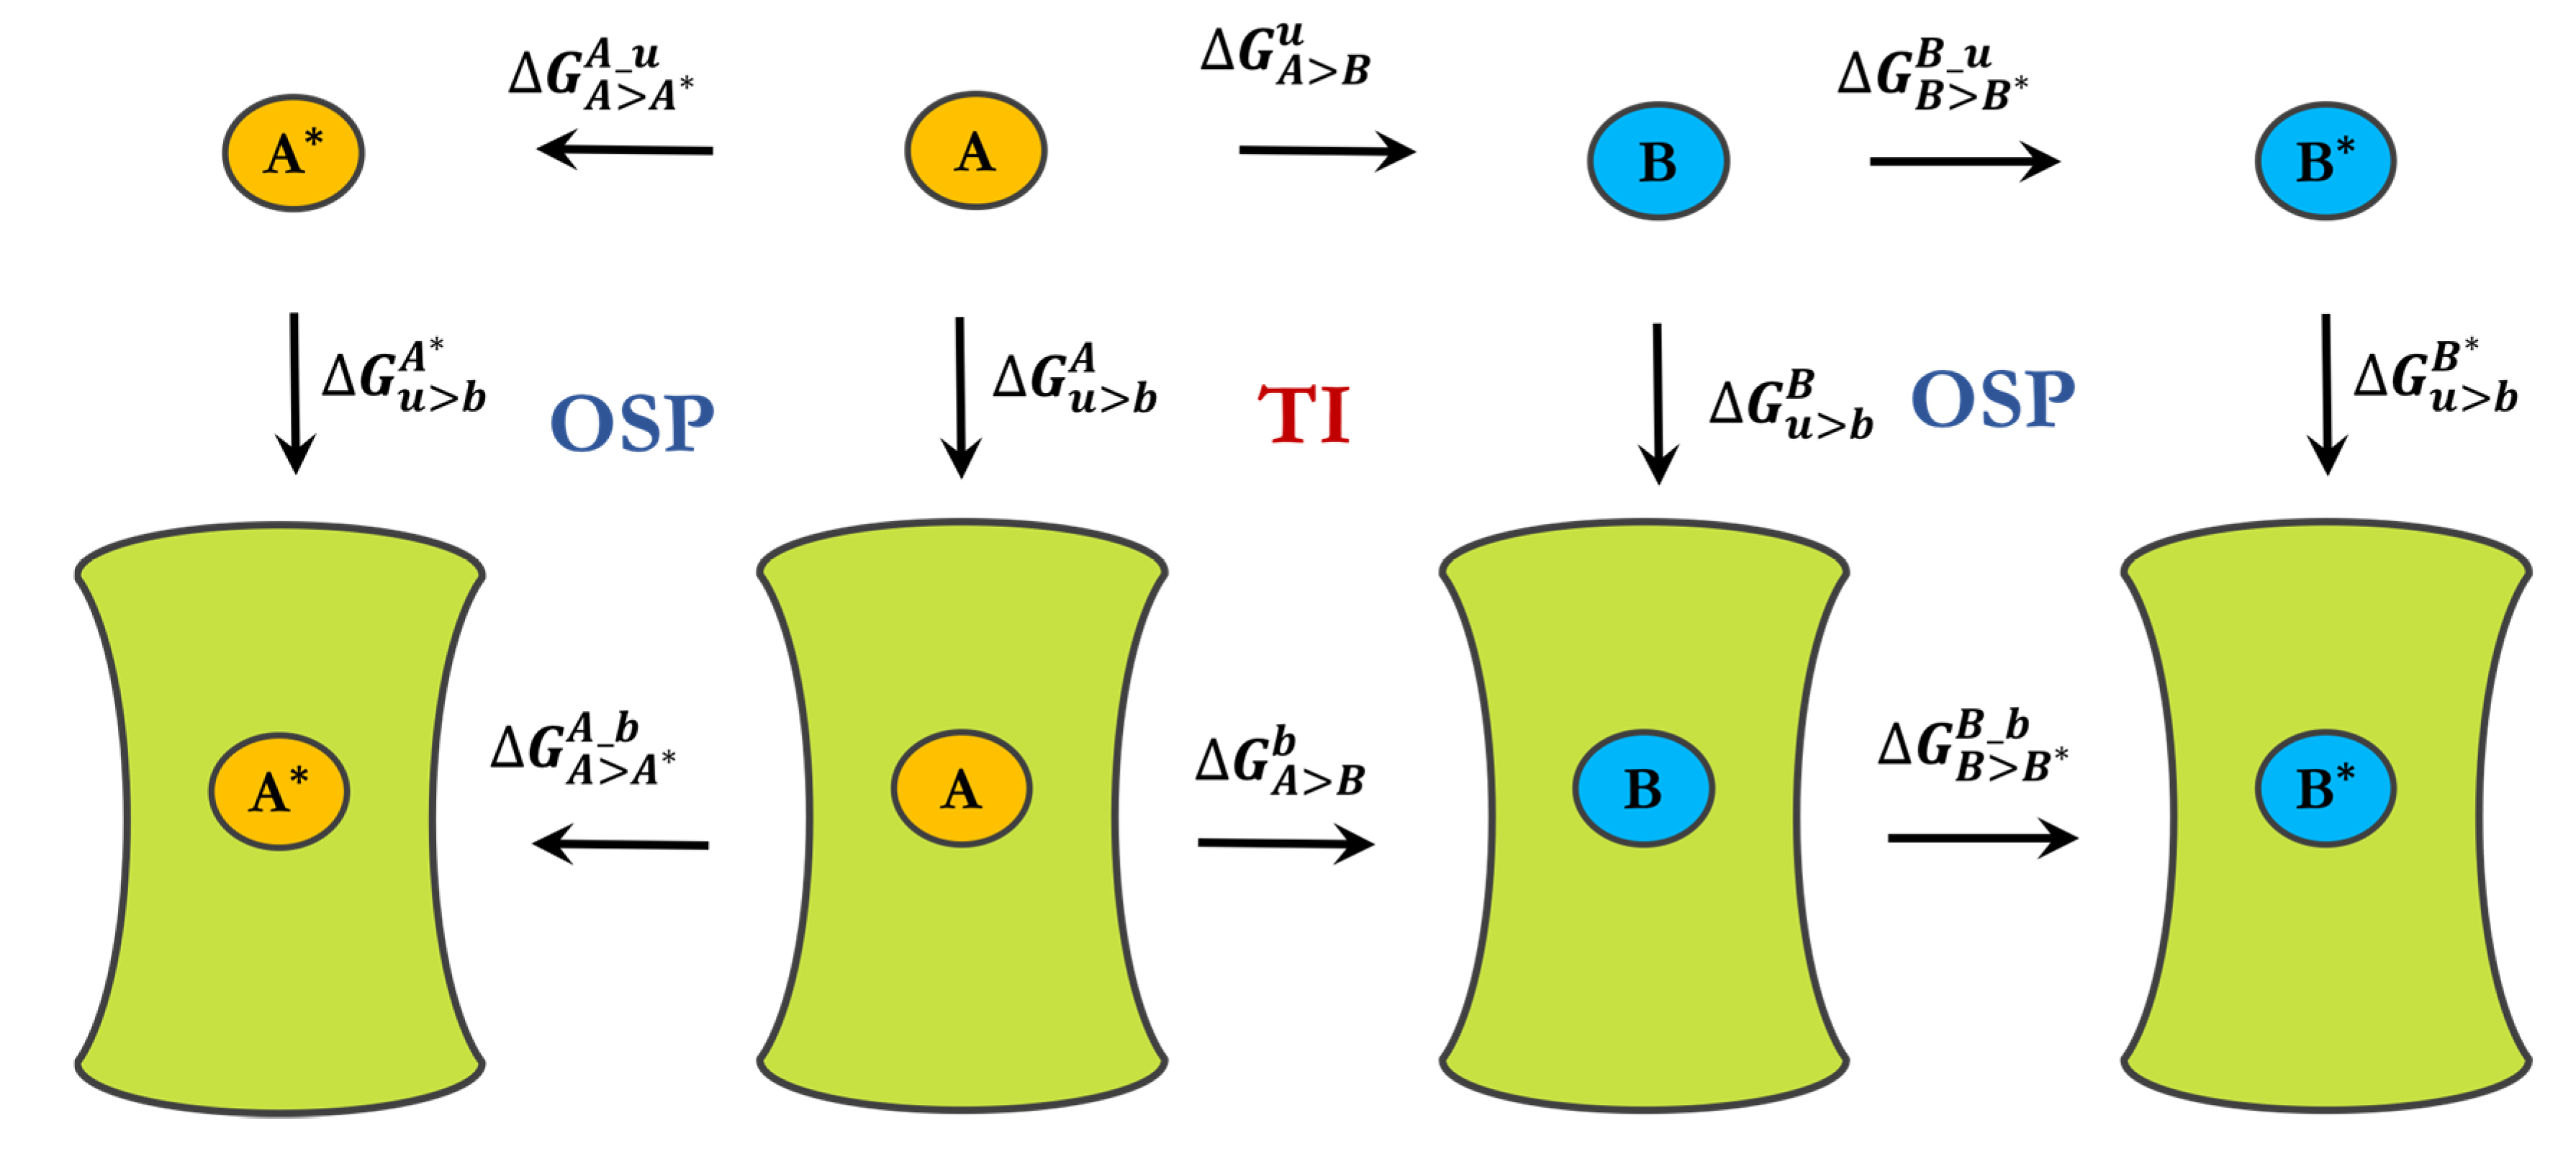
3.2. Free-Energy Calculations
4. Conclusions
Supplementary Materials
Author Contributions
Funding
Acknowledgments
Conflicts of Interest
Abbreviations
| A3AR | A3 Adenosine receptor |
| FEP | Free energy perturbation |
| GPCR | G protein-coupled receptor |
| MD | Molecular dynamics |
| POPC | 1-palmitoyl-2-oleoyl-sn-glycero-3-phosphocholine |
| SAR | Structure-activity relationships |
| TI | Thermodynamic integration |
References
- Fredholm, B.B.; Ijzerman, A.P.; Jacobson, K.A.; Linden, J.; Muller, C.E. International Union of Basic and Clinical Pharmacology. LXXXI. Nomenclature and Classification of Adenosine Receptors-An Update. Pharmacol. Rev. 2011, 63, 1–34. [Google Scholar] [CrossRef] [PubMed]
- Linden, J. Molecular approach to adenosine receptors: Receptor-mediated mechanisms of tissue protection. Ann. Rev. Pharmacol. Toxicol. 2001, 41, 775–787. [Google Scholar] [CrossRef] [PubMed]
- Haskó, G.; Linden, J.; Cronstein, B.; Pacher, P. Adenosine receptors: Therapeutic aspects for inflammatory and immune diseases. Nat. Rev. Drug Discov. 2008, 7, 759–770. [Google Scholar] [CrossRef] [PubMed]
- Mozzicato, S.; Joshi, B.V.; Jacobson, K.A.; Liang, B.T. Role of direct RhoA-phospholipase D1 interaction in mediating adenosine-induced protection from cardiac ischemia. FASEB J. 2004, 18, 406–408. [Google Scholar] [CrossRef] [PubMed]
- Salvatore, C.A.; Tilley, S.L.; Latour, A.M.; Fletcher, D.S.; Koller, B.H.; Jacobson, M.A. Disruption of the A 3 Adenosine Receptor Gene in Mice and Its Effect on Stimulated Inflammatory Cells. J. Biol. Chem. 2000, 275, 4429–4434. [Google Scholar] [CrossRef]
- Jordan, J.E.; Thourani, V.H.; Auchampach, J.A.; Robinson, J.A.; Wang, N.P.; Vinten-Johansen, J. A3 adenosine receptor activation attenuates neutrophil function and neutrophil-mediated reperfusion injury. Am. J. Physiol. Circ. Physiol. 1999, 277, 1895–1905. [Google Scholar] [CrossRef]
- Bouma, M.G.; Jeunhomme, T.M.; Boyle, D.L.; A Dentener, M.; Voitenok, N.N.; Van den Wildenberg, F.A.; A Buurman, W. Adenosine inhibits neutrophil degranulation in activated human whole blood: Involvement of adenosine A2 and A3 receptors. J. Immunol. 1997, 158, 5400–5408. [Google Scholar]
- Fishman, P.; Madi, L.; Bar-Yehuda, S.; Barer, F.; Del Valle, L.; Khalili, K. Evidence for involvement of Wnt signaling pathway in IB-MECA mediated suppression of melanoma cells. Oncogene 2002, 21, 4060–4064. [Google Scholar] [CrossRef]
- Lee, H.T.; Ota-Setlik, A.; Xu, H.; D’Agati, V.D.; Jacobson, M.A.; Emala, C.W. A 3 adenosine receptor knockout mice are protected against ischemia- and myoglobinuria-induced renal failure. Am. J. Physiol. Physiol. 2003, 284, 267. [Google Scholar] [CrossRef]
- Yaziji, V.; Rodríguez, D.; Gutiérrez-De-Terán, H.; Coelho, A.; Caamaño, O.; García-Mera, X.; Brea, J.; Loza, M.I.; Cadavid, M.I.; Sotelo, E.; et al. Pyrimidine Derivatives as Potent and Selective A3Adenosine Receptor Antagonists. J. Med. Chem. 2011, 54, 457–471. [Google Scholar] [CrossRef]
- Jespers, W.; Schiedel, A.C.; Heitman, L.H.; Cooke, R.M.; Kleene, L.; Van Westen, G.J.; Gloriam, D.E.; Müller, C.E.; Sotelo, E.; Gutiérrez-De-Terán, H. Structural Mapping of Adenosine Receptor Mutations: Ligand Binding and Signaling Mechanisms. Trends Pharmacol. Sci. 2018, 39, 75–89. [Google Scholar] [CrossRef] [PubMed]
- Gao, Z.G.; Chen, A.; Barak, D.; Kim, S.-K.; Müller, C.E.; Jacobson, K.A. Identification by Site-directed Mutagenesis of Residues Involved in Ligand Recognition and Activation of the Human A3 Adenosine Receptor. J. Biol. Chem. 2002, 277, 19056–19063. [Google Scholar] [CrossRef] [PubMed] [Green Version]
- Gutierrez-de-Teran, H.; Massink, A.; Rodriguez, D.; Liu, W.; Han, G.W.; Joseph, J.S.; Katritch, I.; Heitman, L.H.; Xia, L.; IJzerman, A.P.; et al. The Role of a Sodium Ion Binding Site in the Allosteric Modulation of the A(2A) Adenosine G Protein-Coupled Receptor. Structure 2013, 21, 2175–2185. [Google Scholar] [CrossRef] [PubMed]
- Azuaje, J.; Jespers, W.; Yaziji, V.; Mallo, A.; Majellaro, M.; Caamaño, O.; Loza, M.I.; Cadavid, M.I.; Brea, J.; Åqvist, J.; et al. Effect of Nitrogen Atom Substitution in A 3 Adenosine Receptor Binding: N-(4,6-Diarylpyridin-2-yl)acetamides as Potent and Selective Antagonists. J. Med. Chem. 2017, 60, 7502–7511. [Google Scholar] [CrossRef] [PubMed]
- Schmid, N.; Christ, C.D.; Christen, M.; Eichenberger, A.P.; Van Gunsteren, W.F. Architecture, implementation and parallelisation of the GROMOS software for biomolecular simulation. Comput. Phys. Commun. 2012, 183, 890–903. [Google Scholar] [CrossRef]
- Reif, M.M.; Winger, M.; Oostenbrink, C. Testing of the GROMOS Force-Field Parameter Set 54A8: Structural Properties of Electrolyte Solutions, Lipid Bilayers, and Proteins. J. Chem. Theory Comput. 2013, 9, 1247–1264. [Google Scholar] [CrossRef] [PubMed]
- Marelius, J.; Kolmodin, K.; Feierberg, I.; Åqvist, J. Q: A molecular dynamics program for free energy calculations and empirical valence bond simulations in biomolecular systems. J. Mol. Graph. Model. 1998, 16, 213–225. [Google Scholar] [CrossRef]
- Robertson, M.J.; Tirado-Rives, J.; Jorgensen, W.L. Improved Peptide and Protein Torsional Energetics with the OPLS-AA Force Field. J. Chem. Theory Comput. 2015, 11, 3499–3509. [Google Scholar] [CrossRef]
- Harder, E.; Damm, W.; Maple, J.; Wu, C.; Reboul, M.; Xiang, J.Y.; Wang, L.; Lupyan, D.; Dahlgren, M.K.; Knight, J.L.; et al. OPLS3: A Force Field Providing Broad Coverage of Drug-like Small Molecules and Proteins. J. Chem. Theory Comput. 2016, 12, 281–296. [Google Scholar] [CrossRef]
- Piirainen, H.; Ashok, Y.; Nanekar, R.T.; Jaakola, V.P. Structural features of adenosine receptors: From crystal to function. Biochim. Biophys. Acta (BBA) Biomembr. 2011, 1808, 1233–1244. [Google Scholar] [CrossRef] [Green Version]
- Lai, B.; Oostenbrink, C. Binding free energy, energy and entropy calculations using simple model systems. Theor. Chem. Accounts 2012, 131, 131. [Google Scholar] [CrossRef]
- Nørholm, A.B.; Francotte, P.; Goffin, E.; Botez, I.; Danober, L.; Lestage, P.; Pirotte, B.; Kastrup, J.S.; Olsen, L.; Oostenbrink, C. Thermodynamic Characterization of New Positive Allosteric Modulators Binding to the Glutamate Receptor A2 Ligand-Binding Domain: Combining Experimental and Computational Methods Unravels Differences in Driving Forces. J. Chem. Inf. Model. 2014, 54, 3404–3416. [Google Scholar] [CrossRef] [PubMed]
- Lai, B.; Nagy, G.; Antonio Garate, J.; Oostenbrink, C. Entropic and Enthalpic Contributions to Stereospecific Ligand Binding from Enhanced Sampling Methods. J. Chem. Inf. Model. 2014, 54, 151–158. [Google Scholar] [CrossRef] [PubMed]
- Bortolato, A.; Tehan, B.G.; Bodnarchuk, M.S.; Essex, J.W.; Mason, J.S. Water Network Perturbation in Ligand Binding: Adenosine A(2A) Antagonists as a Case Study. J. Chem. Inf. Model. 2013, 53, 1700–1713. [Google Scholar] [CrossRef] [PubMed]
- Perozzo, R.; Folkers, G.; Scapozza, L. Thermodynamics of Protein–Ligand Interactions: History, Presence, and Future Aspects. J. Recept. Signal Transduct. 2004, 24, 1–52. [Google Scholar] [CrossRef]
- Jaakola, V.P.; Griffith, M.T.; Hanson, M.A.; Cherezov, V.; Chien, E.Y.T.; Lane, J.R.; Ijzerman, A.P.; Stevens, R.C. The 2.6 Angstrom Crystal Structure of a Human A2A Adenosine Receptor Bound to an Antagonist. Science 2008, 322, 1211–1217. [Google Scholar] [CrossRef] [PubMed]
- Poger, D.; Mark, A.E. On the Validation of Molecular Dynamics Simulations of Saturated and cis-Monounsaturated Phosphatidylcholine Lipid Bilayers: A Comparison with Experiment. J. Chem. Theory Comput. 2010, 6, 325–336. [Google Scholar] [CrossRef] [PubMed]
- Schrödinger Ltd. The PyMOL Molecular Graphics System, version 1.8. 2015.
- Berendsen, H.J.C.; Postma, J.P.M.; van Gunsteren, W.F.; Hermans, J. Interaction Models for Water in Relation to Protein Hydration. In Intermolecular Forces, Proceedings of the Fourteenth Jerusalem Symposium on Quantum Chemistry and Biochemistry Held in Jerusalem, Jerusalem, Israel, 13–16 April 1981; Pullman, B., Ed.; Springer: Berlin/Heidelberg, Germany, 1981; pp. 331–342. [Google Scholar]
- Reif, M.M.; Hünenberger, P.H.; Oostenbrink, C. New Interaction Parameters for Charged Amino Acid Side Chains in the GROMOS Force Field. J. Chem. Theory Comput. 2012, 8, 3705–3723. [Google Scholar] [CrossRef]
- Amadei, A.; Chillemi, G.; Ceruso, M.A.; Grottesi, A.; Di Nola, A. Molecular dynamics simulations with constrained roto-translational motions: Theoretical basis and statistical mechanical consistency. J. Chem. Phys. 2000, 112, 9–23. [Google Scholar] [CrossRef] [Green Version]
- Heinz, T.N.; Hünenberger, P.H. A fast pairlist-construction algorithm for molecular simulations under periodic boundary conditions. J. Comput. Chem. 2004, 25, 1474–1486. [Google Scholar] [CrossRef]
- Berendsen, H.J.; Postma, J.V.; DiNola, A.; Haak, J.R.; Van Gunsteren, W.F. Molecular dynamics with coupling to an external bath. J. Chem. Phys. 1984, 81, 3684. [Google Scholar] [CrossRef]
- Ryckaert, J.P.; Ciccotti, G.; Berendsen, H.J. Numerical integration of the cartesian equations of motion of a system with constraints: Molecular dynamics of n-alkanes. J. Comput. Phys. 1977, 23, 327–341. [Google Scholar] [CrossRef]
- Tironi, I.G.; Sperb, R.; Smith, P.E.; Van Gunsteren, W.F. A generalized reaction field method for molecular dynamics simulations. J. Chem. Phys. 1995, 102, 5451–5459. [Google Scholar] [CrossRef]
- Heinz, T.N.; van Gunsteren, W.F.; Hünenberger, P.H. Comparison of four methods to compute the dielectric permittivity of liquids from molecular dynamics simulations. J. Chem. Phys. 2001, 115, 1125–1136. [Google Scholar] [CrossRef]
- Kirkwood, J.G. Statistical Mechanics of Fluid Mixtures. J. Chem. Phys. 1935, 3, 300. [Google Scholar] [CrossRef]
- de Ruiter, A.; Boresch, S.; Oostenbrink, C. Comparison of thermodynamic integration and Bennett’s acceptance ratio for calculating relative protein-ligand binding free energies. J. Comput. Chem. 2013, 34, 1024–1034. [Google Scholar] [CrossRef] [PubMed]
- Beutler, T.C.; Mark, A.E.; Van Schaik, R.C.; Gerber, P.R.; Van Gunsteren, W.F. Avoiding singularities and numerical instabilities in free energy calculations based on molecular simulations. Chem. Phys. Lett. 1994, 222, 529–539. [Google Scholar] [CrossRef]
- Zwanzig, R.W. High-Temperature Equation of State by a Perturbation Method. I. Nonpolar Gases. J. Chem. Phys. 1954, 22, 1420–1426. [Google Scholar] [CrossRef]


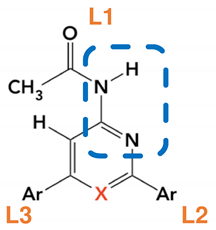 | Ligand Annotation | Ar |
| a | Ph | |
| d | 4-MeCO-Ph | |
| g | 4-MeO-Ph | |
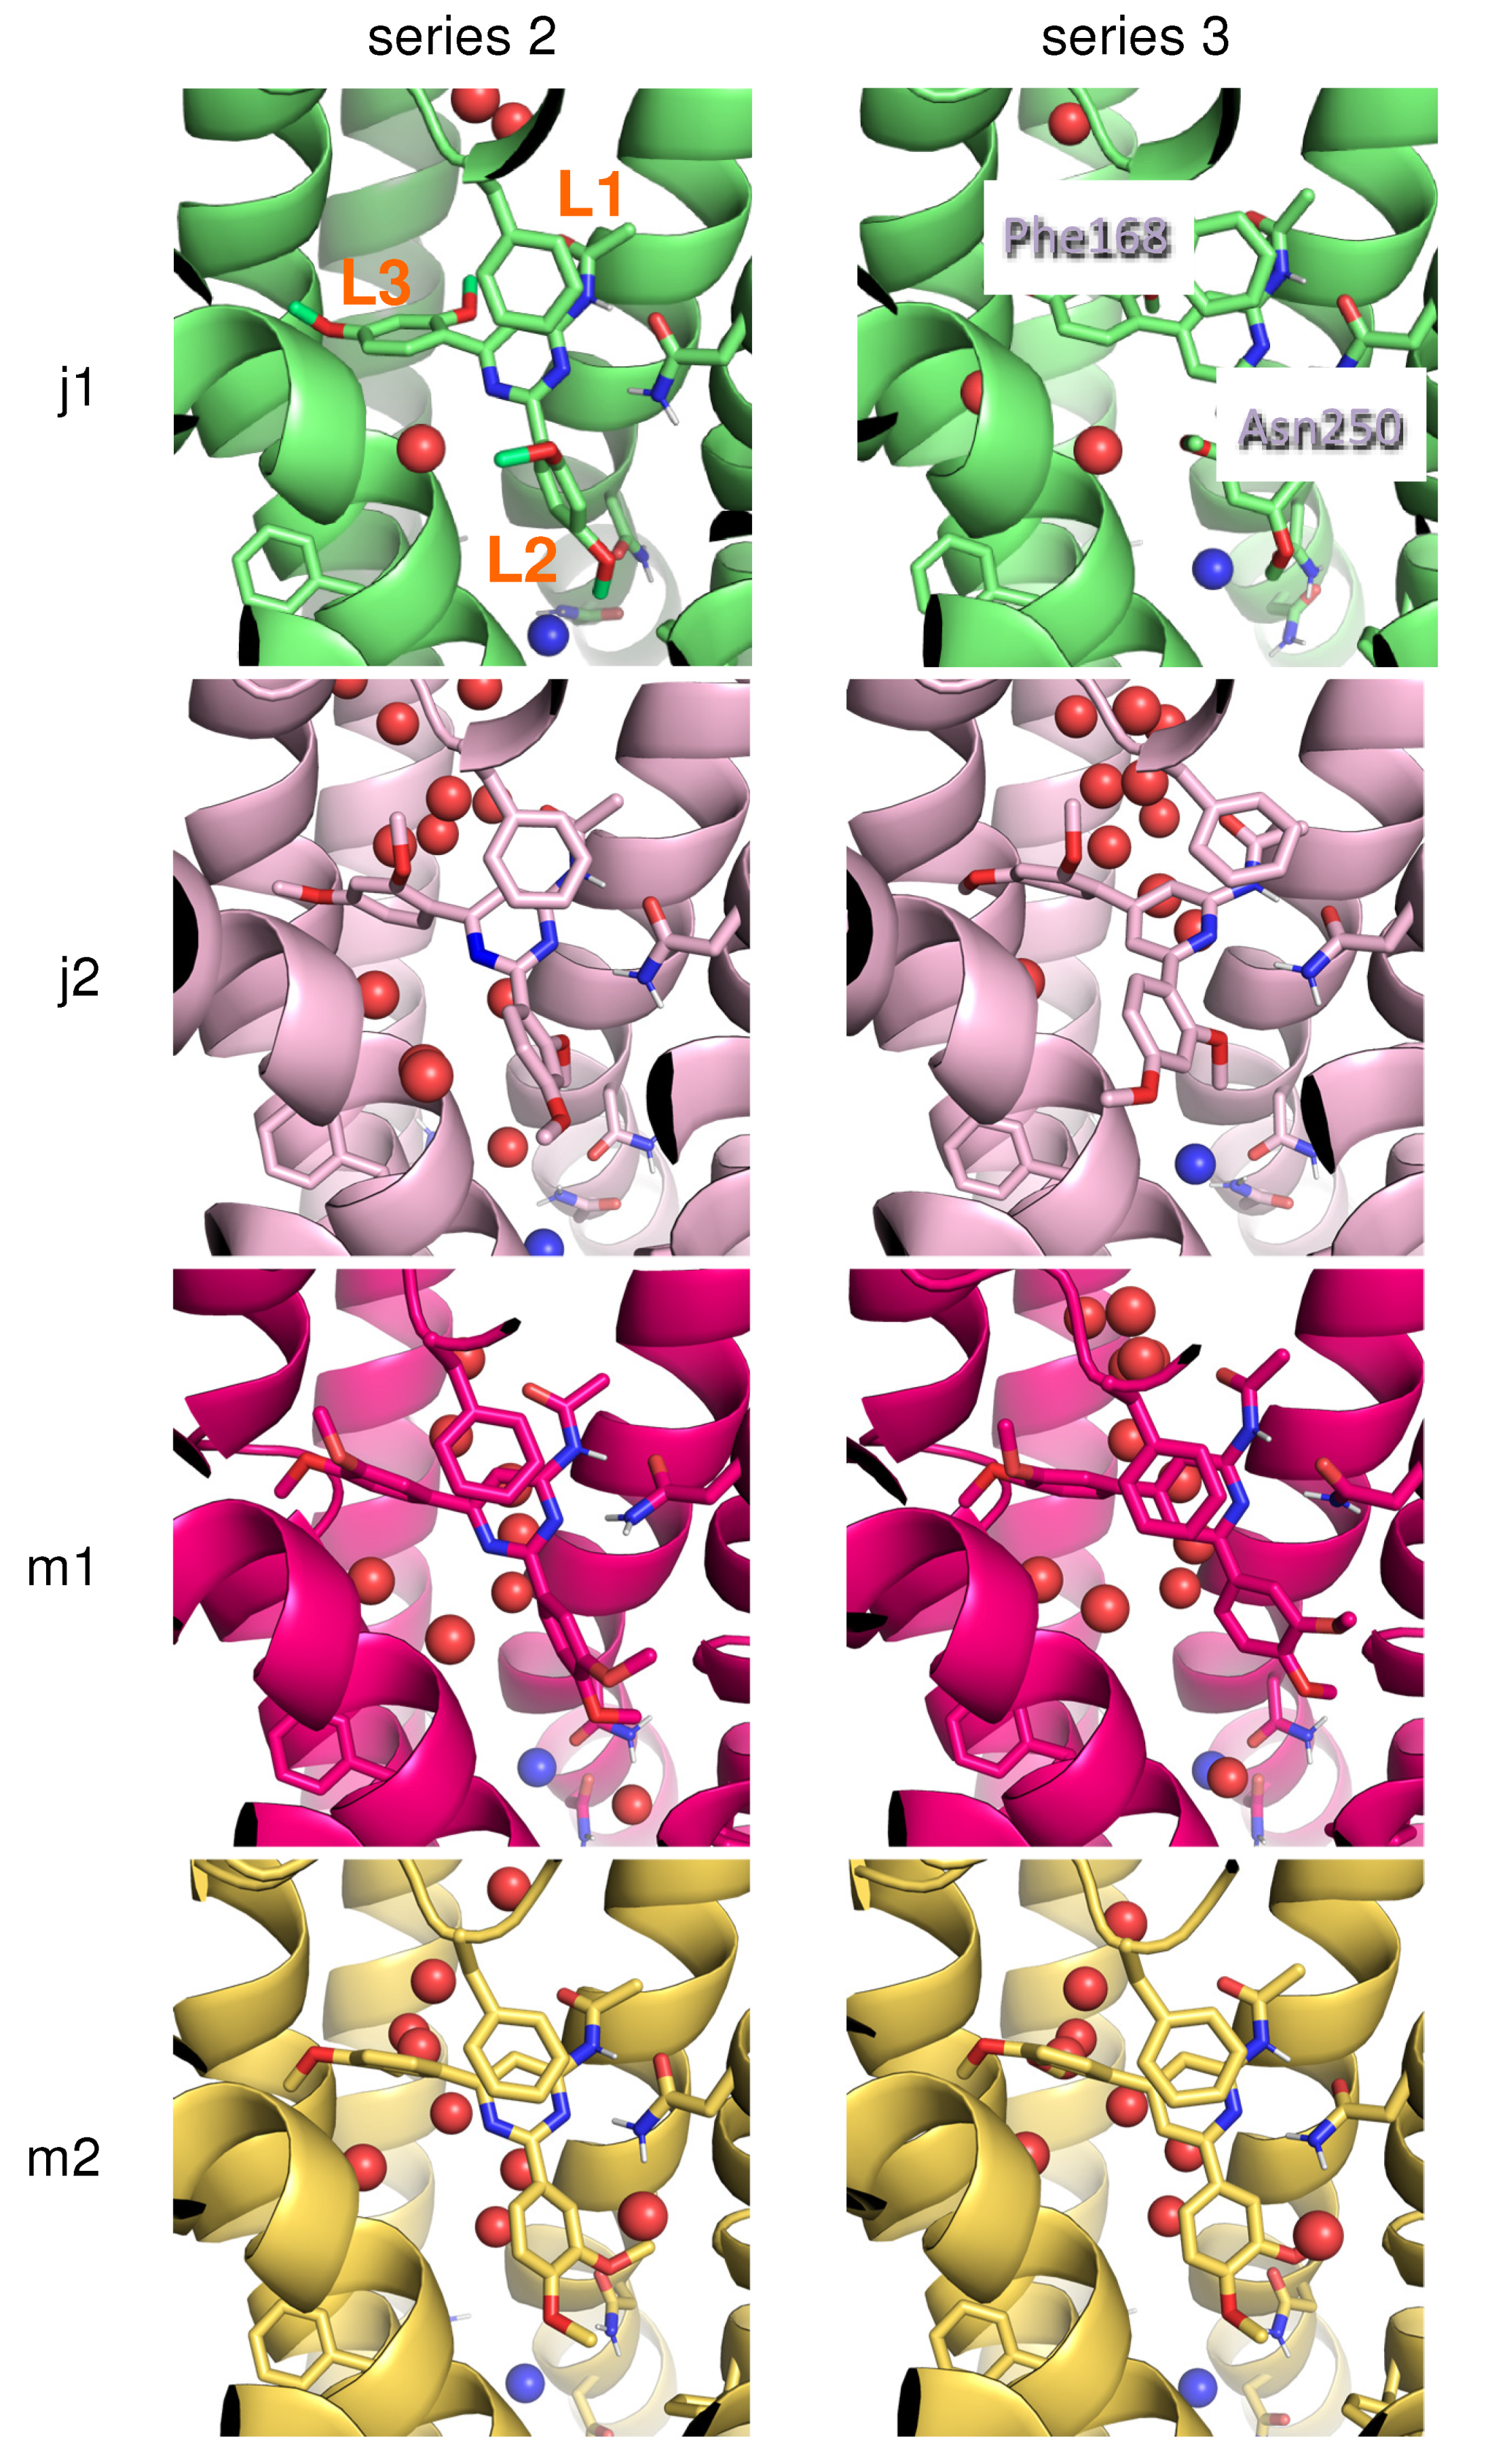
| j | 2,4-MeO-Ph | |
| m | 3,4-MeO-Ph |
| Alchemical Change | ΔΔGu>b (calc)a [kJ/mol] | ΔΔGu>b (exp) [kJ/mol] | ΔΔGu>b (calc)b [kJ/mol] |
|---|---|---|---|
| 2a→3a | 5.4 | 5.2 | 7.7 |
| 2d→3d | 1.8 | −3.1 | |
| 2g→3g | 5.6 | 8.4 | 13.3 |
| 2j1 → 3j1 | 0.6 | >12.9 | −6.5c |
| 2j2→3j2 | 7.6 | >12.9 | 26.4d |
| 2m1→3m1 | 1.1 | 1 | |
| 2m2→3m2 | 1.5 | 1 |
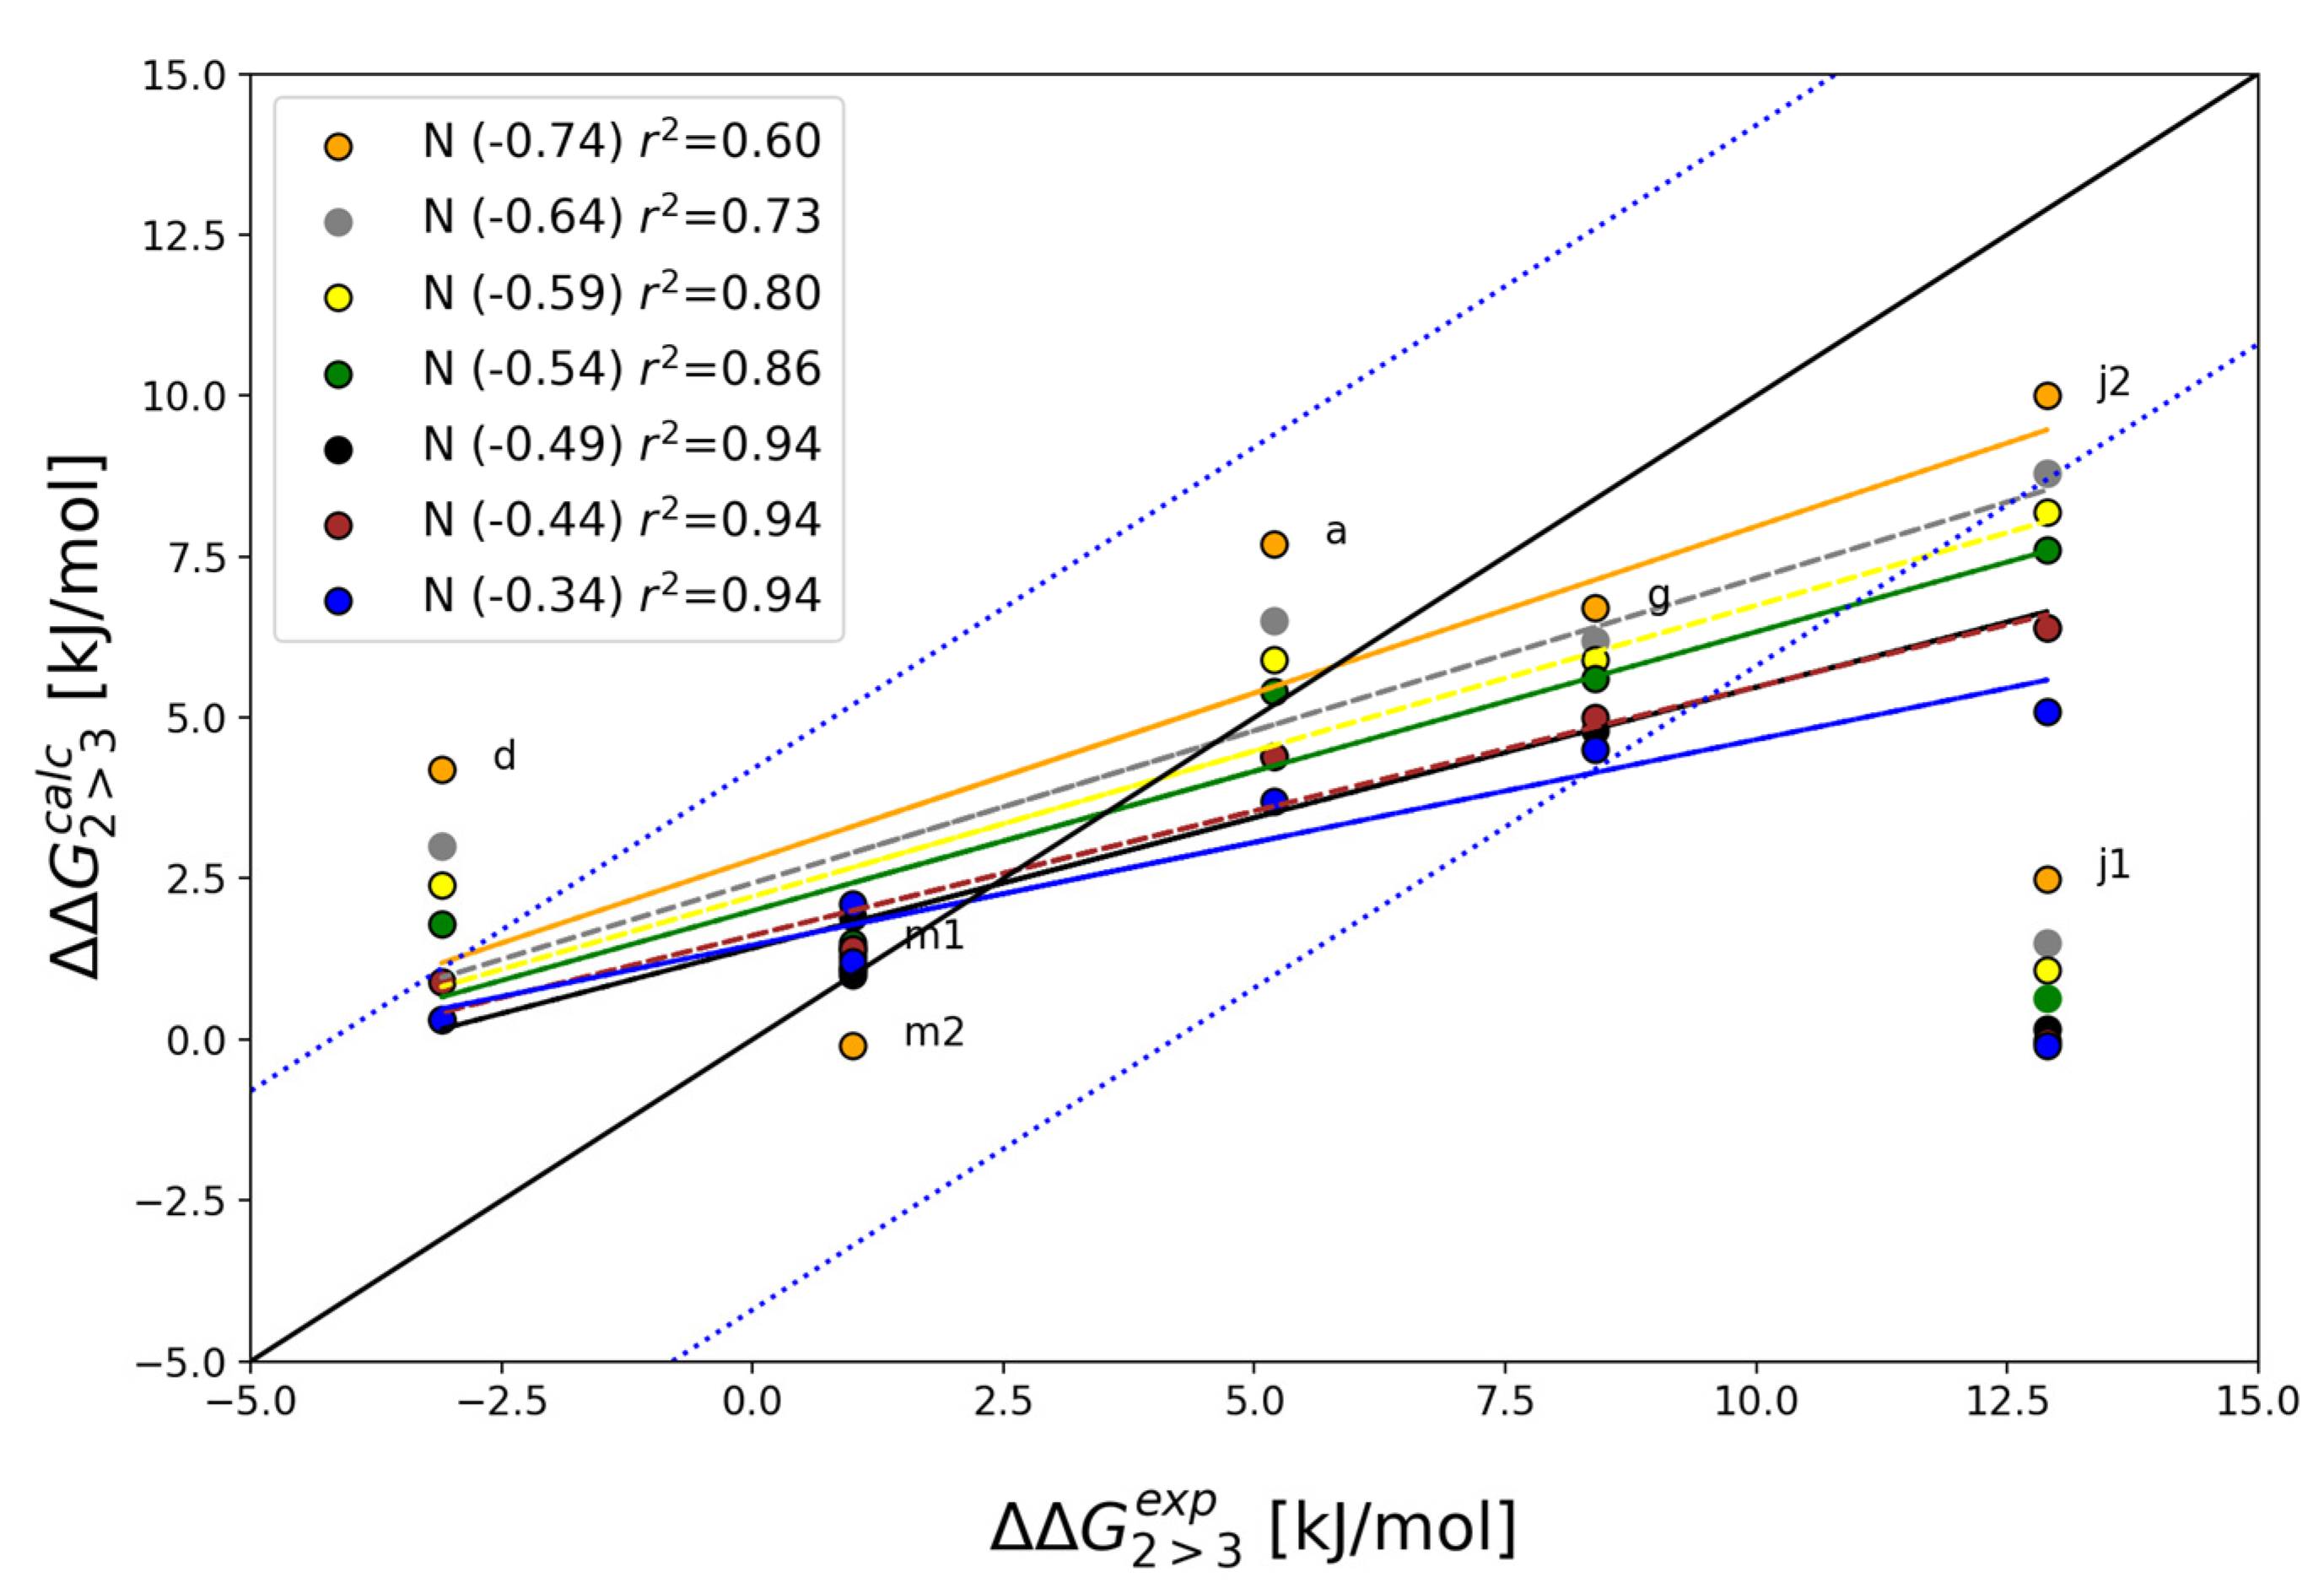
| Alchemical Change | N1 Charge | ||||||
|---|---|---|---|---|---|---|---|
| −0.74 | −0.64 | −0.59 | −0.54a | −0.49 | −0.44 | −0.34 | |
| 2a→3a | 7.7 | 6.5 | 5.9 | 5.4 | 4.4 | 4.4 | 3.7 |
| 2d→3d | 4.2 | 3 | 2.4 | 1.8 | 0.3 | 0.9 | 0.3 |
| 2g→3g | 6.7 | 6.2 | 5.9 | 5.6 | 4.8 | 5.0 | 4.5 |
| 2j1 → 3j1 | 2.5 | 1.5 | 1.1 | 0.6 | 0.2 | 0.0 | −0.1 |
| 2j2→3j2 | 10.0 | 8.8 | 8.2 | 7.6 | 6.4 | 6.4 | 5.1 |
| 2m1→3m1 | 1.4 | 1.1 | 1.1 | 1.1 | 1.0 | 1.4 | 2.1 |
| 2m2→3m2 | −0.1 | 1 | 1.3 | 1.5 | 1.9 | 1.4 | 1.2 |
| MAEb | 3.0 | 2.4 | 2.2 | 2.1 | 2.1 | 2.2 | 2.4 |
| r2 c | 0.60 | 0.73 | 0.80 | 0.86 | 0.94 | 0.94 | 0.94 |
| Alchemical Change | Ligand in Water | Ligand in Protein | Ligand in Protein - Ligand in Water | ||||||
|---|---|---|---|---|---|---|---|---|---|
| ∆E | σΔEa | T∆S | ∆E | σΔEa | T∆S | ∆∆E | σΔEa | T∆∆S | |
| 2a→3a | −88.9 | 0.5 | −6.1 | −78.7 | 2.0 | −1.4 | 10.1 | 2.0 | 4.8 |
| 2d→3d | −88.6 | 0.5 | −6.0 | −90.3 | 3.3 | −9.5 | −1.7 | 3.3 | −3.5 |
| 2g→3g | −88.5 | 0.5 | −5.6 | −79.4 | 1.2 | −2.1 | 9.1 | 1.3 | 3.5 |
| 2j1 → 3j1 | 9.8 | 0.7 | 1.3 | 0.5 | 2.3 | −8.6 | −9.3 | 2.4 | −9.9 |
| 2j2→3j2 | 8.0 | 0.6 | −0.3 | 7.9 | 1.7 | −8.0 | −0.1 | 1.8 | −7.7 |
| 2m1→3m1 | −93.2 | 0.8 | −8.7 | −93.5 | 5.4 | −10.0 | −0.3 | 5.5 | −1.4 |
| 2m2→3m2 | −91.6 | 0.8 | −7.2 | −94.5 | 1.3 | −11.7 | −2.9 | 1.5 | −4.4 |
© 2019 by the authors. Licensee MDPI, Basel, Switzerland. This article is an open access article distributed under the terms and conditions of the Creative Commons Attribution (CC BY) license (http://creativecommons.org/licenses/by/4.0/).
Share and Cite
Jandova, Z.; Jespers, W.; Sotelo, E.; Gutiérrez-de-Terán, H.; Oostenbrink, C. Free-Energy Calculations for Bioisosteric Modifications of A3 Adenosine Receptor Antagonists. Int. J. Mol. Sci. 2019, 20, 3499. https://doi.org/10.3390/ijms20143499
Jandova Z, Jespers W, Sotelo E, Gutiérrez-de-Terán H, Oostenbrink C. Free-Energy Calculations for Bioisosteric Modifications of A3 Adenosine Receptor Antagonists. International Journal of Molecular Sciences. 2019; 20(14):3499. https://doi.org/10.3390/ijms20143499
Chicago/Turabian StyleJandova, Zuzana, Willem Jespers, Eddy Sotelo, Hugo Gutiérrez-de-Terán, and Chris Oostenbrink. 2019. "Free-Energy Calculations for Bioisosteric Modifications of A3 Adenosine Receptor Antagonists" International Journal of Molecular Sciences 20, no. 14: 3499. https://doi.org/10.3390/ijms20143499