Article

Genome-Wide Identification and Expression Profiling of the Polygalacturonase (PG) and Pectin Methylesterase (PME) Genes in Grapevine (Vitis vinifera L.)

1
State Key Laboratory of Crop Genetics and Germplasm Enhancement, Ministry of Science and Technology/College of Horticulture, Nanjing Agricultural University, Nanjing 210095, China
2
Ottawa Research and Development Centre, Agriculture and Agri-Food Canada, Ottawa, ON K1A 0C6, Canada
3
Key laboratory of Genetics and Fruit Development, College of Horticulture, Nanjing Agricultural University, Nanjing 210095, China
4
College of Life Science, Nanjing Agricultural University, Nanjing 210095, China
*
Author to whom correspondence should be addressed.
These authors contributed equally to this work.
Int. J. Mol. Sci. 2019, 20(13), 3180; https://doi.org/10.3390/ijms20133180
Submission received: 19 May 2019 / Revised: 21 June 2019 / Accepted: 27 June 2019 / Published: 28 June 2019
(This article belongs to the Special Issue Plant Genomics 2019)

Abstract

:
In pectin regulation, polygalacturonases (PGs) and pectin methylesterases (PMEs) are critical components in the transformation, disassembly network, and remodeling of plant primary cell walls. In the current study, we identified 36 PG and 47 PME genes using the available genomic resources of grapevine. Herein, we provide a comprehensive overview of PGs and PMEs, including phylogenetic and collinearity relationships, motif and gene structure compositions, gene duplications, principal component analysis, and expression profiling during developmental stages. Phylogenetic analysis of PGs and PMEs revealed similar domain composition patterns with Arabidopsis. The collinearity analysis showed high conservation and gene duplications with purifying selection. The type of duplications also varied in terms of gene numbers in PGs (10 dispersed, 1 proximal, 12 tandem, and 13 segmental, respectively) and PMEs (23 dispersed, 1 proximal, 16 tandem, and 7 segmental, respectively). The tissue-specific response of PG and PME genes based on the reported transcriptomic data exhibited diverged expression patterns in various organs during different developmental stages. Among PGs, VvPG8, VvPG10, VvPG13, VvPG17, VvPG18, VvPG19, VvPG20, VvPG22, and VvPG23 showed tissue- or organ-specific expression in majority of the tissues during development. Similarly, in PMEs, VvPME3, VvPME4, VvPME5, VvPME6, VvPME19, VvPME21, VvPME23, VvPME29, VvPME31, and VvPME32 suggested high tissue-specific response. The gene ontology (GO), Kyoto Encyclopedia of Genes and Genomics (KEGG) enrichment, and cis-elements prediction analysis also suggested the putative functions of PGs and PMEs in plant development, such as pectin and carbohydrate metabolism, and stress activities. Moreover, qRT-PCR validation of 32 PG and PME genes revealed their role in various organs of grapevines (i.e., root, stem, tendril, inflorescence, flesh, skins, and leaves). Therefore, these findings will lead to novel insights and encourage cutting-edge research on functional characterization of PGs and PMEs in fruit crop species.

1. Introduction

Plant cell walls are mainly composed of various interacting networks of carbohydrate polymers, such as polymers of cellulose, hemicellulose, and pectins [1]. These are produced by the plant cells before being systemically delivered to the apoplast tissues [2], providing support and mechanical strength to the plants. However, the disruption of the cell wall structure exposes fruit crops to disorders, such as softening and susceptibility to diseases [3]. Until now, several studies have shown multiple associated roles linked to pectin degradation enzymes in plants. In particular, polygalacturonase (PGs; EC 3.2.1.15) hydrolytic enzymes are involved in plant organ cell separation events, reproductive developments, leaf morphology, and organ shedding [4,5,6,7]. Furthermore, expression profiling, both at a temporal and spatial level, has revealed that transcript accumulations are also responsible for cell wall softening during abscission, ripening, and dehiscence [8]. Moreover, these correlation analyses are useful for identifying cell wall sites during disassembly and studying the transcriptional patterns of key genes in cell-wall degrading enzymes [5]. In Arabidopsis, during different developmental stages, several members of PGs can be detected by real-time PCR (RT-PCR) in various organs, such as roots, leaves, pollen tubes, flowers, and siliques [9,10]. In addition, few members of PGs have been functionally characterized in some fruit crop species, such as grapevine (VvPG1 and VvPG2), apple (MdPG36), banana (MAPG1 to MAPG4), and pear (PcPGl and PcPG3) [11,12,13,14]. However, the silencing of FaPG1 gene in strawberries declines the halt of the middle lamella and reduces fruit softening [15]. In pears and bananas, the softening of fruits is regulated by Pc-PG1 and Pc-PG2 as well as MaPG3 and MaPG4, in an ethylene-dependent pattern [16,17].
Pectin methylesterases (PMEs; EC 3.1.1.11) are also hydrolytic enzymes present in plants, which play a pivotal role in the firmness and softening of the cell walls, specifically through remodeling and disassembly of pectin [18,19]. The PMEs also play a crucial role in plant development, including fruit maturity, pollen development, pollen tube growth, and other growth-related factors [20,21]. However, the activity of both PGs and PMEs during fruit softening is largely unknown and various studies have shown their contradictory actions [22,23]. PGs in plants contain three groups, namely class A, B, and C, whereas the PMEs are categorized into two main types, namely type I and type II [19,24]. PGs and PMEs are a major gene family and have extensively been studied in various crops, including Brassica rapa, Gossypium species, Arabidopsis thaliana, Solanum lycopersicum, Malus domestica, Cucumis sativus, and Citrullus lanatus [5,11,25,26,27,28].
Grapevine (Vitis vinifera L.) is one of the most important woody fruit crop resource in the world [29]. They have become widely popular due to their nutritional value and health benefits. Improving the grapevine berry quality is a crucial issue, and the availability of the grapevine genome (Version 2.1) provides an excellent opportunity for its genetic study, momentously facilitating research in grapevine biology. In grapevine, the members of PGs and PMEs have not yet been comprehensively identified by genome-wide analysis and their elucidation is largely unknown. In this study, we utilized genomic resources to characterize PGs and PMEs in grapevine by various bioinformatic tools. In total, 36 PG and 47 PME genes were identified in grapevine and compared with Arabidopsis in order to test their domain composition. The expression patterns of genes provide valuable clues for understanding their functions. We also tested 32 PG and PME genes for various organs of grapevine, and their correlation factors were further compared. Overall, our study provides a brief understanding of the pectin-related genes in grapevine, and their substantial role in regulating organs during different developmental stages.

2. Results

2.1. Identification of PGs and PMEs in Grapevine

A total of 36 PG and 47 PME genes were identified from the grapevine genome through orthologues analysis with Arabidopsis (Table S1). These genes were designated as VvPG1-VcPG36 for PGs and VvPME1-VcPME46 for PMEs according to the previously reported nomenclature system with slight modification. The corresponding UNIPROT gene IDs are also listed in Table 1. A brief summary of the basic information for both PGs and PMEs in grapevine, apple, peach, and citrus is shown in Tables S1 and S2, where the basic features include the protein identifier, CDS length (bp), and protein properties (i.e., protein length (aa), molecular weight (kDa), isoelectric point (PIs), and grand average of hydropathicity (GRAVY)). Additionally, gene duplication types and subcellular predictions were also explored for each protein of PGs and PMEs in grapevine. In general, the coding sequence length of these genes varied from 999–3702 bp for PGs and 768–2463 bp for PMEs, while the protein length ranged from 332–1233 aa for PGs and 255–820 aa for PMEs, respectively. Moreover, the kDa ranged from 36.38–135.75 for PGs and 28.12–90.85 for PMEs, while the PIs varied from 4.73–9.74 for PGs and 5.17–9.97 for PMEs. Additionally, the results of GRAVY reveal that both PGs and PMEs are hydrophilic and hydrophobic in nature. Although most showed hydrophobic properties with negative values, a limited number showed positive hydrophobic properties. Protein subcellular predications also confirmed that the majority of PGs and PMEs occurred in the nucleus, endoplasmic reticulum, cytoplasm, plasma membrane, and mitochondria among ohers, which are listed in Table S1. Moreover, the types of duplications also varied in terms of gene numbers in PGs (10 dispersed, 1 proximal, 12 tandem, and 13 segmental, respectively) and PMEs (23 dispersed, 1 proximal, 16 tandem, and 7 segmental, respectively). Hence, the observed variations in various properties among PGs and PMEs implies that these genes may function contrarily in a variable environment.

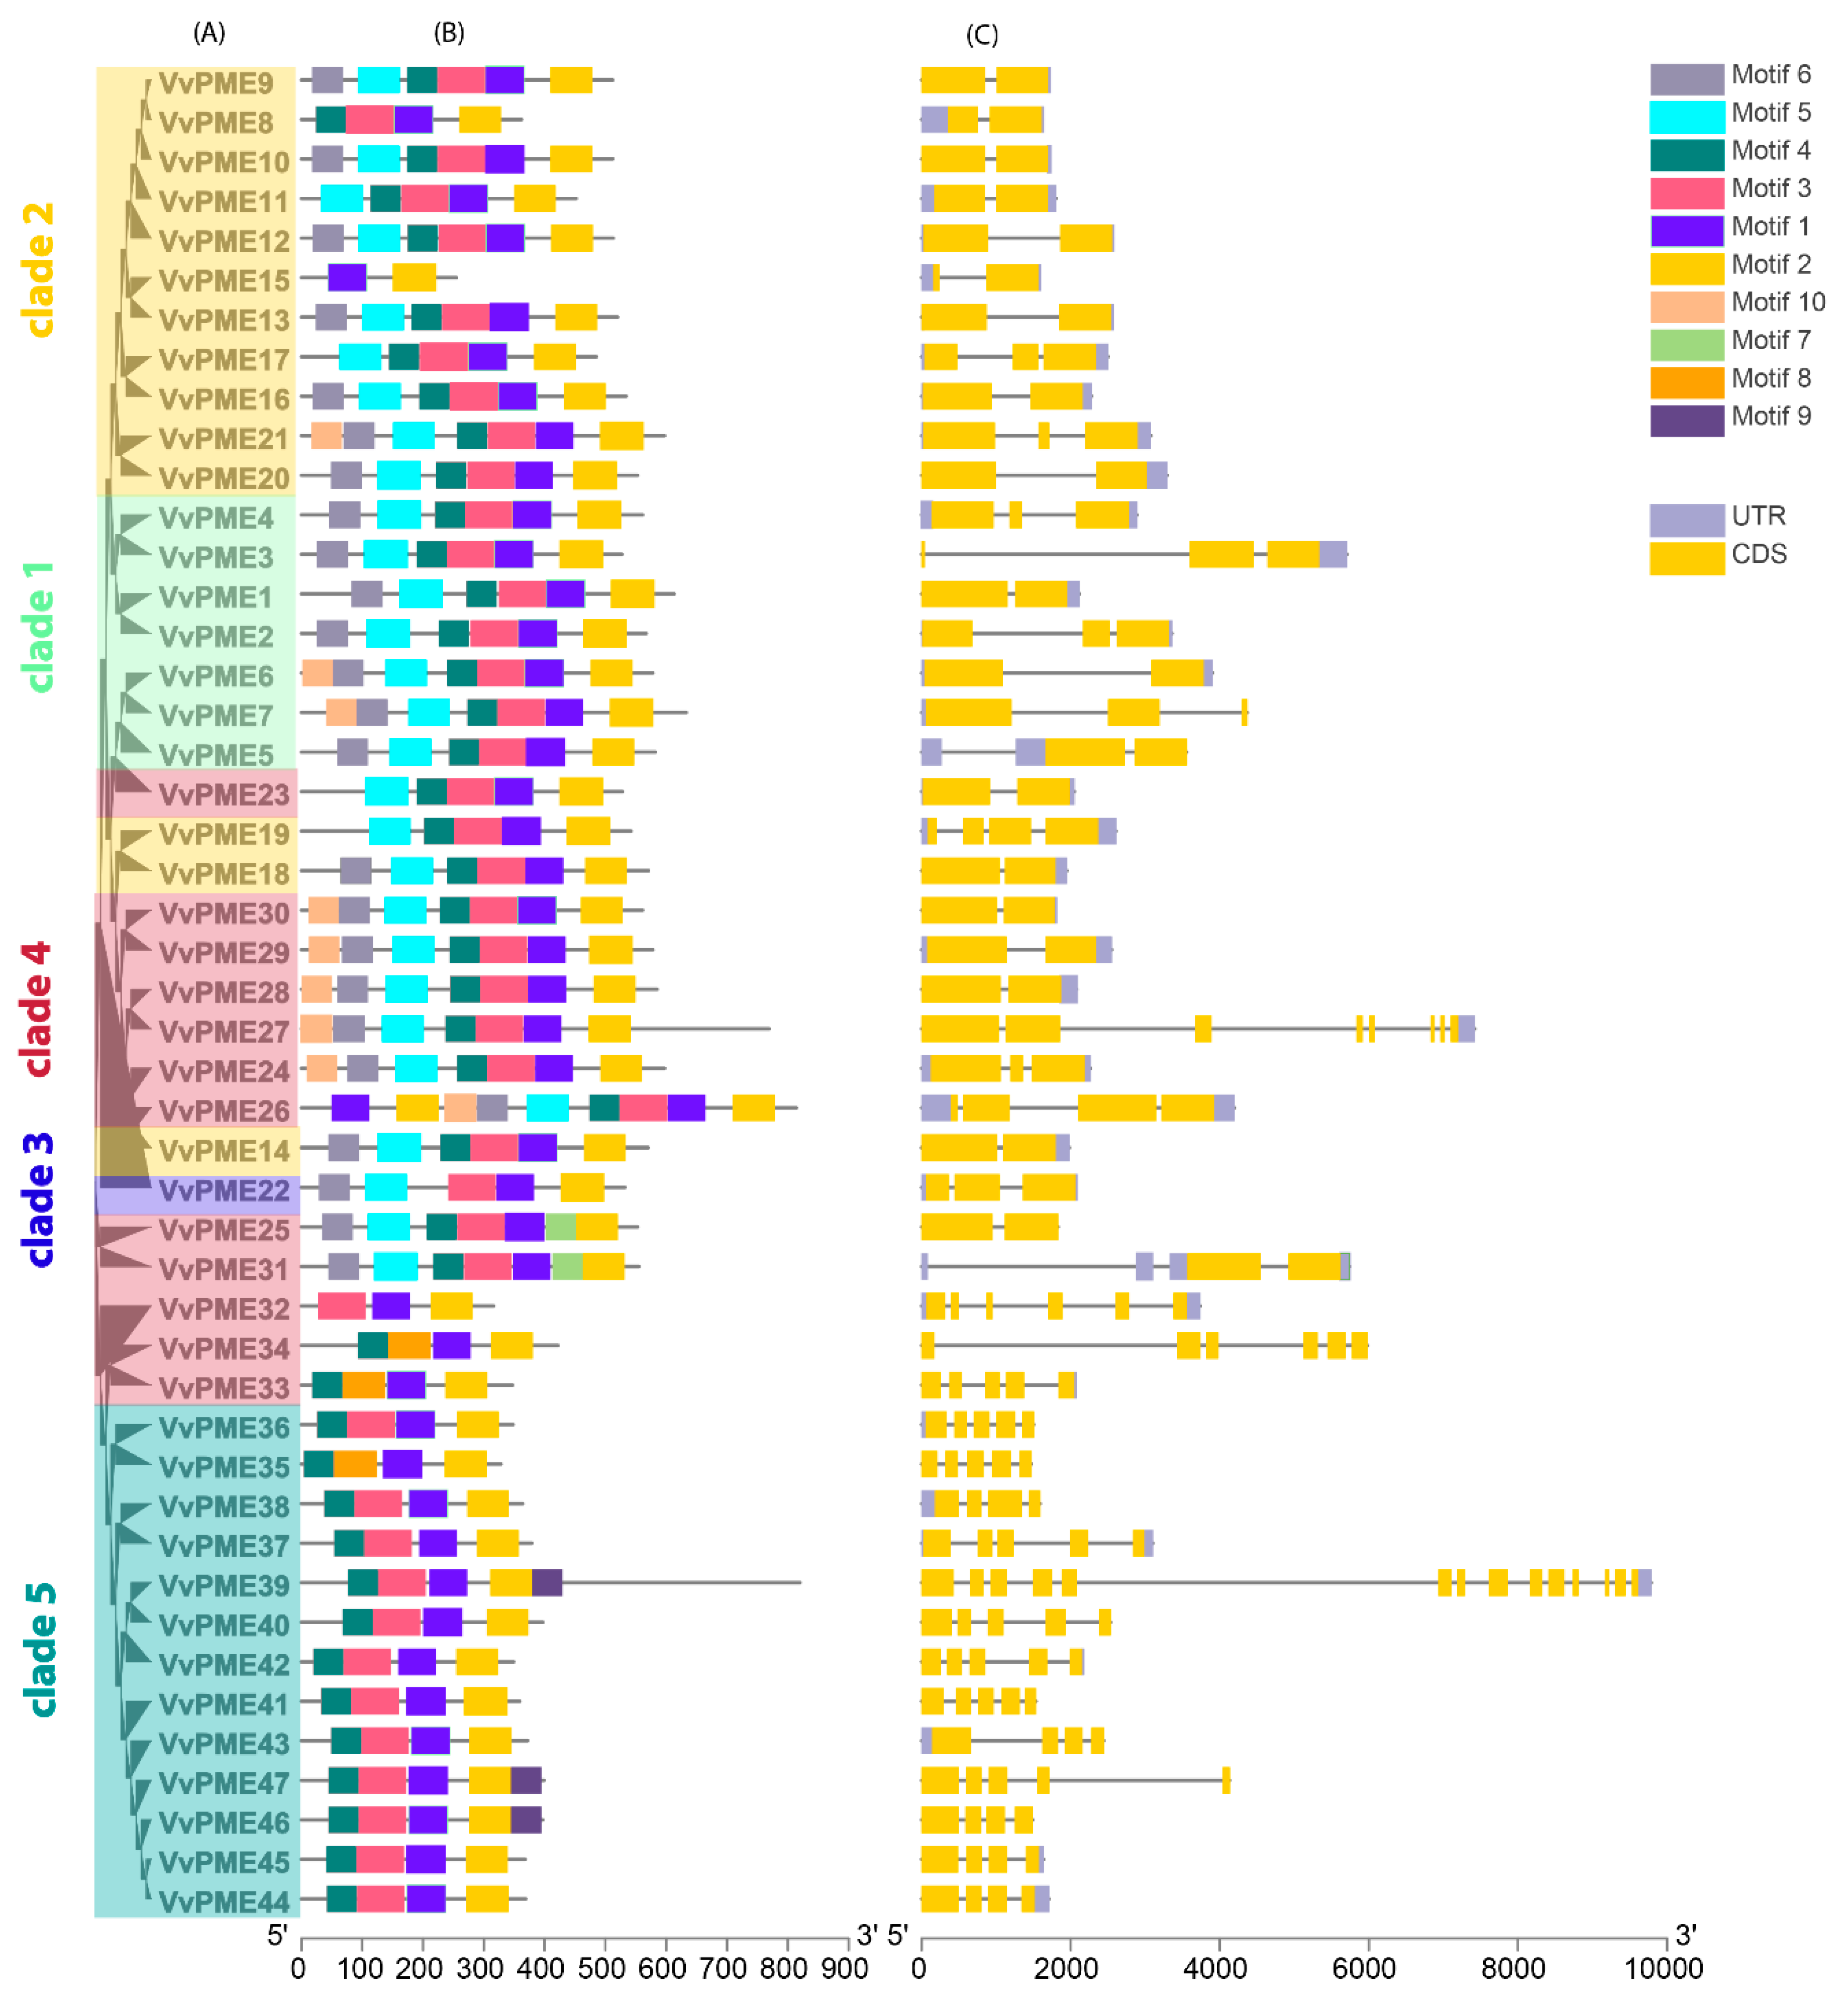
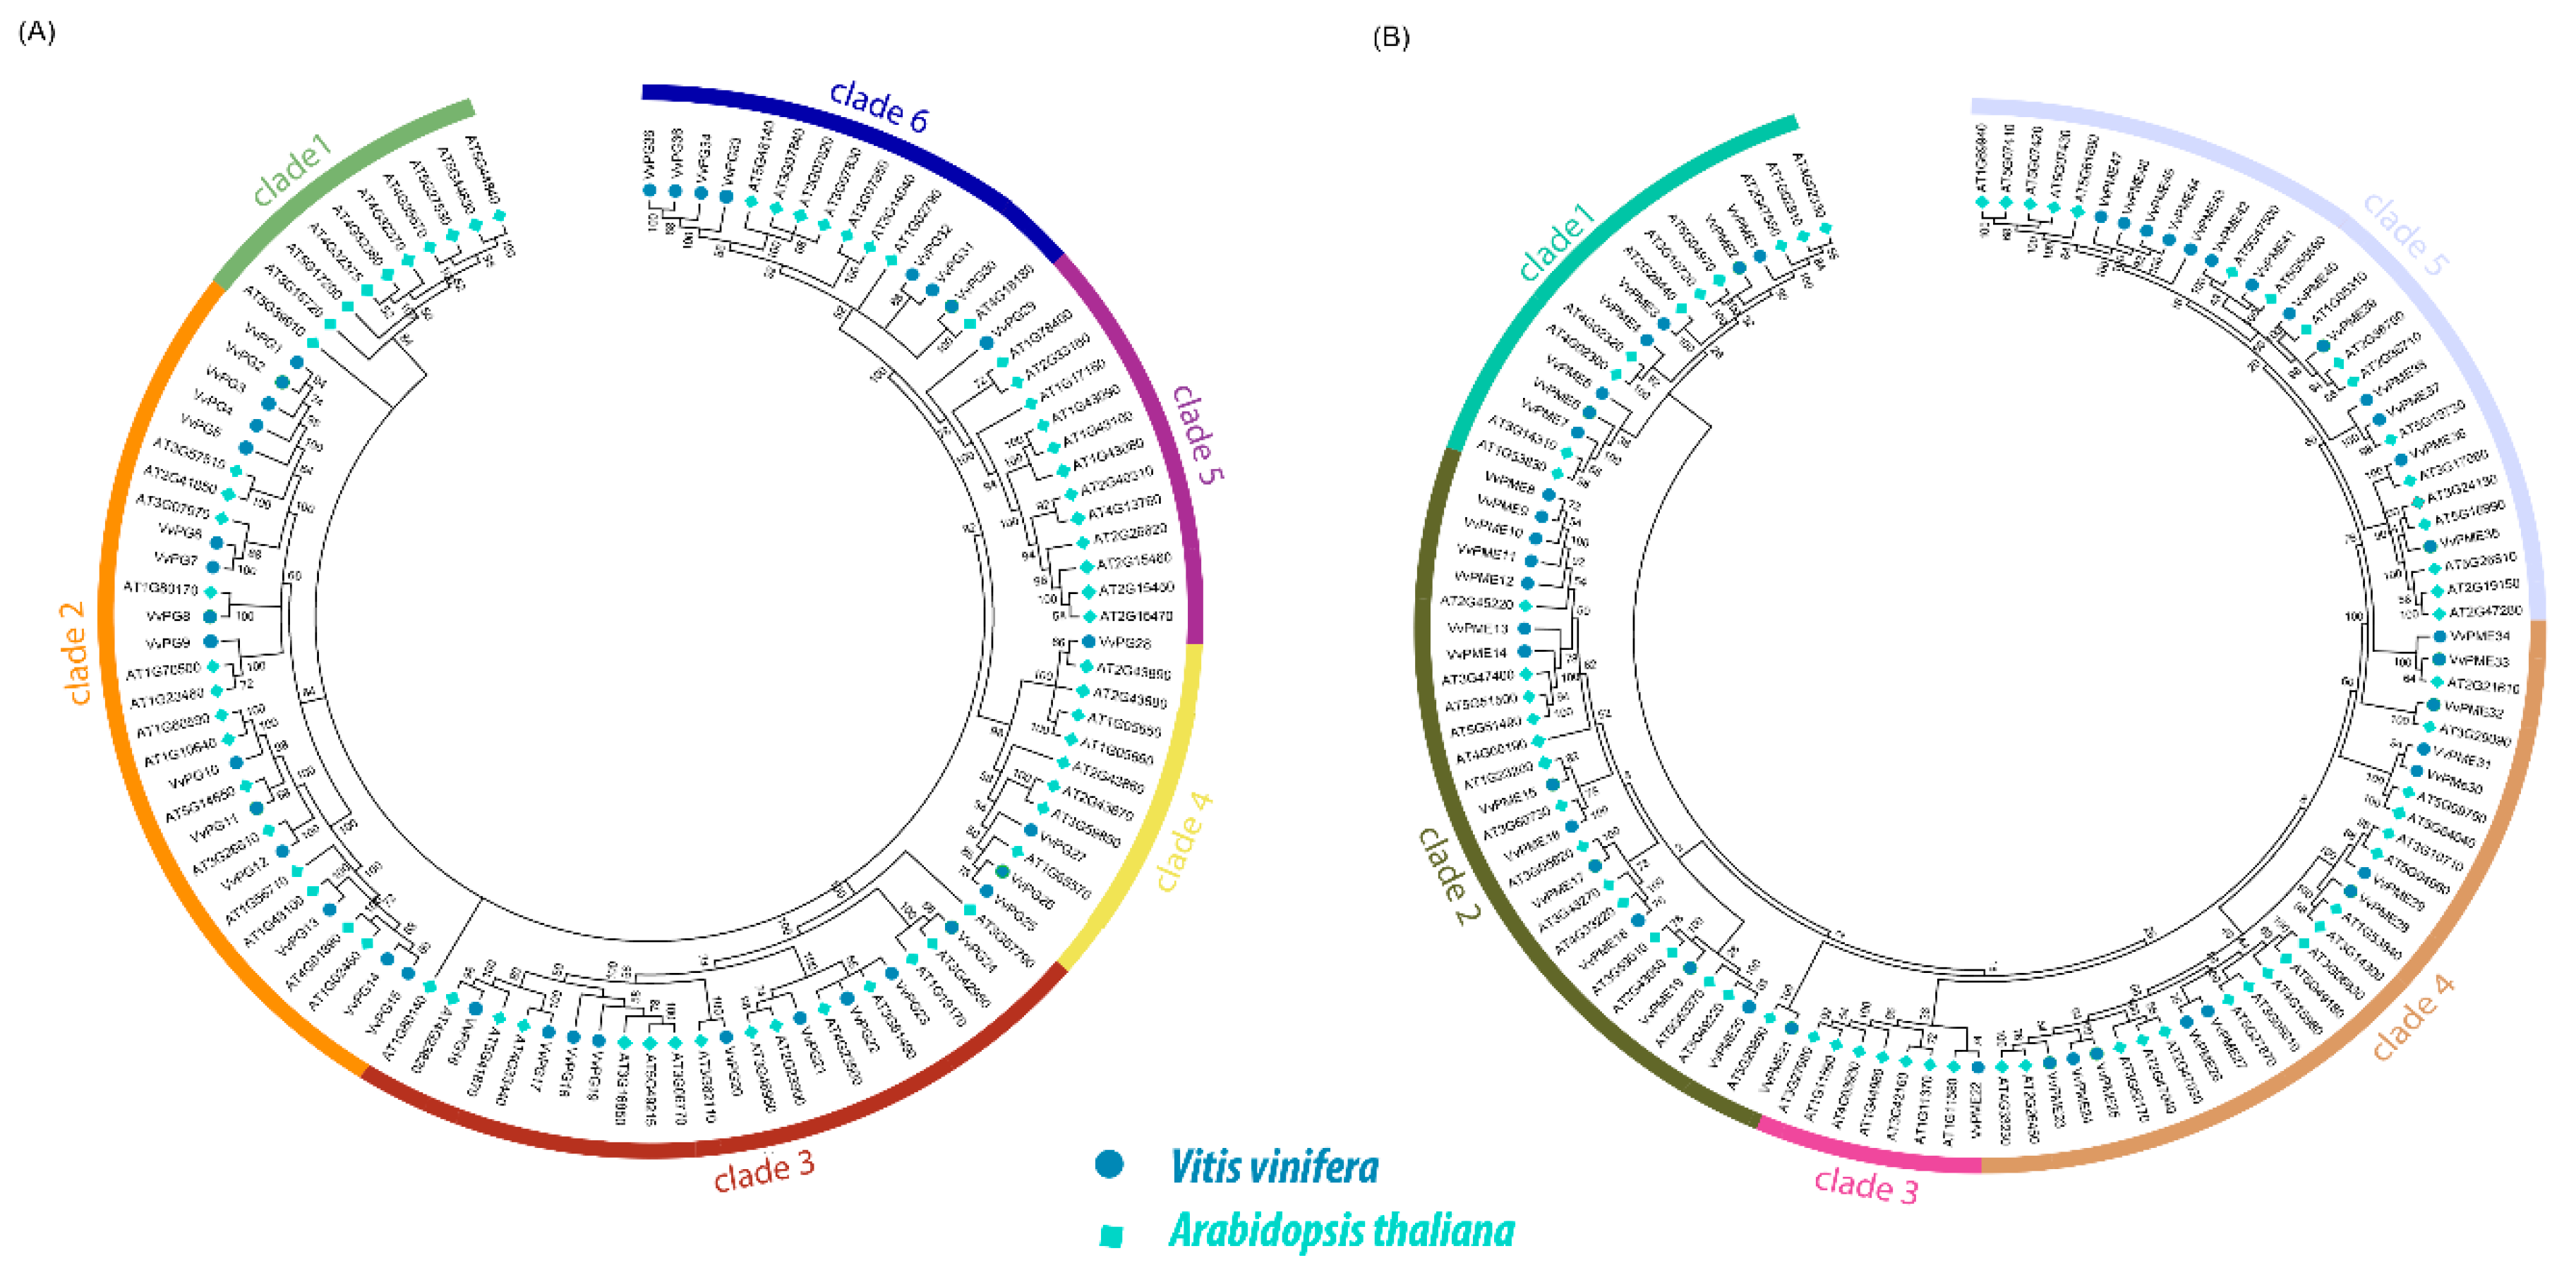
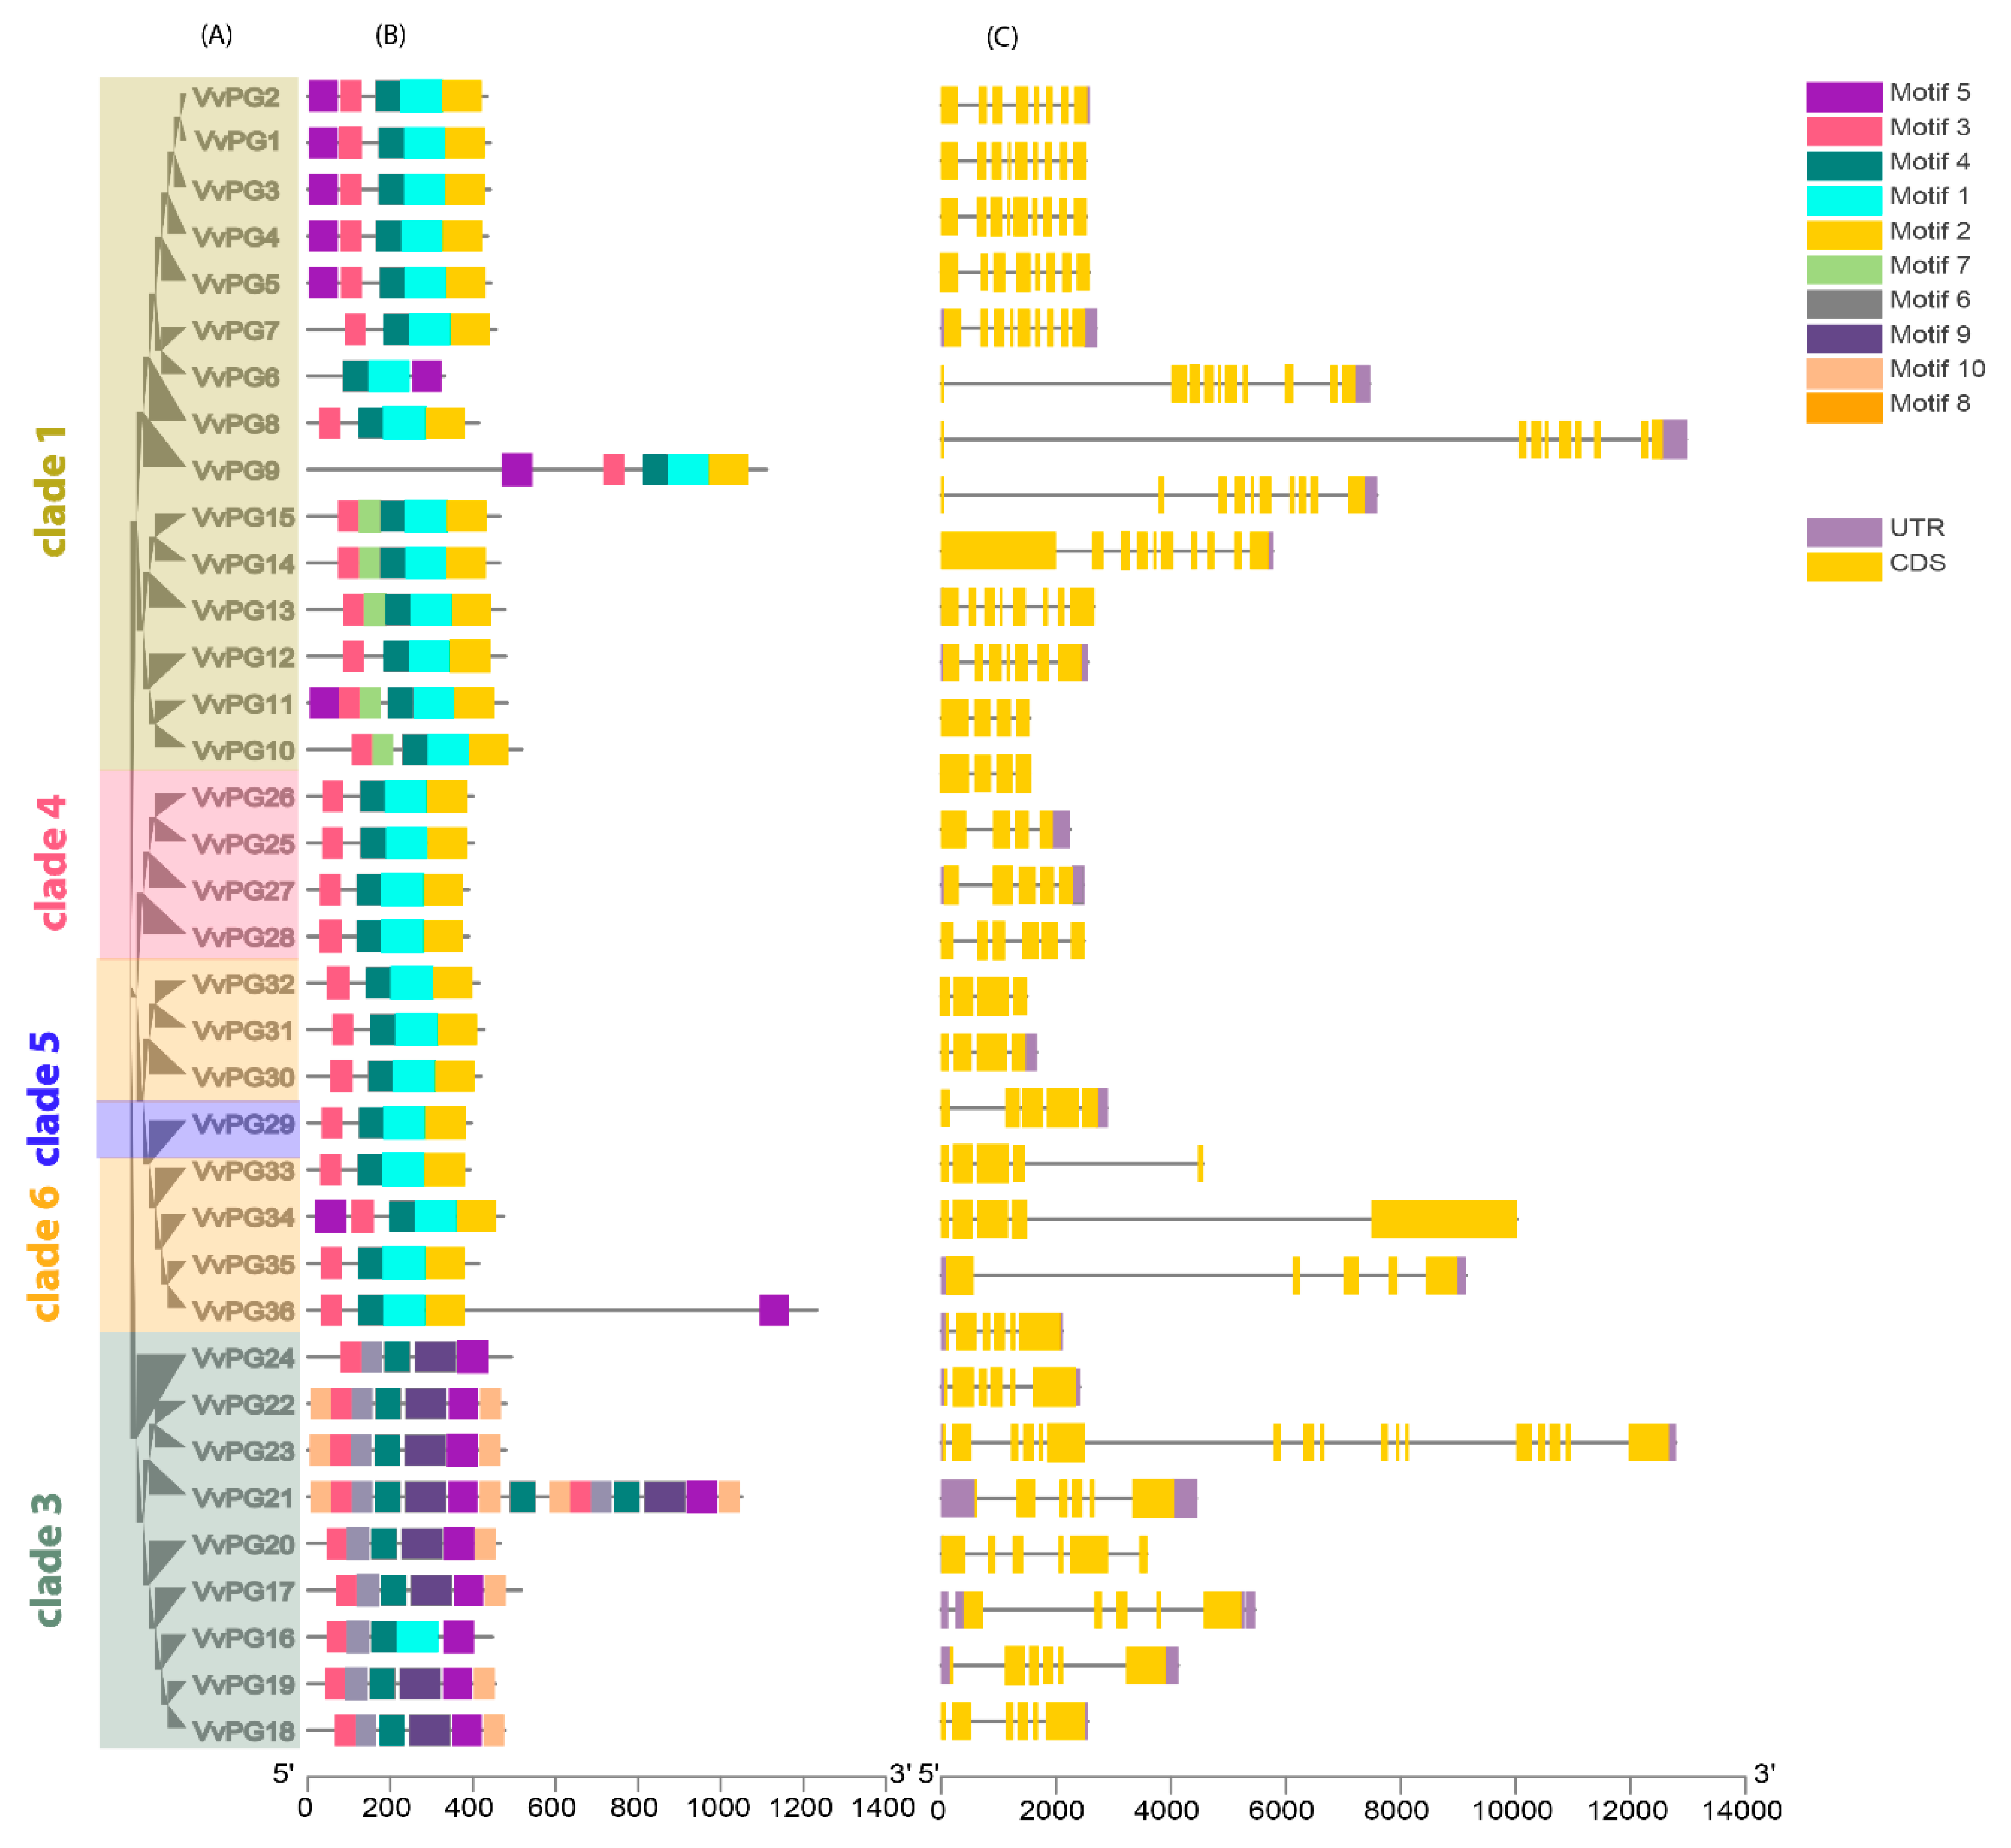
2.2. Phylogenetic and Collinearity Relationships, Motif Compositions and Genomic Structure of PGs and PMEs in Grapevine

The phylogenetic relationships of 36 PGs and 47 PMEs of grapevine and Arabidopsis were obtained using MEGA 7.0 with a maximum likelihood approach (ML). The phylogenetic tree revealed that PG and PME genes can further be divided into six and five major clades (Figure 1a,b). In the phylogenetic tree of both PGs and PMEs, we observed that clade two contained the most number of genes (15 and 14) compared to other clades in grapevine. The phylogenetic analysis suggests that both PGs and PMEs share high similarities and have close genetic relationships with Arabidopsis. The observed results of our phylogenetic arrangement were also consistent with previously reported studies [25,27]. In addition, we also constructed phylogenetic trees among PG and PME genes (Figure 2a and Figure 3a). The results showed consistency among the clades of PGs compared to PMEs, which may be due to variations in tree topologies. We also analyzed the composition of motifs for both PGs and PMEs (Figure 2b and Figure 3b). For PG and PME proteins, we obtained ten conserved motifs using the online server, Multiple Em for Motif Elicitation (MEME). The results revealed that motifs five and two frequently occurred among PG members. Similarly, for PME members, motifs six, five, four, and one were dominantly found in grapevine (Figure 2b and Figure 3b). Hence, these results suggest that most PG and PME protein members carry unique features due to variation in their amino acid sequences. Additionally, we also obtained their LOGOS by the same online server MEME. Ten consensus sequences were acquired for both PG and PME protein members and their distribution patterns are shown in Figures S1 and S2.
Furthermore, based on coding sequence (CDS) and untranslated regions (UTR) of PG and PME genes in grapevine, gene structures were also resolved using TBtools software (Figure 2c and Figure 3c). The results revealed that both PG and PME members exhibited high divergence and were largely conserved compared to each other. On the other hand, the PG and PME genes displayed more or fewer similarities among the same clades. This was also observed in a previously reported study focusing on PGs and PMEs in Brassica rapa [25].

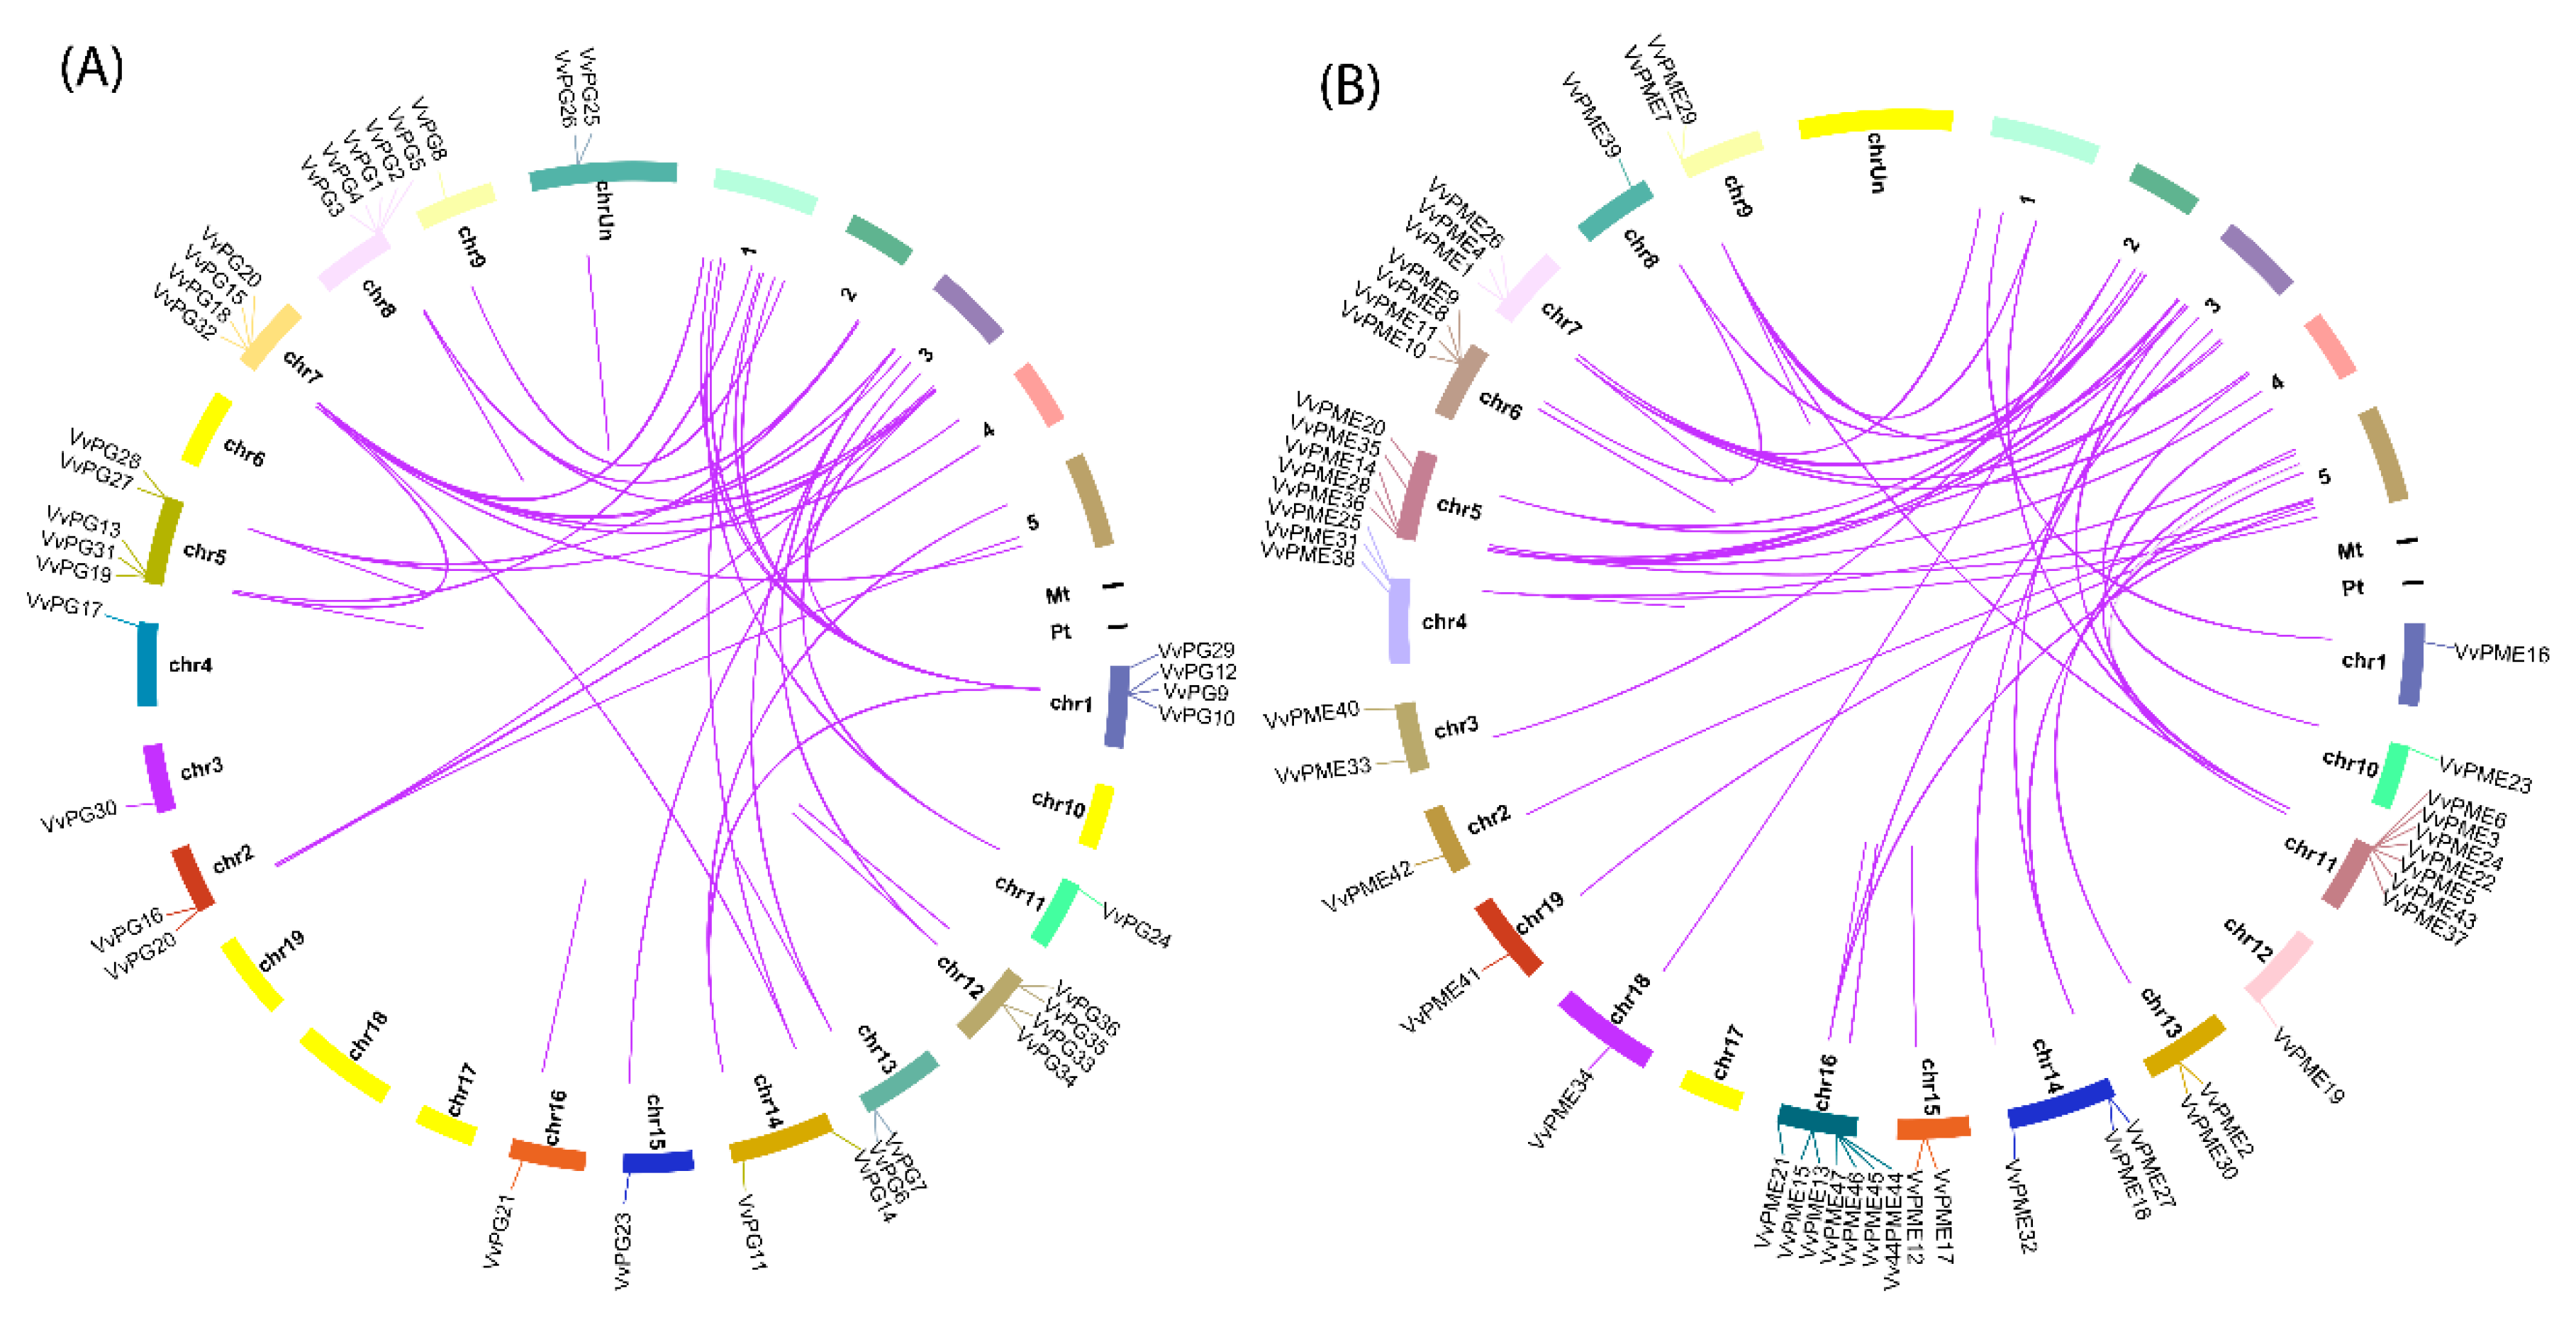
2.3. Chromosomal Localization and Gene Duplication Analysis of PG and PME Genes

A total of 36 PG genes were distributed unevenly across different chromosomal locations of grapevine genomes (i.e., Chr01–Chr19). The majority of the chromosomes of PGs showed inconsistency in terms of genes. Both Chr05 and Chr08 exhibited the highest number (8) of genes, followed by Chr1 and Chr07 with five genes. The others varied in number (Figure 4a and Figure S3). Moreover, the chromosomal localization for PME members also displayed high variation in the number of genes. The highest number of genes (seven) was found on both Chr11 and Chr16 each, followed by Chr5 containing five genes. The others largely varied from 1–4 per chromosome (Figure 4b and Figure S3). In majority, we observed non-random distribution patterns of PG and PME genes in the grapevine genome. The 36 PG and 47 PME genes were also clustered for collinearity between grapevine and Arabidopsis using Circos (Figure 4a,b). The results illustrated high conservation among PME members compared to PGs.
To study evolutionary rates and types of duplications among PG and PME genes in grapevines, we used MEGA7.0 and MCScanX. Among the 36 PGs, we identified 10 dispersed, 1 proximal, 12 tandem, and 13 segmental genes. Furthermore, we determined 23 dispersed, 1 proximal, 16 tandem, and 7 segmental genes in the 47 PMEs (Table 1). As gene duplications are vital for discovering novel biological functions, evolutions, and gene expansion [30], the segmental and dispersed duplications observed may play a major role in the expansion of PG and PME members.
To estimate the selection pressure among various types of duplications for both PGs and PMEs, we also intended their synonymous (Ks) and non-synonymous substitution rate (Ka) values. During evolutionary implications, genes are typically exposed to different types of selection processes (i.e., positive, neutral, and purifying selection). For understanding these selection pressures, we selected 15 duplicated pairs of genes among PGs and PMEs (Table 1). The Ka/Ks ratios for most PGs and PMEs were less than one, implicating a purifying selection and a reduction in divergence after duplications. However, we also found four pairs of PGs (i.e., VvPG29-VvPG30, VvPG5-VvPG7, VvPG14-VvPG15, and VvPG18-VvPG21) and five pairs of PMEs (VvPME5-VvPME16, VvPME22-VvPME23, VvPME35-VvPME36, VvPME6-VvPME7, and VvPME14-VvPME26) that indicate positive selection.

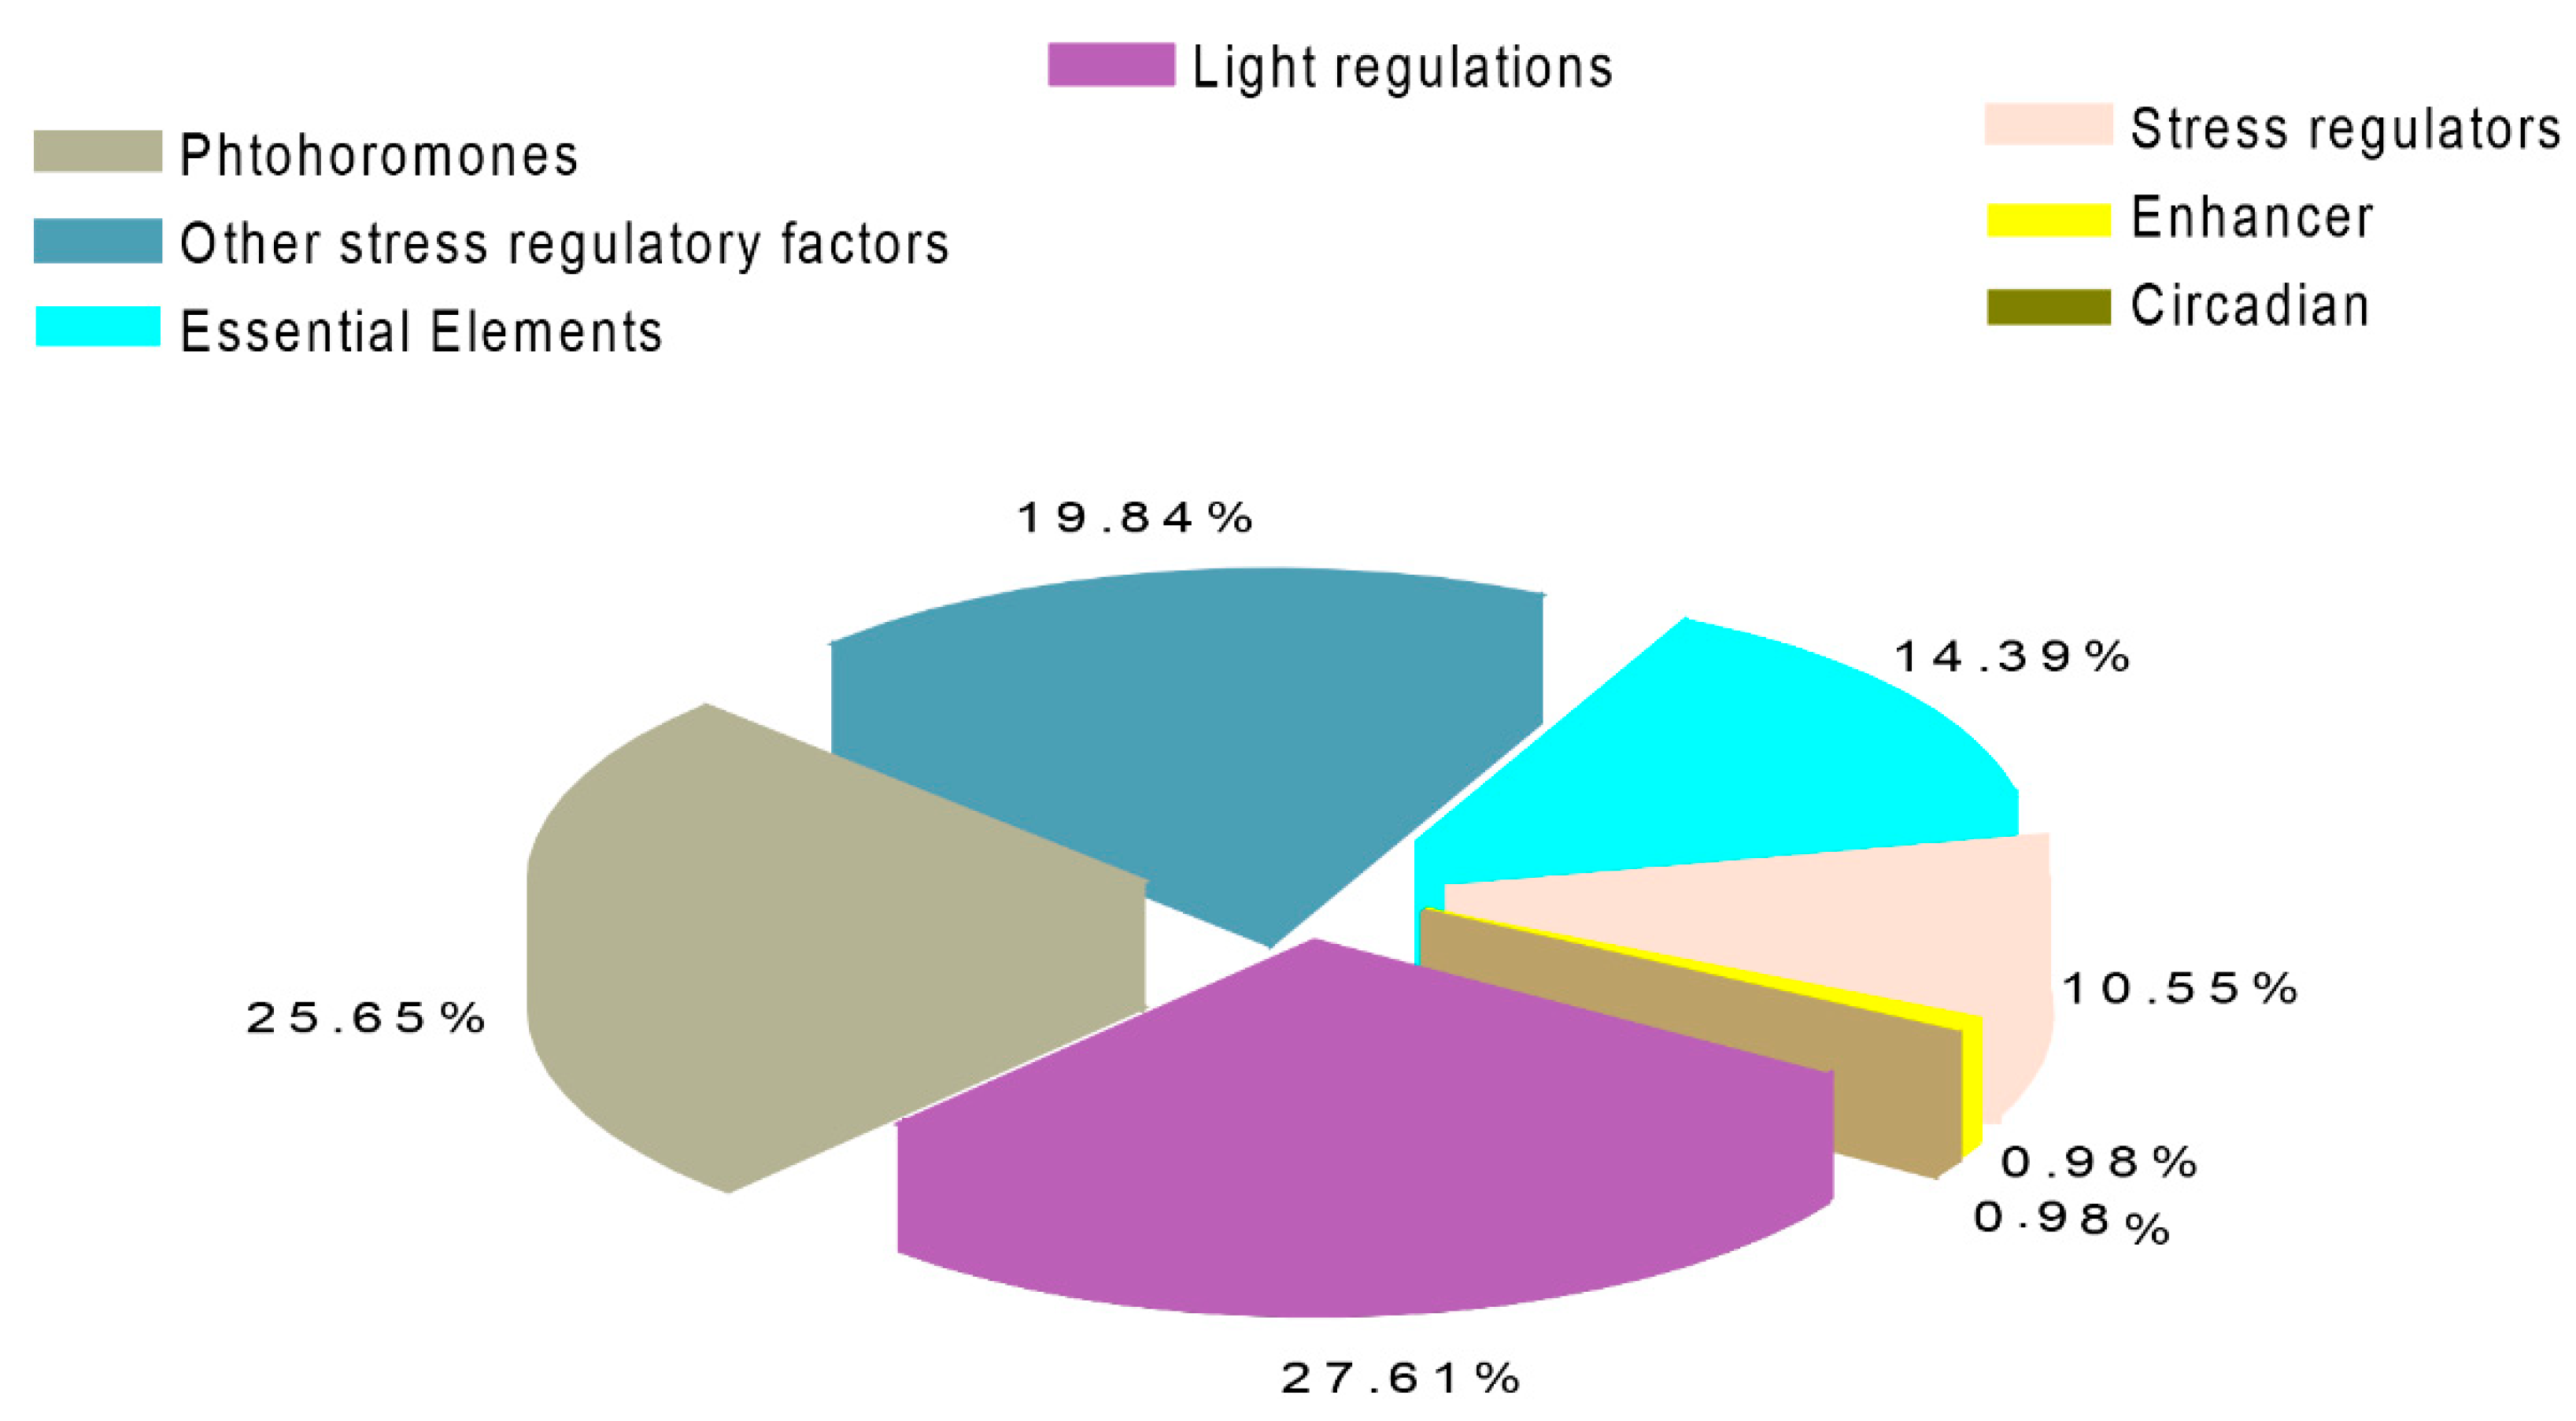
2.4. Gene Ontology Enrichment (GO) and Cis-Regulatory Elements in Grapevine

To study the regulatory functions of the 36 PGs and 47 PMEs, we performed GO annotation and GO enrichment analyses. The GO terms were largely based on three groupings, including molecular functions (MF), cellular component (CC), and biological process (BP). In brief, GO enrichments validate that PGs are enriched in various MF terms, such as “polygalacturonase activity” (GO:0004650), “hydrolase activity” (GO:0016787), and “hydrolyzing O-glycosyl compounds” (GO:0016798). The term CC was enriched in the plant-type cell wall, such as “integral component of membrane” (GO:0016021), and “extracellular region” (GO:0005576). The BP term was mainly responsive, such as “carbohydrate metabolic processes” (GO:0005975) and various other “metabolic processes” (GO:0008152), which are briefly listed in Table S3. Moreover, the PME results reveal that MF is enriched in “enzyme inhibitor activity” (GO:0004857) “pectinesterase activity” (GO:0030599), “aspartyl esterase” (GO:0045330). The CC and BP were also found to be enriched in “membrane” (GO:0016020), “proteolysis” (GO:0006508), and “cell wall modification” (GO:0042545). Our results from the GO enrichment analysis further hinted the role of PG and PME members in grapevine.
The 36 PG and 47 PME genes were also tested for pathway enrichment analysis using the KEGG database, where the results showed enrichment in three major pathways (Table S4). These pathways include “carbohydrate metabolism” followed by “metabolism” and “pentose and glucuronate interconversions” in grapevines.
In addition, we also observed cis-acting elements by utilizing the promoter regions of both PG and PME members using the PlantCARE database. The various types of cis-regulatory elements were analyzed and are described in Figure 5 and Table S5. In brief, the majority of the genes participated in numerous signaling pathways, such as phytohormones, biotic-abiotic and other regulatory stress factors. For instance, 27.61% of the genes of PGs and PMEs were responsive to light regulations (e.g., GTI-motif, G-Box, GATA-motif, and others), followed by phytohormones (25.65%) (CGTCA, TGACG, ABRE). Other observed key regulatory elements include TC-Rich repeats, and HD-ZIP 3, which were reactive to defense stress and protein binding, respectively. These results inferred that the PG and PME genes have diverse gene functions and are indirectly involved in various biotic-abiotic/hormone signaling.

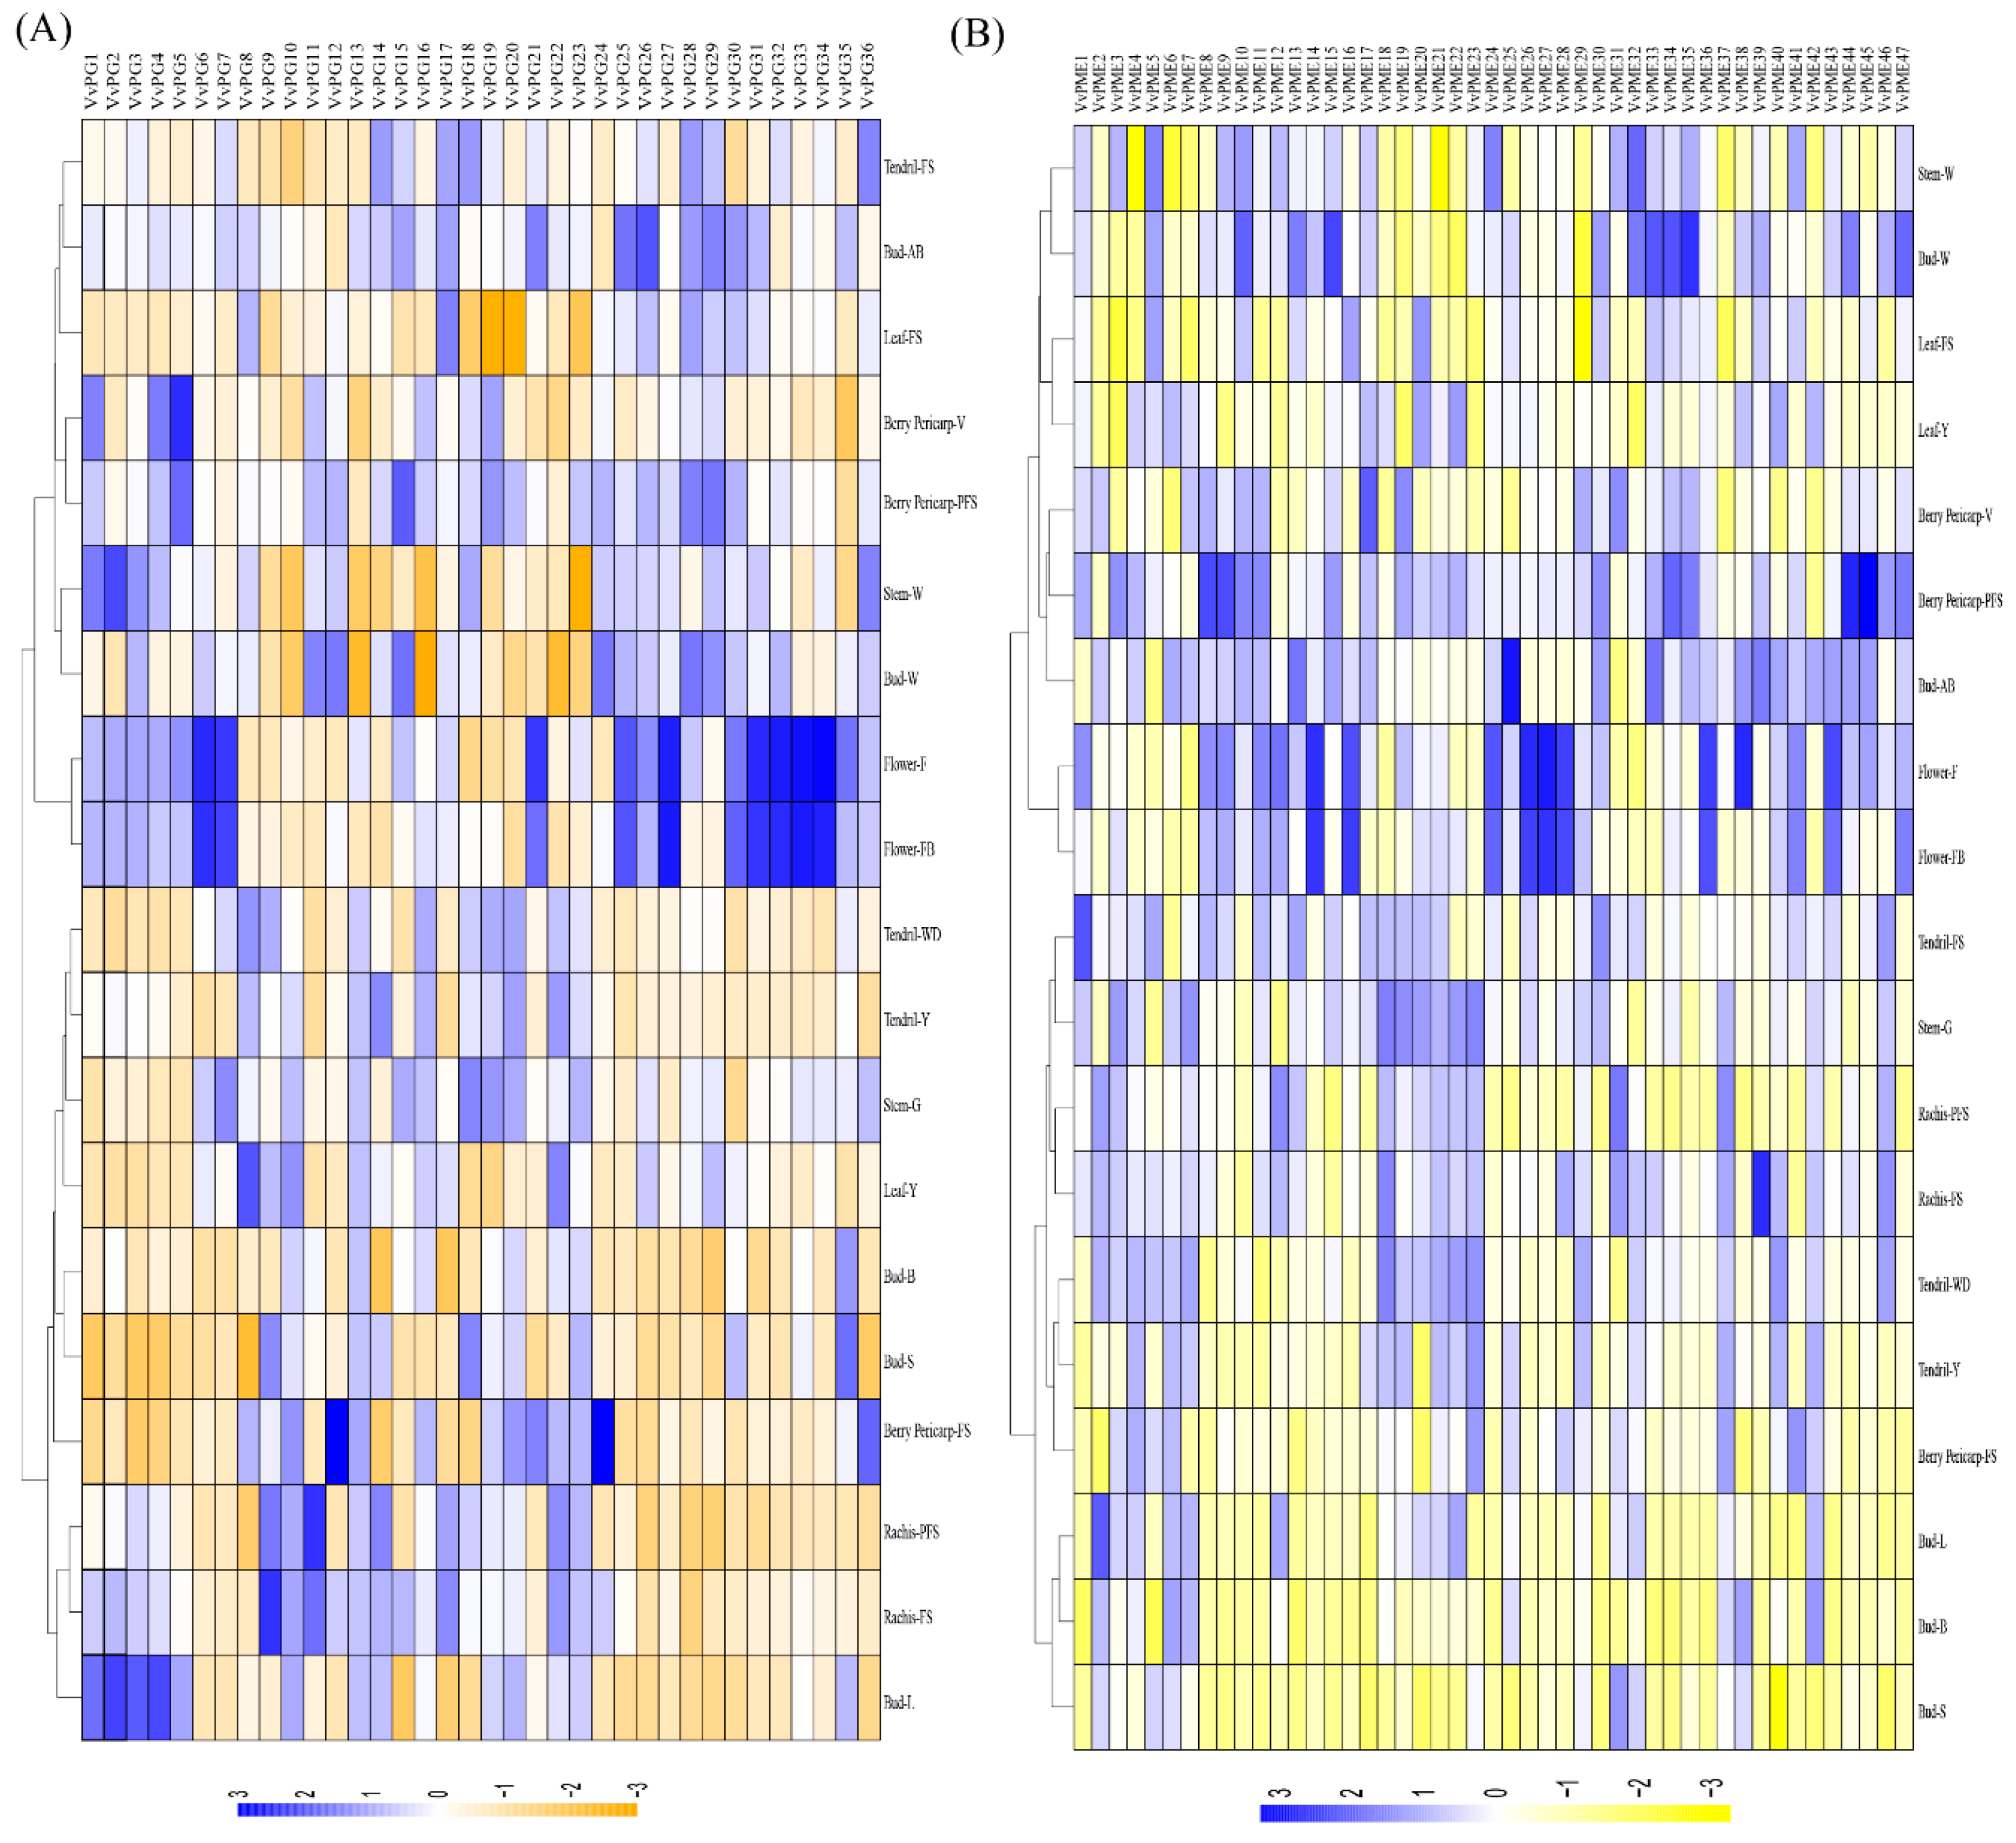
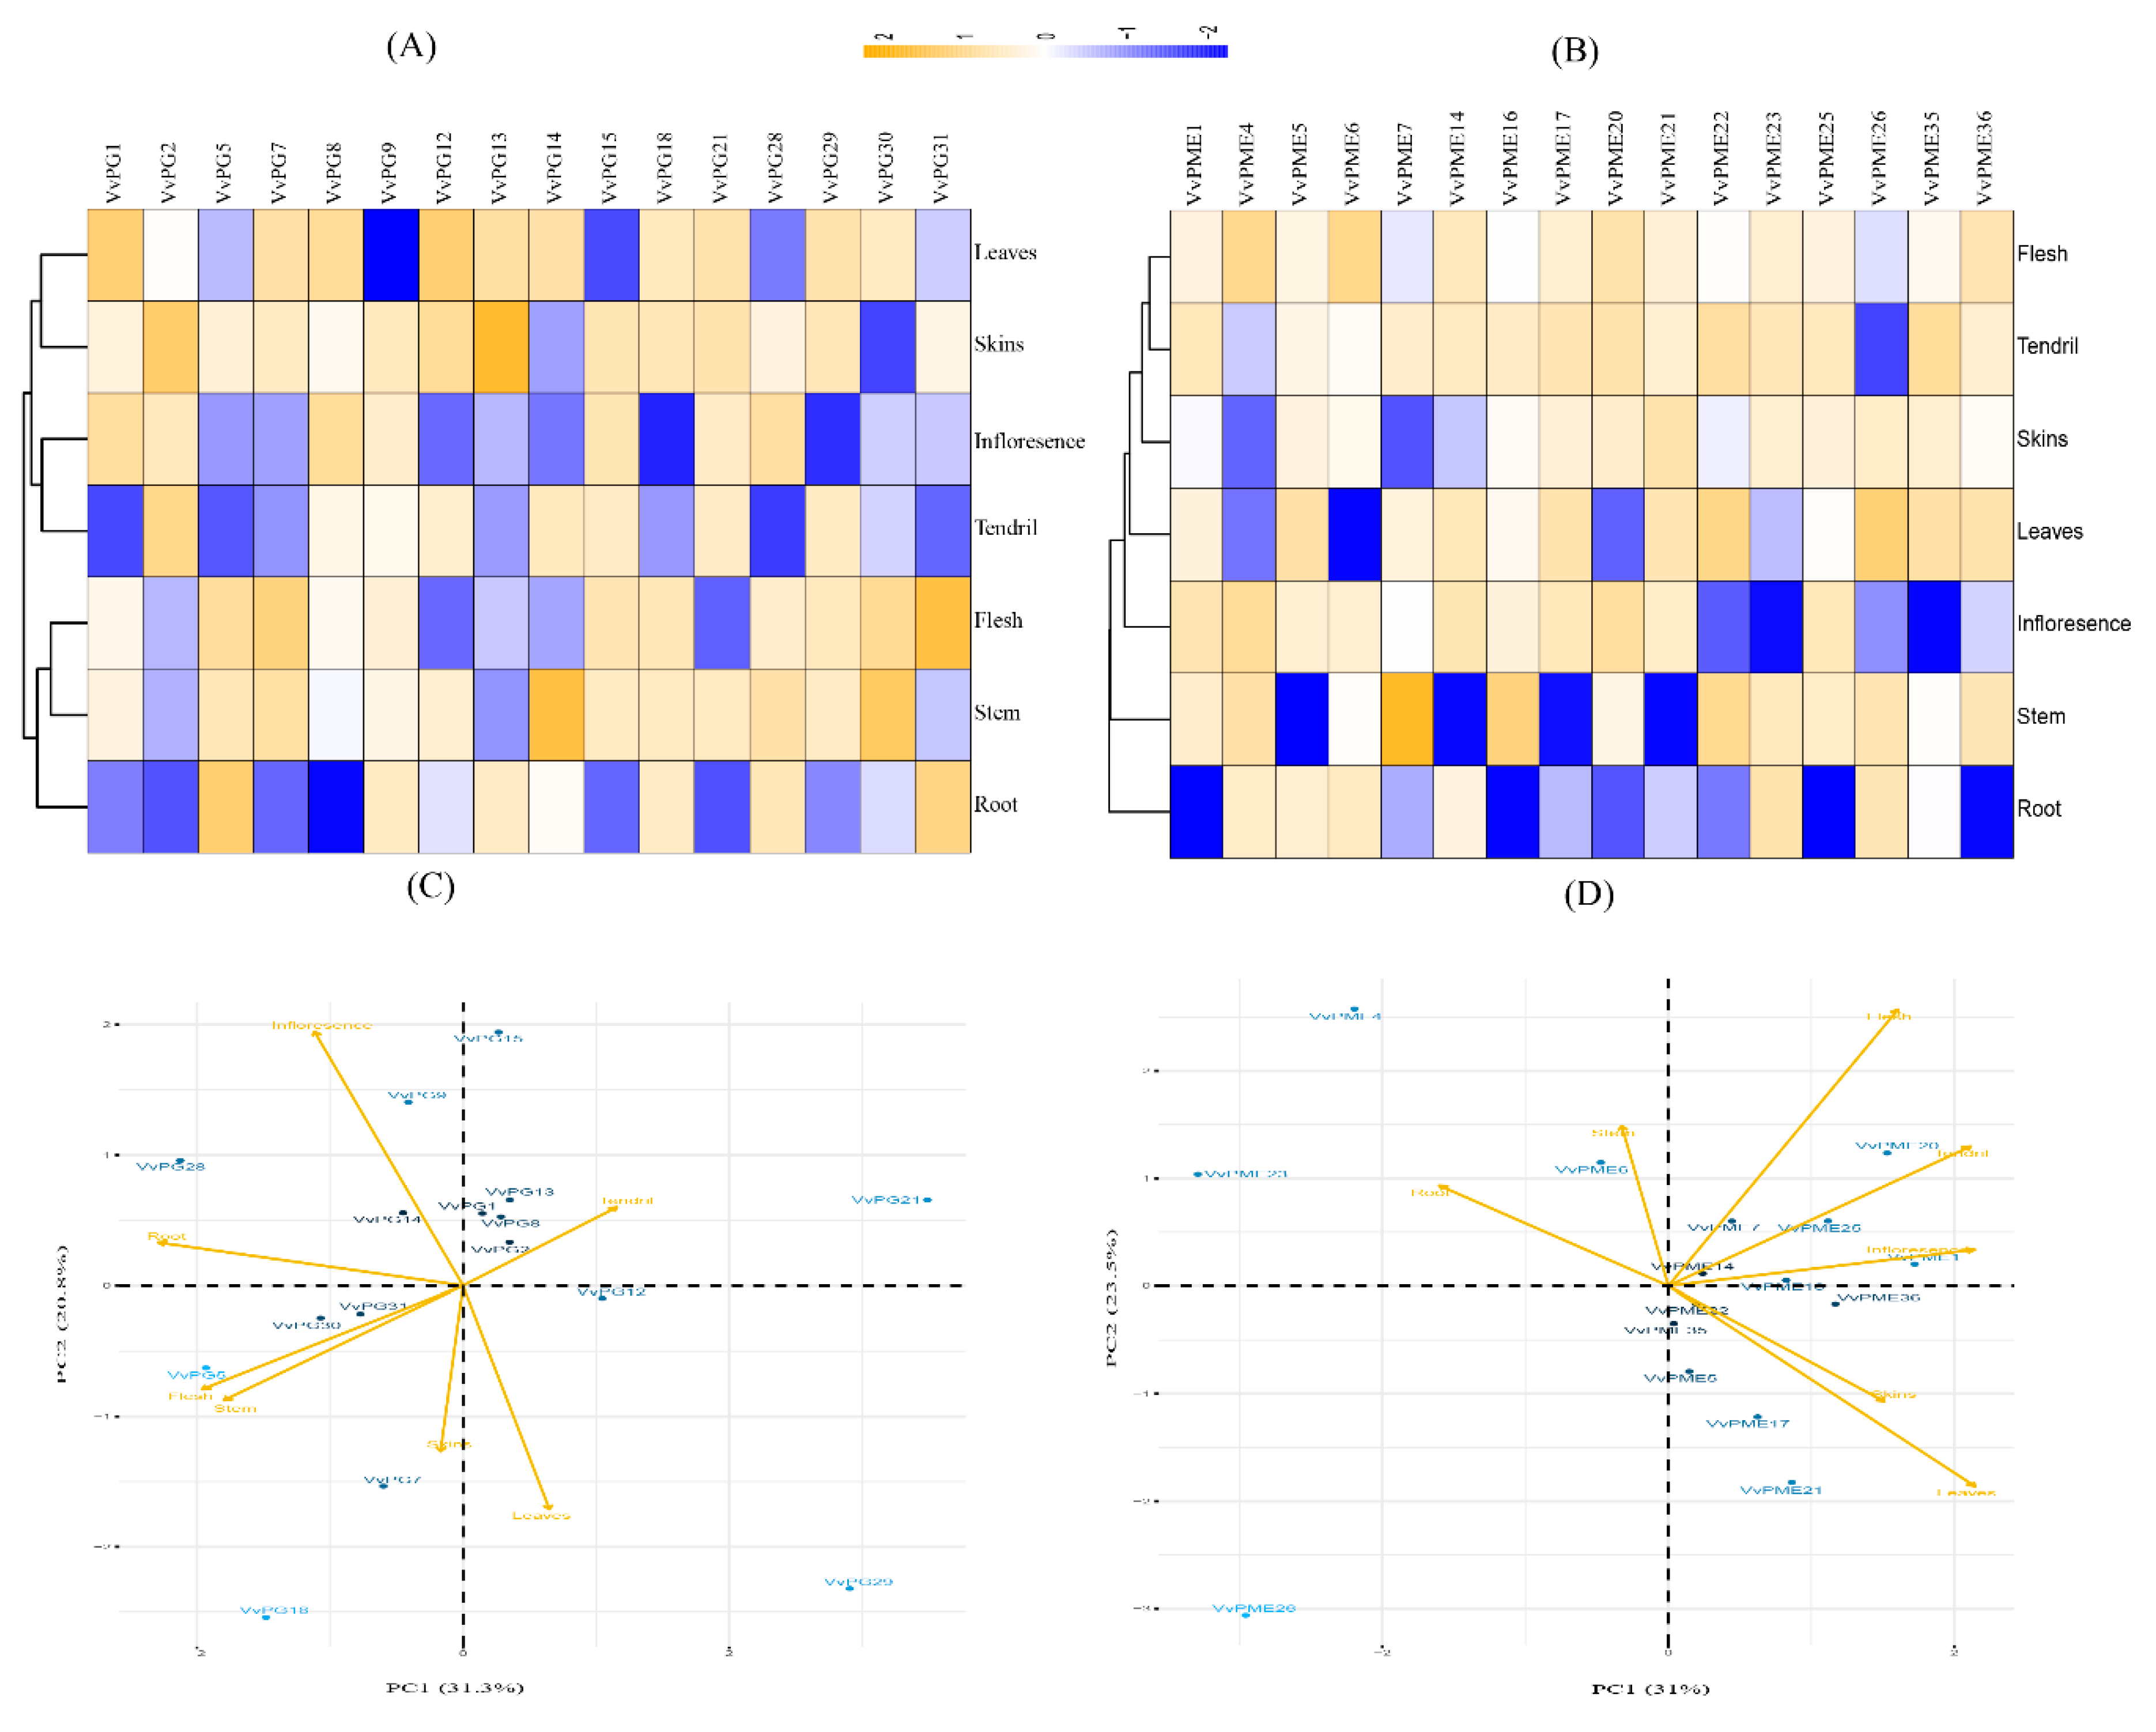
2.5. Tanscriptional Profiling of PGs and PMEs in Different Organs and Developmental Stages in Grapevine

To understand the spatiotemporal expression levels of PG and PME genes in grapevines, the global transcriptomic data of developmental phases of 19 different tissues and organs were retrieved from NCBI (GSE36128) [31]. Figure 6a,b represent the heat maps, indicating expression patterns of PGs and PMEs in grapevines. Among PGs, VvPG8, VvPG10, VvPG13, VvPG17, VvPG18, VvPG19, VvPG20, VvPG22, and VvPG23 showed tissue- or organ-specific expression across many tissues during development. In contrast, the remaining PGs demonstrated weak tissue-specific response in any of the selected grapevine organs. Likewise, in PMEs, VvPME3, VvPME4, VvPME5, VvPME6, VvPME19, VvPME21, VvPME23, VvPME29, VvPME31, and VvPME32 suggested higher tissue-specific response in all the tissues. In contrast, the others showed either moderate to weak expression or no expression in any of the grapevine tissues (Figure 6b). Overall the PG and PME genes showed enriched expression in flower (VvPG6-7, VvPG31-34, VvPME-28) and fruit ripening (VvPG4-5, VvPME7-8, and VvPME44-45), where the PGs suggested a more profound response than PMEs.

2.6. qRT-PCR Analysis of the Candidate PG and PME Genes in Various Organs of Grapevine

To validate previous findings based on RNA-seq data, cis-element predications and gene duplication analysis, we randomly selected 32 genes for qRT-PCR, which showed either positive or purifying selection. The expression profiling of PG and PME genes was quantified in various organs, such as root, stem, tendril, inflorescence, berry flesh, berry skin, and leaf of grapevines (Figure 7a,b). The results suggest that PG and PME transcripts show distinct expression patterns, intimating that both (PG and PME) gene families have positive regulatory roles in various physiological processes in grapevine. Moreover, principal component analysis (PCA) analysis was performed to gain deeper insight into their contribution to organ development. PCA analysis of PG transcripts suggested a variation of 31.26% in PC1, 24.28% in PC2, and 15.36% in PC3, which accounted for 70.90% of the total variation in the first three axes (Figure 7c). Among PGs, VvPG31 (0.86) and VvPG5 (0.85) had high positive loadings, while VvPG21 (−0.90) and VvPG8 (−0.77) had high negative loadings in PC1. Moreover, PCA analysis of PME transcripts suggested 83.02% in first three axes (PC1, PC2, and PC3) (Figure 7d). Among the PME transcripts, VvPME5 (0.73) and VvPME14 (0.61) had high positive loadings in PC1, whereas the highest negative loadings were found in VvPME16 (−0.96), VvPME36 (−0.82) and VvPME1 (−0.79) (Table S6).

3. Discussion

Realizing the significant role of PGs and PMEs in various plants observed in past studies, it is essential to systematically investigate the potential functions of these genes in grapevine. For instance, polygalacturonases (PGs) and pectin methylesterases (PMEs) have been hypothesized to play an imperative part in plant life cycles, such as cell separation and expansion, dehiscence, abscission, fruit maturity, and plant shedding [8,21,24]. In particular, PGs are a vital component of pectin disassembly, whereas PMEs play a central role in both remodeling and pectin disassembly [19,32]. Thus far, PGs and PMEs have been identified in various crops species although there is a lack of systemic analysis in grapevines. In this study, we comprehensively carried out various bioinformatics analyses by utilizing the available genomic resources of grapevines. In total, 36 PG and 47 PME genes were identified in grapevines and compared with Arabidopsis. For these genes, we also analyzed physicochemical properties, phylogenetic and collinearity relationships, chromosomal localization, motif and gene structure compositions, and duplication analysis. Additionally, the gene ontology (GO) and Kyoto Encyclopedia of Genes and Genomics (KEGG) enrichment, cis-regulatory elements, and expression dynamics among various organs of grapevine have revealed extensive information related to the gene functions and their role in plant development. Subcellular predictions for maximum members of genes were largely found in diverse organelles, such as the nucleus, endoplasmic reticulum, cytoplasm, plasma membrane, mitochondria, and others. The physicochemical and protein properties (i.e., protein length (aa), molecular weight (kDa), isoelectric point (PIs), and grand average of hydropathicity (GRAVY)) drastically varied among PGs and PMEs, suggesting their variable role in micro and macro environments [33].
The selection pressure analysis (i.e., purifying, positive, and neutral selection) of gene pairs provides valuable information using the rate of divergence [34]. During evolutionary events, the values of Ka/Ks ratio that are less than 1.00 signify purifying selection; values equal to 1.00 specify neutral selection; and values greater than 1.00 shows positive selection [35,36]. In this study, we observed a strong selective pressure (purifying selection) among PGs compared to PMEs, which is in disagreement with the previously reported study on Brassica rapa [25]. We infer that PGs might duplicate earlier for their need and survival, intimating their diverse and variable functions.
In this study, we also intended Ka/Ks values among 15 pairs of both PGs and PMEs (i.e., tandem, dispersed, and segmental) using the MEGA7.0 software [37]. Most of the pairs had Ka/Ks ratios that were smaller than 1.00, inferring the purifying selection. Furthermore, only four and five pairs of PGs and PMEs have values greater than 1.00, signifying positive selection. During evolutionary processes, the higher plant underwent polyploidization events, while segmental duplications are usually responsible for larger functional divergence [38,39]. Hence, studying gene duplication is vital for understanding biological functions and expansion of gene families [30,40], Hence, the results from our study highlight the importance of segmental and dispersed duplications in the two large families of PGs and PMEs in grapevines.
Transcript expression patterns and abundance in particular organs at a given time provide clues for understanding the function of genes [28]. Transcriptional profiling and functional characterization of PGs and PMEs has been reported in several species. For example, the PG genes found in various species, including Glycine max, Medicago truncatula, Zea mays, and O. sativa, showed higher expression levels [41]. In strawberries, the downregulation of FaPG1 extended their post-harvest life by reducing fruit softening [15]. Previously, PG gene family transcription patterns were also observed in Arabidopsis and Populus [24,42]. In addition, the members of the PME gene family have been reported as key regulators in plant–microbe interactions, cold acclimation, drought, and salt stress sensitivity [43,44,45,46,47]. Likewise, in grapevines, the members of the PG and PME gene family regulate the development of numerous organs at varying stages. In this study, 19 diverse tissue-specific expression patterns of PG and PME genes were examined. The results revealed that most PGs and PMEs were highly expressed in berry, tendril, and inflorescence. However, few PGs and PMEs reveal either more or similar expression patterns, signifying their unifying need and importance in plant development. In addition, qRT-PCR validation of 16 PG and PME genes revealed their vital role in various organs of grapevines (i.e., root, stem, tendril, inflorescence, flesh, skins, and leaves). Transcriptional profiling of these genes in various tissues may consequently aid the study of new adaptive functions regarding plant developmental processes in grapevine. Notably, among various PG and PME genes, visible tissue-specific expression patterns were detected, which may be correlated with their expansion, evolution and the complex nature in plant growth and development. However, their underlying molecular and evolutionary mechanisms that lead to the measurable and abrupt structural differences must be extensively investigated in the future.
Finally, GO and KEGG enrichment, and cis-element predictions in the promoter regions of PGs and PMEs revealed their key role in pectin and carbohydrate metabolism, and various stress-related activities in grapevine. Taken together, our results highlight the importance of PGs and PMEs in plants and provides a comprehensive overview of their developmental role in grapevine.

4. Materials and Methods

4.1. Mining of Grapevine PGs and PMEs

For identification of PG and PME genes in grapevine (genome version 2.1), we used BioEdit tools to obtain PGs and PMEs from all the reference sequences of Arabidopsis. Grapevine and Arabidopsis genomic sequences were retrieved from Ensembl (https://plants.ensembl.org/index.html) and TAIR (http://www.arabidopsis.org/). The sequences of other species, including apple, peach, and citrus, were downloaded from Phytozome v12.1.6 (https://phytozome.jgi.doe.gov/pz/portal.html) [48]. For domain composition analysis, we used NCBI-Conserved Domain database (https://www.ncbi.nlm.nih.gov/Structure/cdd/wrpsb.cgi) and SMART databases (http://smart.embl-heidelberg.de/) [49]. In cases where PGs and PMEs domains were absent, the protein sequences were removed from the study and sequences with errors in length or having <100 aa length were also removed before analysis.

4.2. Phylogenetic Analysis of PGs and PMEs

The amino acid sequences of PGs and PMEs were aligned using MUSCLE [50] implemented in MEGA 7.0 software [51]. The phylogenetic trees were constructed using the maximum likelihood (ML) method in MEGA 7.0. In order to determine the reliability of the resulting trees, bootstrap values of 1000 replications were performed with the Jones, Taylor, and Thornton amino acid substitution model (JTT model).

4.3. Ratio of Synonymous (Ks) and Non-synonymous (Ka) for duplicated genes

The Ka/Ks ratios were calculated for duplicated pairs (i.e., tandem, dispersed, and segmental) using MEGA 7.0 [51]. The Ka and Ks substitution rates were calculated with the standard genetic code table by the Nei–Gojobori method (Jukes-Cantor model) in MEGA 7.0.

4.4. Gene Structure, Conserved Motifs Analysis, and Physicochemical Parameters of PG and PME Proteins

The gene structure was illustrated by TBtools software [52] by utilizing the GFF3 file of the grapevine genome. The conserved motif scanning of PG and PME proteins was carried out through local MEME Suite (Version 5.0.5) and was visualized by TBtools software. For this purpose, parameter settings were calibrated as follows: a maximum number of motifs of 10, with a minimum and maximum width of 50 and 100. The other parameters were set at default values [53]. The physicochemical properties of the PG and PME proteins (i.e., molecular weight (MW), isoelectronic points (PIs), aliphatic index and GRAVY values for each gene) were calculated using the ExPASY PROTPARAM tools (http://web.expasy.org/protparam/). The subcellular localization was predicted using the WOLF PSORT (https://wolfpsort.hgc.jp/) website.

4.5. Gene Ontology (GO), Kyoto Encyclopedia of Genes and Genomics (KEGG) and Cis-Elements Predictions of PGs and PMEs

The GO enrichment was carried using an online panther server (http://pantherdb.org/) and TBtools software [52]. KEGG enrichment analysis was carried out by the online server (https://www.genome.jp/kegg/pathway.html) and their enriched pathways were further analyzed by TBtools software [52]. The promoter sequences of PGs and PMEs (i.e., selected as 1500 bp) were imported in Generic File Format (GFF) file from the grapevine genome. Subsequently, the PlantCARE database (http://bioinformatics.psb.ugent.be/webtools/plantcare/html/) [54] was utilized for identifying various cis-regulatory elements for each promoter sequence of PGs and PMEs.

4.6. Chromosomal Location and Collinearity Analysis

The chromosomal locations of PGs and PMEs were mapped based on information available at the Grape Genome Database (CRIBI. Available online: http://genomes.cribi.unipd.it/grape/, V2.1). and were illustrated using TBtools software [52]. For collinearity analysis, the relationships between grapevine and Arabidopsis homologs were verified and visualized by the Circos tool in TBtools software.

4.7. Principal Component Analysis (PCA)

The principal component analysis was implemented using Rstudio (R program) for qRT-PCR at a significance level of 0.05 (p-value) [37,55].

4.8. Plant Material and Methods

Six-year-old V. vinifera cv. Summer Black plants grown under standard field conditions were selected from Jiangsu Academy of Agricultural Sciences (JAAS), Nanjing-China. In brief, the 4th unfolded leaf was selected for tissue extraction. Various grapevine tissues/organs, such as the root, stem, tendril, inflorescence, flesh, and skin, were collected at different developmental stages. Tissue samples were immediately frozen in liquid nitrogen and stored at −80 °C for further use and RNA extraction.

4.9. RNA Isolation and Expression Profiling of PGs and PMEs in Grapevine

Total RNA was extracted from various organs using Trizol (Invitrogen, Carlsbad, CA, USA), following the manufacturer’s instructions. RNA was reverse-transcribed into cDNA using the Primer Script RT reagent kit (TAKARA, Dalian, China) according to the manufacturer’s instructions. Specific primers were designed using Becan Designer 7.9, and are presented in Table S7. In order to check the specificity of the primers, the BLAST tool was used against the grapevine genome for confirmation. RT-PCR was performed according to the guidelines of previous studies [56,57]. The relative fold expression was calculated with the comparative Ct-method. The expression patterns of all PG and PME genes were analyzed based on a previous study [58,59]. The housekeeping and grapevine actin gene (AB073011 and XM_010659103) was used as the reference gene for qRT-PCR.
In brief, the RT-PCR amplification reactions were performed on an ABI 7500 RT-PCR System (Applied Biosystems, CA, USA) using SYBR Green (Applied Biosystems, Carlsbad, CA, USA) with three replicates. PCR was conducted as follows: denaturation at 95 °C for 2 min, 40 cycles of denaturation at 95 °C for 10 s, annealing at 60 °C for 40 s, and extension at 72 °C for 15 s, followed by melting curve analysis (61 cycles at 65 °C for 10 s).
Transcriptomic data were utilized for various organs and developmental stages from NCBI GEO server (https://www.ncbi.nlm.nih.gov/geo/) under the series entry GSE36128. Additionally, gene expression levels were quantified by FPKM (fragments per kilobase of transcript per million fragments mapped), and heat maps were visualized by using Rstudio (R program, Boston, MA, USA).

5. Conclusions

In conclusion, we systematically carried out a genome-wide exploration of grapevines through various bioinformatic analyses, which include elucidating the physicochemical properties of PGs and PMEs, phylogenetic characterization, collinearity of PGs and PMEs, gene structure and motif composition, evolutionary rates, and gene duplications. The GO and KEGG enrichment, and cis-elements prediction analysis extended our repositories on the putative functions of PGs and PMEs in plant developments during pectin and carbohydrate metabolism, and various stress-related activities in grapevine. Additionally, expression profiling of various organs during developmental stages and their correlation by principal component analysis highlights the essential role of PGs and PMEs for plant improvements in grapevines.

Supplementary Materials

The following are available online at https://www.mdpi.com/1422-0067/20/13/3180/s1.

Author Contributions

Conceptualization, methodology, performed the experiments, N.K.; managed the research work, writing original draft, figures, review and editing, N.K., F.F., and M.S.H.; software, H.S.; validation, Z.L. and T.Z.; and supervision, funding acquisition, project administration, J.F.

Funding

This work was supported by the funding of National Key R&D Projects 2018YFD1000200, Jiangsu Agricultural Science and Technology Independent Innovation Project CX (18)2008, National Natural Science Foundation of China (31672131, 31801809).

Conflicts of Interest

The authors declare no conflict of interest.

Abbreviations

PGsPolygalacturonase
PMEsPectin methylesterase
GOGene Ontology
KEGG Kyoto Encyclopedia of Genes and Genomes
RT-PCR Real time-PCR
PCAPrincipal Component Analysis

References

  1. Somerville, C.; Bauer, S.; Brininstool, G.; Facette, M.; Hamann, T.; Milne, J.; Osborne, E.; Paredez, A.; Persson, S.; Raab, T.; et al. Toward a systems approach to understanding plant cell walls. Science 2004, 306, 2206–2211. [Google Scholar] [CrossRef] [PubMed]
  2. Keegstra, K. Plant cell walls. Plant Physiol. 2010, 154, 483–486. [Google Scholar] [CrossRef] [PubMed]
  3. Seymour, G.B.; Orchard, J.; Marín-Rodríguez, M.C. Pectate lyases, cell wall degradation and fruit softening. J. Exp. Bot. 2002, 53, 2115–2119. [Google Scholar]
  4. Peng, G.; Wu, J.; Lu, W.; Li, J. A polygalacturonase gene clustered into clade e involved in lychee fruitlet abscission. Sci. Hortic. 2013, 150, 244–250. [Google Scholar] [CrossRef]
  5. Elliott, K.A.; González-Carranza, Z.H.; Roberts, J.A. Expression of polygalacturonases and evidence to support their role during cell separation processes in Arabidopsis thaliana. J. Exp. Bot. 2007, 58, 3719–3730. [Google Scholar]
  6. Ogawa, M.; Kay, P.; Wilson, S.; Swain, S.M. Arabidopsis dehiscence zone polygalacturonase1 (adpg1), adpg2, and quartet2 are polygalacturonases required for cell separation during reproductive development in Arabidopsis. Plant Cell 2009, 21, 216–233. [Google Scholar] [CrossRef] [PubMed]
  7. Atkinson, R.G.; Schröder, R.; Hallett, I.C.; Cohen, D.; MacRae, E.A. Overexpression of polygalacturonase in transgenic apple trees leads to a range of novel phenotypes involving changes in cell adhesion. Plant Physiol. 2002, 129, 122–133. [Google Scholar] [CrossRef] [PubMed]
  8. Rose, J.K.C.; Catalá, C.; Gonzalez-Carranza, Z.H.; Roberts, J.A. Cell wall disassembly. Annu. Plant Rev. 2018, 8, 264–324. [Google Scholar]
  9. Torki, M.; Mandaron, P.; Thomas, F.; Quigley, F.; Mache, R.; Falconet, D. Differential expression of a polygalacturonase gene family in Arabidopsis thaliana. Mol. Gen. Genet. 1999, 261, 948–952. [Google Scholar]
  10. Sander, L.; Child, R.; Ulvskov, P.; Albrechtsen, M.; Borkhardt, B. Analysis of a dehiscence zone endo-polygalacturonase in oilseed rape (Brassica napus) and Arabidopsis thaliana: Evidence for roles in cell separation in dehiscence and abscission zones, and in stylar tissues during pollen tube growth. Plant Mol. Biol. 2001, 46, 469–479. [Google Scholar] [CrossRef]
  11. Chen, H.; Shao, H.; Fan, S.; Ma, J.; Zhang, D.; Han, M. Identification and phylogenetic analysis of the polygalacturonase gene family in apple. Hortic. Plant J. 2016, 2, 241–252. [Google Scholar] [CrossRef]
  12. Wakasa, Y.; Kudo, H.; Ishikawa, R.; Akada, S.; Senda, M.; Niizeki, M.; Harada, T. Low expression of an endopolygalacturonase gene in apple fruit with long-term storage potential. Postharvest Biol. Technol. 2006, 39, 193–198. [Google Scholar] [CrossRef]
  13. Sekine, D.; Munemura, I.; Gao, M.; Mitsuhashi, W.; Toyomasu, T.; Murayama, H. Cloning of cdnas encoding cell-wall hydrolases from pear (Pyrus communis) fruit and their involvement in fruit softening and development of melting texture. Physiol. Plant. 2006, 126, 163–174. [Google Scholar] [CrossRef]
  14. Deytieux-Belleau, C.; Vallet, A.; Doneche, B.; Geny, L. Pectin methylesterase and polygalacturonase in the developing grape skin. Plant Physiol. Biochem. 2008, 46, 638–646. [Google Scholar] [CrossRef] [PubMed]
  15. Pose, S.; Paniagua, C.; Cifuentes, M.; Blanco-Portales, R.; Quesada, M.A.; Mercado, J.A. Insights into the effects of polygalacturonase fapg1 gene silencing on pectin matrix disassembly, enhanced tissue integrity, and firmness in ripe strawberry fruits. J. Exp. Bot. 2013, 64, 3803–3815. [Google Scholar] [CrossRef] [PubMed]
  16. Hiwasa, K.; Kinugasa, Y.; Amano, S.; Hashimoto, A.; Nakano, R.; Inaba, A.; Kubo, Y. Ethylene is required for both the initiation and progression of softening in pear (Pyrus communis L.) fruit. J. Exp. Bot. 2003, 54, 771–779. [Google Scholar] [CrossRef]
  17. Asif, M.H.; Nath, P. Expression of multiple forms of polygalacturonase gene during ripening in banana fruit. Plant Physiol. Biochem. 2005, 43, 177–184. [Google Scholar] [CrossRef]
  18. Atmodjo, M.A.; Hao, Z.; Mohnen, D. Evolving views of pectin biosynthesis. Annu. Rev. Plant Biol. 2013, 64, 747–779. [Google Scholar] [CrossRef]
  19. Pelloux, J.; Rusterucci, C.; Mellerowicz, E.J. New insights into pectin methylesterase structure and function. Trends Plant Sci. 2007, 12, 267–277. [Google Scholar] [CrossRef]
  20. Kagan-Zur, V.; Tieman, D.M.; Marlow, S.J.; Handa, A.K. Differential regulation of polygalacturonase and pectin methylesterase gene expression during and after heat stress in ripening tomato (Lycopersicon esculentum mill.) fruits. Plant Mol. Biol. 1995, 29, 1101–1110. [Google Scholar] [CrossRef]
  21. Bosch, M.; Cheung, A.Y.; Hepler, P.K. Pectin methylesterase, a regulator of pollen tube growth. Plant Physiol 2005, 138, 1334–1346. [Google Scholar] [CrossRef]
  22. Almeida, D.P.F.; Huber, D.J. In vivo pectin solubility in ripening and chill-injured tomato fruit. Plant Sci. 2008, 174, 174–182. [Google Scholar] [CrossRef]
  23. Giovannoni, J.J.; DellaPenna, D.; Bennett, A.B.; Fischer, R.L. Expression of a chimeric polygalacturonase gene in transgenic rin (ripening inhibitor) tomato fruit results in polyuronide degradation but not fruit softening. Plant Cell 1989, 1, 53–63. [Google Scholar] [PubMed]
  24. Kim, J.; Shiu, S.H.; Thoma, S.; Li, W.H.; Patterson, S.E. Patterns of expansion and expression divergence in the plant polygalacturonase gene family. Genome Biol. 2006, 7, R87. [Google Scholar] [CrossRef]
  25. Duan, W.; Huang, Z.; Song, X.; Liu, T.; Liu, H.; Hou, X.; Li, Y. Comprehensive analysis of the polygalacturonase and pectin methylesterase genes in Brassica rapa shed light on their different evolutionary patterns. Sci. Rep. 2016, 6, 25107. [Google Scholar] [CrossRef] [PubMed]
  26. Li, W.; Shang, H.; Ge, Q.; Zou, C.; Cai, J.; Wang, D.; Fan, S.; Zhang, Z.; Deng, X.; Tan, Y.; et al. Genome-wide identification, phylogeny, and expression analysis of pectin methylesterases reveal their major role in cotton fiber development. BMC Genom. 2016, 17, 1000. [Google Scholar] [CrossRef]
  27. Ke, X.; Wang, H.; Li, Y.; Zhu, B.; Zang, Y.; He, Y.; Cao, J.; Zhu, Z.; Yu, Y. Genome-wide identification and analysis of polygalacturonase genes in Solanum lycopersicum. Int. J. Mol. Sci. 2018, 19, 2290. [Google Scholar] [CrossRef]
  28. Yu, Y.; Liang, Y.; Lv, M.; Wu, J.; Lu, G.; Cao, J. Genome-wide identification and characterization of polygalacturonase genes in cucumis sativus and citrullus lanatus. Plant Physiol. Biochem. 2014, 74, 263–275. [Google Scholar] [CrossRef]
  29. Grimplet, J.; Adam-Blondon, A.F.; Bert, P.F.; Bitz, O.; Cantu, D.; Davies, C.; Delrot, S.; Pezzotti, M.; Rombauts, S.; Cramer, G.R. The grapevine gene nomenclature system. BMC Genom. 2014, 15, 1077. [Google Scholar] [CrossRef]
  30. Hurles, M. Gene duplication: The genomic trade in spare parts. PLoS Biol. 2004, 2, E206. [Google Scholar] [CrossRef]
  31. Fasoli, M.; Dal Santo, S.; Zenoni, S.; Tornielli, G.B.; Farina, L.; Zamboni, A.; Porceddu, A.; Venturini, L.; Bicego, M.; Murino, V.; et al. The grapevine expression atlas reveals a deep transcriptome shift driving the entire plant into a maturation program. Plant Cell 2012, 24, 3489–3505. [Google Scholar] [CrossRef] [PubMed]
  32. Hadfield, K.A.; Bennett, A.B. Polygalacturonases: Many genes in search of a function. Plant Physiol 1998, 117, 337–343. [Google Scholar] [CrossRef] [PubMed]
  33. Khan, N.; Hu, C.M. Genome-wide identification, classification, and expression divergence of glutathione-transferase family in Brassica rapa under multiple hormone treatments. BioMed Res. Int. 2018, 2018, 6023457. [Google Scholar] [CrossRef] [PubMed]
  34. Juretic, N.; Hoen, D.R.; Huynh, M.L.; Harrison, P.M.; Bureau, T.E. The evolutionary fate of mule-mediated duplications of host gene fragments in rice. Genome Res. 2005, 15, 1292–1297. [Google Scholar] [CrossRef] [PubMed]
  35. Li, J.; Zhang, Z.; Vang, S.; Yu, J.; Wong, G.K.-S.; Wang, J. Correlation between ka/ks and ks is related to substitution model and evolutionary lineage. J. Mol. Evol. 2009, 68, 414–423. [Google Scholar] [CrossRef] [PubMed]
  36. Lynch, M.; Conery, J.S. The evolutionary fate and consequences of duplicate genes. Science 2000, 290, 1151–1155. [Google Scholar] [CrossRef] [PubMed]
  37. Shazadee, H.; Khan, N. Identification and expression profiling of protein phosphatases (pp2c) gene family in Gossypium hirsutum L. Int. J. Mol. Sci. 2019, 20, 1395. [Google Scholar] [CrossRef] [PubMed]
  38. Moghe, G.D.; Shiu, S.H. The causes and molecular consequences of polyploidy in flowering plants. Ann. N. Y. Acad. Sci. 2014, 1320, 16–34. [Google Scholar] [CrossRef] [PubMed]
  39. Prince, V.E.; Pickett, F.B. Splitting pairs: The diverging fates of duplicated genes. Nat. Rev. Genet. 2002, 3, 827–837. [Google Scholar] [CrossRef] [PubMed]
  40. Haider, M.S.; Khan, N.; Pervaiz, T.; Zhongjie, L.; Nasim, M.; Jogaiah, S.; Mushtaq, N.; Jiu, S.; Jinggui, F. Genome-wide identification, evolution, and molecular characterization of the pp2c gene family in woodland strawberry. Gene 2019, 702, 27–35. [Google Scholar] [CrossRef] [PubMed]
  41. Liang, Y.; Yu, Y.; Cui, J.; Lyu, M.; Xu, L.; Cao, J. A comparative analysis of the evolution, expression, and cis-regulatory element of polygalacturonase genes in grasses and dicots. Funct. Integr. Genom. 2016, 16, 641–656. [Google Scholar] [CrossRef] [PubMed]
  42. Yang, Z.L.; Liu, H.J.; Wang, X.R.; Zeng, Q.Y. Molecular evolution and expression divergence of the populus polygalacturonase supergene family shed light on the evolution of increasingly complex organs in plants. New Phytol. 2013, 197, 1353–1365. [Google Scholar] [CrossRef] [PubMed]
  43. Chen, M.-H.; Citovsky, V. Systemic movement of a tobamovirus requires host cell pectin methylesterase. Plant J. 2003, 35, 386–392. [Google Scholar] [CrossRef] [PubMed] [Green Version]
  44. Raiola, A.; Lionetti, V.; Elmaghraby, I.; Immerzeel, P.; Mellerowicz, E.J.; Salvi, G.; Cervone, F.; Bellincampi, D. Pectin methylesterase is induced in Arabidopsis upon infection and is necessary for a successful colonization by necrotrophic pathogens. Mol. Plant-Microbe Interact. 2011, 24, 432–440. [Google Scholar] [CrossRef] [PubMed]
  45. Solecka, D.; Zebrowski, J.; Kacperska, A. Are pectins involved in cold acclimation and de-acclimation of winter oil-seed rape plants? Ann. Bot. 2008, 101, 521–530. [Google Scholar] [CrossRef] [PubMed]
  46. An, S.H.; Sohn, K.H.; Choi, H.W.; Hwang, I.S.; Lee, S.C.; Hwang, B.K. Pepper pectin methylesterase inhibitor protein capmei1 is required for antifungal activity, basal disease resistance and abiotic stress tolerance. Planta 2008, 228, 61–78. [Google Scholar] [CrossRef]
  47. Mundaya, N.J.; Owen, S.D.W.; Iain, M.; Alan, T.C.; David, H.; Balakrishnan, P. Analysis of seaweed extract-induced transcriptome leads to identification of a negative regulator of salt tolerance in Arabidopsis. Hortsci. Horts 2012, 47, 704–709. [Google Scholar]
  48. Goodstein, D.M.; Shu, S.; Howson, R.; Neupane, R.; Hayes, R.D.; Fazo, J.; Mitros, T.; Dirks, W.; Hellsten, U.; Putnam, N.; et al. Phytozome: A comparative platform for green plant genomics. Nucleic Acids Res. 2012, 40, D1178–D1186. [Google Scholar] [CrossRef]
  49. Letunic, I.; Doerks, T.; Bork, P. Smart 7: Recent updates to the protein domain annotation resource. Nucleic Acids Res. 2012, 40, D302–D305. [Google Scholar] [CrossRef]
  50. Edgar, R.C. Muscle: Multiple sequence alignment with high accuracy and high throughput. Nucleic Acids Res. 2004, 32, 1792–1797. [Google Scholar] [CrossRef]
  51. Kumar, S.; Stecher, G.; Tamura, K. Mega7: Molecular evolutionary genetics analysis version 7.0 for bigger datasets. Mol. Biol. Evol. 2016, 33, 1870–1874. [Google Scholar] [CrossRef] [PubMed]
  52. Chen, C.; Xia, R.; Chen, H.; He, Y. Tbtools, a toolkit for biologists integrating various hts-data handling tools with a user-friendly interface. bioRxiv 2018, 289660. [Google Scholar] [CrossRef]
  53. Bailey, T.L.; Boden, M.; Buske, F.A.; Frith, M.; Grant, C.E.; Clementi, L.; Ren, J.; Li, W.W.; Noble, W.S. Meme suite: Tools for motif discovery and searching. Nucleic Acids Res. 2009, 37, W202–W208. [Google Scholar] [CrossRef] [PubMed]
  54. Lescot, M.; Déhais, P.; Thijs, G.; Marchal, K.; Moreau, Y.; Van de Peer, Y.; Rouzé, P.; Rombauts, S. Plantcare, a database of plant cis-acting regulatory elements and a portal to tools for in silico analysis of promoter sequences. Nucleic Acids Res. 2002, 30, 325–327. [Google Scholar] [CrossRef] [PubMed]
  55. Haider, M.S.; Jogaiah, S.; Pervaiz, T.; Yanxue, Z.; Khan, N.; Fang, J. Physiological and transcriptional variations inducing complex adaptive mechanisms in grapevine by salt stress. Environ. Exp. Bot. 2019, 162, 455–467. [Google Scholar] [CrossRef]
  56. Khan, N.; Hu, C.-M.; Amjad Khan, W.; Naseri, E.; Ke, H.; Huijie, D.; Hou, X. Evolution and expression divergence of e2 gene family under multiple abiotic and phytohormones stresses in Brassica rapa. Biomed Res. Int. 2018, 2018, 18. [Google Scholar] [CrossRef] [PubMed]
  57. Khan, N.; Hu, C.-M.; Khan, W.A.; Wang, W.; Ke, H.; Huijie, D.; Zhishuo, Z.; Hou, X. Genome-wide identification, classification, and expression pattern of homeobox gene family in Brassica rapa under various stresses. Sci. Rep. 2018, 8, 16265. [Google Scholar] [CrossRef] [PubMed]
  58. Shangguan, L.; Fang, X.; Chen, L.; Cui, L.; Fang, J. Genome-wide analysis of autophagy-related genes (args) in grapevine and plant tolerance to copper stress. Planta 2018, 247, 1449–1463. [Google Scholar] [CrossRef]
  59. Khan, N.; Ke, H.; Hu, C.-M.; Naseri, E.; Haider, M.S.; Ayaz, A.; Amjad Khan, W.; Wang, J.; Hou, X. Genome-wide identification, evolution, and transcriptional profiling of pp2c gene family in Brassica rapa. Biomed Res. Int. 2019, 2019, 15. [Google Scholar] [CrossRef]
Figure 1. Phylogenetic relationship of PG (A) and PME (B) genes between grapevine and Arabidopsis. The phylogenetic tree was constructed by MEGA 7.0 using the Maximum Likelihood Method (1000 bootstrap).
Ijms 20 03180 g001
Figure 2. Phylogenetic relationship of PGs (A). The phylogenetic tree was constructed by MEGA 7.0 using the Maximum Likelihood Method (1000 bootstrap). Motif structure and upstream/downstream regions of PGs (B). The coding sequences (CDS) and untranslated regions (UTR) for PGs in grapevine (C). CDS and UTR are represented by yellow and green boxes. The relative position is proportionally displayed based on the kilobase scale at the bottom of the figures.
Ijms 20 03180 g002
Figure 3. Phylogenetic relationship of PMEs (A). The phylogenetic tree was constructed by MEGA 7.0 using the Maximum Likelihood Method (1000 bootstrap). Motif structure and upstream/downstream regions of PMEs (B). The coding sequences (CDS) and untranslated regions (UTR) for PMEs in grapevine (C). CDS and UTR are represented by yellow and green boxes, respectively. The relative position is proportionally displayed based on the kilobase scale at the bottom of the figures.
Ijms 20 03180 g003
Figure 4. The collinear correlation for all genes of PGs (A) and PMEs (B) is displayed between grapevines and Arabidopsis. The localization of chromosomes was shown for grapevine and Arabidopsis in different random colors.
Ijms 20 03180 g004
Figure 5. Various cis-elements identified in grapevine by using PlantCARE.
Ijms 20 03180 g005
Figure 6. Expression profiles of the PG (A) and PME (B) genes in different grapevine organs, tissues, and, developmental stages. Data were normalized based on the mean expression values of each gene in all analyzed tissues. BerryPericarp-FS: berry pericarp fruit set; BerryPericarp-PFS: berry pericarp post-fruit set; BerryPericarp-V: Bud-S: bud swell; Bud-B: bud burst (green tip); Bud-AB: bud after-burst (rosette of leaf tips visible); Bud-L: latent bud; Bud-W: winter bud; Flower-FB: flowering begins (10% caps off); Flower-F: flowering (50% caps off); Leaf-Y: young leaf (pool of leaves from shoot of 5 leaves); Leaf-FS: mature leaf (pool of leaves from shoot at fruit set); Rachis-FS: rachis fruit set; Rachis-PFS: rachis post fruit set; Stem-G: green stem; Stem-W: woody stem; Tendril-Y: young tendril (pool of tendrils from shoot of 7 leaves); Tendril-WD: well developed tendril (pool of tendrils from shoot of 12 leaves); and Tendril-FS: mature tendril (pool of tendrils at fruit set).
Ijms 20 03180 g006
Figure 7. Relative expressions of PGs (A) and PMEs (B) in various organs, including root, stem, tendril, inflorescence, flesh, skins, and leaves and their principal component analysis for PGs (C) and PMEs (D).
Ijms 20 03180 g007
Table 1. Duplications of the PG and PME genes in grapevine.
Gene 1Gene 2KsKaKa/KsSelection PressureGene Duplications
Between PG genes
VvPG1VvPG20.0290.0220.77Purifying SelectionTandem
VvPG3VvPG40.0340.0160.47Purifying SelectionTandem
VvPG6VvPG250.8520.5790.68Purifying SelectionTandem
VvPG28VvPG310.7380.6930.94Purifying SelectionTandem
VvPG33VvPG340.6630.1970.30Purifying SelectionTandem
VvPG8VvPG90.50.4580.92Purifying SelectionDispersed
VvPG12VvPG130.6260.580.93Purifying SelectionDispersed
VvPG16VvPG170.8790.4720.54Purifying SelectionDispersed
VvPG20VvPG241.560.4190.27Purifying SelectionDispersed
VvPG29VvPG300.5220.6281.20Positive SelectionDispersed
VvPG5VvPG70.3760.4091.09Positive SelectionWGD or Segmental
VvPG10VvPG111.2660.2310.18Purifying SelectionWGD or Segmental
VvPG14VvPG150.2120.3431.62Positive SelectionWGD or Segmental
VvPG18VvPG210.5150.5221.01Positive SelectionWGD or Segmental
VvPG22VvPG231.4010.1520.11Purifying SelectionWGD or Segmental
Between PME genes
VvPME2VvPME31.3120.4210.32Purifying SelectionDispersed
VvPME5VvPME160.5270.6251.19Positive SelectionDispersed
VvPME18VvPME191.1020.4420.40Purifying SelectionDispersed
VvPME20VvPME210.8810.4640.53Purifying SelectionDispersed
VvPME22VvPME230.4460.6811.53Positive SelectionDispersed
VvPME27VvPME281.0420.3340.32Purifying SelectionDispersed
VvPME35VvPME360.5650.6971.23Positive SelectionDispersed
VvPME1VvPME40.7980.4380.55Purifying SelectionTandem
VvPME8VvPME100.180.0190.11Purifying SelectionTandem
VvPME11VvPME120.8790.0860.10Purifying SelectionTandem
VvPME13VvPME151.0350.1710.17Purifying SelectionTandem
VvPME17VvPME250.640.6310.99Purifying SelectionTandem
VvPME6VvPME70.2710.411.51Positive SelectionWGD or Segmental
VvPME14VvPME260.3040.441.45Positive SelectionWGD or Segmental
VvPME33VvPME341.2840.2090.16Purifying SelectionWGD or Segmental

