Article

The Complete Chloroplast Genomes of Punica granatum and a Comparison with Other Species in Lythraceae

1
Co-Innovation Center for Sustainable Forestry in Southern China, Nanjing Forestry University, Nanjing 210037, China
2
College of Forestry, Nanjing Forestry University, Nanjing 210037, China
3
College of Landscape Architecture, Nanjing Forestry University, Nanjing 210037, China
*
Author to whom correspondence should be addressed.
Int. J. Mol. Sci. 2019, 20(12), 2886; https://doi.org/10.3390/ijms20122886
Submission received: 7 April 2019 / Revised: 2 June 2019 / Accepted: 4 June 2019 / Published: 13 June 2019
(This article belongs to the Special Issue Plant Genomics 2019)

Abstract

:
Pomegranates (Punica granatum L.) are one of the most popular fruit trees cultivated in arid and semi-arid tropics and subtropics. In this study, we determined and characterized three complete chloroplast (cp) genomes of P. granatum cultivars with different phenotypes using the genome skimming approach. The complete cp genomes of three pomegranate cultivars displayed the typical quadripartite structure of angiosperms, and their length ranged from 156,638 to 156,639 bp. They encoded 113 unique genes and 17 are duplicated in the inverted regions. We analyzed the sequence diversity of pomegranate cp genomes coupled with two previous reports. The results showed that the sequence diversity is extremely low and no informative sites were detected, which suggests that cp genome sequences may be not be suitable for investigating the genetic diversity of pomegranate genotypes. Further, we analyzed the codon usage pattern and identified the potential RNA editing sites. A comparative cp genome analysis with other species within Lythraceae revealed that the gene content and organization are highly conserved. Based on a site-specific model, 11 genes with positively selected sites were detected, and most of them were photosynthesis-related genes and genetic system-related genes. Together with previously released cp genomes of the order Myrtales, we determined the taxonomic position of P. granatum based on the complete chloroplast genomes. Phylogenetic analysis suggested that P. granatum form a single clade with other species from Lythraceae with a high support value. The complete cp genomes provides valuable information for understanding the phylogenetic position of P. gramatum in the order Myrtales.

1. Introduction

Pomegranates (Punica granatum L.) are an economically important fruit tree of the tropical and subtropical regions of the world. It is native to central Asia and has been highly praised in many human cultures since ancient times [1]. Pomegranates have showy edible fruit with a high content of anthocyanins and flavonoids [2,3]. It has been well demonstrated that pomegranates are valuable to human health due to high levels of flavonoids and anthocyanins, which are considered potent antioxidants offering protection against heart disease and cancer [4,5]. Also, the pomegranate tree is suitable for genetic analysis due to its short juvenile period, and the high number of progenies [6]. As important resources for basic research and crop improvement, the genome of P. granatum ‘Taishanhong’ has been determined [7]. This genome will shed new light on the understanding of some unique biological processes and pomegranate breeding. Compared to the nuclear genome, the complete chloroplast genome is a low-cost and efficient way to get valuable genomic resources that can be used to understand evolution at multiple taxonomic levels [8,9] and analyze the population [10] because of its highly conserved structures and comparatively moderate substitution rates [11].
Chloroplasts (cp) are the photosynthetic organelles of the plant cells, which are derived from free-living cyanobacteria through endosymbiosis [12]. Apart from playing key roles in photosynthesis, chloroplasts are also responsible for other aspects of plant physiology and development [13]. A new study found that chloroplast retrograde signaling can regulate nuclear alternative splicing of a subset of Arabidopsis thaliana transcripts [14,15]. Interestingly, researchers have found that chloroplasts play diverse roles in plant defense, including contributing to the production of defense compounds [16]. Chloroplasts contain their own genome, the chloroplast DNA (cpDNA), which is highly conserved in genomic structure, gene content, and gene order. Cp genomes have been proved to be an effective biological tool for rapid and accurate species recognition as super-barcode [17,18]. With the advent of high-throughput sequencing technology, the increasing number of cp genomes of fruit crops has been published [19,20,21]. Before the development of next-generation sequencing technology, cp genome assembly was usually based on conventional primer walking strategies [22,23], which are laborious and costly. It is now convenient to obtain complete a cp genome by using genomic DNA extracted from the leaf tissue, because a large number of cp genomes are present in the sample [24]. Based on homology to cp from related species, these reads from cp can be assembled into circle genomes. Many bioinformatic tools have been developed to recover the cp genome sequence from total genomic DNA, such as NOVOPlasty [25], chloroExtractor [26], and GetOrganelle [27].
In the present study, we obtained cp genomes of pomegranates from three phenotypically different cultivars using the whole genome sequencing data. This study aimed to conduct a comprehensive analysis of the pomegranate cp genome, including gene content, genomic structure, codon usage, and potential RNA editing sites. In addition, combined with previously published cp genomes of Myrtales, phylogenetic analysis was performed to determine the taxonomic position of P. granatum. The results obtained here will provide valuable information for understanding the phylogenetic position of pomegranates and the evolutionary history of the order Myrtales.

2. Results and Discussion

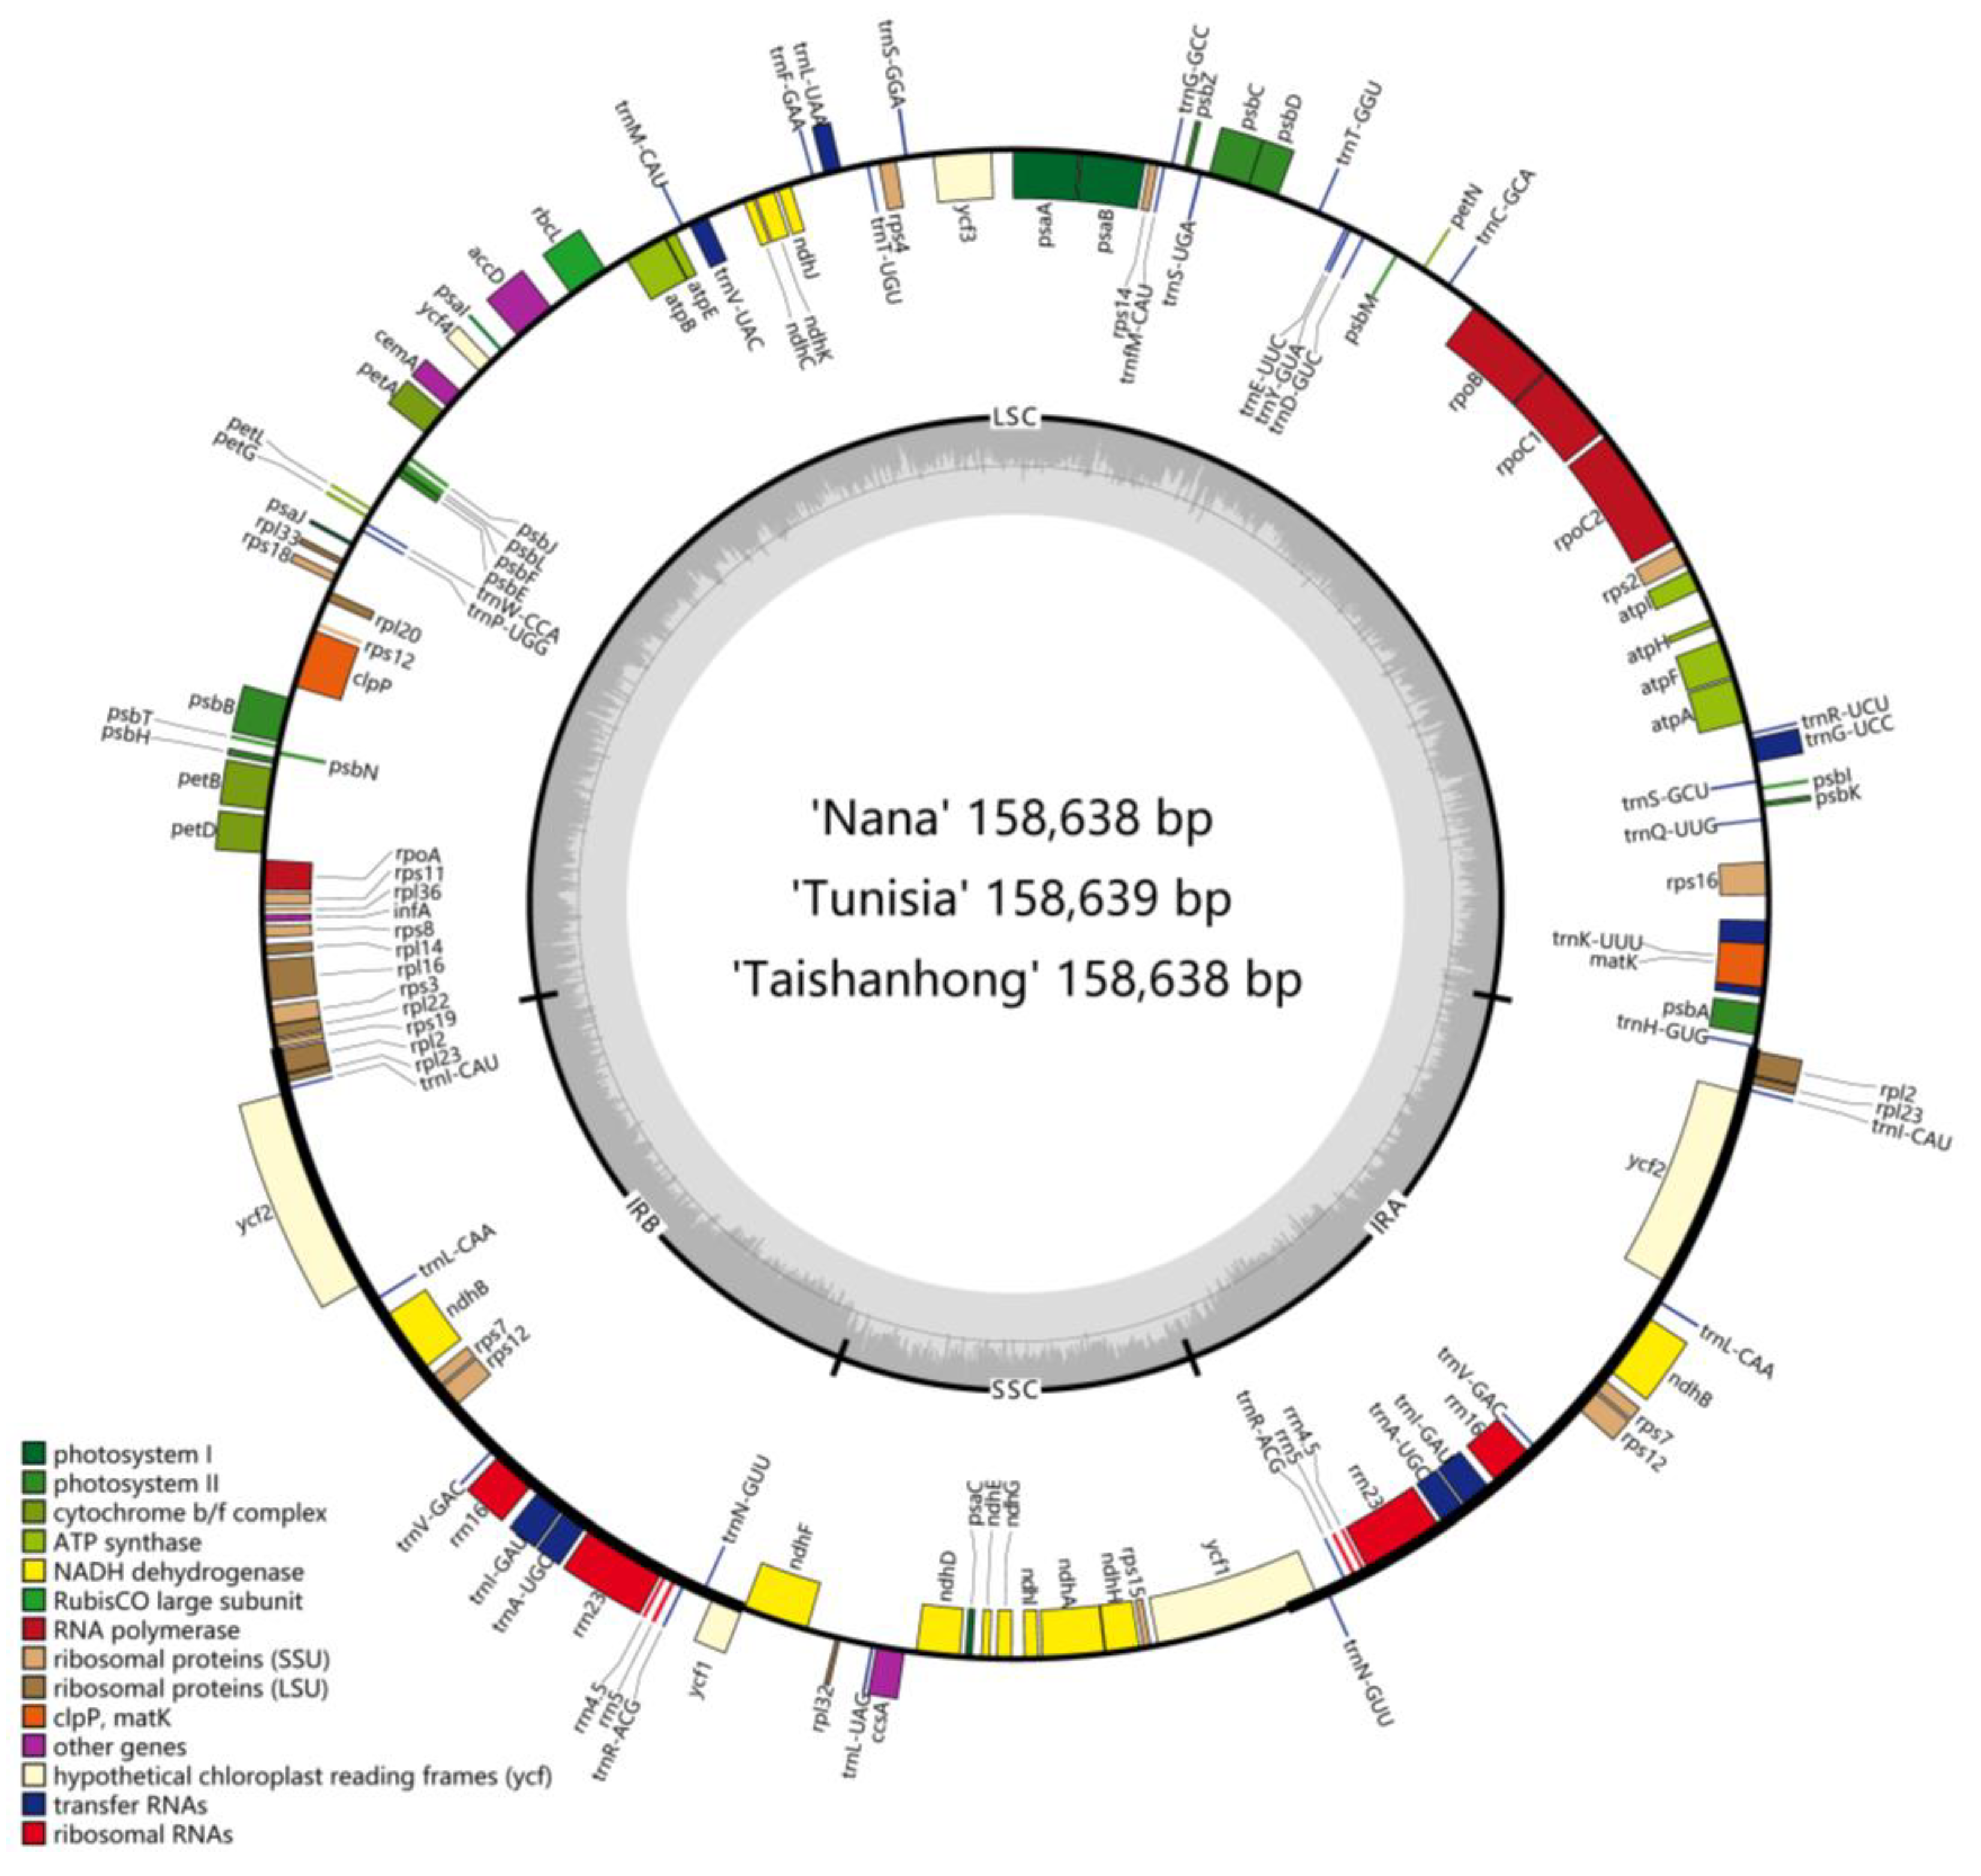
2.1. General Features of Pomegranate Chloroplast Genomes

The complete cp genomes of ‘Nana’, ‘Tunisia’, and ‘Taishanhong’ were de novo assembled using whole genome sequencing data with GetOrganelle [27]. The cp genomes of ‘Nana’, ‘Tunisia’, and ‘Taishanhong’ were found to be 158,638, 158,639, and 158,638 bp in size, respectively. All of them exhibited a typical quadripartite structure, consisting of a pair of IRs separated by a large single copy region (LSC) and a small single copy region (SSC) (Figure 1). There are identical sets of 113 genes with the same gene order, including 79 protein-coding, 30 tRNA, and 4 rRNA genes. Six protein-coding genes (rps7, rps12, rpl2, rpl23, ndhB, ycf2), seven tRNA genes (trnI-CAU, trnN-GUU, trnR-ACG, trnA-UGC, trnI-GAU, trnV-GAC, trnL-CAA), and all rRNA genes (4.5S, 5S, 16S, 23S) are located at the IR regions. Eleven of the protein-coding genes and six of the tRNA genes contain introns, 14 of which contain a single intron, whereas three (rps12, ycf3, clpP) have two introns (Table 1). In particular, the rps12 is a trans-spliced gene, whose first exon is located in the LSC, while the second and third exons reside in IRs. The infA gene was identified as a pseudogene because of the accumulation of the premature stop codons [28]. Another pseudogene ycf1 existed because of the incomplete duplication of the normal copy of ycf1 in the IRa and SSC junction, which is identical with previous reports [29,30]. There are some exceptions where non-ATG codons were identified as start codons, such as ACG for psbL, GTG for rps19, and ACG for ndhD. Alternate start codons have been found in other plant species [31]. Alternate start codons are still translated as Met when they are the start of a protein because a separate transfer RNA is used for initiation [32]. The overall GC content was 36.92%; this was consistent with previously reported GC content of IRs (42.78%) being higher than that of the LSC (34.89%) and SSC (30.64%) [33]. The high GC percentage of IRs could be due to the presence of rRNA sequences in these regions [34].
Chloroplast DNA has already been used in accessing the genetic diversity and phylogenetic structure at an intraspecies level. For instance, hypervariable regions of cp DNA such as atpB-rbcL, trnL-trnF and rps16-trnQ were used to assess the genetic diversity of Tunisian apricot accessions [35]. Also, chloroplast microsatellite loci were used to investigate the genetic diversity of Iranian pomegranate genotypes [36]. In our present study, the sequence diversity of pomegranate cp genomes was investigated combined with two previously reported cp genomes (NC_035240, MG878386). The results showed that the sequence diversity of pomegranates is extremely low (0.0008). Only 42 singleton variable sites were detected, and there were no parsimony variable sites in the alignment of the cp genomes of the five pomegranate accessions. Therefore, we propose that cp genome sequences might not be appropriate for investigating the genetic diversity of pomegranate genotypes.

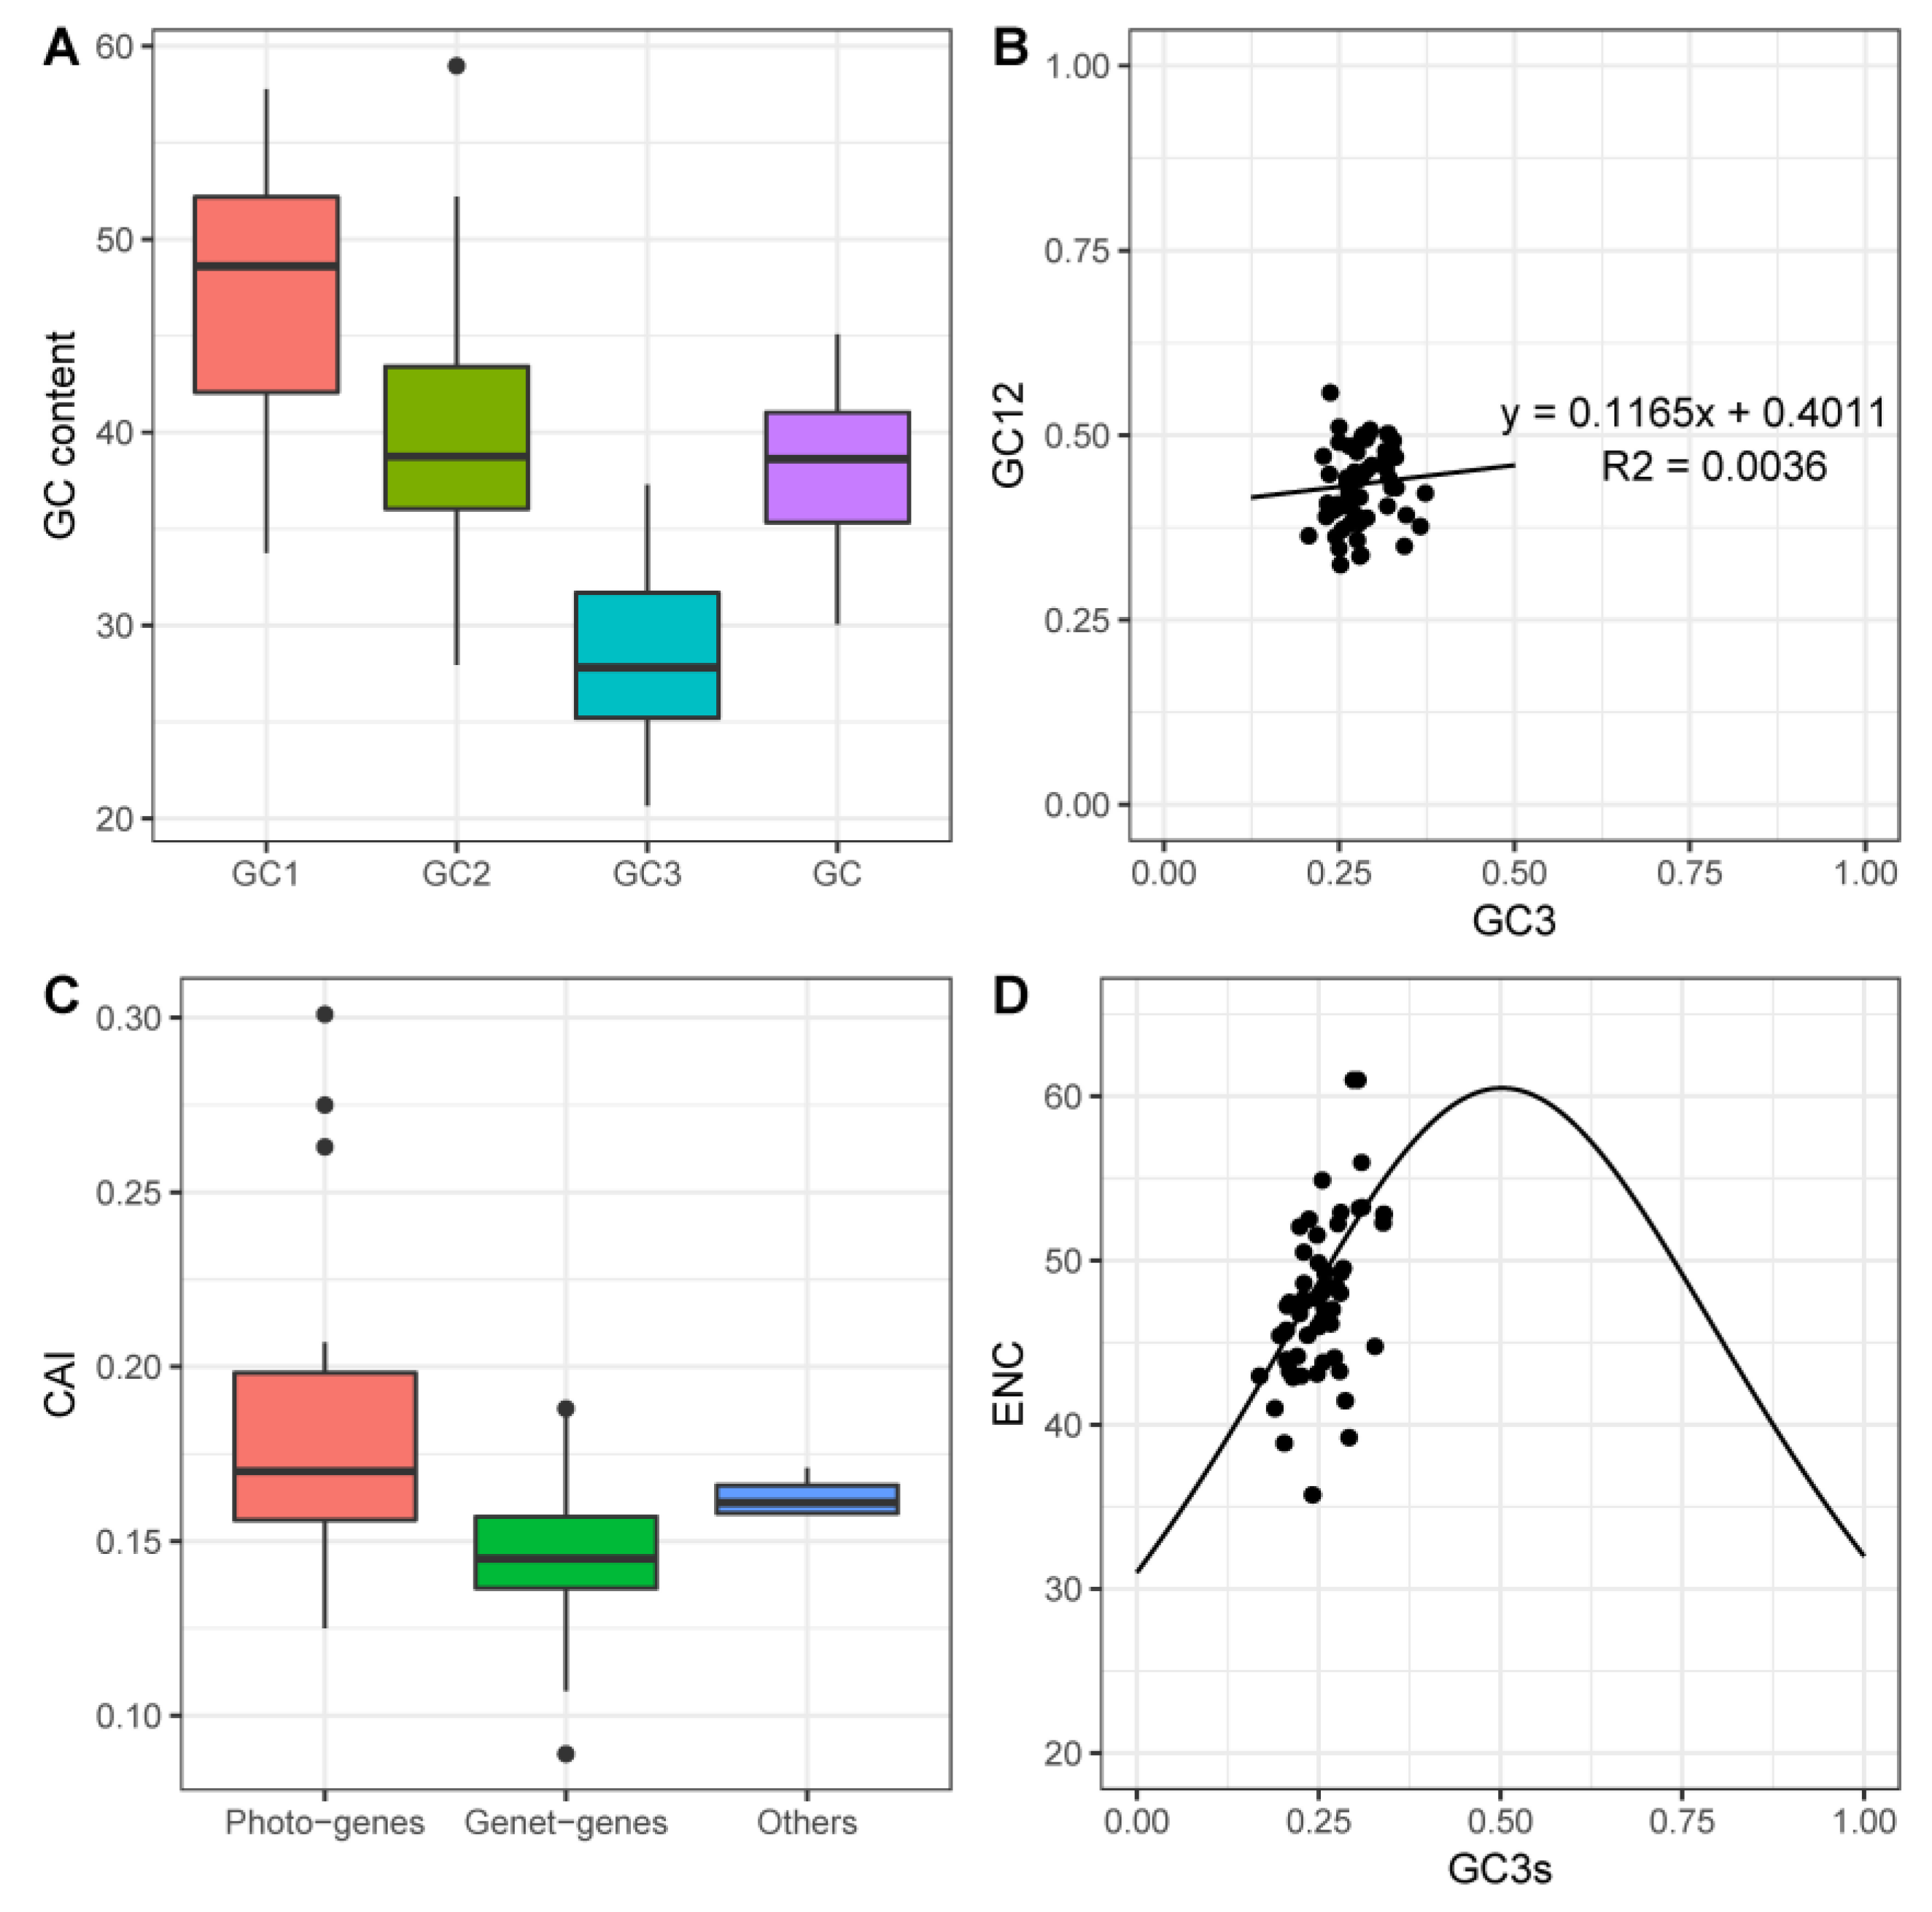
2.2. Codon Usage Bias

As an essential evolutionary feature, the codon usage pattern has been widely investigated in many plant species [37,38,39]. In our study, we explored the codon usage pattern in the cp genomes of pomegranates. Protein-coding genes with more than 300 nucleotides were selected for further analysis. Firstly, the base composition on three different codon positions was determined, and the data are displayed in Figure 2A. The results indicated that the average GC content of the first (GC1), second (GC), and third codon positions (GC3) were 47.04, 39.79, and 28.34%, respectively. The base compositions of the three different positions were distributed unevenly. The average GC3 content was significantly lower than those of GC1 and GC2. The results of neutrality plots (Figure 2B) showed that no significant correlation (R2 = 0.0036) between GC12 and GC3 was observed, which suggests that selective pressure affects the codon usage bias in the pomegranate cp genomes [40,41]. The codon adaptation index (CAI) value (Figure 2C) ranged from 0.5 to 1 with a default E. coli reference gene set as the reference. According to their functions in the chloroplast, the protein-coding genes can be classified into three categories: photosynthesis related genes (photo-genes), genetic system related genes (genet-genes), and other genes. A recent study about codon usage bias of cp genomes in cultivated and wild Solanum species concluded that photo-genes always had higher CAI values than genet-genes because the expression level of photo-genes is relatively higher than that of genet-genes [42]. The same result was also observed in the cp genome of pomegranates. The main reason is probably due to the fact that photo-genes may have a higher codon usage bias for the requirement of high gene expression than do the genet-genes in the plant cp genomes. Furthermore, the relationship between bas compositions and codon usage was investigated by ENC-plot (Figure 2D). Effective number of codons (ENC) values ranged from 35.73 to 61, suggesting that codon usage bias is relatively weak in the pomegranate cp genomes. The distribution of most genes was far away from the standard curve, which shows that there are other factors that affect the codon usage, other than base compositions [43,44,45]. As the cp genomes were highly AT-rich, it was not surprising that AT-ending codons would be predominant in the protein-coding genes. The results are also consistent with the mutational bias towards AT being the force driving the strong bias of codon usage of plan cp genomes [43]. Also, the Arg amino acid coded with the AGA codon was the most frequent codon with a relative synonymous codon usage (RSCU) value 2.02 (Table 2).

2.3. RNA Editing Sites

RNA editing is a posttranscriptional process, which has been experimentally identified in organellar transcriptomes from several species [46,47]. It mainly involves the conversion of cytidine to uridine, which generally results in amino acid changes. Therefore, knowing where sites of RNA editing exist in the organelle transcriptome could provide information for understanding the structure and function of the translated proteins [48]. The potential RNA editing sites in the pomegranate cp genome were predicted using the online program PREP. A total of 64 editing sites in 20 protein-coding genes were identified (Table 3). The ndhB gene had the highest number of potential editing sites (11), followed by the ndhD gene (9). In accordance with previous reports [49,50], we observed that most conversions at the codon positions changed from serine (S) to leucine (L) and most RNA editing sites led to amino acid changes from polar to apolar, which resulted in an increase in protein hydrophobicity.

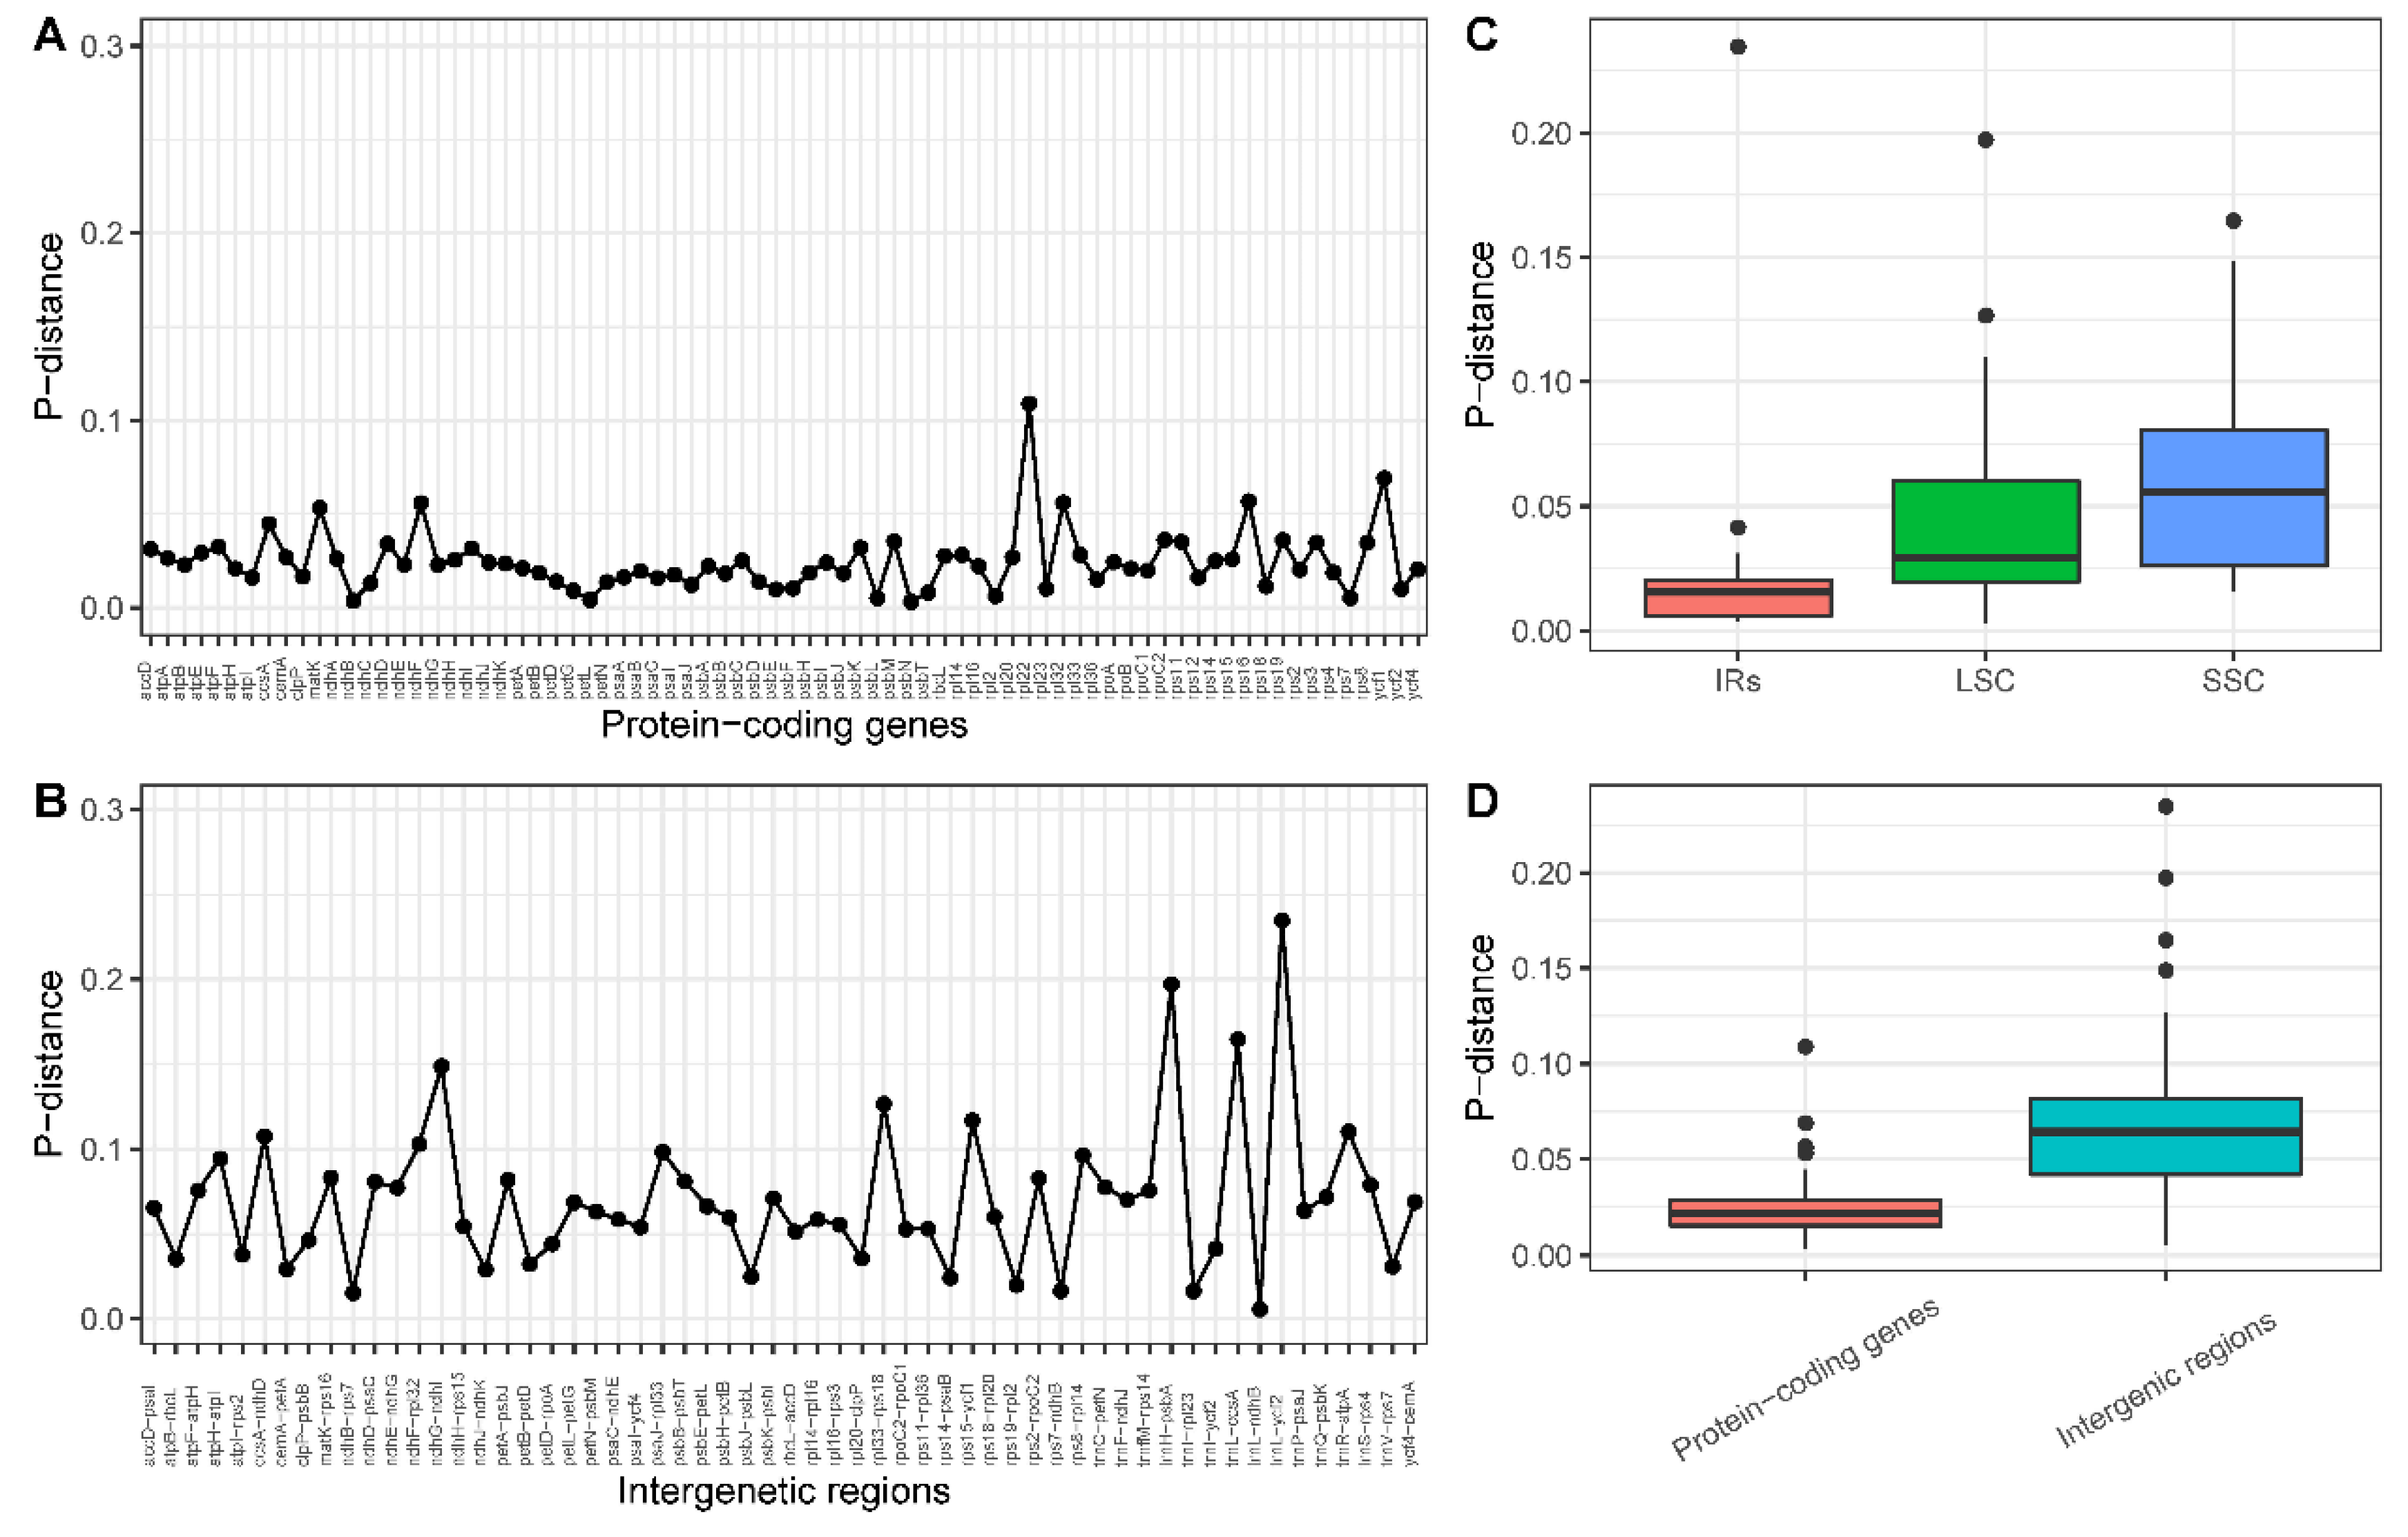
2.4. Sequence Diversity of the Chloroplast Genomes among Lythraceae Species

Four complete cp genomes within Lythraceae, available in GenBank with our newly assembled ‘Taishanhong’, were selected to analyze the sequence diversity. The mean P-distance value was designated to represent the level of divergence. The genetic distance of all 76 protein-coding genes (Figure 3A) ranged from 0.003053 (psbN) to 0.108932 (rpl22), with an average of 0.024379. The intergenic regions had a relatively higher genetic distance (Figure 3B) compared to the protein-coding regions, ranging from 0.005621 (trnL-ndhB) to 0.23463 (trnL-ycf2) with an average value of 0.069775. The results agree with previous reports that intergenic regions showed greater divergence than coding regions (Figure 3D) [51]. The SSC region exhibited higher divergence levels than the LSC and IRs (Figure 3C). Three intergenic regions with genetic distance values over the 95th percentile were considered as highly divergent regions, including trnH-psbA, trnL-ccsA, and trnL-ycf2. These highly variable regions may be regarded as potential molecular markers for application in phylogenetic analyses in Lythraceae.

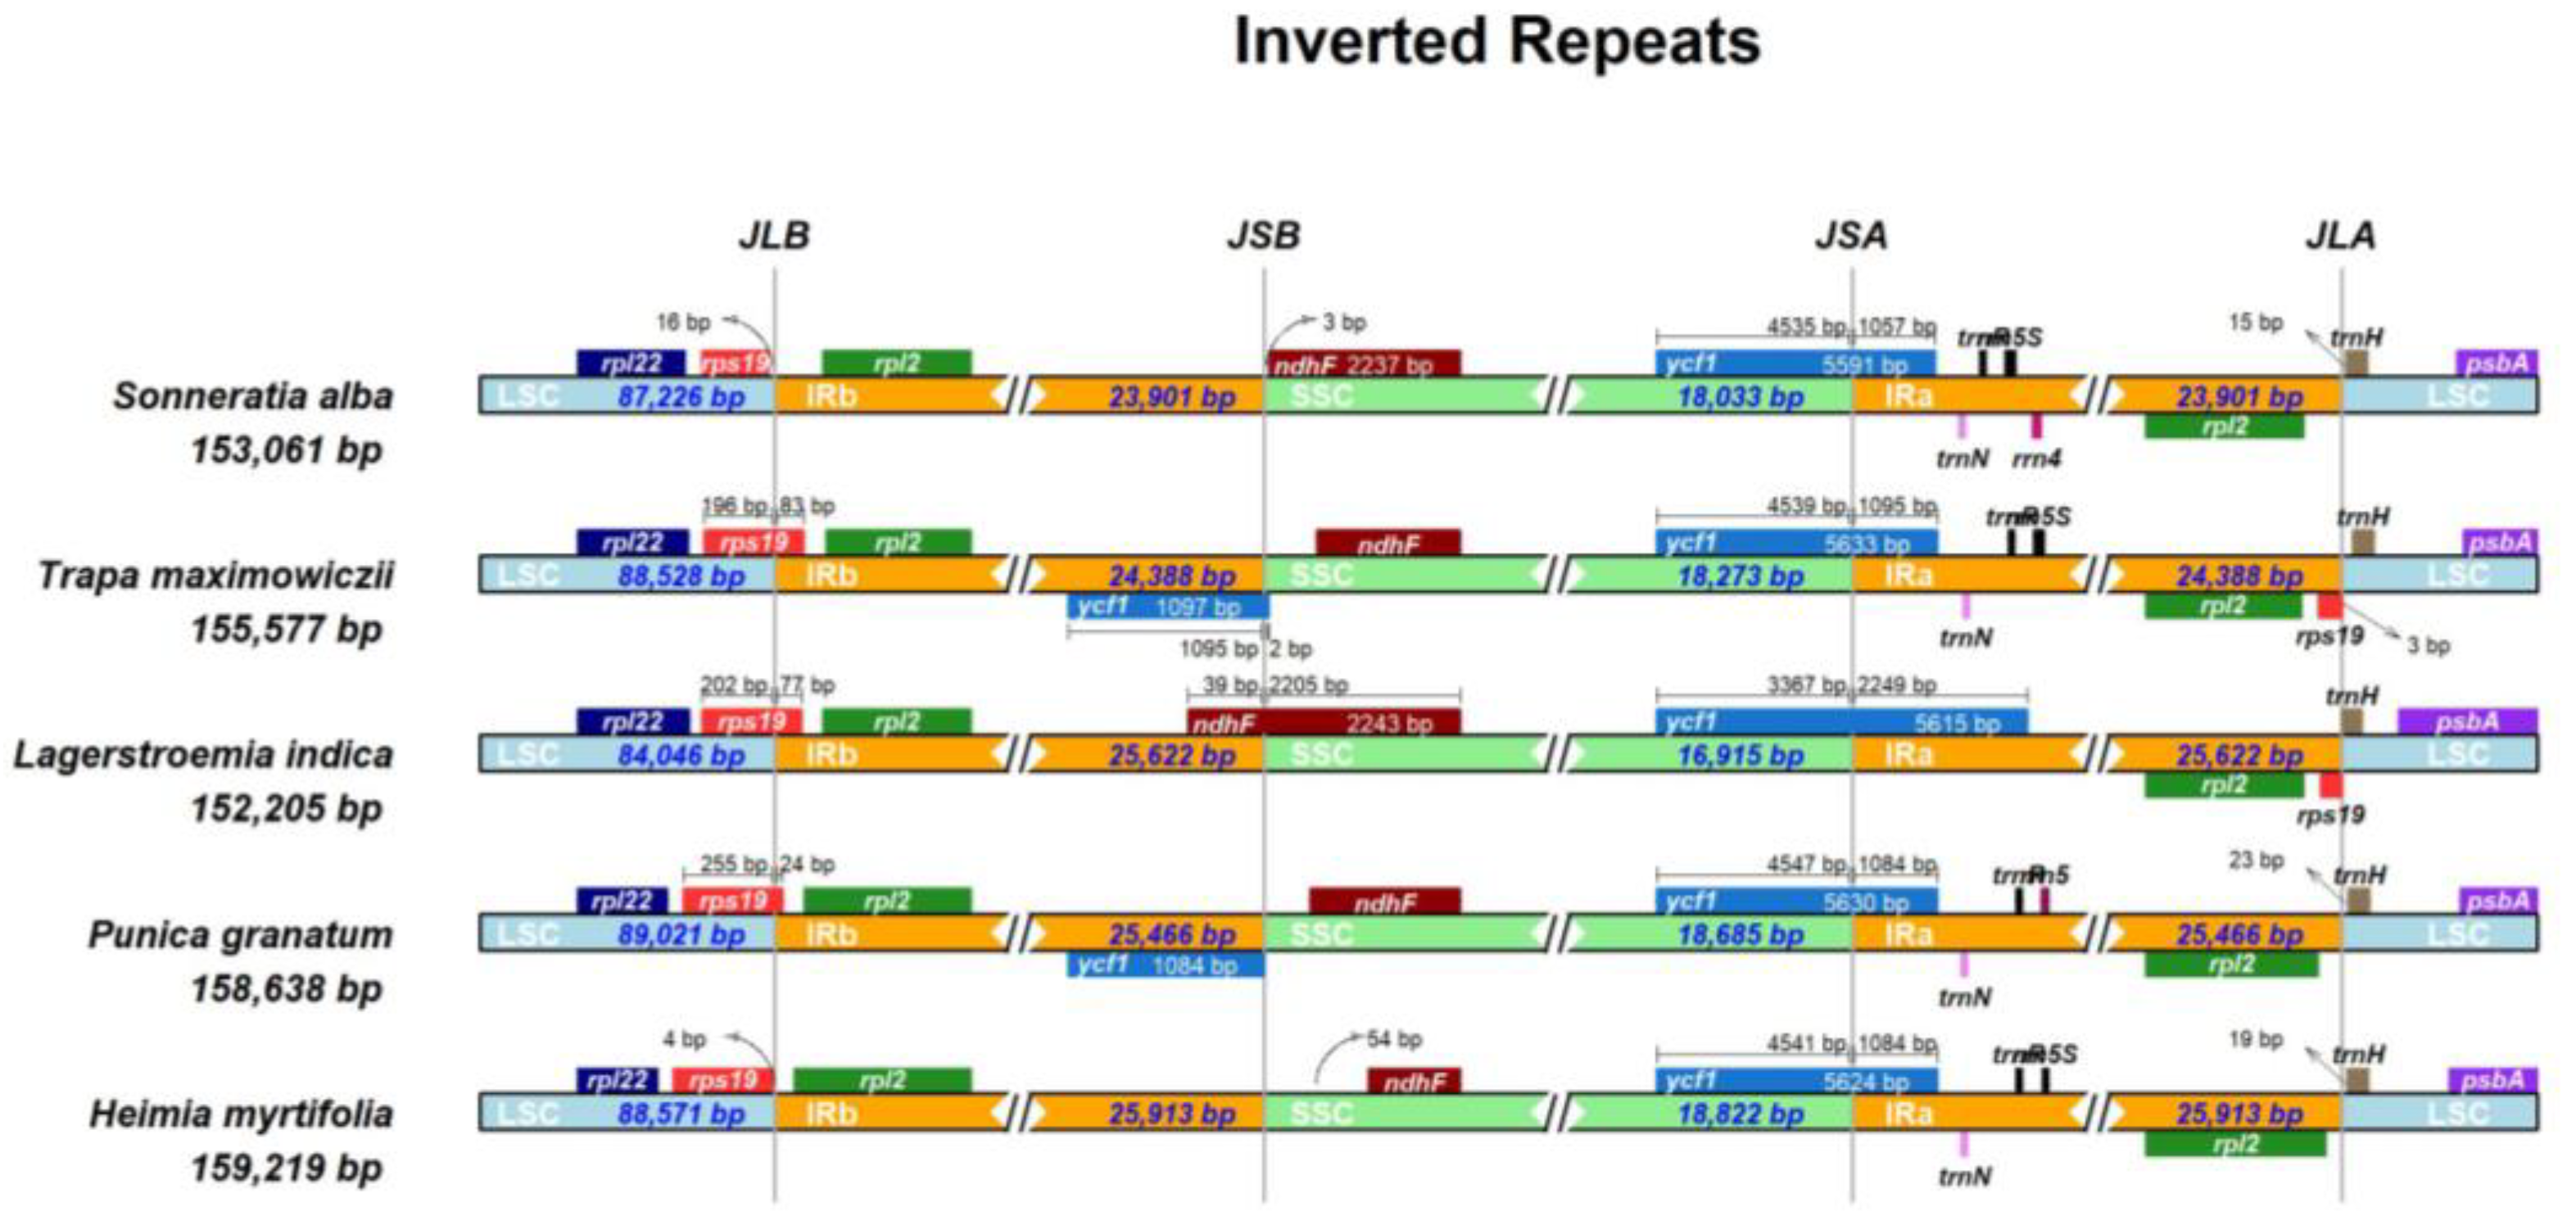
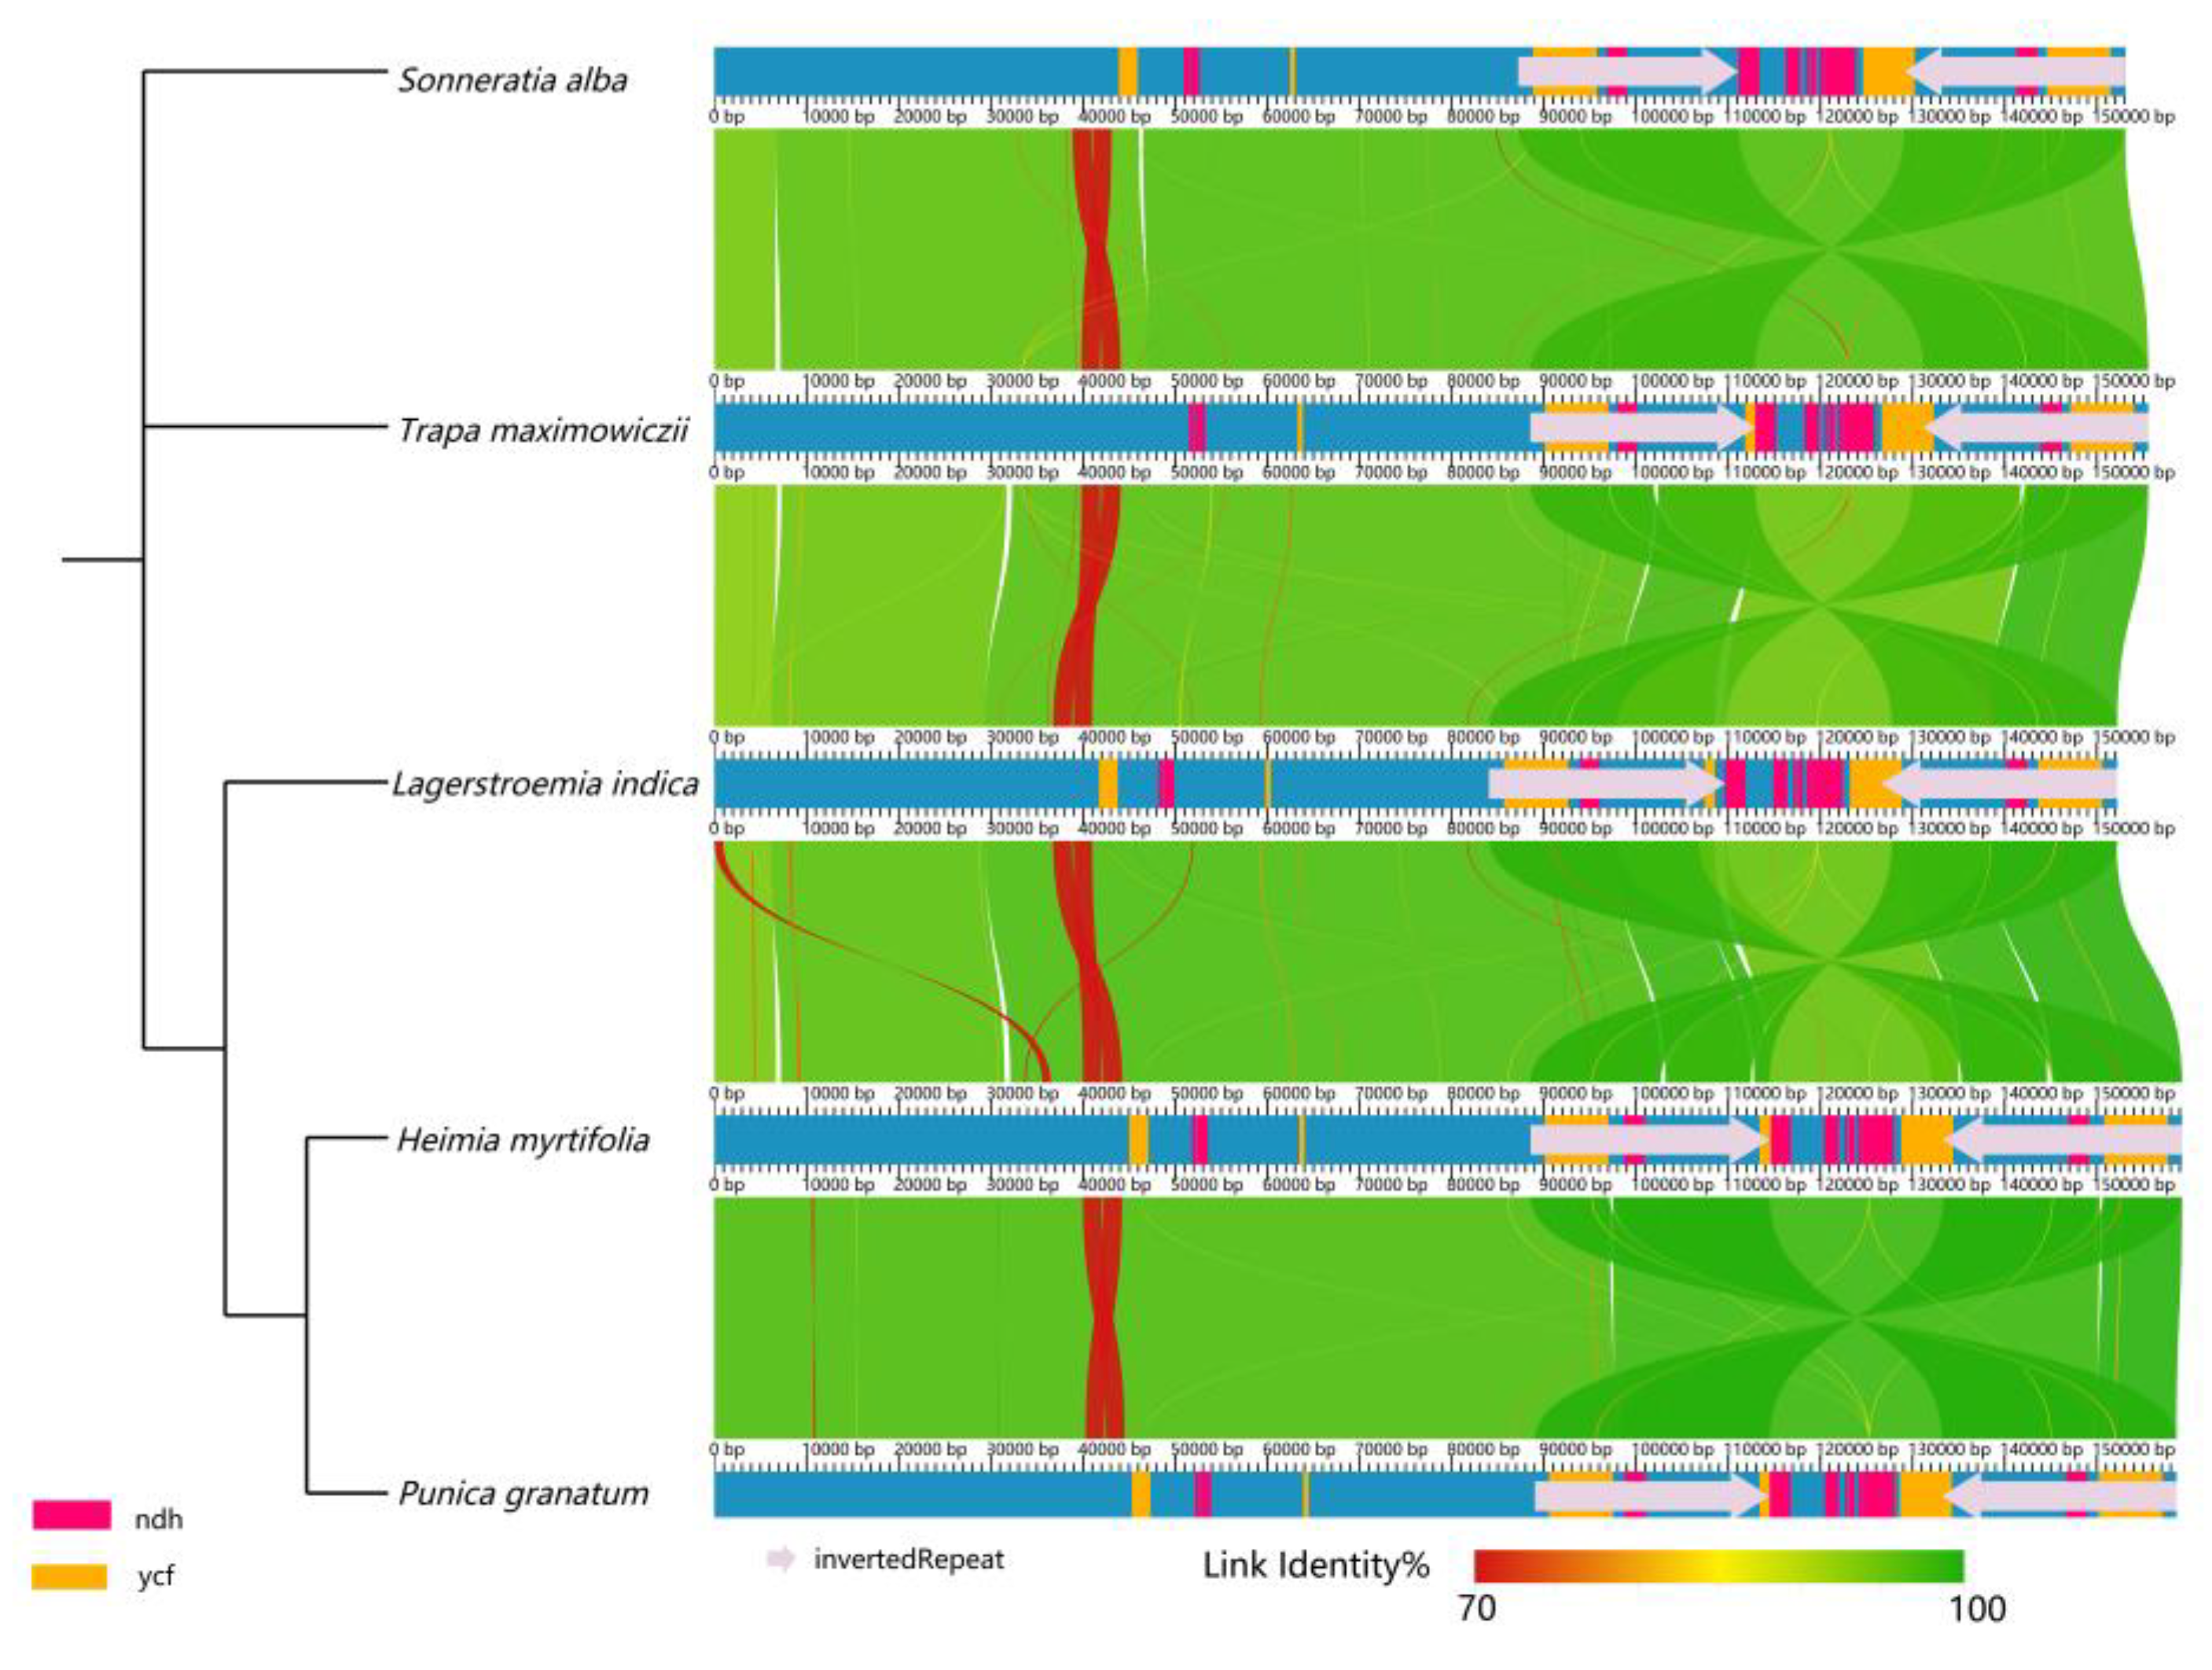
2.5. Structure Comparison among the Chloroplast Genomes of Lythraceae Species

Five complete cp genomes within Lythraceae were selected for comparison with each other. The genome sizes was ranged from 152,205 to 159,219 bp. The length of the LSC, SSC, and IRs varied in the range of 84,046–89,021 bp, 16,914–18,821 bp, and 23,902–25,914 bp, respectively. Lagerstroemia indica has the smallest genome, and this difference is mostly attributed to variation in the length of the LSC and IR regions (Table 4). A detailed comparison on four borders between the two IRs and the two single-copy regions showed that the border structures were highly similar with one another (Figure 4). However, a slight difference in junction positions was observed among these five cp genomes. For instance, the ndhF gene was located at the SSC region in Sonneratia alba, Trapa maximowiczii, Punica granatum, and Heimia myrtifolia, while it varied from 3 to 54 bp apart from the IRb/SSC junction. However, the ndhF gene crossed over the IRb/SSC region in Lagerstroemia indica. The rps19 gene was located in the junction of the LSC/IRb in Trapa maximowiczii, Lagerstroemia indica, and Punica granatum, with 24–83 bp located in the IRb. However, in Heimia myrtifolia and Sonneratia alba, the rps19 gene was fully located in the LSC region, and 4–16 bp apart from the LSC/IRb border. Overall, the IR boundary regions varied slightly in the Lythraceae cp genomes. IR expansion and contraction often results in genome size variations among various plant lineages, which can be used to study the phylogenetic classification and the genome evolution among plant lineages. Three reasons may explain the diversification of the IR boundary region sequences: the first is intramolecular recombination, the second is the presence of multiple repeat sequences, and the third is the indels, which caused a mismatch that resulted in the upstream sequence becoming a single copy [52].
Pairwise alignment of the P. granatum cp genome with the other Lythraceae species revealed a high degree of synteny and gene order conservation (Figure 5), suggesting an evolutionary conservation of the Lythraceae cp genomes at the genome-scale level.

2.6. Positive Selection Analysis

The ratios of non-synonymous (dN) and synonymous (dS) substitutions for 75 protein-coding genes among five Lythraceae were calculated based on the site-specific model. Eleven genes with positively selected sites within the Lythraceae family were identified (Table 5). Those genes contained one subunit of acetyl-CoA carboxylase (accD), one photosystem I subunit gene (psaI), two NADH-dehydrogenase subunit genes (ndhF, ndhJ), one ribosome large subunit gene (rpl22), five ribosome small subunit genes (rps2, rps4, rps7, rps8, rps12), and the ycf1 gene. According to the M8 model, the ycf1 gene possessed 10 positive sites, followed by ndhF (7) and rpl22 (5). The other eight genes each had only one positive site. The Photo-genes included four genes (accD, psaI, ndhF, ndhJ). The Genet-genes included six genes (rpl22, rps2, rps4, rps7, rps8, rps12). The ycf1 gene was considered as the other gene. Most positively selected genes were genetic system or photosynthesis related genes, which indicated that the chloroplast functional genes played vital roles during the plant evolution [53,54].

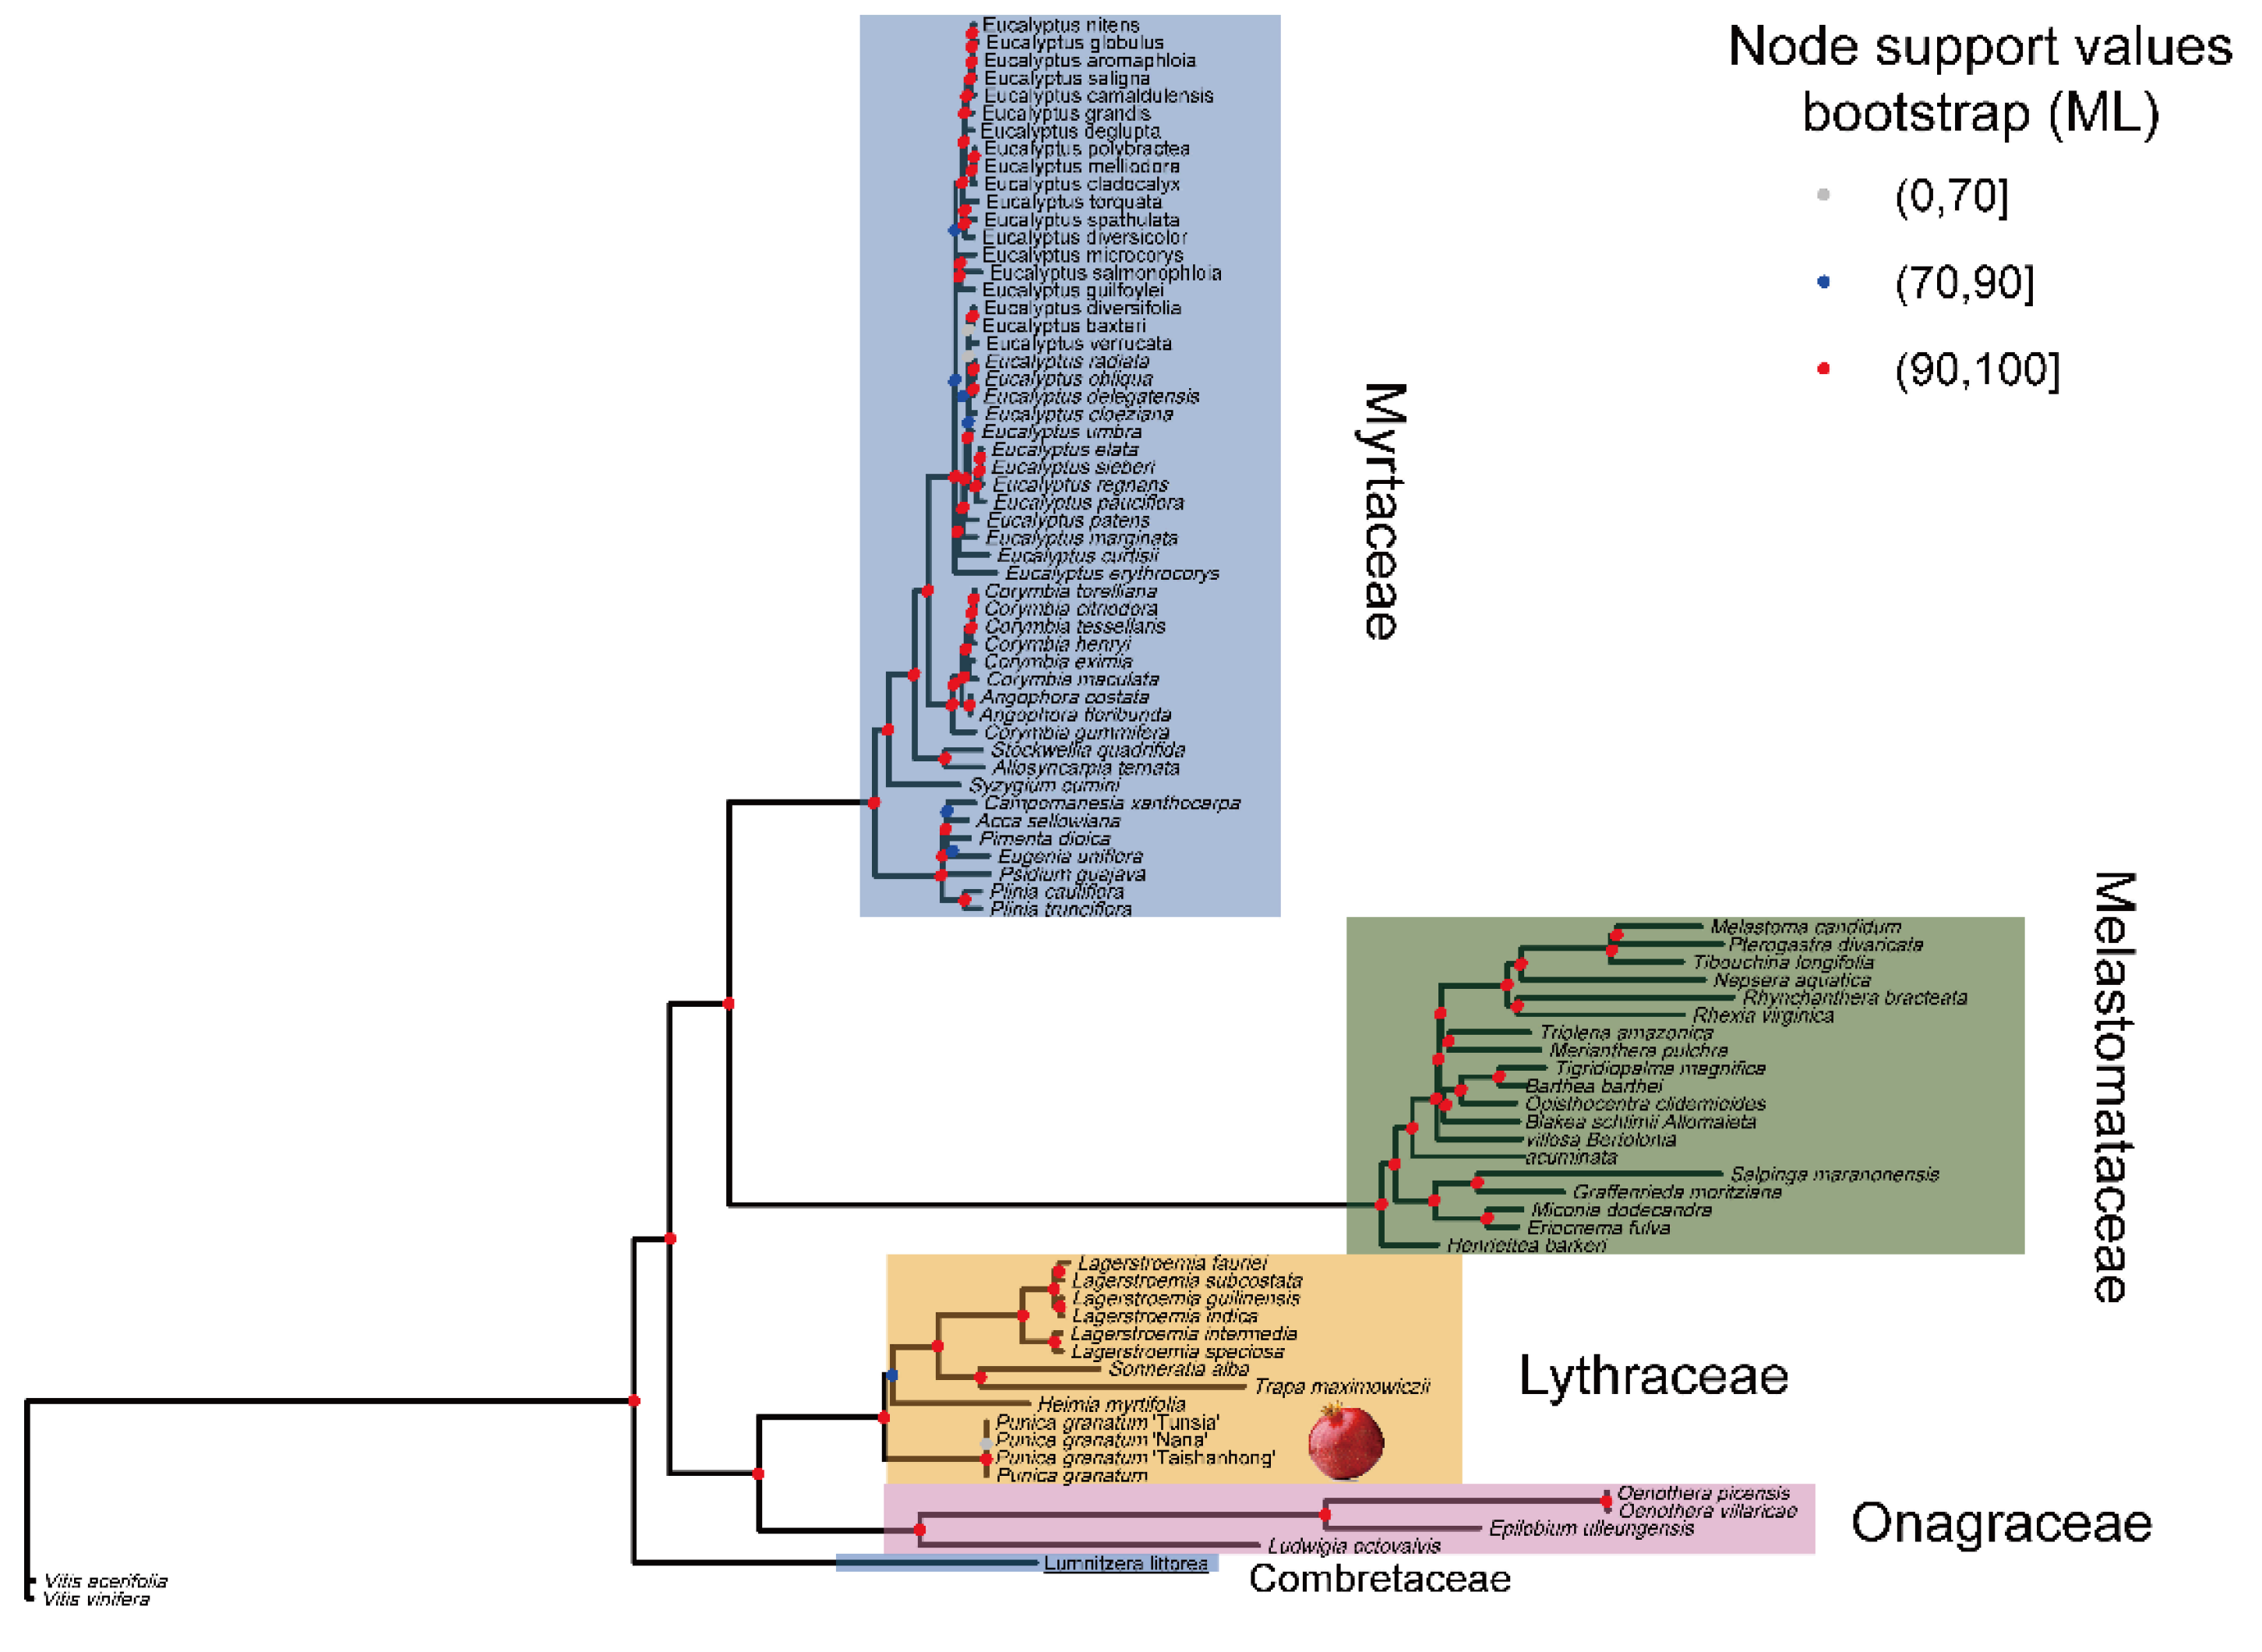
2.7. The Phylogenetic Position of P. granatum

Complete cp genomes are important as they can provide information for understanding the phylogenetic relationships at multiple taxonomic levels. For example, recent phylogenetic analyses based on protein-coding genes of the cp genome provided the broad phylogenetic framework for Viridiplantae, which has significant value both to evolutionary biologists and ecologists [55]. The genus Punica belongs to the order Myrtales and most likely originated from Saxifragales. However, the placement of genus Punica under different families such as Punicaceae, Lythraceae, and Myrtaceae has remained debatable [6]. Recent phylogenomic analysis based on 106 single-copy nuclear genes was performed and supported that P. granatum belongs to the Lythraceae family rather than the monogeneric Punicaeceae family [7].
To determine the position of P. granatum and to further analyze the relationships within Myrtales, we used the complete cp genome sequences to perform the phylogenetic analysis. Eighty-five species representing five families from the order Myrtales were selected. Two species from the order Vitales (Vitis acerifolia, Vitis vinifera) were selected as outgroups. To avoid systematic errors produced by poor alignment, we removed poorly aligned sites using Gblocks. After the removal of the ambiguously aligned regions, the alignment contained 106,571 sites in total, including 20,088 parsimony-informative sites, 9178 singleton sites, and 77,305 constant sites. The method of data analysis (ML and BI) did not affect the results, and the treetopologies of ML and BI were found to be the same. The phylogenetic relationships among five families were fully resolved, and node support values for the ML type were higher than 90.
The tree showed (Figure 6) that all the accessions of the pomegranate were grouped into a single clade with other closely related species of the Lythraceae family. The monophyly of the family Lythraceae and the sister relation with family Onagraceae is highly supported (>90). Myrtaceae were strongly supported as monophyletic and formed a sister relationship with Melastomataceae. Five pomegranate accessions formed a clade with zero or nearly zero branches length, which suggests that the cp genome might be of limited use for cultivar identification and population genetic studies of P. granatum. Our full genomic data set resolved the phylogenomic placement of Punica and provided strong support for most relationships of Myrtales.

3. Materials and Methods

3.1. Plant Material

Three P. granatum cultivars with distinct phenotypes were chosen to reconstruct the complete cp genome: ‘Nana’ is a dwarf pomegranate, which has a small and sour fruit with hard seeds. ‘Tunisia’ is a domesticated cultivar characterized as a normal-sized tree with sweet taste and soft seeds. ‘Taishanhong’ is a widely grown landrace in China, characterized as having a bright red peel with delicious taste and hard seeds. The materials used in this study were collected from the experimental orchard at Nanjing Forestry University. The voucher specimen was deposited in Nanjing Forestry University.

3.2. DNA Sequencing, Genome Assembly, and Annotation

Total genomic DNA was extracted from mature leaves using a modified CTAB protocol. Firstly, 1.0 μg Genomic DNA was sheared into an average fragment size of 350 bp by a Covaris S220 sonicator (Woburn, Massachusetts, MA, USA). Then, the size distribution and concentration of the libraries were determined using an Agilent 2100 Bioanalyzer and qualified by real-time PCR (2 nM), respectively. DNA libraries were sequenced on Illumina Hiseq X Ten (Nanjing, China) for at least 150 bp reads. The raw sequence data reported in this paper were deposited in the Genome Sequence Archive in Big Data Center [56], Beijing Institute of Genomics (BIG) [57], Chinese Academy of Sciences, under the BioProject with the accession number PRJCA001313. After the fragments were filtered and trimmed by the fastp program [58], clean reads were obtained. Subsequently, the high-quality paired-end reads were used to de novo assemble the complete cp genomes using the GetOrganelle program [27] with a combined k-mer of 95,105,125. Genome annotation was performed using the online program GeSeq [59] for the pomegranate cp genomes previously reported. The annotation results were inspected using Geneious [60] and adjusted manually as needed. The cp genome map was drawn using the online tool OGDRAW [61]. The complete cp genomes have been submitted to Genbank with accession number MK603511-MK603513.

3.3. Codon Usage

The complete cp genome of the pomegranate cultivar ‘Taishanhong’ was selected to analyze the codon usage pattern. The protein-coding genes with more than 300 nucleotides were extracted according to the annotation file. The GC content of GC1, GC2, and GC3 was calculated using an in-house python script. The codon usage indices were calculated by CodonW v1.4.4, including the relative synonymous codon usage (RSCU), codon adaptation index (CAI), and the effective number of codons (ENC). RSCU values were close to 1 indicating that all synonymous codons encoding the same amino acid were used equally. CAI is used to measure the extent of bias towards preferred codons in a gene. A higher CAI value means a stronger codon usage bias and a higher expression level. ENC is used to measure codon usage evenness. Its value ranges from 20 (extremely biased) to 61 (totally unbiased) [62].

3.4. RNA Editing Sites

Prediction of the possible RNA editing sites in P. granatum protein-coding genes were performed using the online program predictive RNA editor for plants (PREP) suite [63] with 35 genes as reference. Only those sites which had a cutoff value of 0.8 were kept.

3.5. Sequence Diversity

Four cp genomes from Lythraceae were downloaded from GenBank, including Lagerstroemia indica (NC_030484), Heimia myrtifolia (MG921615), Sonneratia alba (NC_039975), and Trapa maximowiczii (NC_037023). These four cp genomes together with that of our newly assembled ‘Taishanhong’ genome were used to detect the divergent hot spot. Intergenic and protein-coding regions from five Lythraceae cp genomes were extracted using an in-house python script. Multiple sequence alignment was performed using MAFFT [64] and the mean P-distances were calculated using R package ‘ape’ [65] with Kimura’s two-parameter model.

3.6. Structure Comparison

IR expansion and contraction of cp genomes among the five Lythraceae species mentioned above were analyzed using IRscope (Helsinki, Finland) [66]. We also conducted a co-linear analysis. A pairwise alignment was achieved by the lastz program. The results were visualized using AliTV (Wurzburg, Germany) [67].

3.7. Positive Selection Analysis

In order to detect the protein-coding genes under selection in Lythraceae, the sequences for each gene were aligned separately using the Muscle (codon) implemented in MEGA [68], and the Maximum likelihood phylogenetic tree based on complete cp genome sequences was constructed using IQ-tree [69]. The site-specific model was performed to test for natural selection using the CODEML algorithm [70] implemented in EasyCodeML [71]. Six codon substitution models described as M0, M1a, M2a, M3, M7, and M8 were investigated. This model allowed the ω ratio to vary among sites with a fixed ω ratio in all branches in order to test for site-specific evolution in the gene phylogeny. Two likelihood ratio tests were performed to detect positively selected sites: M1a (neutral) vs. M2a (positive selection), M7 (β) vs. M8 (β and ω), and M0 (one-ratio) vs. M3 (discrete), which were compared using a site-specific model [72].

3.8. Phylogenetic Analysis

To determine the phylogenetic position of P. granatum, phylogenetic analysis was performed using the complete cp genomes in the Myrtales. The cp genomes previously published in the Myrtales and two species from Vitales were downloaded from NCBI using an in-house python script. Multiple sequences alignment was achieved by HomBlocks pipelines [73]. Some poorly aligned regions were removed with Gblocks [74]. Two methods were employed to construct a phylogenetic tree, including Maximum likelihood (ML), and Bayes inference (BI). The dataset was unpartitioned. ML was implemented in IQ-tree [69] under the best-fit model selected by using ModelFinder [75] according to Akaike information criterion (AIC). The ML tree was inferred with 1000 bootstrap replicates (the ‘-bb’ options). BI was performed with MrBayes [76] under the best-fit model determined by Modeltest with the AIC. The Marjkov chain Monte Carlo (MCMC) analysis was run for 2 × 200,000 generations. Trees were sampled at every 1,000 generations with the first 25% discarded as burn-in. The stationarity was considered to be reached when the average standard deviation of split frequencies remained below 0.001. Phylogenetic trees with bootstrap values (BS) and posterior probabilities (PP) were visualized using R package ‘ggtree’ [77].

4. Conclusions

Next generation whole genome shotgun sequences of plant species often contain numerous reads that are derived from the cp genomes, which provides a unique opportunity to assemble complete cp genomes. This method of using low coverage of the whole genome sequencing data to recover highly repetitive genome regions such as organelle genomes is called the “whole genome skimming approach”. In the present study, we determined and characterized the complete cp genomes of three P. granatum cultivars using the whole genome sequencing data. Sequence diversity analysis revealed that cp genome sequences may not be suitable for investigating the genetic diversity of pomegranate genotypes. The genome sequencing data of three different cultivars are valuable resources for pomegranate breeding programs. The complete cp genome sequences that were newly assembled in our study could provide valuable information for understanding the evolutionary relationships among the Myrtales.

Author Contributions

Data curation, M.Y., J.Z., and Y.D.; Formal analysis, M.Y., J.Z., and Y.H.; Funding acquisition, Z.Y.; Methodology, Z.Y.; Visualization, M.Y.; Writing—original draft, M.Y. and X.Z.; Writing—review and editing, X.Z., J.Z., and Z.Y.

Funding

This work was supported by the Initiative Project for Talents of Nanjing Forestry University (GXL2014070, GXL2018032), the Priority Academic Program Development of Jiangsu High Education Institutions (PAPD), and the Natural Science Foundation of Jiangsu Province (BK20180768).

Conflicts of Interest

The authors declare no conflict of interest.

References

  1. Al-Khayri, J.M.; Jain, S.M.; Johnson, D.V. Advances in Plant Breeding Strategies: Fruits; Springer: Berlin/Heidelberg, Germany, 2019; Volume 3. [Google Scholar]
  2. Shahindokht, B.J. Punica granatum (Pomegranate) activity in health promotion and cancer prevention. Oncol. Rev. 2018, 12, 345. [Google Scholar]
  3. Sreekumar, S.; Sithul, H.; Muraleedharan, P.; Azeez, J.-M.; Sreeharshan, S. Pomegranate Fruit as a Rich Source of Biologically Active Compounds. BioMed Res. Int. 2014, 2014, 686921. [Google Scholar] [CrossRef]
  4. Malviya, S.; Arvind; Jha, A.; Hettiarachchy, N. Antioxidant and antibacterial potential of pomegranate peel extracts. J. Food Sci. Technol. 2014, 51, 4132–4137. [Google Scholar] [CrossRef] [PubMed]
  5. Wang, J.-Y.; Zhu, C.; Qian, T.-W.; Guo, H.; Wang, D.-D.; Zhang, F.; Yin, X.-X. Extracts of black bean peel and pomegranate peel ameliorate oxidative stress‑induced hyperglycemia in mice. Exp. Ther. Med. 2015, 9, 43–48. [Google Scholar] [CrossRef] [PubMed]
  6. Silva, J.A.T.D.; Rana, T.S.; Narzary, D.; Verma, N.; Meshram, D.T.; Ranade, S.A. Pomegranate biology and biotechnology: A review. Sci. Hortic. 2013, 160, 85–107. [Google Scholar] [CrossRef]
  7. Yuan, Z.-H.; Fang, Y.-M.; Zhang, T.-K.; Fei, Z.-J.; Han, F.-M.; Liu, C.-Y.; Liu, M.; Xiao, W.; Zhang, W.-J.; Wu, S. The pomegranate (Punica granatum L.) genome provides insights into fruit quality and ovule developmental biology. Plant Biotechnol. J. 2018, 16, 1363–1374. [Google Scholar] [CrossRef] [PubMed]
  8. Sancho, R.; Cantalapiedra, C.-P.; Lopezalvarez, D.; Gordon, S.P.; Vogel, J.P.; Catalan, P.; Contrerasmoreira, B. Comparative plastome genomics and phylogenomics of Brachypodium: Flowering time signatures, introgression and recombination in recently diverged ecotypes. New Phytol. 2018, 218, 1631–1644. [Google Scholar] [CrossRef] [PubMed]
  9. Ruhfel, B.R.; Gitzendanner, M.A.; Soltis, P.S.; Soltis, D.E.; Burleigh, J.G. From algae to angiosperms–inferring the phylogeny of green plants (Viridiplantae) from 360 plastid genomes. BMC Evolut. Biol. 2014, 14, 23. [Google Scholar] [CrossRef]
  10. Yang, J.-B.; Tang, M.; Li, H.-T.; Zhang, Z.-R.; Li, D.-Z. Complete chloroplast genome of the genus Cymbidium: Lights into the species identification, phylogenetic implications and population genetic analyses. BMC Evolut. Biol. 2013, 13, 84. [Google Scholar] [CrossRef]
  11. Chen, N.; Sha, L.-N.; Dong, Z.-Z.; Tang, C.; Wang, Y.; Kang, H.-Y.; Zhang, H.-Q.; Yan, X.-B.; Zhou, Y.-H.; Fan, X. Complete structure and variation of the chloroplast genome of Agropyron cristatum (L.) Gaertn. Gene 2018, 640, 86–96. [Google Scholar] [CrossRef]
  12. Mcfadden, G.I.; Van Dooren, G.G. Evolution: Red algal genome affirms a common origin of all plastids. Curr. Biol. 2004, 14, R514–R516. [Google Scholar] [CrossRef] [PubMed]
  13. Daniell, H.; Lin, C.; Yu, M.; Chang, W.-J. Chloroplast genomes: Diversity, evolution, and applications in genetic engineering. Genomo. Biol. 2016, 17, 134. [Google Scholar] [CrossRef] [PubMed]
  14. Petrillo, E.; Herz, M.A.G.; Fuchs, A.; Reifer, D.; Fuller, J.L.; Yanovsky, M.J.; Simpson, C.G.; Brown, J.W.S.; Barta, A.; Kalyna, M. A chloroplast retrograde signal regulates nuclear alternative splicing. Science 2014, 344, 427–430. [Google Scholar] [CrossRef]
  15. Godoy Herz, M.A.; Kubaczka, M.G.; Brzyzek, G.; Servi, L.; Krzyszton, M.; Simpson, C.; Brown, J.; Swiezewski, S.; Petrillo, E.; Kornblihtt, A.R. Light Regulates Plant Alternative Splicing through the Control of Transcriptional Elongation. Mol. Cell 2019, 73, 1066–1074. [Google Scholar] [CrossRef] [PubMed]
  16. Alexia, T.; Cian, D.; Pooja, P.; Zachary, S.; María, E.S.; Lok, H.Y.; David, C.A.G.; Alexandre, Y.L.; Virendrasinh, K.; Andrew, D.W.; et al. Chloroplasts navigate towards the pathogen interface to counteract infection by the Irish potato famine pathogen. bioRxiv 2019, 516443. [Google Scholar] [CrossRef]
  17. Yang, J.; Feng, L.; Yue, M.; He, Y.L.; Zhao, G.F.; Li, Z.H. Species delimitation and interspecific relationships of the endangered herb genus Notopterygium inferred from multilocus variations. Mol. Phylogenet. Evolut. 2019, 133, 142–151. [Google Scholar] [CrossRef] [PubMed]
  18. Chen, X.-L.; Zhou, J.-G.; Cui, Y.-X.; Wang, Y.; Duan, B.-Z.; Yao, H. Identification of Ligularia Herbs Using the Complete Chloroplast Genome as a Super-Barcode. Front. Pharmacol. 2018, 9, 695. [Google Scholar] [CrossRef] [PubMed]
  19. Cheng, H.; Li, J.-F.; Zhang, H.; Cai, B.-H.; Gao, Z.-H.; Qiao, Y.-S.; Mi, L. The complete chloroplast genome sequence of strawberry (Fragaria × ananassa Duch.) and comparison with related species of Rosaceae. PeerJ 2017, 5, e3919. [Google Scholar] [CrossRef] [PubMed]
  20. Redwan, R.-M.; Saidin, A.; Kumar, S.-V. Complete chloroplast genome sequence of MD-2 pineapple and its comparative analysis among nine other plants from the subclass Commelinidae. BMC Plant Biol 2015, 15, 196. [Google Scholar] [CrossRef] [PubMed]
  21. Yao, X.-H.; Tang, P.; Li, Z.-Z.; Li, D.-W.; Liu, Y.-F.; Huang, H.-W. The First Complete Chloroplast Genome Sequences in Actinidiaceae: Genome Structure and Comparative Analysis. PLoS ONE 2015, 10, e2109347. [Google Scholar] [CrossRef]
  22. Jansen, R.K.; Raubeson, L.A.; Boore, J.L.; Depamphilis, C.W.; Chumley, T.W.; Haberle, R.C.; Wyman, S.K.; Alverson, A.J.; Peery, R.; Herman, S.J. Methods for Obtaining and Analyzing Whole Chloroplast Genome Sequences. Methods Enzymol. 2005, 395, 348–384. [Google Scholar] [PubMed]
  23. Khan, A.; Khan, I.-A.; Asif, H.M.; Azim, M. Current trends in chloroplast genome research. Afr. J. Biotechnol. 2010, 9, 3494–3500. [Google Scholar]
  24. Twyford, A.D.; Ness, R.W. Strategies for complete plastid genome sequencing. Mol. Ecol. Resour. 2017, 17, 858–868. [Google Scholar] [CrossRef] [PubMed]
  25. Dierckxsens, N.; Mardulyn, P.; Smits, G. NOVOPlasty: De novo assembly of organelle genomes from whole genome data. Nucleic Acids Res. 2016, 45, e18. [Google Scholar] [CrossRef]
  26. Ankenbrand, M.J.; Pfaff, S.; Terhoeven, N.; Qureischi, M.; Gundel, M.; Weis, C.L.; Hackl, T.; Forster, F. chloroExtractor: Extraction and assembly of the chloroplast genome from whole genome shotgun data. J. Open Sour. Softw. 2018, 3, 464. [Google Scholar] [CrossRef]
  27. Jin, J.; Yu, W.; Yang, J.; Song, Y.; Yi, T.; Li, D. GetOrganelle: A simple and fast pipeline for de novo assembly of a complete circular chloroplast genome using genome skimming data. bioRxiv 2018, 256479. [Google Scholar] [CrossRef]
  28. Ivanova, Z.; Sablok, G.; Daskalova, E.; Zahmanova, G.; Apostolova, E.; Yahubyan, G.; Baev, V. Chloroplast Genome Analysis of Resurrection Tertiary Relict Haberlea rhodopensis Highlights Genes Important for Desiccation Stress Response. Front. Plant Sci. 2017, 8, 204. [Google Scholar] [CrossRef] [PubMed]
  29. Song, Y.; Yao, X.; Tan, Y.-H.; Gan, Y.; Corlett, R.T. Complete chloroplast genome sequence of the avocado: Gene organization, comparative analysis, and phylogenetic relationships with other Lauraceae. Can. J. For. Res. 2016, 46, 1293–1301. [Google Scholar] [CrossRef]
  30. Yang, J.-B.; Yang, S.-X.; Li, H.-T.; Yang, J.; Li, D.-Z. Comparative Chloroplast Genomes of Camellia Species. PLoS ONE 2013, 8, e73053. [Google Scholar] [CrossRef]
  31. Wang, S.; Yang, C.; Zhao, X.; Chen, S.; Qu, G. Complete chloroplast genome sequence of Betula platyphylla: Gene organization, RNA editing, and comparative and phylogenetic analyses. BMC Genom. 2018, 19, 950. [Google Scholar] [CrossRef]
  32. Wickens, M.; Cox, M.M. Critical reviews in biochemistry and molecular biology. Introduction. Crit. Rev. Biochem. Mol. Biol. 2009, 44, 2. [Google Scholar] [CrossRef] [PubMed]
  33. Li, X.; Li, Y.-F.; Zang, M.-Y.; Li, M.-Z.; Fang, Y.-M. Complete Chloroplast Genome Sequence and Phylogenetic Analysis of Quercus acutissima. Int. J. Mol. Sci. 2018, 19, 2443. [Google Scholar] [CrossRef] [PubMed]
  34. Asaf, S.; Khan, A.L.; Khan, A.R.; Waqas, M.; Kang, S.; Khan, M.A.; Lee, S.; Lee, I. Complete Chloroplast Genome of Nicotiana otophora and its Comparison with Related Species. Front. Plant Sci. 2016, 7, 843. [Google Scholar] [CrossRef] [PubMed]
  35. Batnini, M.A.; Bourguiba, H.; Trififarah, N.; Krichen, L. Molecular diversity and phylogeny of Tunisian Prunus armeniaca L. by evaluating three candidate barcodes of the chloroplast genome. Sci. Hortic. 2019, 245, 99–106. [Google Scholar] [CrossRef]
  36. Norouzi, M.; Talebi, M.; Sayedtabatabaei, B. Chloroplast microsatellite diversity and population genetic structure of Iranian pomegranate (Punica granatum L.) genotypes. Sci. Hortic. 2012, 137, 114–120. [Google Scholar] [CrossRef]
  37. Feng, C.; Xu, C.-J.; Wang, Y.; Liu, W.-L.; Yin, X.-R.; Li, X.; Chen, M.; Chen, K.-S. Codon usage patterns in Chinese bayberry (Myrica rubra) based on RNA-Seq data. BMC Genom. 2013, 14, 732. [Google Scholar] [CrossRef] [PubMed]
  38. Qin, Z.; Cai, Z.-Q.; Xia, G.-M.; Wang, M.-C. Synonymous codon usage bias is correlative to intron number and shows disequilibrium among exons in plants. BMC Genom. 2013, 14, 56. [Google Scholar] [CrossRef] [PubMed]
  39. Wang, L.-Y.; Xing, H.-X.; Yuan, Y.-C.; Wang, X.-L.; Saeed, M.; Tao, J.-C.; Feng, W.; Zhang, G.-H.; Song, X.-L.; Sun, X.-Z. Genome-wide analysis of codon usage bias in four sequenced cotton species. PLoS ONE 2018, 13, e0194372. [Google Scholar] [CrossRef]
  40. Ning, L.I.; Sun, M.-H.; Jiang, Z.-S.; Shu, H.-R.; Zhang, S.-Z. Genome-wide analysis of the synonymous codon usage patterns in apple. J. Integr. Agric. 2016, 15, 983–991. [Google Scholar]
  41. Suzuki, H.; Morton, B.R. Codon Adaptation of Plastid Genes. PLoS ONE 2016, 11, e0154306. [Google Scholar] [CrossRef]
  42. Zhang, R.-Z.; Zhang, L.; Wang, W.; Zhang, Z.; Du, H.-H.; Qu, Z.; Li, X.-Q.; Xiang, H. Differences in Codon Usage Bias between Photosynthesis-Related Genes and Genetic System-Related Genes of Chloroplast Genomes in Cultivated and Wild Solanum Species. Int. J. Mol. Sci. 2018, 19, 3142. [Google Scholar] [CrossRef] [PubMed]
  43. Nie, X.-J.; Deng, P.-C.; Feng, K.-W.; Liu, P.-X.; Du, X.-H.; You, F.M.; Song, W.-N. Comparative analysis of codon usage patterns in chloroplast genomes of the Asteraceae family. Plant Mol. Biol. Rep. 2014, 32, 828–840. [Google Scholar] [CrossRef]
  44. Wright, F. The effective number of codons used in a gene. Gene 1990, 87, 23–29. [Google Scholar] [CrossRef]
  45. Das, S.; Paul, S.; Dutta, C. Synonymous codon usage in adenoviruses: Influence of mutation, selection and protein hydropathy. Virus Res. 2006, 117, 227–236. [Google Scholar] [CrossRef]
  46. Harris, R.S.; Petersenmahrt, S.K.; Neuberger, M.S. RNA editing enzyme APOBEC1 and some of its homologs can act as DNA mutators. Mol. Cell 2002, 10, 1247–1253. [Google Scholar] [CrossRef]
  47. Bentolila, S.; Oh, J.; Hanson, M.R.; Bukowski, R. Comprehensive High-Resolution Analysis of the Role of an Arabidopsis Gene Family in RNA Editing. PLoS Genet. 2013, 9. [Google Scholar] [CrossRef] [PubMed]
  48. Saina, J.K.; Li, Z.; Gichira, A.W.; Liao, Y. The Complete Chloroplast Genome Sequence of Tree of Heaven (Ailanthus altissima (Mill.) (Sapindales: Simaroubaceae), an Important Pantropical Tree. Int. J. Mol. Sci. 2018, 19, 929. [Google Scholar] [CrossRef]
  49. Pinard, D.; Myburg, A.A.; Mizrachi, E. The plastid and mitochondrial genomes of Eucalyptus grandis. BMC Genom. 2019, 20, 132. [Google Scholar] [CrossRef]
  50. Rabah, S.O.; Lee, C.; Hajrah, N.H.; Makki, R.M.; Alharby, H.F.; Alhebshi, A.M.; Sabir, J.; Jansen, R.K.; Ruhlman, T.A. Plastome Sequencing of Ten Nonmodel Crop Species Uncovers a Large Insertion of Mitochondrial DNA in Cashew. Plant Genome 2017, 10. [Google Scholar] [CrossRef] [Green Version]
  51. Li, Y.; Zhang, J.; Li, L.; Gao, L.; Xu, J.; Yang, M. Structural and Comparative Analysis of the Complete Chloroplast Genome of Pyrus hopeiensis—“Wild Plants with a Tiny Population”—and Three Other Pyrus Species. Int. J. Mol. Sci. 2018, 19, 3262. [Google Scholar] [CrossRef]
  52. Li, B.; Zheng, Y. Dynamic evolution and phylogenomic analysis of the chloroplast genome in Schisandraceae. Sci. Rep. 2018, 8, 9285. [Google Scholar] [CrossRef] [PubMed]
  53. Dong, W.; Wang, R.; Zhang, N.; Fan, W.; Fang, M.; Li, Z. Molecular Evolution of Chloroplast Genomes of Orchid Species: Insights into Phylogenetic Relationship and Adaptive Evolution. Int. J. Mol. Sci. 2018, 19, 716. [Google Scholar] [CrossRef] [PubMed]
  54. Hao, D.C.; Chen, S.L.; Xiao, P.G. Molecular evolution and positive Darwinian selection of the chloroplast maturase matK. J. Plant Res. 2010, 123, 241–247. [Google Scholar] [CrossRef] [PubMed]
  55. Gitzendanner, M.; Soltis, P.; Wong, G.; Ruhfel, B.; Soltis, D. Plastid phylogenomic analysis of green plants: A billion years of evolutionary history. Am. J. Bot. 2018, 105, 291–301. [Google Scholar] [CrossRef] [PubMed]
  56. Wang, Y.-Q.; Song, F.-H.; Zhu, J.-W.; Zhang, S.-S.; Yang, Y.-D.; Chen, T.-T.; Tang, B.; Dong, L.-L.; Ding, N.; Zhang, Q. GSA: Genome Sequence Archive. Genom. Proteom. Bioinform. 2017, 15, 14–18. [Google Scholar] [CrossRef] [PubMed]
  57. Zhang, Z.; Zhao, W.-M.; Xiao, J.-F.; Bao, Y.-M.; Wang, F.; Hao, L.-L.; Zhu, J.-W.; Chen, T.-T.; Zhang, S.-S.; Chen, X. Database Resources of the BIG Data Center in 2018. Nucleic Acids Res. 2018, 46, D14–D20. [Google Scholar]
  58. Chen, S.; Zhou, Y.; Chen, Y.; Gu, J. fastp: An ultra-fast all-in-one FASTQ preprocessor. Bioinformatics 2018, 34, i884–i890. [Google Scholar] [CrossRef]
  59. Tillich, M.; Lehwark, P.; Pellizzer, T.; Ulbrichtjones, E.S.; Fischer, A.; Bock, R.; Greiner, S. GeSeq—Versatile and accurate annotation of organelle genomes. Nucleic Acids Res. 2017, 45, W6–W11. [Google Scholar] [CrossRef]
  60. Kearse, M.; Moir, R.; Wilson, A.; Stoneshavas, S.; Cheung, M.; Sturrock, S.; Buxton, S.; Cooper, A.; Markowitz, S.; Duran, C. Geneious Basic: An integrated and extendable desktop software platform for the organization and analysis of sequence data. Bioinformatics 2012, 28, 1647–1649. [Google Scholar] [CrossRef]
  61. Lohse, M.; Drechsel, O.; Bock, R. OrganellarGenomeDRAW (OGDRAW): A tool for the easy generation of high-quality custom graphical maps of plastid and mitochondrial genomes. Curr. Genet. 2007, 52, 267–274. [Google Scholar] [CrossRef]
  62. Chen, X.; Jing, D.; Tong, C.-F.; Gong, X.-D.; Qiang, W.; Qiang, Z.-G. Analysis of Synonymous Codon Usage Patterns in Seven Different Citrus Species. Evol. Bioinform. Online 2013, 9, 215–228. [Google Scholar]
  63. Mower, J.P. The PREP suite: Predictive RNA editors for plant mitochondrial genes, chloroplast genes and user-defined alignments. Nucleic Acids Res. 2009, 37, 253–259. [Google Scholar] [CrossRef] [PubMed]
  64. Katoh, K.; Standley, D.M. MAFFT Multiple Sequence Alignment Software Version 7: Improvements in Performance and Usability. Mol. Biol. Evol. 2013, 30, 772–780. [Google Scholar] [CrossRef] [PubMed] [Green Version]
  65. Paradis, E.; Claude, J.; Strimmer, K. APE: Analyses of Phylogenetics and Evolution in R language. Bioinformatics 2004, 20, 289–290. [Google Scholar] [CrossRef] [PubMed] [Green Version]
  66. Amiryousefi, A.; Hyvonen, J.; Poczai, P. IRscope: An online program to visualize the junction sites of chloroplast genomes. Bioinformatics 2018, 34, 3030–3031. [Google Scholar] [CrossRef] [PubMed]
  67. Ankenbrand, M.J.; Hohlfeld, S.; Hackl, T.; Forster, F. AliTV—Interactive visualization of whole genome comparisons. PeerJ 2017, 3. [Google Scholar] [CrossRef]
  68. Kumar, S.; Stecher, G.; Tamura, K. MEGA7: Molecular Evolutionary Genetics Analysis version 7.0 for bigger datasets. Mol. Biol. Evolut. 2016, 33, 1870–1874. [Google Scholar] [CrossRef] [PubMed]
  69. Nguyen, L.; Schmidt, H.A.; Von Haeseler, A.; Minh, B.Q. IQ-TREE: A fast and effective stochastic algorithm for estimating maximum likelihood phylogenies. Mol. Biol. Evol. 2015, 32, 268–274. [Google Scholar] [CrossRef]
  70. Yang, Z. PAML: A program package for phylogenetic analysis by maximum likelihood. Bioinformatics 1997, 13, 555–556. [Google Scholar] [CrossRef]
  71. Gao, F.; Chen, C.; Arab, D.A.; Du, Z.; He, Y.; Ho, S.Y.W. EasyCodeML: A visual tool for analysis of selection using CodeML. Ecol. Evolut. 2019, 9, 3891–3898. [Google Scholar] [CrossRef] [Green Version]
  72. Gao, F.; Du, Z.; Shen, J.; Yang, H.; Liao, F. Genetic diversity and molecular evolution of Ornithogalum mosaic virus based on the coat protein gene sequence. PeerJ 2018, 6. [Google Scholar] [CrossRef]
  73. Bi, G.; Mao, Y.; Xing, Q.; Cao, M. HomBlocks: A multiple-alignment construction pipeline for organelle phylogenomics based on locally collinear block searching. Genomics 2017, 110, 18–22. [Google Scholar] [CrossRef]
  74. Castresana, J. Selection of Conserved Blocks from Multiple Alignments for Their Use in Phylogenetic Analysis. Mol. Biol. Evolut. 2000, 17, 540–552. [Google Scholar] [CrossRef] [Green Version]
  75. Kalyaanamoorthy, S.; Minh, B.; Wong, T.K.F.; Von Haeseler, A.; Jermiin, L.S. ModelFinder: Fast model selection for accurate phylogenetic estimates. Nat. Methods 2017, 14, 587–589. [Google Scholar] [CrossRef]
  76. Huelsenbeck, J.P.; Ronquist, F. MRBAYES: Bayesian inference of phylogenetic trees. Bioinformatics 2001, 17, 754–755. [Google Scholar] [CrossRef] [Green Version]
  77. Yu, G.; Smith, D.K.; Zhu, H.; Guan, Y.; Lam, T.T. ggtree: An R package for visualization and annotation of phylogenetic trees with their covariates and other associated data. Methods Ecol. Evolut. 2017, 8, 28–36. [Google Scholar] [CrossRef]
Figure 1. Chloroplast genome maps of P. granatum. Genes drawn outside the outer circle are transcribed clockwise, and those inside are transcribed counter-clockwise. Genes belonging to different functional groups are color-coded.
Ijms 20 02886 g001
Figure 2. The codon usage pattern of the pomegranate chloroplast (cp) genome. (A) GC content on three different positions. (B) Neutrality plot (GC12 against GC3). (C) The codon adaptation index (CAI) value of gene sets with different functions. (D) Relationship between GC3 and effective number of codons (ENC) (ENC-plot). The expected ENC from GC3 is shown as a solid.
Ijms 20 02886 g002
Figure 3. The genetic distance based on Kimura’s two-parameter model. (A) The P-distance value of protein-coding genes. (B) The P-distance value of intergenic regions. (C) Boxplots of P-distance value difference among LSC, SSC, and IRs. (D) Boxplots of P-distance value differences between protein-coding genes and intergenic regions.
Ijms 20 02886 g003
Figure 4. Comparison of the borders of the LSC, SSC, and IRs regions among five Lythraceae cp genomes.
Ijms 20 02886 g004
Figure 5. Co-linear analysis of five cp genomes within Lythraceae.
Ijms 20 02886 g005
Figure 6. Phylogenetic tree was reconstructed using Maximum likelihood (ML) and Bayes inference (BI) methods based on complete cp genomes of the order Myrtales. Only the tree topology of the ML tree was presented.
Ijms 20 02886 g006
Table 1. The groups of genes within the P. granatum chloroplast genome.
Group of GenesGene Names
Photosystem IpsaA, psaB, psaC, psaI, psaJ
Photosystem IIpsbA, psbB, psbC, psbD, psbE, psbF, psbH, psbI, psbJ, psbK, psbL, psbM, psbN, psbT, psbZ
Cytochrome b/f complexpetA, petBa, petDa, petG, petL, petN
ATP synthaseatpA, atpB, atpE, atpFa, atpH, atpI
NADP dehydrogenasendhAa, ndhB*a, ndhC, ndhD, ndhE, ndhF, ndhG, ndhH, ndhI, ndhJ, ndhK
RubisCO large subunitrbcL
RNA polymeraserpoA, rpoB, rpoC1a, rpoC2
Ribosomal proteins (SSU)rps2, rps3, rps4, rps7*, rps8, rps11, rps12*b, rps14, rps15, rps16a, rps18, rps19
Ribosomal proteins (LSU)rpl2*, rpl14, rpl16a, rpl20, rpl22, rpl23*, rpl32, rpl33, rpl36
Hypothetical chloroplast reading framesycf1, ycf2*, ycf3b, ycf4
Translation initiation factor IF-1infA
Acetyl-CoA carboxylaseaccD
Cytochrome c biogenesis MaturasematK
ATP-dependent proteaseclpPb
Inner membrane proteincemA
Ribosomal RNAsrna4.5S*, rna5S*, rna16S*, rna23S*
Transfer RNAstrnA-UGC*a, trnC-GCA, trnD-GUC, trnE-UUC, trnF-GAA, trnfM-CAU, trnG-GCC, trnG-UCCa, trnH-GUG, trnI-CAU*a, trnI-GAU*, trnK-UUUa, trnL-CAA*, trnL-UAAa, trnL-UAG, trnM-CAU, trnN-GUU*, trnP-UGG, trnQ-UUG, trnR-ACG*, trnR-UCU, trnS-GCU, trnS-GGA, trnS-UGA, trnT-GGU, trnT-UGU, trnV-GAC*, trnV-UACa, trnW-CCA, trnY-GUA
One asterisk indicates that the genes contained two copies. a and b indicate one- and two-intron containing genes, respectively.
Table 2. Putative preferred codons in the P. granatum cp genome. RSCU = relative synonymous codon usage.
Amino AcidCodonCodon FrequencyRSCUAACodonCodon FrequencyRSCU
PheUUU*45511.18SerUCU*24171.46
UUC31430.82 UCC15770.96
LeuUUA*31121.41 UCA*22781.38
UUG*29201.32 UCG12680.77
CUU*25861.17ProCCU*13851.21
CUC13600.62 CCC9290.81
CUA19580.89 CCA*13871.21
CUG12870.58 CCG8760.77
IleAUU*43781.27ThrACU*14781.13
AUC27230.79 ACC10950.84
AUA32460.94 ACA*17591.35
MetAUG27601.00 ACG8860.68
ValGUU*20451.34AlaGCU*13891.45
GUC10330.68 GCC7120.75
GUA*18911.24 GCA11451.20
GUG11230.74 GCG5760.60
TyrUAU*36061.37CysUGU*14101.17
UAC16650.63 UGC9930.83
TERUAA*20291.03TERUGA20031.01
UAG18930.96TrpUGG23921.00
HisCAU*19081.38ArgCGU8880.7
CAC8660.62 CGC4560.36
GlnCAA*28151.35 CGA*14281.13
CAG13420.65 CGG8650.68
AsnAAU*39231.37SerAGU14410.87
AAC18000.63 AGC9230.56
LysAAA*47681.31ArgAGA*25602.02
AAG25380.69 AGG14121.11
AspGAU*28181.49GlyGGU16421.01
GAC9620.51 GGC8860.54
GluGAA*36321.37 GGA*24091.48
GAG16890.63 GGG15690.96
Preferred codons (RSCU value > 1.0) are indicated with (*).
Table 3. Predicted RNA editing sites in the cp genome of P. granatum.
GeneNucleotide PositionAmino Acid PositionCodon ConversionScore
matK644215GCA (A) => GTA (V)1
1177393CGG (R) => TGG (W)1
1187396TCA (S) => TTA (L)0.86
1246416CAC (H) => TAC (Y)1
atpA791264CCC (P) => CTC (L)1
atpF9231CCA (P) => CTA (L)0.86
atpI238ACC (T) => ATC (I)1
rps2422141TCG (S) => TTG (L)1
rpoC230561019GCA (A) => GTA (V)0.86
39981333GCG (A) => GTG (V)0.86
rpoC14114TCA (S) => TTA (L)1
1171391CCA (P) => TCA (S)1
rpoB338113TCT (S) => TTT (F)1
551184TCA (S) => TTA (L)1
566189TCG (S) => TTG (L)1
973325CTC (L) => TTC (F)0.86
rps148027TCA (S) => TTA (L)1
14950TCA (S) => TTA (L)1
atpB1487496TCG (S) => TTG (L)1
accD794265TCG (S) => TTG (L)0.8
1403468CCT (P) => CTT (L)1
psbL21ACG (T) => ATG (M)1
psbF7726TCT (S) => TTT (F)1
clpP559187CAT (H) => TAT (Y)1
ndhB2810CTC (L) => TTC (F)1
14950TCA (S) => TTA (L)1
467156CCA (P) => CTA (L)0.8
586196CAT (H) => TAT (Y)1
611204TCA (S) => TTA (L)1
737246CCA (P) => CTA (L)1
746249TCT (S) => TTT (F)1
830277TCA (S) => TTA (L)1
836279TCA (S) => TTA (L)1
1255419CAT (H) => TAT (Y)1
1481494CCA (P) => CTA (L)1
ndhF16054CTT (L) => TTT (F)1
586196CTT (L) => TTT (F)0.8
ccsA8930TCG (S) => TTG (L)1
ndhD21ACG (T) => ATG (M)1
18562ACC (T) => ATC (I)1
313105CGG (R) => TGG (W)0.8
383128TCA (S) => TTA (L)1
674225TCG (S) => TTG (L)1
845282ACA (T) => ATA (I)0.8
878239TCA (S) => TTA (L)1
887296CCA (P) => CTA (L)1
1405469CTT (L) => TTT (F)0.8
ndhG15552CCA (P) => CTA (L)1
16656CAT (H) => TAT (Y)0.8
314105ACA (T) => ATA (I)0.8
ndhA341114TCA (S) => TTA (L)1
566189TCA (S) => TTA (L)1
1073358TCC (S) => TTC (F)1
Table 4. Summary of the complete chloroplast genome characteristics of five species in Lythraceae.
SpeciesPunica granatumLagerstromeia indicaSonneratia albaTrapa maximowicizzHeimia myrtifolia
Genome size158,638152,025153,061155,577159,219
LSC size89,02184,04687,22688,52888,571
SSC size18,68416,91418,03218,27218,821
IR size25,46725,62323,90224,38925,914
Number of genes113113107110112
Protein-coding genes79 (6)79 (7)79 (6)77 (5)78 (7)
tRNA genes30 (7)30 (7)24 (5)29 (9)30 (6)
rRNA genes4 (4)4 (4)4 (4)4 (4)4 (4)
Number of genes duplicated in IR1718151817
GC content36.9237.5937.2936.436.95
GenBank accessionMK603511NC_030484NC_039975NC_037023MG921615
Table 5. Log-likelihood values of the site-specific models, with detected sites having non-synonymous/synonymous (dN/dS) values > 1.
Gene NameModels (Number of Parameters)lnLLikelihood Ratio Test p-ValuePositively Selected Sites
accDM8 (12)−2534.4008240.0962956125 G 0.955 *
M7 (10)−2536.741156
ndhFM8(12)−4446.8716100.000000002292 N 0.961 *; 486 R 0.999 **; 487 I 0.975 *; 490 K 0.985 *; 518 N 0.969 *; 648 S 0.983 *; 738 F 0.995 **
M7(10)−4466.787914
ndhJM8(12)−806.6443670.003291615121 R 0.970 *
M7(10)−812.360744
psaIM8(12)−139.9858190.03154715126 H 0.959*
M7(10)−143.4420
rpl22M8(12)−942.8335670.0004971604 L 0.972 *; 5 Y 0.961 *; 73 P 0.962 *; 125 A 0.993 **; 126 R 0.994 **
M7(10)−950.440165
rps12M8(12)−529.3175910.002536102117 K 0.974 *
M7(10)−535.294718
rps2M8(12)−1171.7885260.008240568173 E 0.982 *
M7(10)−1176.587212
rps4M8(12)−994.6667490.00708488228 P 0.959 *
M7(10)−999.616541
rps7M8(12)−672.8150640.00000000184 T 1.000 **
M7(10)−693.433775
rps8M8(12)−718.6557990.00184092259 L 0.989 *
M7(10)−724.953288
ycf1M8(12)−11,993.5908170.000001936205 V 0.977 *; 206 F 0.975 *; 341 S 0.974 *; 495 S 0.952 *; 534 A 0.951 *; 1073 A 0.963 *; 1290 R 0.978 *; 1446 E 0.963 *; 1701 K 0.976 *; 1728 T 0.950 *
M7(10)−12,006.745724
* p < 0.05; ** p < 0.01.

