Article

Evaluation of the Genetic Diversity and Differentiation of Black Locust (Robinia pseudoacacia L.) Based on Genomic and Expressed Sequence Tag-Simple Sequence Repeats

1
Beijing Advanced Innovation Center for Tree Breeding by Molecular Design, National Engineering Laboratory for Tree Breeding, Key Laboratory of Genetics and Breeding in Forest Trees and Ornamental Plants, College of Biological Sciences and Technology, Beijing Forestry University, Beijing 100083, China
2
Henan Academy of Forestry, Zhengzhou 450008, China
3
State-Owned Linghai Hongqi Forest, Jinzhou 121228, China
*
Author to whom correspondence should be addressed.
Int. J. Mol. Sci. 2018, 19(9), 2492; https://doi.org/10.3390/ijms19092492
Submission received: 9 July 2018 / Revised: 19 August 2018 / Accepted: 20 August 2018 / Published: 23 August 2018
(This article belongs to the Section Molecular Plant Sciences)

Abstract

:
Understanding the genetic diversity and differentiation of the genetic resources of a species is important for the effective use and protection of forest tree resources. Ex situ development is a common method for the protection of genetic diversity and an essential resource for users who require ready access to a species’ germplasm. In this study, we collected seeds of black locust (Robinia pseudoacacia L.) from 19 provenances, covering most of its natural distribution; we randomly selected 367 tender leaves with well-grown and different maternal strains from this group for further analysis. Forty-eight simple sequence repeat (SSR) primers were successfully selected from 91 pairs of SSR primers using native-deformation polyacrylamide gel electrophoresis. In addition, we identified identical genotypes among all individuals and evaluated the quality of the markers. From this, 35 loci were confirmed for analyses of genetic diversity and differentiation of the black locust provenances, which contained 28 expressed sequence tag-derived simple sequence repeats (EST-SSRs) and 7 genomic DNA-derived simple sequence repeats (G-SSRs). We observed high genetic diversity among the native black locust provenances, from which Wright’s fixation index and molecular variance suggested that a majority of the genetic differentiation variation could be attributed to within-provenance differences. The genetic distance and identity results indicated that geographic distance was not a dominating factor influencing the distribution of black locust. This is the first study to evaluate provenance genetic variation in native black locust samples using two types of SSR markers, which provides a comprehensive theoretical basis for ex situ conservation and utilization of genetic resources, with an emphasis on breeding applications.

Graphical Abstract

1. Introduction

Genetic variation can reflect the adaptation potential of species driven by long-term evolution via mutations, genetic drift, gene flow, and natural selection, which support rich genetic variation within species [1,2,3]. During long-term introduction, hybridization, and breeding of many plant species, populations increase and become widely distributed [4]. However, forest tree breeding is time-consuming and labor-intensive, with slow progress due to the general characteristics of trees, such as their perennial life cycle, height, and high heterozygosity. A comprehensive understanding of the genetic diversity and differentiation of genetic resources is important, as a reduction of genetic variation may compromise the plasticity and the resilience of a species in response to biotic and abiotic stresses [5]. The identification, selection, and preservation the genetic of diversity within forest trees species is therefore of particular interest due to the long life spans of these organisms, which require adaption to different environments and climate. These characteristics can be successfully used to inform conservation, efforts, including targeted breeding programs seeking to improve genetic diversity within a provenance [5,6,7,8].
In situ and ex situ conservation are two common methods for protecting of plant genetic resources and the latter serves as an essential genetic resource for users who require ready access, to a species’ germplasm. Ex situ is defined as the conservation of plants samples/seeds away from their field habitats with the goal of genetic improvement and conservation as a means of combating the genetic erosion (loss of useful genes) due to natural and human-mediated disorders [9,10,11]. Black locust (Robinia pseudoacacia L.) is a nitrogen-fixing tree native to the Appalachian and Ozark Mountains of the eastern United States. It is a widespread deciduous broadleaved tree with excellent characteristics of poor soil tolerance and resistance to salinity and alkalinity and with substantial ecological and environmental value [12]. However, the genetic variation of black locust in the United States has not been studied, likely due to limitation brought about by the production of fence posts in the Appalachians, as well as the stability of mines and roads in these regions [13]. Black locust has been introduced in many countries worldwide for the purpose of ex situ conservation as well as for its adaptability, rapid growth, and high bioenergy potential [12,14,15,16]. For example, it has become an important ecological afforestation tree species in China [17,18,19].
Unfortunately, there are few investigations of the genetic diversity and differentiation of black locust seeds collected within its natural distribution, and all ex situ conservation analyses of its genetic diversity performed to date have been based on allozymes [13,20,21], amplified fragment length polymorphisms [22], and inter-simple sequence repeats [23]. Among the various molecular marker technologies developed to date, simple sequence repeat (SSR) markers represent an ideal option for plant-based genetic diversity analyses, as they are codominant, hypervariable, amplification-stable, highly informative, inexpensive, and highly efficient [24,25,26]. Previous studies examining the genetic diversity of black locust using microsatellite markers have been extremely limited in scope, Lian et al. (2002, 2004) [27,28] and Mishima et al. (2008) [29] isolated 7, 3, and 11 polymorphic microsatellite loci, respectively, to assess the diversity of genotypes of black locust. Liesebach et al. (2012) [30] discovered a weak linkage between some microsatellite loci, although the methodology used for fingerprinting and parentage analysis remains questionable. In a more extensive analysis, Malvolti et al. (2015) [31] reported the diversity or identity of 91 black locust clones by root cuttings, although diversity analysis was performed using only nine genomic DNA-derived SSR (G-SSR). Although these studies constitute an excellent start for assessing the genetic diversity of the black locust germplasm, such efforts are obviously insufficient due to the long-term dynamic nature of natural and biological adaptability [32]. Additionally, the selection of suitable SSR markers remains an essential step when studying genetic differences in germplasm resources, which was not fully established in these studies. SSR markers include genomic DNA-derived SSRs (G-SSRs) and expressed sequence tag-derived SSRs (EST-SSRs). EST-SSRs were derived from expressed regions of the plant genome, showing a higher range of cross-transferability among several related genera/species, while G-SSRs display greater polymorphism within and between species. As these markers are derived from expressed regions of the plant genome, they provide greater insight into the conservation of a given region [33,34,35]. For example, in human neurons, an intronic polymorphic TCAT repeat in the tyrosine hydroxylase (TH) gene may regulate transcription via the microsatellite HUMTH01 [36]. Accordingly, by using two complementary marker types, each with its respective advantages, we are able to better asses the genomic differences within and between the species.
In this study, we evaluated the genetic variation of black locust provenance, based on G-SSR and EST-SSR markers. We used seeds collected from the distribution of black locust in the United States as well as ex situ conserved samples from Henan province, China. The aims of our study were to clarify the genetic diversity among and within provenances, the genetic differentiation among provenances, the degree of provenance genetic differentiation, and the correlation between the genetic and geographic distance of the analyzed provenances to provide a theoretical basis for improved evaluation, use, and protection of black locust genetic resources.

2. Results

2.1. Polymorphism and Determination of SSR Markers

We screened 91 pairs of SSR primers using polyacrylamide gel electrophoresis (PAGE) in eight black locust samples from different sources. Of these, 43 pairs failed to amplify clear PCR products, while 48 exhibited successful amplification. The rate of polymorphism was 52.75%. This set of polymorphic SSR primers included 37 EST-SSRs and 11 G-SSRs (Table S1).
The set of 48 primer pairs was further analyzed to obtain suitable SSR markers for subsequent analyses of the black locust provenances. Four of the markers (Rp-11, Rply1, Rply32, and Rops16) had more than 20% missing locus data. Genotype pairing was performed on all individuals; no two samples had an identical genotype. The Ewen–Watterson test was performed, four loci (Rops02, Rops15, Rops16, and Rp200) with significant deviations from a neutral equilibrium model. In addition, Micro-Checker analysis detected eight loci (Rp-08, Rp-19, Rp-30, Rp-40, Rply1, Rply3, Rply32, and Rply44) possessing null alleles. After combining these results, 13 pairs of SSR markers were ultimately deleted, and the remaining 35 markers, consisting of 28 EST-SSRs and 7 G-SSRs, were used for further analyses.

2.2. Characteristics of EST-SSRs and G-SSRs

An analysis of nucleotide sequences generated using polymorphic primers for EST-SSRs and G-SSRs showed that, in Robinia pseudoacacia L., the EST-SSRs consisted of 35.714% trinucleotide repeats, 28.571% hexa-nucleotides repeats, 17.857% penta-nucleotide repeats, 10.714% tetra-nucleotide repeats and 7.143% di-nucleotide repeats. In contrast, the G-SSRs were composed of only di-nucleotide repeats (Table 1). However, the number of G-SSR alleles was almost double that of EST-SSRs, yielding 1.62 times the level of polymorphism as that of EST-SSR (Table 2). Nevertheless, the amplification efficiency of EST-SSRs was as high as 65.079% after PCR amplification (Table 3).

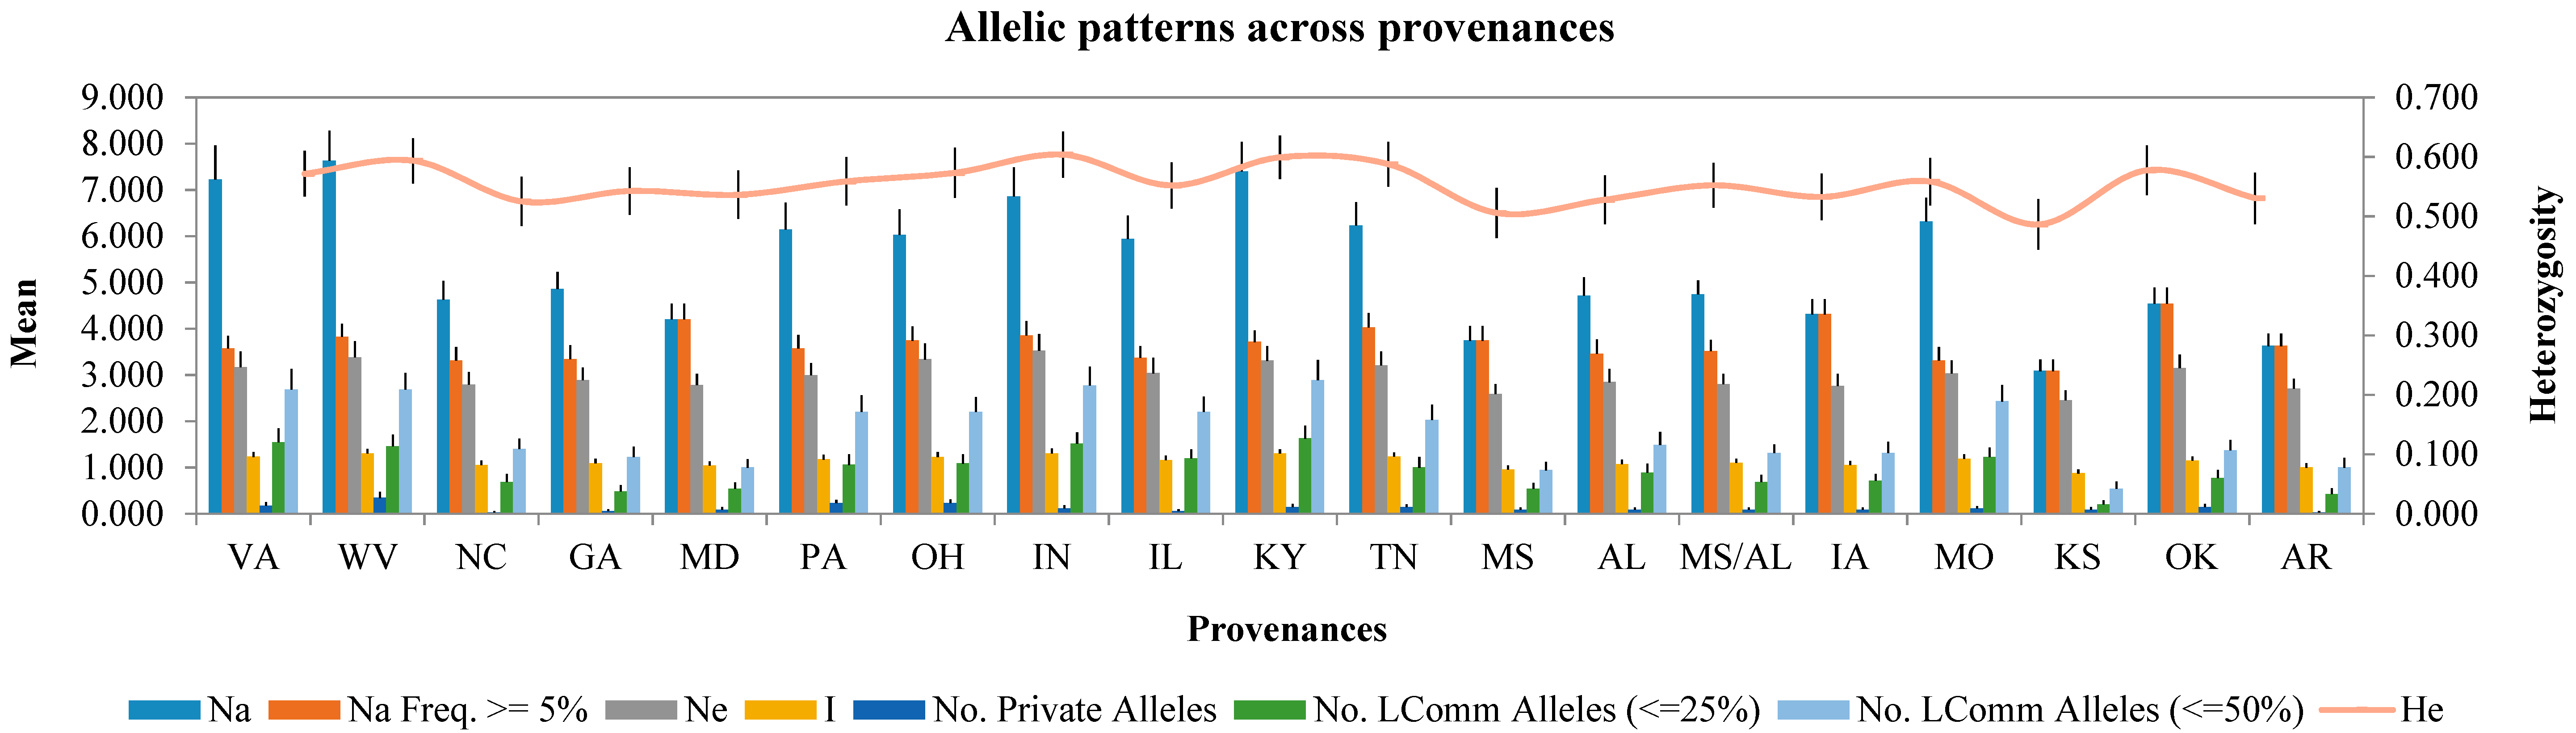
2.3. Genetic Diversity Analysis

We used the 35 SSR markers to evaluate genetic diversity at the locus and provenance levels. At the locus level, 439 alleles were identified, and the number of alleles per locus (N) ranged from 3 (at Rp-21) to 34 (Rops18) (Table S2). Meanwhile, the number of effective alleles per marker ranged from 1.065 (Rp-44) to 6.552 (Rops18) (mean: 2.988). The variations in polymorphism information content (PIC) and gene diversity (H) were consistent, with the highest values at Rops18 (0.898 and 0.906, respectively), followed by Rops05 (0.886 and 0.895), and the lowest at Rp-44 (0.061 and 0.061) (mean: 0.566 and 0.595). The expected heterozygosity (He) ranged from 0.054 (Rp-44) to 0.837 (Rops05) (mean: 0.553), while the observed heterozygosity (Ho) ranged from 0.044 (Rp-44) to 0.835 (Rp-38) (mean: 0.495). At the provenance level, the genetic diversity index was used to assess the variance of heterozygosity (Figure 1 and Table S3), with the highest values (No. of effective alleles (Ne) = 3.527) observed for the IN provenance and the lowest values (Ne = 2.457) for the KS provenance. In terms of uniformity, Shannon Information index values (I) ranged from 0.867 (IN provenance) to 1.306 (KS provenance). The IN and KY provenances showed the highest levels of expected heterozygosity (0.604 and 0.599, respectively). In total, 81 private alleles (PAs) from all 19 provenances were identified in this study (average frequency = 0.343), with the highest number (12 PAs) found in the WV provenance (Table S4) The No. of Different Alleles (Na) estimated for each provenance ranged from 3.086 (KS) and 7.629 (WV). Furthermore, Wright’s fixation index (FST) values among global and pairwise multi-loci ranged from 0.040 (Rp-12) to 0.110 (Rops08) and 0.007 (WV vs. Kentucky) to 0.089 (Kansas vs. Arkansas), respectively (Tables S2 and S5).

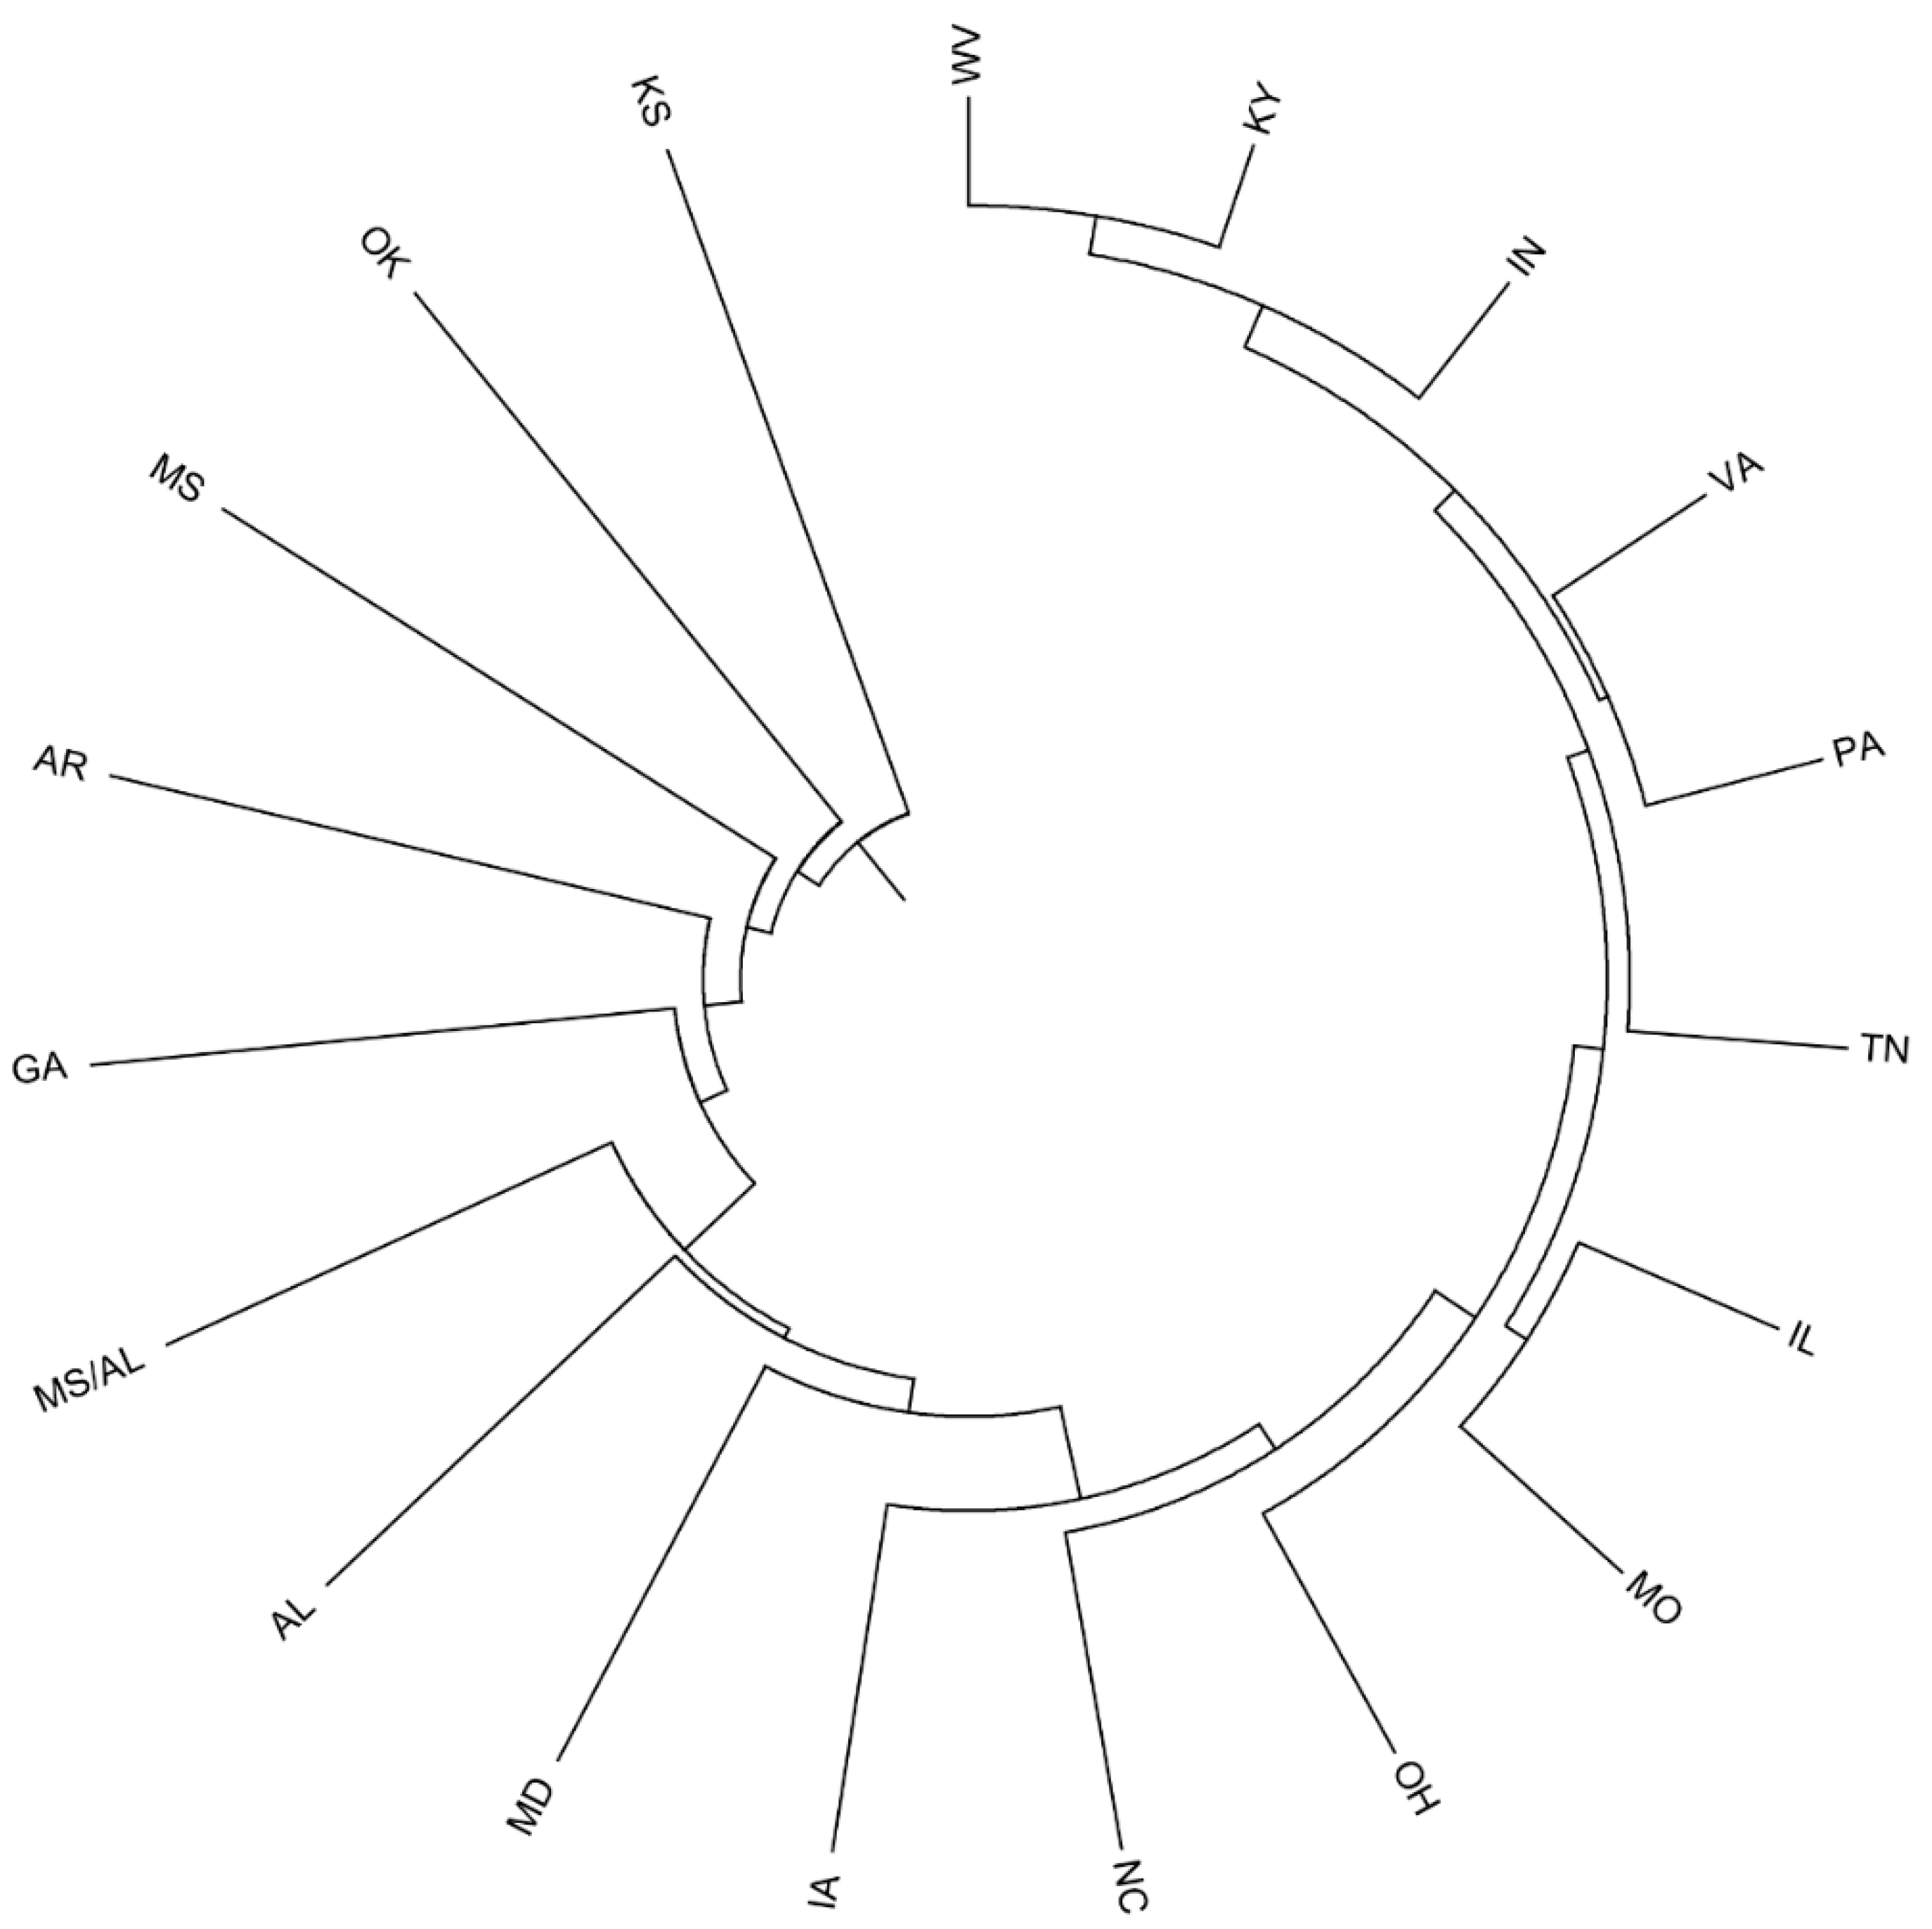
2.4. Provenance Differentiation Analysis

Analysis of molecular variance (AMOVA) was performed for all black locust accessions from the 19 study areas to analyze the genetic variation between and within provenances. The variance accounted for 3% of the variance among the provenances and 97% within provenances (Table 4).
Nei’s unbiased genetic distance and identity measure revealed genetic distance and identity values ranging from 0.002 to 0.141 and from 0.869 to 0.998, respectively, between provenances (Table S6). Among all area pairs, the WV and KY provenances showed the closest genetic distance (0.002) and highest identity (0.998). Using Nei’s genetic distance values, an UPGMA (Unweighted Pair Group Method with Arithmetic Mean) dendrogram was constructed showing the phylogenetic relationship among the 19 provenances (Figure 2). The geographic distance matrices ranged from 998 to 17,271 km based on latitude and longitude values computed using GenAlEx ver. 6.501 (details not shown). MD and OK represented the farthest geographic distance (17,271 km) but not the farthest genetic distance. Meanwhile, OK and KS represented the closest geographic distance (998 km) but not the closest genetic distance. Mantel tests (Figure 3) among the provenances and geographic distance showed consistent results.

3. Discussion

The microsatellite markers used in this study consisted of both expressed sequence tag-derived SSRs (EST-SSRs) and genomic DNA-derived SSRs (G-SSRs). A total of 37 EST-SSRs and 11 G-SSRs were confirmed as polymorphic based on results from a 6% native-deformation PAGE for eight plant materials with different phenotypes and sources. In this study, the levels of polymorphisms and allele numbers were higher for G-SSRs compared to EST-SSRs, with mean PIC values of 0.817 and 0.503, respectively. Diversity analyses found G-SSRs to be more polymorphic than EST-SSRs. These results are consistent with those of other studies, including those on both barley (mean PIC = 0.727 for 48 G-SSRs and 0.581 for 16 EST-SSRs) [37] and Linum usitatissimum L. (mean PIC = 0.326 of 15 G-SSRs and 0.245 for 7 EST-SSRs) [38]. Nevertheless, the amplification efficiency of EST-SSRs was 65.079%, showing higher conservation than that of G-SSRs (52.991%) in nine related species (Gleditsia sinensis, Cercis chinensis, Wisteria sinensis (Sims) Sweet, Trifolium repens, Amorpha fruticose, Sophora japonica, Sophora japonica var. pendula, Robinia pseudoacacia ‘Frisia’ and Robinia pseu-doacacia var. decaisneana). The high rate of EST-SSRs amplification in related species may be derived from a conserved region of the plant genome, which is consistent with the lower mutation frequency seen for ESTs compared to that of genomic DNA [39,40]. A recent study of human neurological tissues found that different microsatellite repeats could have subtle effects on the regulation gene transcription [36]. The analysis of the nucleotide sequences described here using two different SSR markers found that EST-SSR primers produced a range of mono- to hexa-nucleotides DNA segment repeats, compared with G-SSRs, which produced only tetra-nucleotide repeats. In short, EST-SSRs and G-SSRs have their own advantages for genomic studies assessing both inter- and intra- species diversity, with the complementary nature of this two-marker system serving as an ideal method for the study of Robinia pseudoacacia L.
Simple sequence repeats have emerged as one of the most popular and versatile marker types for plant genetics [34,35,36]; however, insufficient details regarding the practicalities of different genetic tools and a lack of validation based on blind analyses of existing data sets may pose a risk for researchers when judging their own results [41]. Here, we evaluated a set of 48 pairs of polymorphic primers, expecting to improve the efficiency of the study. From this set of 48 primer pairs, four non-neutral loci were removed by a neutral equilibrium model, suggesting that these loci were possibly affected by selection or other factors [42]. Meanwhile, eight loci had null alleles and likely contributed to the positive inbreeding coefficient [43]. Ultimately, 35 primer pairs were identified for further analysis.
Microsatellite markers are an essential tool for gene discovery, enabling the detection of distinctive alleles that can be useful for studying marker-trait associations in populations [44]. In this study, we found an average of 12.594 observed alleles per locus within the 367 black locust genotypes. This value was higher than the level of N (3.2) in seedings obtained from seed collections representing the natural range of black locust that was determined using the allozyme method [13], and it was higher than the mean value (N = 7.429) seen in 18 R. pseudocacia L. individuals, which was computed based on seven G-SSR markers [27]. The high number of alleles observed in his study may be due to the relatively large sample size used in this study in addition to the use of two types of SSR markers. In terms of diversity, the mean Shannon’s Information index value (I) was 1.133 across all 19 provenances, substantially higher than that seen in R. pseudocacia L. samples collected from the 10 main planting districts in China, as determined based on 10 pairs of AFLP (I = 0.138) and ISSR markers (I = 0.373) [22,23]. This considerable difference in Shannon’s Information index values may be related to the different sources of materials and/or the different types of molecular markers used.
Observed and expected heterozygosity are two important parameters for gauging gene diversity [45]. In this study, the mean observed (Ho) and expected (He) levels of heterozygosity were 0.495 and 0.553, respectively. These levels are somewhat lower than those seen in two previous reports of black locust diversity performed using G-SRR markers. Lian et al. (2002) [27] reported Ho and He levels of 0.615 and 0.773; 7 G-SSR markers, respectively, compared with 0.661 and 0.739, respectively, in Mishima et al. (2008) [29]. Low levels of heterozygous individuals were also observed within the provenances (Table S5). The mean value of Ho was lower than that of He, at both the locus and provenance levels, indicative of a deficit of heterozygotes in black locust. In addition, FIS was 0.105 and 0.133 at the locus and provenance levels, respectively, possibly related to a degree of self-intersection in this species. A similar result was reported in a study of black locust allozymes (FIS = 0.072) [13]. These results suggest a low level of heterozygous deletions that are due either to the spatial scale chosen for sampling, in which the study site was larger than the true scale of a population, or to inbreeding, which might be attributable to the hybridization of only a few related species within the natural distribution over a long period [41,46].
The degree of genetic differentiation in provenances based on FST is usually defined as low (FST < 0.05), medium (0.05 > FST > 0.15), or high (FST > 0.15) [34]. Based on these criteria, the provenances exhibited a low degree of differentiation. This was confirmed by AMOVA, which indicated that only 3% of genetic variation appeared among provenances, the majority of which was attributed to within-provenance differences. Such within-provenance variation might be a characteristic of woody plants with long growth periods and outcrossing, resulting in increased genetic diversity among individuals within provenance and reduced genetic differentiation among provenances [35]. Additionally, the values of Nei’s unbiased genetic distance (D) and identity (I) also showed the genetic differentiation between provenances. The UPGMA dendrogram, constructed using Nei’s algorithm (1972) and other indices of genetic variability, showed low values of genetic distance among the 19 analyzed provenances. Mantel tests between provenance and geographic distance showed consistent results. These findings provide further evidence that geographic distance is not a dominant factor influencing the distribution of black locust. This was similar to the results of Surles et al. [13], who reported a lack of significant correlation between genetic identity and geographic distance based on an allozyme study. Taken together, these results all indicate that the primary variation comes from individuals of black locust, rather than from the genetic and geographic distance between provenances. It provides a theoretical basis for the selective breeding of Robinia pseudoacacia L., and shows that black locust may possess favourable adaptation due to the abundant variation among individuals in a provenances.

4. Materials and Methods

4.1. Plant Materials

Open-pollinated R. pseudoacacia fruits were collected from the 19 main black locust distribution areas in the United States (including 18 states and 1 state border) from September to October 2010, which includes most of the natural distribution of black locusts (Table 5) [12,13,14]. In these regions, several fruits of black locusts with normal growth and a diameter at breast height greater than 20 cm were collected in 500-m intervals, and the obtained fruits were mailed to the Henan Academy of Forestry Sciences in China. From April to July 2011, the collected seeds were soaked for 24 h in 20 areas. After the seedlings were successfully germinated and approximately 30 cm tall, they were transplanted to two test sites in Mengjin (34°49′18′′ N, 112°28′12′′ E) and Minquan (34°43′59′′ N, 115°05′10′′ E) in Henan and scientifically managed to preserve normal seedling growth. Three hundred and sixty-seven black locust tender leaves with well-grown and different maternal strains were randomly selected from the above two test bases as experimental material in 2017. Information on the experimental samples is presented in Table S7. Tender leaves were randomly collected from trees and rapidly placed in sealed bags containing silica gel. Then, the plant materials were transferred to the National Engineering Laboratory for Tree Breeding, Beijing Forestry University, China (40°0′22′′ N, 116°21′1′′ E) and protected from light at room temperature until DNA extraction

4.2. DNA Extraction

For every sample, total genomic DNA was isolated from dried and tender leaves using a plant genomic DNA kit (Tiangen, Beijing, China). After extraction, to check the quality and concentration, 1 µL genomic DNA from each genotype was loaded onto a 1% agarose gel and quantitated using the NanoDrop 2000 (Thermo Fisher Scientific, Wilmington, DE, USA). All DNA samples were normalized to an equal concentration (20 ng/µL) using TB elution buffer (Tiangen) and stored immediately at −80 °C for SSR amplification.

4.3. SSR Marker Screening

We assessed 91 pairs of SSR primers, including 21 pairs of G-SSR primers found in the literature [27,28,29] and 60 EST-SSRs (Table 6) [47,48]. Details of the SSR primers which were synthesized by TSINGKE Biological Technology Co., Ltd. (Beijing, China) are reported in Table S8.
To obtain SSR primer sets with rich polymorphism and steady bands for subsequent experiments, we selected eight plant materials with different phenotypes and sources that had been investigated by black locust breeders in China using a screening assay. Table S9 presents information on the samples. Eight samples were collected from two artificial planting distribution regions in China: Daqingshan Forest Farm, Fei Country, Linyi, Shandong Province (35°23′ N, 118°11′ E) and Mengjin, Luoyang, Henan Province (34°49′ N, 112°28′ E). PCR amplification was performed in a total reaction volume of 20 µL containing 10 µL 2× TSINGKE® Master Mix (blue) (TSINGKE Biological Technology Co., Ltd.), 1 µL of the forward primer (10 µM), 1 µL of the reverse primer (10 µM), 2 µL genomic DNA (20 ng/µL), and 6 µL double-distilled water. PCR amplification was performed by an initial denaturation step at 94 °C for 4 min, followed by 20 cycles of 94 °C for 30 s, 60 °C to 50 °C for 30 s (decreasing by 0.5 °C per cycle), and 72 °C for 1 min, 20 cycles with the annealing temperature fixed at 50 °C, 72 °C for 45 s, and a final extension at 72 °C for 10 min using the BIO-RAD T100 thermal cycler [49]. The amplified PCR products from the SSR primer screening were resolved by 6% native-deformation PAGE using 1× Tris–borate–EDTA buffer solution at 220 V for 100 min. After electrophoresis, the amplified products were rinsed, silver-stained, visualized under ultraviolet light, and photographed.

4.4. Comparison of EST-SSR and G-SSR outcomes

The effectiveness comparison of EST-SSR and G-SSR amplification in several genera of Leguminosae, including Gleditsia (Caesalpinioideae), Cercis (Caesalpinioideae), Wisteria (Papilionoideae), Trifolium (Papilionoideae), Amorpha (Papilionoideae), Sophora (Papilionoideae), and Robinia (Papilionoideae), was used to evaluate SSR markers. Markers were obtained from Beijing Forestry University Campus, China (40°0′22′′ N, 116°21′1′′ E) [48]. Genomic DNA extraction, PCR amplification, and fluorescence modification were performed as described above.

4.5. SSR Amplification of Provenances

Based on the screening, optimal primers were applied to the provenance of 367 samples for amplification analysis. SSR amplification was performed by PCR in a 20-µL reaction volume containing 10 µL 2× TSINGKE® Master Mix (blue) (TSINGKE Biological Technology Co., Ltd.), 0.1 µL forward primer (10 µM), which was labeled at the 5′ end with fluorescent-dye (FAM, HEX, ROX, and TAMRA), 0.3 µL reverse primer (10 µM), 0.2 µL M13 primer (10 µM; 5′-TGTAAAACGACGGCCAGT-3′), 2 µL genomic DNA (20 ng/µL), and 7.9 µL sterile double-distilled water [42]. The PCR amplification conditions were as follows: 4 min at 94 °C, 20 cycles of 30 s at 94 °C, 30 s at 60 °C to 50 °C (decreasing at 0.5 °C per cycle), and 1 min at 72 °C, 20 cycles of 30 s at 94 °C, 30 s at 50 °C, and 45 s at 72 °C, and a final extension at 72 °C for 10 min.
The PCR products were separated using the ABI 3730XL DNA capillary electrophoresis analyzer (Applied Biosystems, Foster City, CA, USA) and a GeneScan-500LIZ size standard. Alleles of the SSRs were confirmed using GeneMarker ver. 2.2.0 (SoftGenetics LLC, State College, PA, USA).

4.6. Genetic Diversity and Differentiation Analysis

The N, Na, Ho, He, percentage of polymorphic loci, and Shannon’s information index were computed using GenAlEx ver. 6.501 [50,51]. Calculations of Wright’s F-statistics (FIS, FIT, and FST) among provenances were estimated using FSTAT ver. 2.9.3 software [52]. PIC values were calculated using PowerMarker ver. 3.25 [53]. Hardy–Weinberg equilibrium was calculated using Arlequin ver. 3.5 [54] with 100,000,000 steps in the Markov chain and 100,000 dememorization steps [55], and the Ewen–Watterson test was used to detect whether the polymorphic microsatellite markers deviated significantly from neutral equilibrium [56]. AMOVA was performed using GenAlEx 6.5 to estimate the genetic variance among and within provenances and geographic areas. Simultaneously, Nei’s genetic distance was estimated using GenAlEx 6.5. Null alleles were detected using Micro-Checker ver. 2.2.3 [57]. Nei’s genetic distance values were used to construct the UPGAM dendrogram comparing genetic diversity across different provenances using PowerMarker ver. 3.25. Finally, GENECAP ver. 1.4 was used to identify materials with identical genotypes [58].

5. Conclusions

The present study revealed that (1) the genetic diversity among the native black locust populations is high, (2) the majority of genetic differentiation variation was attributed to differences within populations, and (3) geographic distance is not a dominant factor influencing the distribution of black locust. These findings provide comprehensive information that can be used as a foundation for genetic assessments, improvements, and management of black locust.

Supplementary Materials

Supplementary materials can be found at https://www.mdpi.com/1422-0067/19/9/2492/s1.

Author Contributions

Conceived and designed the experiments: Y.L. and Q.G.; performed the experiments: Q.G., X.L., S.Y., Z.Y., Y.S., J.Z., S.C., L.D. and S.U.; analyzed the data: Q.G. and X.L.; wrote the paper: Q.G.

Funding

This work was supported by The National Nature Science Foundation of China (31570677); National Key R&D Program of China (2017YFD0600503); the Long-Term Research Program for Young Teachers of Beijing Forestry University (2015ZCQ-SW-03); Research and Development Project of Beijing Forestry University(2016BLPX13); Major Scientific Research Achievements Cultivation Project of Beijing Forestry University (2017CGP007).

Conflicts of Interest

The authors declare no conflict of interest.

References

  1. Young, A.; Boyle, T.; Brown, T. The population genetic consequences of habitat fragmentation for plants. Trend. Ecol. Evol. 1996, 11, 413–418. [Google Scholar] [CrossRef]
  2. Dlugosch, K.M.; Parker, I.M. Founding events in species invasions: Genetic variation, adaptive evolution, and the role of multiple introductions. Mol. Ecol. 2008, 17, 431–449. [Google Scholar] [CrossRef] [PubMed]
  3. Aitken, S.N.; Yeaman, S.; Holliday, J.A.; Wang, T.; Curtis-McLane, S. Adaptation, migration or extirpation: Climate change outcomes for tree populations. Evol. Appl. 2008, 1, 95–111. [Google Scholar] [CrossRef] [PubMed]
  4. Strayer, D.L.; Eviner, V.T.; Jeschke, J.M.; Pace, M.L. Understanding the long-term effects of species invasions. Trend. Ecol. Evol. 2006, 21, 645–651. [Google Scholar] [CrossRef] [PubMed]
  5. Machida-Hirano, R. Diversity of potato genetic resources. Breed. Sci. 2015, 65, 26–40. [Google Scholar] [CrossRef] [PubMed] [Green Version]
  6. Vir, R.; Lakhanpaul, S.; Malik, S.; Umdale, S.; Bhat, K.V. Utilization of germplasm for the genetic improvement of mung bean (Vigna radiata (L.) Wilczek): The constraints and the opportunities. In Gene Pool Diversity and Crop Improvement; Rajpal, V., Rao, S., Raina, S., Eds.; Springer International Publishing: Cham, Switzerland, 2016; Volume 10, pp. 367–391. [Google Scholar]
  7. Kumar, S.; Ambreen, H.; Variath, M.T.; Rao, A.R.; Agarwal, M.; Kumar, A.; Goel, S.; Jagannath, A. Utilization of molecular, phenotypic, and geographical diversity to develop compact composite core collection in the oilseed crop, Safflower (Carthamus tinctorius L.) through maximization strategy. Front. Plant Sci. 2016, 7, 1554. [Google Scholar] [CrossRef] [PubMed]
  8. Mhlaba, Z.B.; Mashilo, J.; Shimelis, H.; Assefa, A.B.; Modi, A.T. Progress in genetic analysis and breeding of tepary bean (Phaseolus acutifolius A. Gray): A review. Sci. Hortic. 2018, 237, 112–119. [Google Scholar] [CrossRef]
  9. Cohen, J.I.; Williams, J.T.; Plucknett, D.L.; Shands, H. Ex situ conservation of plant genetic resources: Global development and environmental concerns. Science 1991, 253, 866–872. [Google Scholar] [CrossRef] [PubMed]
  10. Rao, N.K. Plant genetic resources: Advancing conservation and use through biotechnology. Afr. J. Biotechnol. 2004, 3, 136–145. [Google Scholar] [CrossRef]
  11. Ulloa, M.; Stewart, J.M.; Garcia-C, E.A.; Godoy-A, S.; Gaytan-M, A.; Acosta, N.S. Cotton genetic resources in the western states of Mexico: In situ conservation status and germplasm collection for ex situ preservation. Genet. Resour. Crop Evol. 2006, 53, 653–668. [Google Scholar] [CrossRef]
  12. Boring, L.R.; Swank, W.T. The role of black locust (Robinia pseudo-acacia) in forest succession. J. Ecol. 1984, 72, 749–766. [Google Scholar] [CrossRef]
  13. Surles, S.E.; Hamrick, J.L.; Bongarten, B.C. Allozyme variation in black locust (Robinia pseudoacacia). Can. J. For. Res. 1989, 19, 471–479. [Google Scholar] [CrossRef]
  14. Rédei, K.; Osvath-Bujtas, Z.; Veperdi, I. Black locust (Robinia pseudoacacia L.) improvement in Hungary: A review. Acta Silvatica et Lignaria Hungarica 2008, 4, 127–132. [Google Scholar]
  15. Kropf, U.; Korošec, M.; Bertoncelj, J.; Ogrinc, N.; Nečemer, M.; Kump, P.; Golob, T. Determination of the geographical origin of Slovenian black locust, lime and chestnut honey. Food Chem. 2010, 121, 839–846. [Google Scholar] [CrossRef]
  16. Benesperi, R.; Giuliani, C.; Zanetti, S.; Gennai, M.; Lippi, M.M.; Guidi, T.; Nascimbene, J.; Foggi, B. Forest plant diversity is threatened by Robinia pseudoacacia (black-locust) invasion. Biodivers. Conserv. 2012, 21, 3555–3568. [Google Scholar] [CrossRef]
  17. Tian, C.; He, X.; Zhong, Y.; Chen, J. Effect of inoculation with ecto-and arbuscular mycorrhizae and Rhizobium on the growth and nitrogen fixation by black locust, Robinia pseudoacacia. New For. 2003, 25, 125–131. [Google Scholar] [CrossRef]
  18. Qiu, L.P.; Zhang, X.C.; Cheng, J.M.; Yin, X.Q. Effects of black locust (Robinia pseudoacacia) on soil properties in the loessial gully region of the Loess Plateau, China. Plant Soil 2010, 332, 207–217. [Google Scholar] [CrossRef]
  19. Zhang, J.G.; Guan, J.H.; Shi, W.Y.; Yamanaka, N.; Du, S. Interannual variation in stand transpiration estimated by sap flow measurement in a semi-arid black locust plantation, Loess Plateau, China. Ecohydrology 2015, 8, 137–147. [Google Scholar] [CrossRef]
  20. Chang, C.S.; Bongarten, B.; Hamrick, J. Genetic structure of natural populations of black locust (Robinia pseudoacacia L.) at Coweeta, North Carolina. J. Plant Res. 1998, 111, 17–24. [Google Scholar] [CrossRef]
  21. Liesebach, H.; Schneck, V. Genetic diversity and differentiation in a black locust (Robinia pseudoacacia L.) progeny test. Int. J. For. Genet. 2004, 11, 151–161. [Google Scholar]
  22. Huo, X.M.; Han, H.W.; Zhang, J.; Yang, M.S. Genetic diversity of Robinia pseudoacacia populations in China detected by AFLP markers. Front. Agric. China 2009, 3, 337–345. [Google Scholar] [CrossRef]
  23. Sun, F.; Yang, M.S.; Zhang, J.; Gu, J.T. ISSR analysis of genetic diversity of Robinia pseudoacacia populations (in Chinese). J. Plant Genet. Resour. 2009, 10, 91–96. [Google Scholar]
  24. Pejic, I.; Ajmone-Marsan, P.; Morgante, M.; Kozumplick, V.; Castiglioni, P.; Taramino, G.; Motto, M. Comparative analysis of genetic similarity among maize inbred lines detected by RFLPs, RAPDs, SSRs, and AFLPs. Theor. Appl. Genet. 1998, 97, 1248–1255. [Google Scholar] [CrossRef]
  25. Li, Y.C.; Korol, A.B.; Fahima, T.; Beiles, A.; Nevo, E. Microsatellites: Genomic distribution, putative functions and mutational mechanisms: A review. Mol. Ecol. 2002, 11, 2453–2465. [Google Scholar] [CrossRef] [PubMed]
  26. Ebrahimi, A.; Zarei, A.; McKenna, J.R.; Bujdoso, G.; Woeste, K.E. Genetic diversity of Persian walnut (Juglans regia) in the cold-temperate zone of the United States and Europe. Sci. Hortic. 2017, 220, 36–41. [Google Scholar] [CrossRef]
  27. Lian, C.; Hogetsu, T. Development of microsatellite markers in black locust (Robinia pseudoacacia) using a dual-supression-PCR technique. Mol. Ecol. Resour. 2002, 2, 211–213. [Google Scholar] [CrossRef]
  28. Lian, C.; Oishi, R.; Miyashita, N.; Hogetsu, T. High somatic instability of a microsatellite locus in a clonal tree, Robinia pseudoacacia. Theor. Appl. Genet. 2004, 108, 836–841. [Google Scholar] [CrossRef] [PubMed]
  29. Mishima, K.; Hirao, T.; Urano, S.; Watanabe, A.; Takata, K. Isolation and characterization of microsatellite markers from Robinia pseudoacacia L. Mol. Ecol. Resour. 2008, 9, 850–852. [Google Scholar] [CrossRef] [PubMed]
  30. Liesebach, H.; Ewald, E. Optimisation of a multiplex PCR assay of nuclear microsatellite markers for population genetics and clone identification in Robinia pseudoacacia L. Silvae Genet. 2012, 61, 142–148. [Google Scholar] [CrossRef]
  31. Malvolti, M.E.; Olimpieri, I.; Pollegioni, P.; Cseke, K.; Keserű, Z.; Rédei, K. Black locust (Robinia pseudoacacia L.) root cuttings: Diversity and identity revealed by SSR genotyping: A case study. South-East Eur. For. 2015, 6, 201–217. [Google Scholar] [CrossRef]
  32. Bretting, P.K.; Duvick, D.N. Dynamic conservation of plant genetic resources. Adv. Agron. 1997, 61, 51. [Google Scholar]
  33. Liu, S.; Liu, H.; Wu, A.; Hou, Y.; An, Y.; Wei, C. Construction of fingerprinting for tea plant (Camellia sinensis) accessions using new genomic SSR markers. Mol. Breed. 2017, 37, 93. [Google Scholar] [CrossRef]
  34. Sathyanarayana, N.; Pittala, R.K.; Tripathi, P.K.; Chopra, R.; Singh, H.R.; Belamkar, V.; Bhardwaj, P.K.; Doyle, J.J.; Egan, A.N. Transcriptomic resources for the medicinal legume Mucuna pruriens: De novo transcriptome assembly, annotation, identification and validation of EST-SSR markers. BMC Genom. 2017, 18, 409. [Google Scholar] [CrossRef] [PubMed]
  35. Xu, X.Y.; Zhou, C.P.; Zhang, Y.; Zhang, W.Q.; Gan, X.H.; Zhang, H.X.; Guo, Y.; Gan, S.M. A novel set of 223 EST-SSR markers in Casuarina L. ex Adans.: Polymorphisms, cross-species transferability, and utility for commercial clone genotyping. Tree Genet. Genomes 2018, 14, 30. [Google Scholar] [CrossRef]
  36. Albanèse, V.; Biguet, N.F.; Kiefer, H.; Bayard, E.; Mallet, J.; Meloni, R. Quantitative effects on gene silencing by allelic variation at a tetranucleotide microsatellite. Hum. Mol. Genet. 2001, 10, 1785–1792. [Google Scholar] [CrossRef] [PubMed] [Green Version]
  37. Nandha, P.S.; Singh, J. Comparative assessment of genetic diversity between wild and cultivated barley using gSSR and EST-SSR markers. Plant. Breed. 2014, 133, 28–35. [Google Scholar] [CrossRef]
  38. Choudhary, S.B.; Sharma, H.K.; Kumar, A.A.; Chowdhury, I.; Maruthi, R.T.; Kak, A. Genetic diversity spectrum and marker trait association for agronomic traits in global accessions of Linum usitatissimum L. Ind. Crop. Prod. 2017, 108, 604–615. [Google Scholar] [CrossRef]
  39. Wen, M.F.; Wang, H.Y.; Xia, Z.Q.; Zou, M.L.; Lu, C.; Wang, W.Q. Development of EST-SSR and genomic-SSR markers to assess genetic diversity in Jatropha Curcas L. BMC Res. Notes 2010, 3, 42. [Google Scholar] [CrossRef] [PubMed]
  40. Yan, Z.Z.; Wu, F.; Luo, K.; Zhao, Y.F.; Yan, Q.; Zhang, Y.F.; Wang, Y.R.; Zhang, J.Y. Cross-species transferability of EST-SSR markers developed from the transcriptome of Melilotus and their application to population genetics research. Sci. Rep. 2017, 7, 17959. [Google Scholar] [CrossRef] [PubMed] [Green Version]
  41. Selkoe, K.A.; Toonen, R.J. Microsatellites for ecologists: A practical guide to using and evaluating microsatellite markers. Ecol. Lett. 2006, 9, 615–629. [Google Scholar] [CrossRef] [PubMed]
  42. Lazrek, F.; Roussel, V.; Ronfort, J.; Cardinet, G.; Chardon, F.; Aouani, M.E.; Huguet, T. The use of neutral and non-neutral SSRs to analyse the genetic structure of a Tunisian collection of Medicago truncatula lines and to reveal associations with eco-environmental variables. Genetica 2009, 135, 391. [Google Scholar] [CrossRef] [PubMed]
  43. Bruford, M.W.; Ciofi, C.; Funk, S.M. Characteristics of microsatellites. In Molecular Tools for Screening Biodiversity; Springer: Dordrecht, The Netherlands, 1998; pp. 202–205. [Google Scholar]
  44. Pandian, S.; Satish, L.; Rameshkumar, R.; Muthuramalingam, P.; Rency, A.S.; Rathinapriya, P.; Ramesh, M. Analysis of population structure and genetic diversity in an exotic germplasm collection of Eleusine coracana (L.) Gaertn. using genic-SSR markers. Gene 2018, 653, 80–90. [Google Scholar] [CrossRef] [PubMed]
  45. Slatkin, M.; Barton, N.H. A comparison of three indirect methods for estimating average levels of gene flow. Evolution 1989, 43, 1349–1368. [Google Scholar] [CrossRef] [PubMed]
  46. Johnson, M.S.; Black, R. The Wahlund effect and the geographical scale of variation in the intertidal limpet Siphonaria sp. Mar. Biol. 1984, 79, 295–302. [Google Scholar] [CrossRef]
  47. Zhao, K.Q. Development and Application of EST-SSR Primers in Robinia pseudoacacia L. Master’s Dissertation, Beijing Forestry University, Beijing, China, 2014. [Google Scholar]
  48. Guo, Q.; Wang, J.X.; Su, L.Z.; Lv, W.; Sun, Y.H.; Li, Y. Development and evaluation of a novel set of EST-SSR markers based on transcriptome sequences of black locust (Robinia pseudoacacia L.). Genes 2017, 8, 177. [Google Scholar] [CrossRef] [PubMed]
  49. Schuelke, M. An economic method for the fluorescent labeling of PCR fragments. Nat. Biotechnol. 2000, 18, 233–234. [Google Scholar] [CrossRef] [PubMed]
  50. Peakall, R.O.D.; Smouse, P.E. GENALEX 6: Genetic analysis in Excel. Population genetic sofware for teaching and research. Mol. Ecol. Notes 2006, 6, 288–295. [Google Scholar] [CrossRef]
  51. Peakall, R.; Smouse, P.E. GenAlEx 6.5: Genetic analysis in Excel. Population genetic sofware for teaching and research—An update. Bioinformatics 2012, 28, 2537–2539. [Google Scholar] [CrossRef] [PubMed]
  52. Goudet, J. FSTAT, a Program to Estimate and Test Gene Diversity and Fixation Indices (Version 2.9.3). Lausanne University. Available online: http://www2.unil.ch/popgen/softwares/fstat.htm (accessed on 23 August 2018).
  53. Liu, K.J.; Muse, S.V. PowerMarker: An integrated analysis environment for genetic marker analysis. Bioinformatics 2005, 21, 2128–2129. [Google Scholar] [CrossRef] [PubMed]
  54. Excoffier, L.; Lischer, H.E. Arlequin suite ver 3.5: A new series of programs to perform population genetics analyses under Linux and Windows. Mol. Ecol. Resour. 2010, 10, 564–567. [Google Scholar] [CrossRef] [PubMed]
  55. Guo, S.W.; Tompson, E.A. Performing the exact test of Hardy-Weinberg proportion for multiple alleles. Biometrics 1992, 48, 361–372. [Google Scholar] [CrossRef] [PubMed]
  56. Ewens, W.J. The sampling theory of selectively neutral haplotypes. Theor. Pop. Biol. 1972, 3, 87–112. [Google Scholar] [CrossRef]
  57. Oosterhout, C.V.; Hutchinson, W.F.; Wills, D.P.M.; Shipley, P. MICRO CHECKER: Sofware for identifying and correcting genotyping errors in microsatellite data. Mol. Ecol. Notes 2004, 4, 535–538. [Google Scholar] [CrossRef]
  58. Wilberg, M.J.; Dreher, B.P. Genecap: A program for analysis of multi-locus genotype data for non-invasive sampling and capture-recapture population estimation. Mol. Ecol. Notes 2004, 4, 783–785. [Google Scholar] [CrossRef]
Figure 1. Average genetic diversity indices for the 19 provenances of Robinia pseudoacacia L. analyzed in this study. Na: No. of Different Alleles; Na Freq. ≥ 5%: No. of different alleles with a frequency ≥ 5%; Ne: No. of effective alleles = 1/(Sum pi2); I: Shannon’s Information Index, I = −1 Sum (pi Ln (pi)); No. Private Alleles: No. of alleles unique to a single provenance; No. LComm Alleles (≤25%): No. of locally common alleles (Freq. ≥ 5%) found in 25% or fewer provenances; No. Lcomm Alleles (≤50%): No. of locally common alleles (Freq. ≥ 5%) Found in 50% or fewer provenances; He: Expected heterozygosity, He = 1 − Sum pi2. The error line in each column is the standard error values of corresponding diversity index.
Ijms 19 02492 g001
Figure 2. UPGMA dendrogram based on Nei’s (1972) genetic distance values showing the relationship among different provenances of Robinia pseudoacacia L.
Ijms 19 02492 g002
Figure 3. Relationship between genetic distance and geographic distance for all black locust provenances (The X-axis scale is 0.010, and the Y-axis is 2.000). Genetic distance was computed based on pairwise FST/(1 − FST) estimates among provenances.
Ijms 19 02492 g003
Table 1. Characteristics of expressed sequence tag-derived SSRs (EST-SSRs) and genomic DNA-derived SSRs (G-SSRs) markers in Robinia pseudoacacia L. individuals.
Repeat TypeEST-SSR Polymorphic NumberRemaining Number after ScreeningPercentageG-SSR Polymorphic NumberRemaining Number after ScreeningPercentage
Di-427.143117100
Tri-141035.714-00
Tetra-3310.714-00
Penta-7517.857-00
Hexa-9828.571-00
Total3728100117100
“-” means no polymorphic.
Table 2. Diversity of EST-SSRs and G-SSRs in Robinia pseudoacacia L.
SSR Marker TypeGenotype NumberAllele Number (N)Gene Diversity (H)Polymorphism Information Content (PIC)
EST-SSR24.28610.4640.5350.503
G-SSR65.42920.8570.8350.817
Table 3. Amplification efficiency in Leguminosae species using EST-SSRs and G-SSRs.
SpeciesEST-SSR Number of LociPercentageG-SSR Noumber of LociPercentage
Gleditsia sinensis2057.143861.538
Cercis chinensis2057.143646.154
Wisteria sinensis (Sims) Sweet2160.000861.538
Trifolium repens1748.57100.000
Amorpha fruticosa1954.286861.538
Sophora japonica2160.000969.231
Sophora japonica var. pendula2160.000753.846
Robinia pseudoacacia ‘Frisia’3497.143753.846
Robinia pseu-doacacia var. decaisneana3291.429969.231
Mean22.77865.0796.88952.99
Table 4. Analysis of molecular variance (AMOVA) of the 19 black locust provenances based on SSR markers.
Source of VariationDegree of FreedomSum of SquaresMean SquarePercentage VariationPercentage Variation (%)p-Value
Among Provenances18686.44838.1360.7153%<0.01
Within Provenances3488565.05124.61224.61297%<0.01
Total3669251.499 25.327100%
Table 5. Geographic coordinates of the original US locations and numbers of Robinia pseudoacacia L. samples collected from each area.
Provenance NameSource SitesSample NumberLatitude (N)Longitude (W)
VABlack Burg1237°26′80°45′
Independence1236°37′ 81°07′
Washington DC1438°27′76°28′
WVNew River Gorge1438°04′81°03′
Morgantown1139°36′79°57′
West Huntington1438°23′82°29′
NCHuntersville1239°08′90°45′
GABlue Ridge Lake1334°51′84°19′
MDOld National Pike939°42′78°18′
PABig Beaver Blvd1340°32′80°18′
Bedford1540°08′78°30′
OHCadiz piedmont1240°07′81°13′
Cincinnati1039°03′84°31′
INFisher1239°56′85°53′
Georgetwon1338°17′85°55′
Elberfeld838°10′87°26′
ILBloomington1240°28′89°01′
Toe Exit1239°03′88°40′
KYMt Sterling1138°03′84°02′
Bowling Green1437°00′86°17′
Kentucky Lake636°59′′88°08′
Wickliffe1037°01′89°03′
TNKnoxville1335°52′83°57′
Waverly1435°53′87°39′
MSSardis834°26′89°53′
ALUpper Elkton RD1134°56′86°53′
MS/ALMs/AL Border1334°11′88°06′
IABrulington1040°50′91°08′
MOHannidal839°43′91°21′
ST James1437°56′91°08′
KSRiverton437°06′94°42′
OKPryor836°19′95°18′
ARColt535°21′80°51′
Total Number1933367--
“-” means no total number.
Table 6. Source of SSR primers in this study.
Type of primersNumber of PrimersReference
EST-SSR45Guo et al. (2017) [48]
EST-SSR25Zhao K.Q. (2014) [47]
G-SSR11Mishima et al. (2008) [29]
G-SSR3Lian et al. (2004) [28]
G-SSR7Lian et al. (2002) [27]

