Comparative Transcriptome Profiling of Two Tomato Genotypes in Response to Potassium-Deficiency Stress


1
The Key Laboratory of Protected Horticulture Ministry of Education, College of Horticulture, Shenyang Agricultural University, Shenyang 110866, China
2
College of Agriculture, Jilin Agriculture Science and Technology College, Jilin 132101, China
*
Authors to whom correspondence should be addressed.
Int. J. Mol. Sci. 2018, 19(8), 2402; https://doi.org/10.3390/ijms19082402
Submission received: 14 June 2018
/
Revised: 9 August 2018
/
Accepted: 10 August 2018
/
Published: 14 August 2018
(This article belongs to the Special Issue Regulation of Mineral Nutrients Homeostasis and Their Crosstalk in Plants)
Abstract
:Tomato is a crop that requires a sufficient supply of potassium (K) for optimal productivity and quality. K+-deficiency stress decreases tomato yield and quality. To further delve into the mechanism of the response to K+-deficiency and to screen out low-K+ tolerant genes in tomatoes, BGISEQ-500-based RNA sequencing was performed using two tomato genotypes (low-K+ tolerant JZ34 and low-K+ sensitive JZ18). We identified 1936 differentially expressed genes (DEGs) in JZ18 and JZ34 at 12 and 24 h after K+-deficiency treatment. According to the Gene Ontology (GO) and Kyoto Encyclopaedia of Genes and Genomes (KEGG) pathway analyses, the DEGs that changed significantly primarily included transcription factors, transporters, kinases, oxidative stress proteins, and hormone signaling-and glycometabolism-related genes. The experimental results confirmed the induced expression of the responsive genes in the low-K+ signaling pathway. The largest group of DEGs comprised up to 110 oxidative stress-related genes. In total, 19 ethylene response factors (ERFs) demonstrated differential expression between JZ18 and JZ34 in response to K+-deficiency. Furthermore, we confirmed 20 DEGs closely related to K+-deficiency stress by quantitative RT-PCR (qRT-PCR), some of which affected the root configuration, these DEGs could be further studied for use as molecular targets to explore novel approaches, and to acquire more effective K acquisition efficiencies for tomatoes. A hypothesis involving possible cross-talk between phytohormone signaling cues and reactive oxygen species (ROS) leading to root growth in JZ34 is proposed. The results provide a comprehensive foundation for the molecular mechanisms involved in the response of tomatoes to low K+ stress.
1. Introduction
K+ is required in most plants as a cationic mineral nutrient [1,2]. This element is essential for many physiological processes, including photosynthesis, enzyme activation, protein synthesis, osmoregulation, cell turgor, and ion homeostasis in plant cells [3]. Plant growth requires K+, but most plants can absorb only a minimal amount of soluble K+ from the soil [4]. K+-deficiency can directly disturb physiological activities and restrict assimilation and partitioning into fruits from the nutrient source, resulting in decreased crop growth, and fruit production and yield [5]. Increasing the utilization of the K+ nutrient or the resistance of the crop itself to K+ deficiency is the major method that can solve the K+-deficiency problem. However, the molecular mechanisms responsible for these differences are not clear.
K+ is primarily absorbed by plant roots and is transported to the root surface from the soil [6]. Root characteristics are the most important factors determining K+ uptake; for instance, in cotton, the tap root length and lateral root (LR) numbers were significantly higher in high-efficiency genotypes than in low-efficiency genotypes [7]. Rice crops maintain K+ uptake by modifying their root hair length under K+-deficient conditions [8]. An excellent root system is the basis for absorbing more nutrients, but whether the lack of K+ in tomatoes induces the expression of related genes and thus promotes root structure changes to adapt to K+ deficiency, is unclear. Changes in root architecture represent an adaptation of the external shape of the plant in response to nutrient deficiency. In addition, plants in poor nutrient conditions will alter the expression of many related genes to adapt to the adverse environment. K+ transporters (high affinity) and K+ channels (low affinity) transport K+ from the soil to plant cells [9]. In the tomato, 19 K+ channels and transporters have been identified [10]. High-affinity K+ transporters play very important roles under K+-deficient conditions. Different genotypes express various high-affinity K+ transporters with diverse K+ uptake efficiencies [11]. K+-deficiency stress can induce the production and alteration of many recognized signal substances, such as transcription factors, reactive oxygen species (ROS), plant hormones, kinases, and carbohydrates [12,13], and differences in the expression of these genes in different genotypes have great significance.
We previously identified the tomato cultivar JZ34 as a K+-efficient genotype, whereas cultivar JZ18 was sensitive to low K+, and was considered a K+-inefficient genotype. A more highly developed root system, and better K+ uptake ability were observed under K+-deficiency in JZ34 than in JZ18 [14]. Understanding how tomato plants regulate K+ transport systems via gene networks, to acclimate to K+-deficiency is valuable. Although some transcriptome studies of responses to K+-deficiency have been published in Arabidopsis, rice, tobacco, and other plants [15,16,17,18,19], no information on genome-wide transcription levels in tomatoes is available. Comparative transcriptome analysis of K+-efficient and K+-inefficient genotypes can more accurately identify key genes responsive to K+ deficiency. In the present study, an RNA-seq approach was applied to hydroponically grown JZ34 and JZ18 tomatoes after K+ deprivation for 12 and 24 h to explore differences in the early responses in the transcriptome profiles of K+-efficient and K+-inefficient genotypes. Temporal patterning expression and the regulation of genes by K+ deprivation was comprehensively characterized. This study is the first to present a global transcriptome analysis of two tomato genotypes, and to provide new insights into the molecular mechanisms underlying the tolerance of the K+-efficient genotype to K+-deficiency.
2. Results
2.1. Analysis of Root Systems in JZ34 and JZ18 under K+-Deficient Conditions
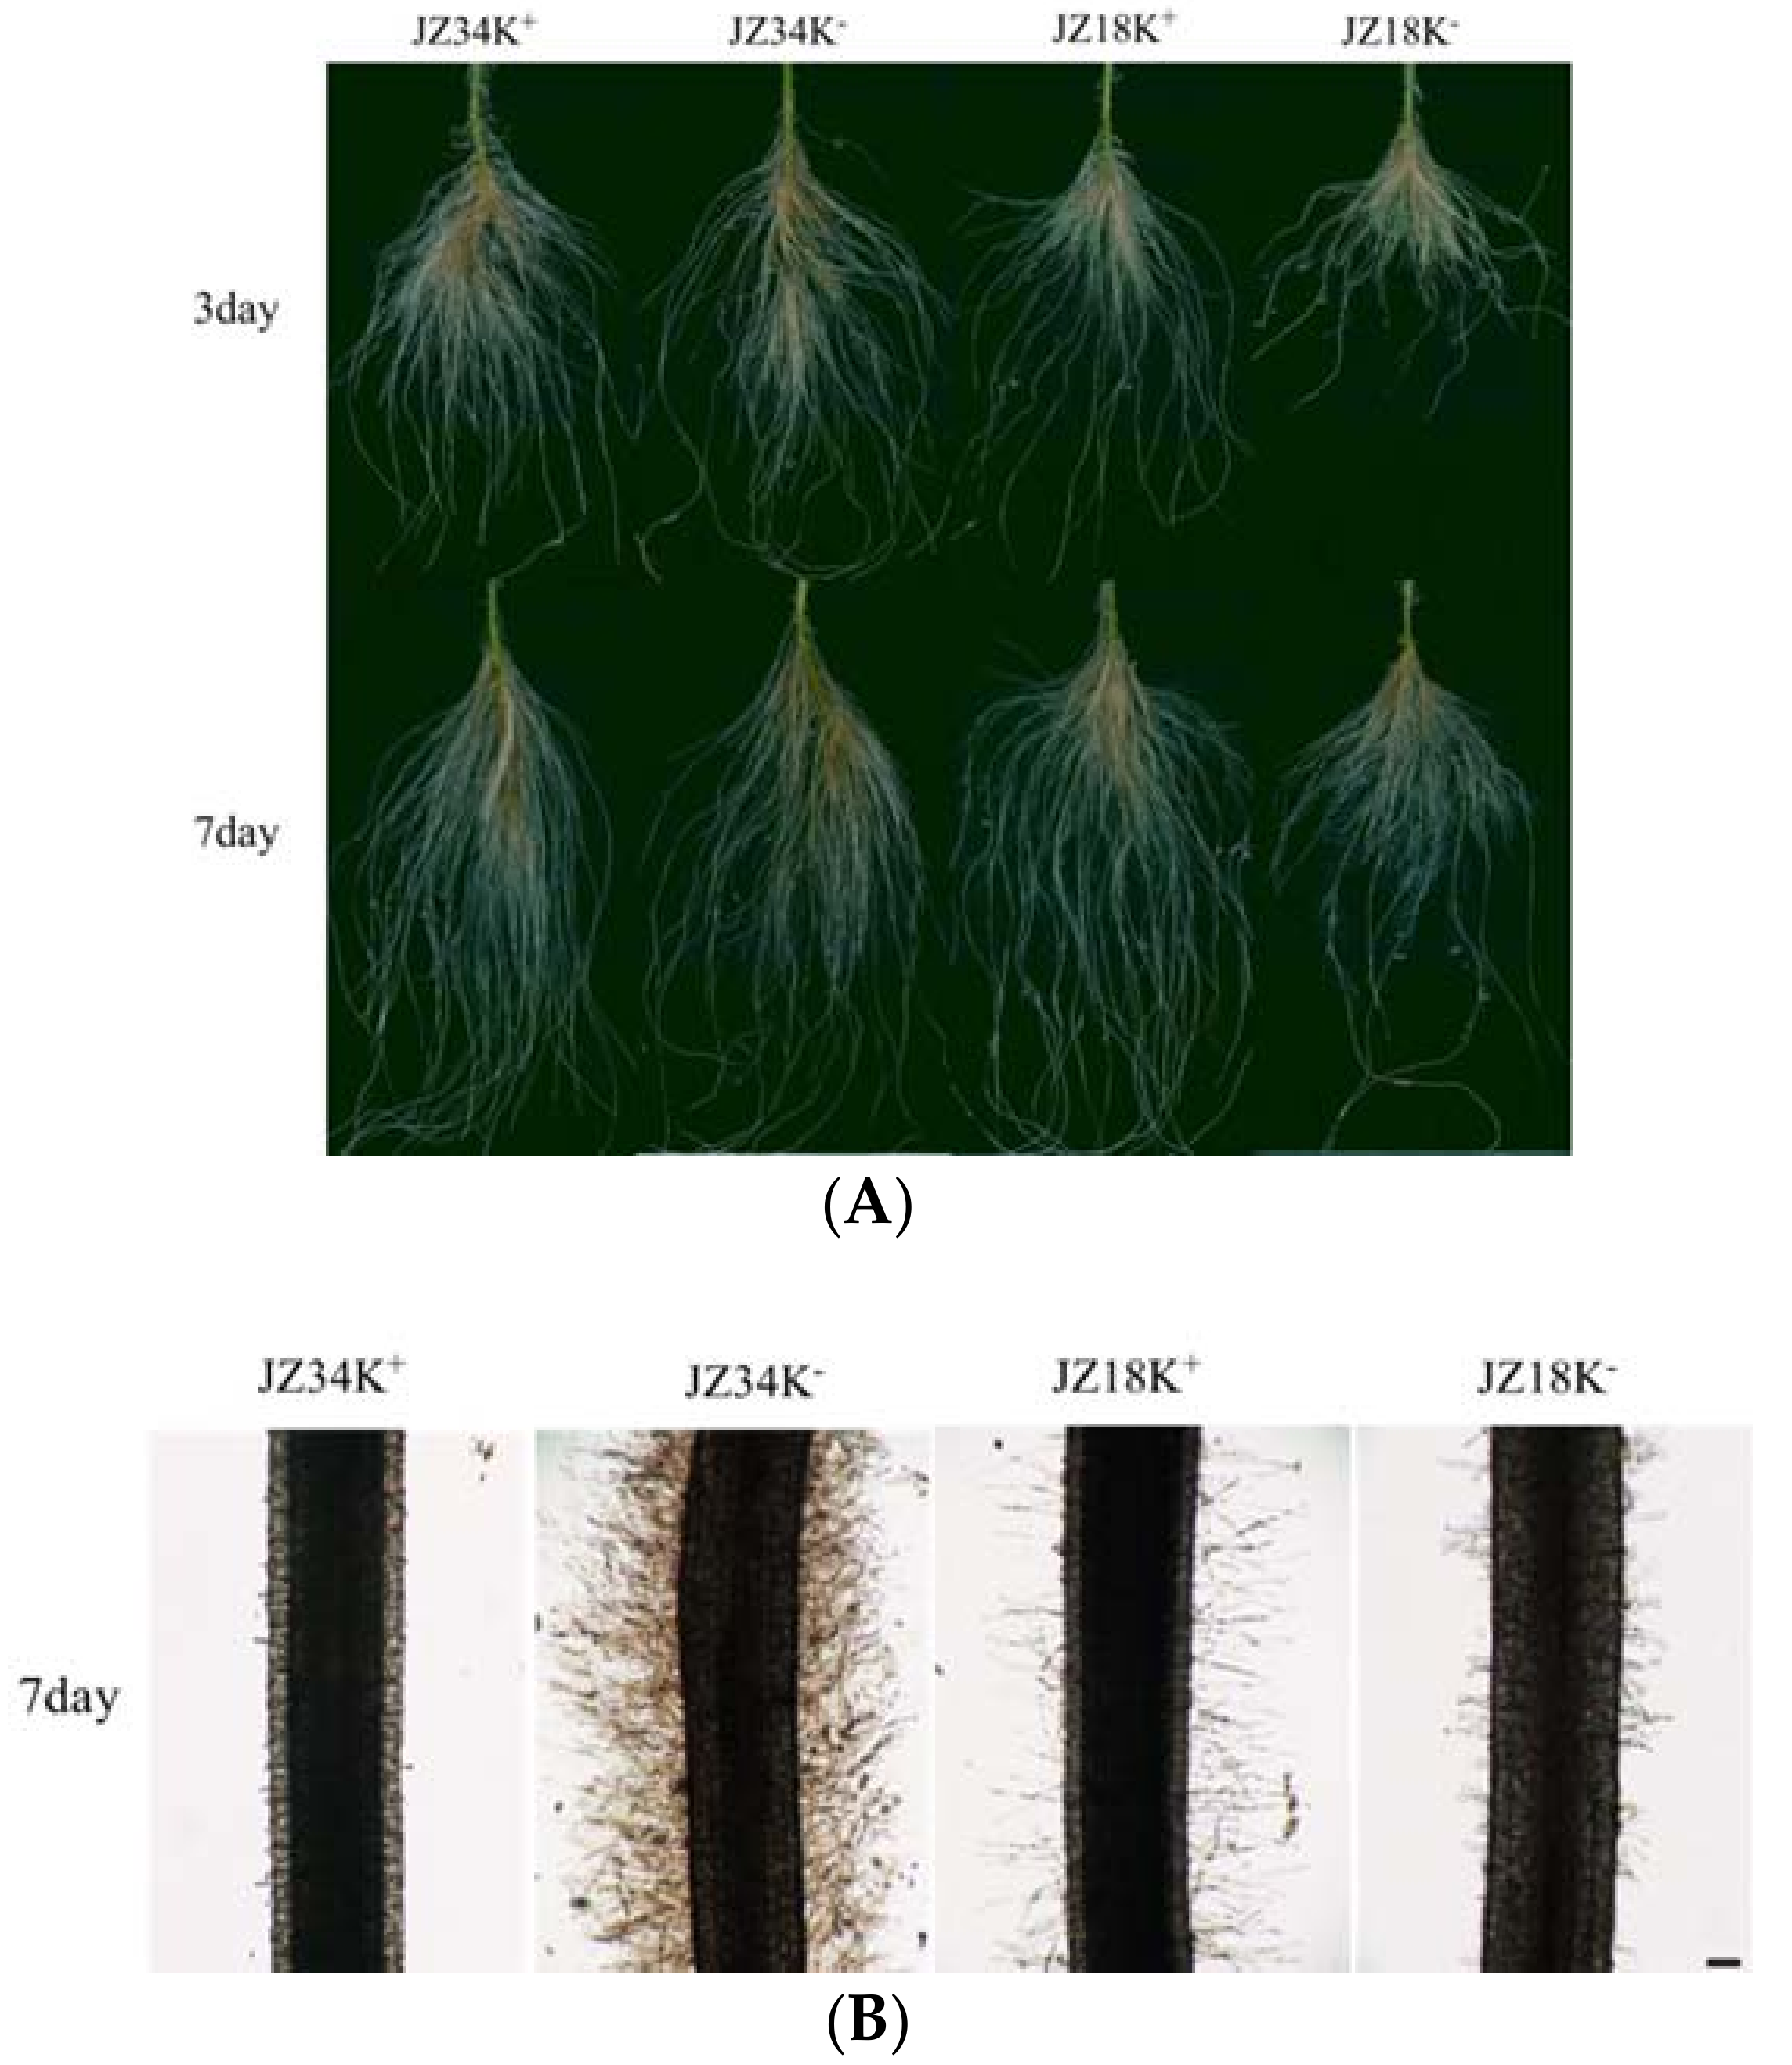
Two tomato genotypes (low-K+ tolerant JZ34 and low-K+ sensitive JZ18) were used to investigate different genotype responses to K+-deficiency that exhibited marked differences in sensitivity to K+-deficiency and root morphology. In JZ18, K+-deficiency stress reduced the total number of LRs and root hairs. In contrast, the numbers of LRs in JZ34 were similar under both low and normal K+ concentrations, and more root hairs were found at the low K+ concentration (0 mM) than at the normal K+ concentration (4 mM) (Figure 1). The morphological responses implied that JZ34 had a stronger nutritional uptake capability than did JZ18. The biomasses of these two tomato varieties under the K+-deficient (0.5 mM) condition changed differently in this experiment (Table 1). The relative coefficients of the dry and fresh weight were 1.03 and 1.07 in JZ34, and 0.96 and 0.71 in JZ18, respectively.
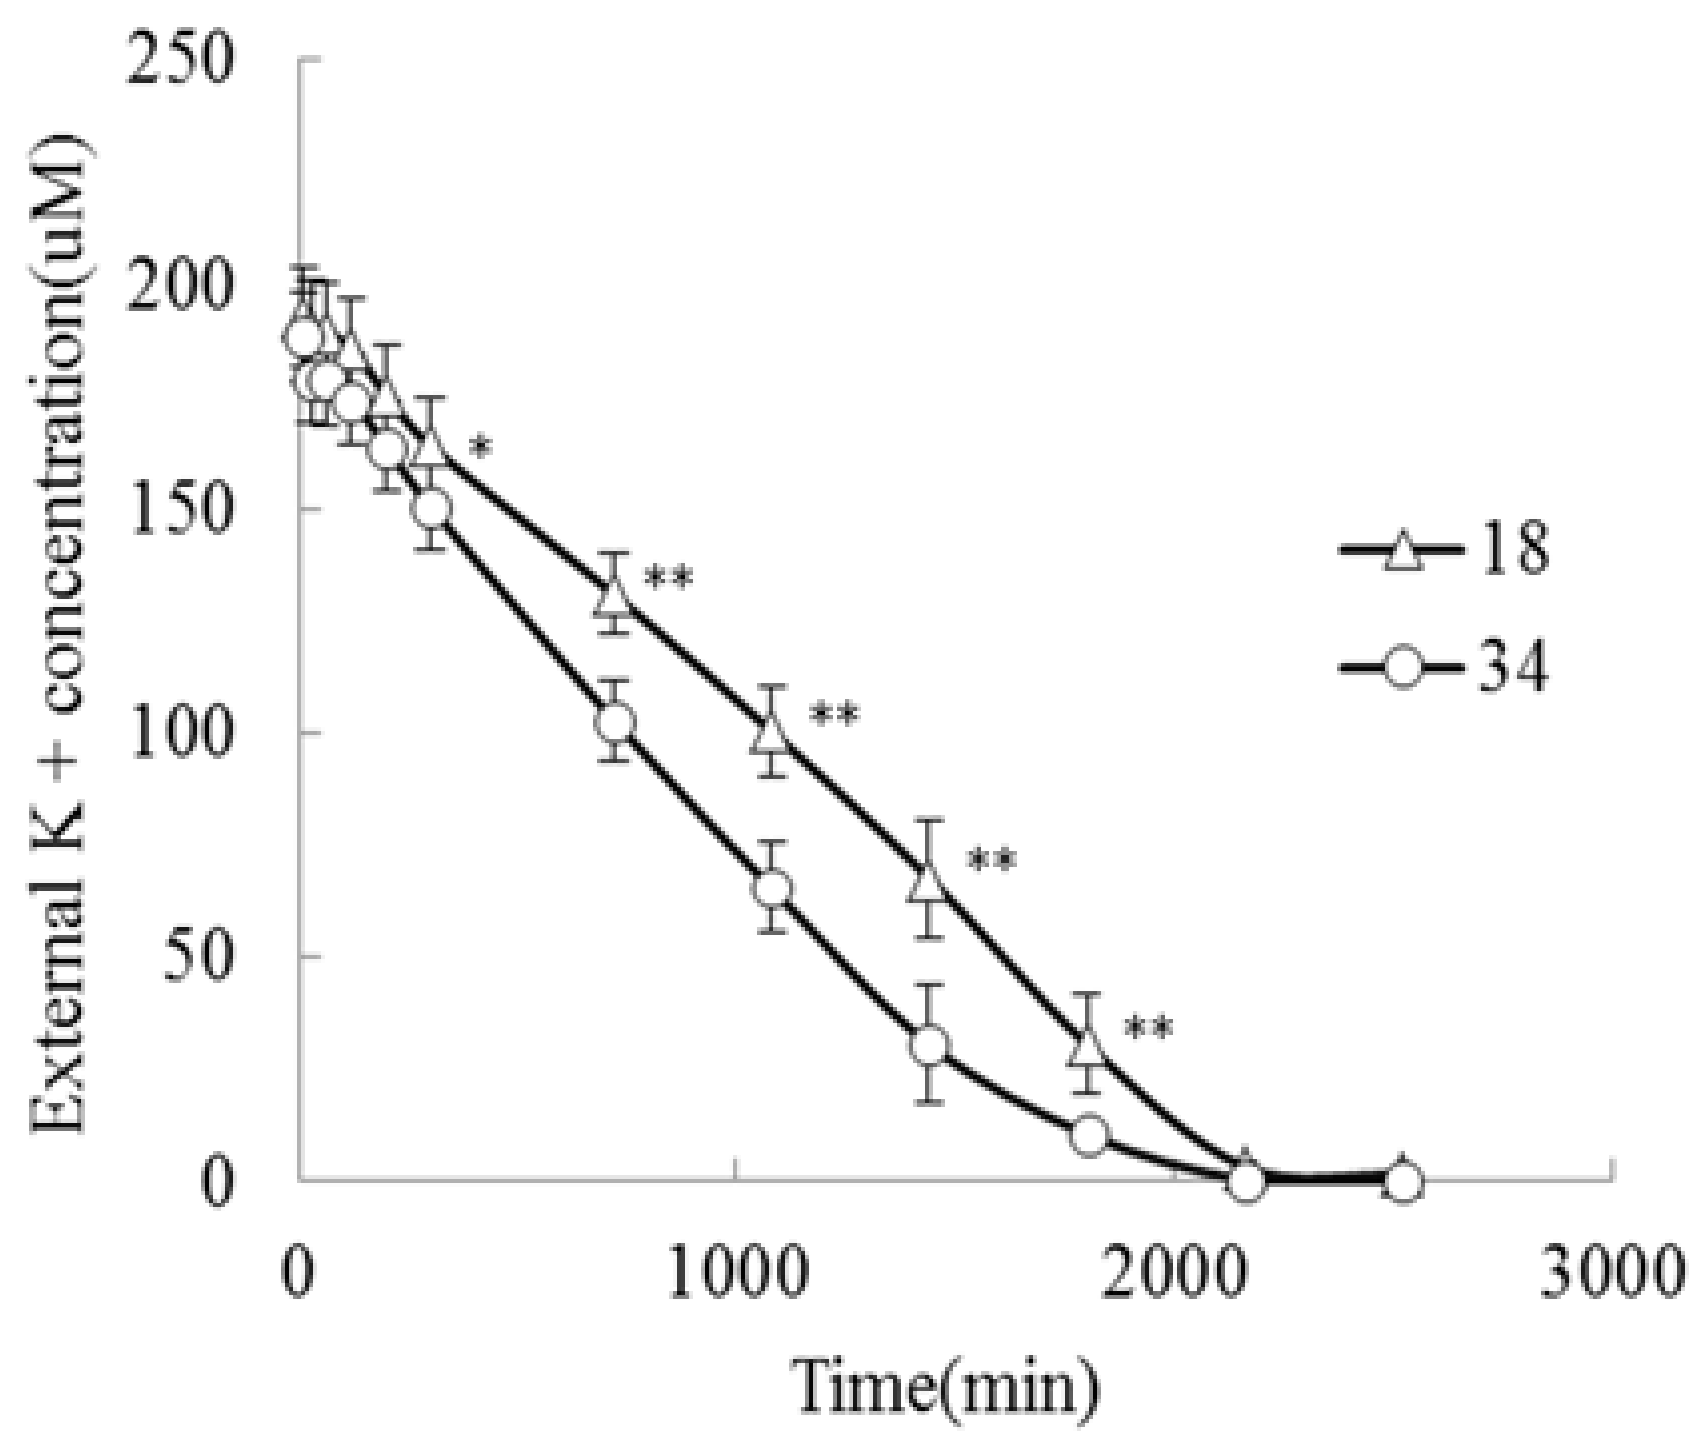
K+ can increase crop yields and improve crop quality. The K+ concentrations in the K+-deprived seedlings of both genotypes declined after 7 d under K+-deficiency treatment. Nevertheless, JZ34 maintained a higher K+ content under K+-deficiency stress, indicating that this cultivar was better at maintaining a high K+ concentration under K+-deficiency than was JZ18. The K+ content of JZ34 declined slightly under these conditions, with a relative coefficient of 0.89. However, the K+ content in JZ18 dropped significantly, with a relative coefficient of 0.57. K+ accumulation still trended similarly. To determine the K+ uptake ability of both genotypes, K+ was depleted in the uptake solution, which reflected its net uptake by the roots monitored over 30 h. External K+ was depleted to a greater extent by JZ34 than by JZ18 (Figure 2). We determined the maximum ion absorption rate (Imax) and Michaelis-Menten constant (Km) in the presence of 0.2 mM external K+. These two parameters quantitatively described the ability of the plants to absorb nutrient ions (JZ34: Imax = 0.10 mmol·g−1·min−1; Km = 0.107 mmol/L; JZ18: Imax = 0.06 mmol·g−1·min−1; Km = 0.125 mmol/L). The K+-uptake ability of JZ34 was better than that of JZ18 [20].
2.2. Overview of the Gene Expression Profile Sequence Data and Mapping Results
To obtain a global overview of the transcriptome relevant to different K+-deficiency stress conditions in the tomato, we separately sequenced complementary DNA (cDNA) libraries from root samples of JZ34 and JZ18 at different time points under K+-deficiency (0.5 mM) using the BGISEQ-500 platform. After the removal of low-quality reads, an average of 2.4 × 10⁷ clean reads was obtained for each sample, and the total length of the clean reads reached 1.2 × 10⁹ nt. For each sample, 99% of the clean reads were mapped to the tomato reference transcriptome (Table 2).
The expression levels of the mapped genes were normalized using FPKM values. To confirm the quality of the RNA-seq results, we evaluated the expression of the 12 highest-ranking housekeeping control genes in tomatoes at both 12 and 24 h, including GAPDH, catalase, Cys protease, α-tubulin, ubiquitin, actin, DNAJ, and translation initiation factor 5A (Table 3). None of these reference genes were significantly differentially expressed in the JZ34 and JZ18 lines by pairwise comparison after the induction of K+ deficiency (Table 3), indicating that the obtained sequences and transcript levels were suitable for further transcriptome analysis.
To clarify the transcriptome results, we chose 20 genes for quantitative RT-PCR (qRT-PCR) analysis (Figure 3). The genes included those associated with K+ channels (Solyc01g010480.2.1, Solyc03g097930.2.1, Solyc07g014680.2.1, Solyc11g011500.1.1, and Solyc12g009540.1.1) (Figure 3A–E), transcription factors (Solyc03g005520.1.1, Solyc03g005500.1.1, Solyc02g094270.1.1, and Solyc03g082430.1.1), kinases (Solyc04g074000.2.1, Solyc04g074030.2.1, Solyc12g009780.1.1, and Solyc01g006390.2.1), hormones (Solyc10g017990.1.1), oxidative stress (Solyc07g052370.2.1, Solyc06g066230.2.1, Solyc07g056430.2.1, and Solyc07g056510.2.1), glycometabolism (Solyc03g097560.2.1 and Solyc08g066100.2.1) (Figure 3F–T). The gene function annotations are shown Table S1. The selection criteria for DEGs (F–T) were a difference in the expression levels between two genotypes that was greater than 5, and a number of DEGs in this group that was greater than 5. The resulting regulation model was consistent between the transcriptome and the qRT-PCR results (Figure 3), suggesting that our transcriptome analysis was reliable.
2.3. Global Analysis of DEGs
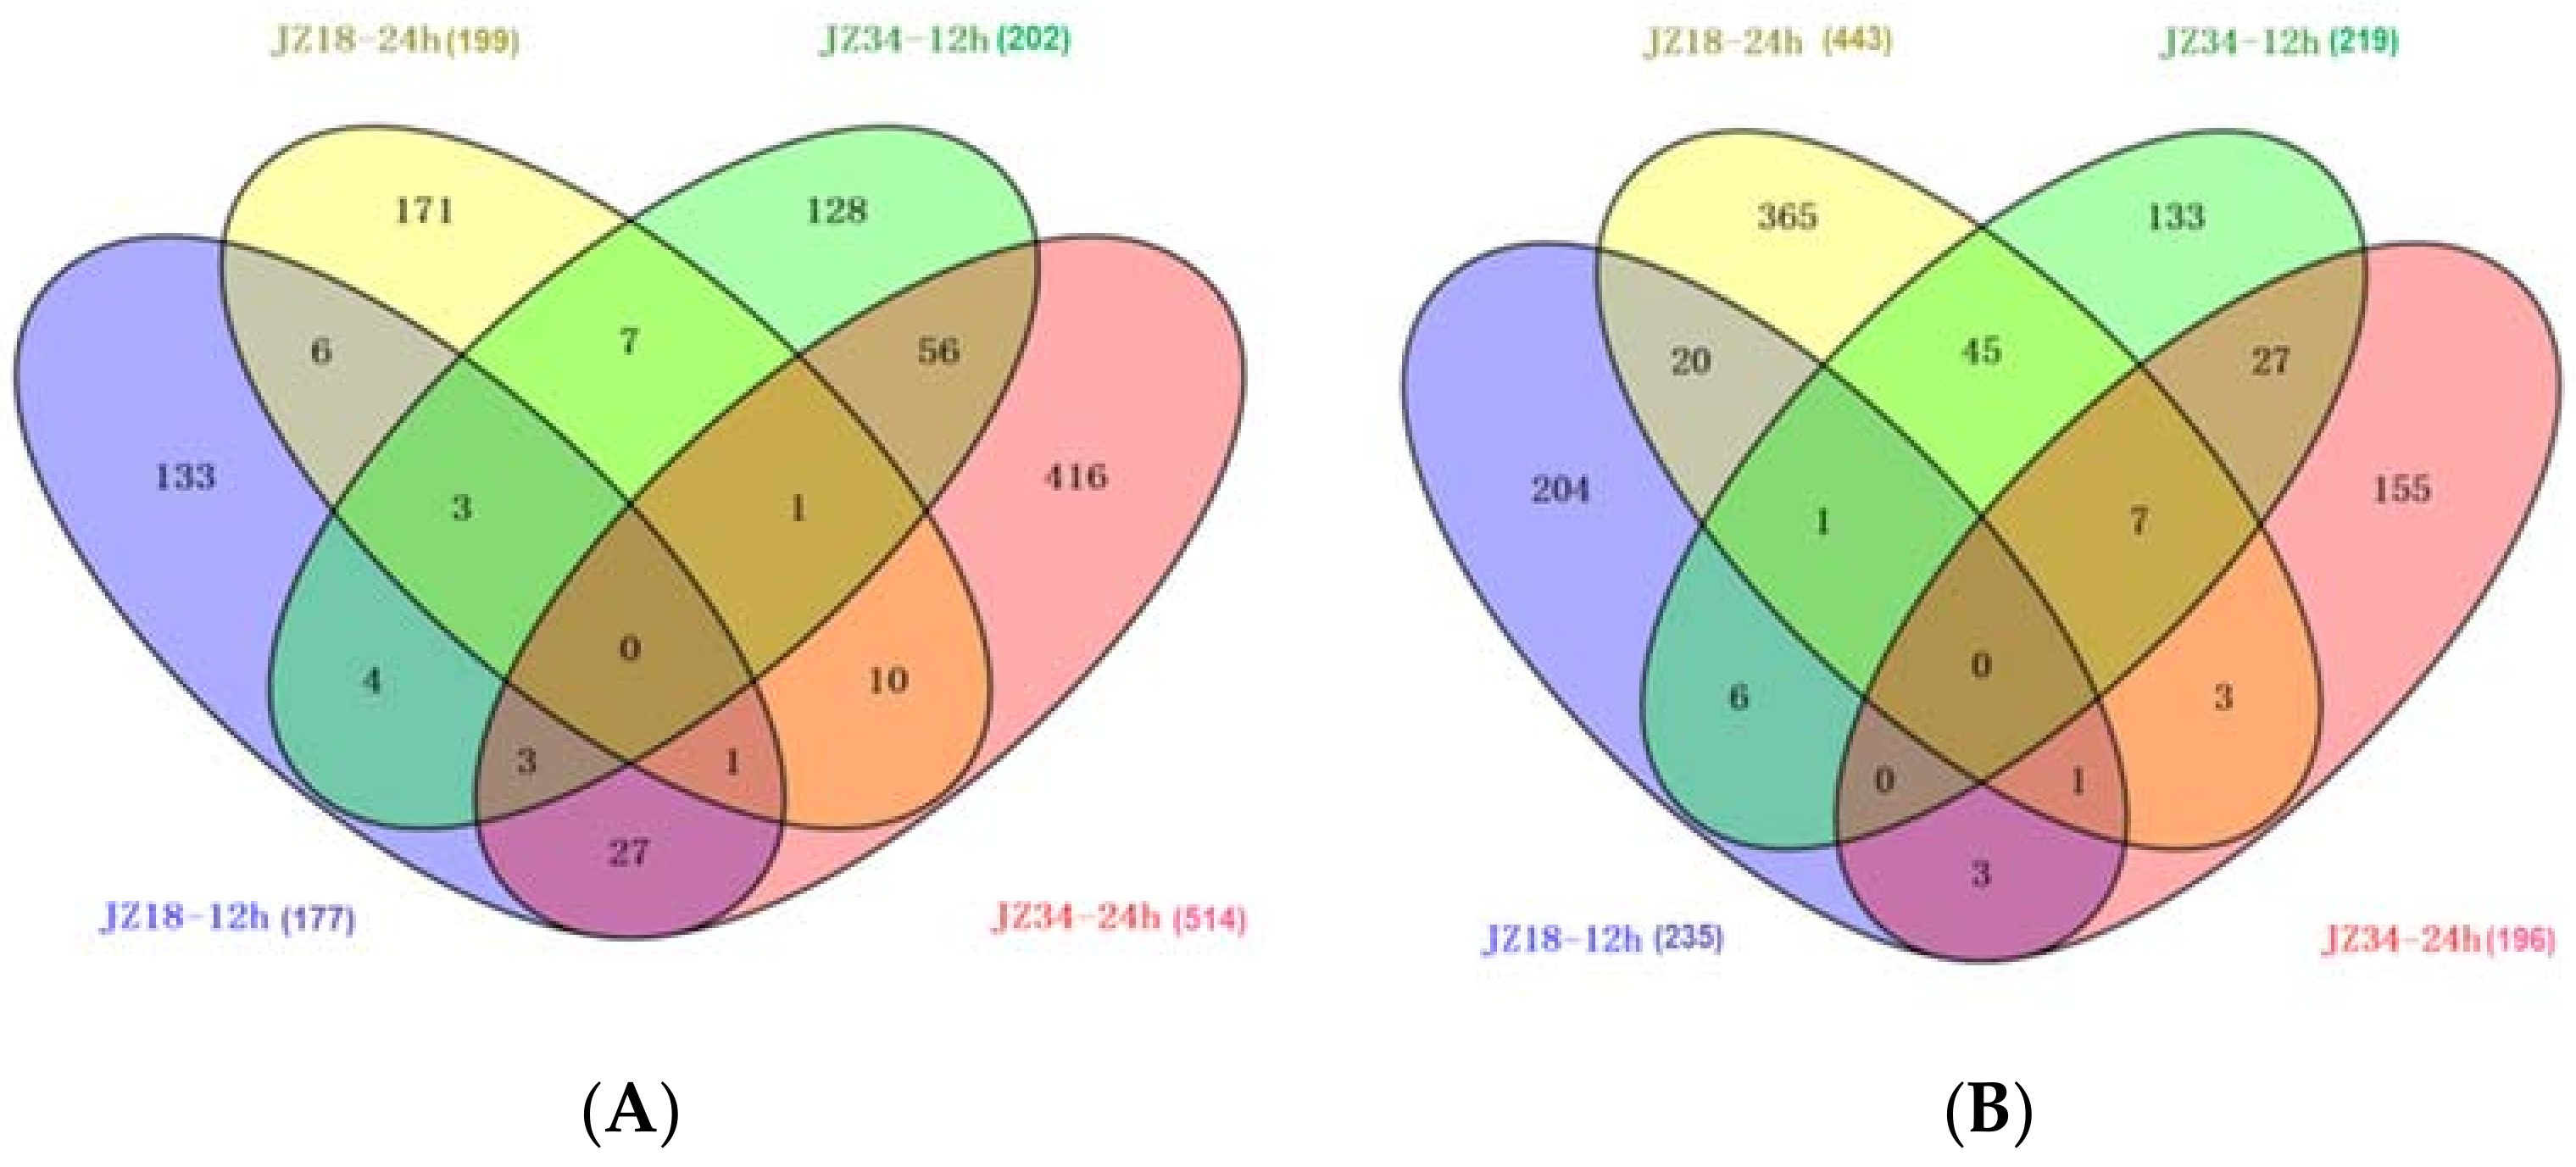
To investigate the molecular responses of the tomatoes under the K+-deficient condition, we identified up- and downregulated genes at 12 and 24 h post-treatment using the t-test (false discovery rate (FDR) ≤ 0.001) and an absolute value of log2 (fold change) ≥ 1 (treatment/control). We detected 1936 DEGs, including 966 upregulated and 970 downregulated genes. JZ34 had more upregulated genes than did JZ18, whereas JZ18 had more downregulated genes than did JZ34. The number of upregulated genes in JZ34 was almost twice as high as that in JZ18 (Figure 4). More DEGs were upregulated at 24 h than at 12 h. The gene expression patterns differed between JZ34 and JZ18.
2.4. TFs in the DEGs
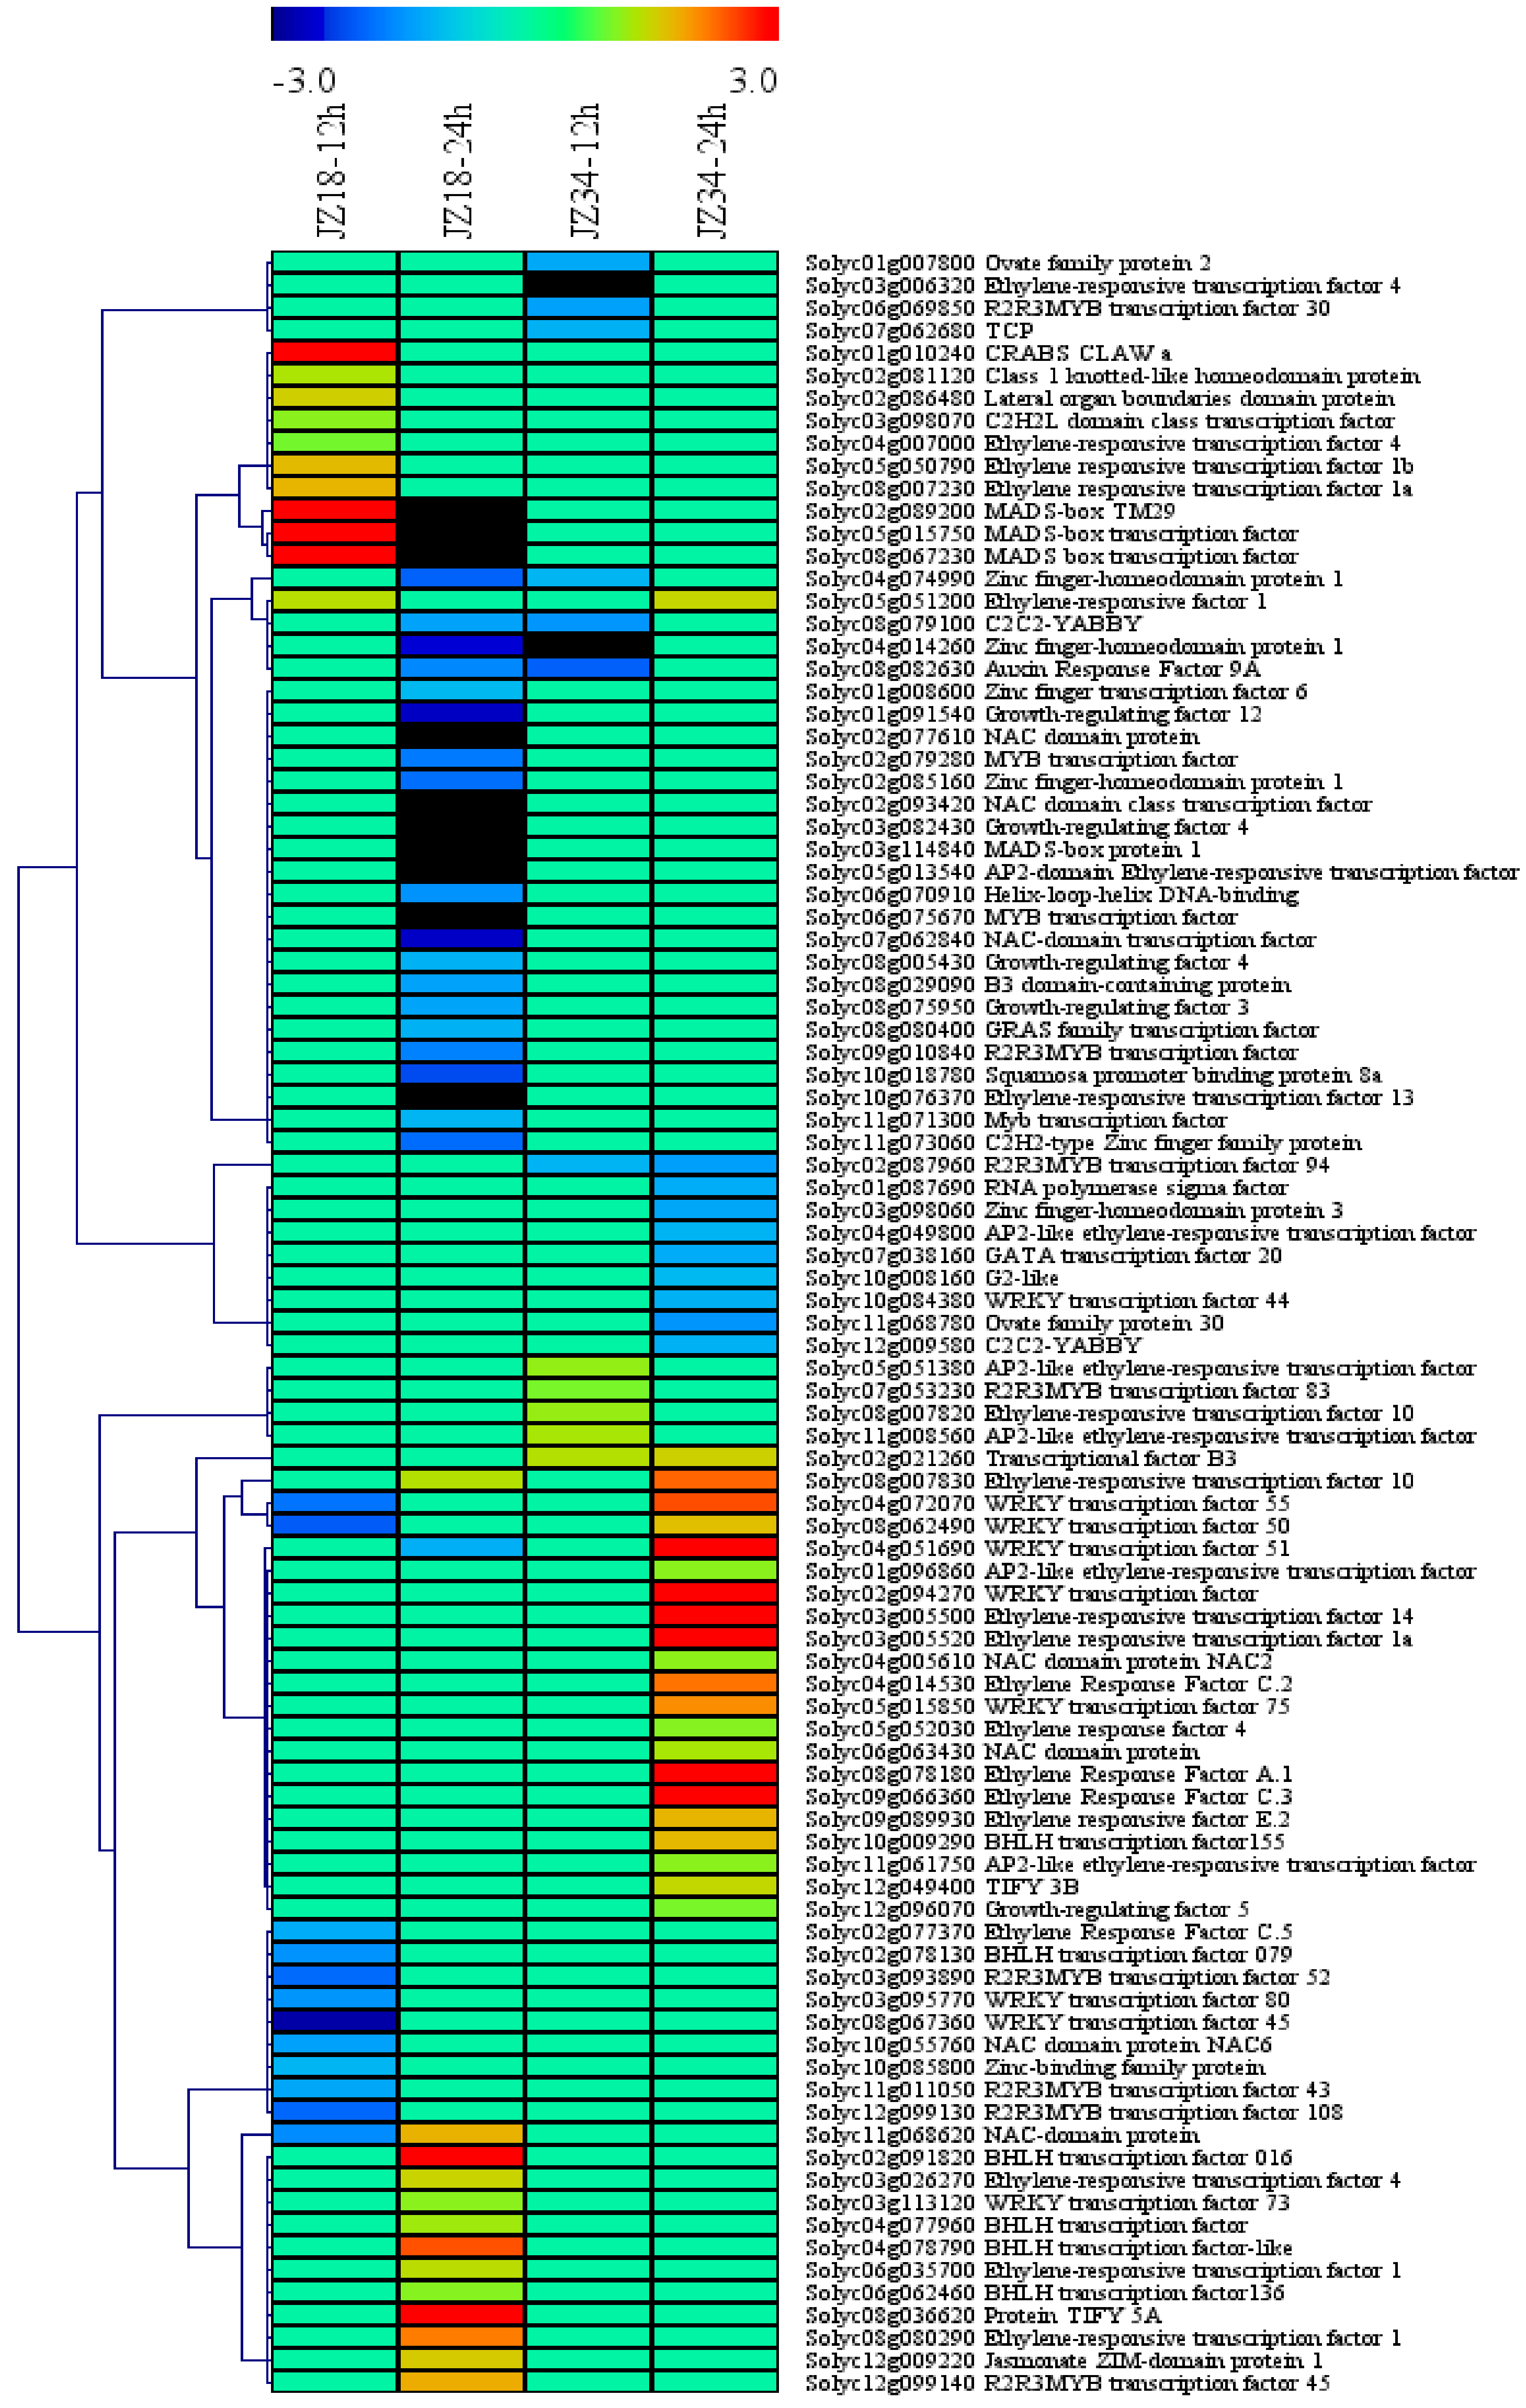
Transcription factors (TFs) are essential for the regulation of gene expression in response to stress in higher plants. In this study, 95 DEGs encoding TFs were identified. These TFs belonged to diverse families (Figure 5), including ERF (19), MYB (11), WRKY (9), zinc finger (7), NAC (7), bHLH (6), GRF (5), MADS-box (4), AP2-EREBP (6), TIFY (2), OFP (2), C2C2-YABBY (2), ARF (1), B3 domain-containing protein (1), CRABS CLAW (1), G2-like (1), GATA (1), GRAS (1), C2H2L (1), class 1 knotted-like homeodomain protein (1), helix-loop-helix DNA-binding protein (1), jasmonate ZIM-domain protein 1 (1), lateral organ boundaries domain protein (1), RNA polymerase sigma factor (1), squamosal promoter binding protein (1), transcriptional factor B3 (1) and TCP(1). Among all of the TFs, the number of DEGs in the ERF and MYB families was greater than 10, accounting for up to 20% and 11.5% of the total TFs, respectively. All the TFs could be clustered into four categories. The AP2, NAC, WRKY and GRF genes were almost all downregulated in JZ18 and upregulated in JZ34. MYB, zinc finger, OFP and C2C2-YABBY were all downregulated in both varieties, whereas ERF, TIFY and bHLH were all upregulated in both varieties. The MADS genes were upregulated at 12 h and downregulated at 24 h in JZ18 but were not differentially expressed in JZ34.
2.5. DEGs Encoding Transporters and Kinases
Five genes encoding K+ channels and ion transporters demonstrated significantly differential expression in this study, including three upregulated K+ channel genes (Solyc11g011500, Solyc03g097930, and Solyc01g010480) and two downregulated K+ transporter genes (Solyc12g009540 and Solyc07g014680). The expression of genes encoding nitrate and ammonium transporters changed greatly under K+-deficiency stress (Table 4). As the largest subfamily of receptor-like kinases (RLKs), leucine-rich repeat receptor-like kinases (LRR-RLKs) regulate the growth, development, and stress responses of plants. A total of 24 LRR-RLK DEGs were found, with 19 downregulated genes and two upregulated genes detected in JZ18. None downregulated genes and eight upregulated genes detected in JZ34. The overall expression trends of the LRR-RLKs in the two genotypes were opposite.
2.6. Differences in the Oxidative Stress, Hormone and Glycometabolism Analyses in JZ34JZ34 and JZ18 under K+ Deficiency
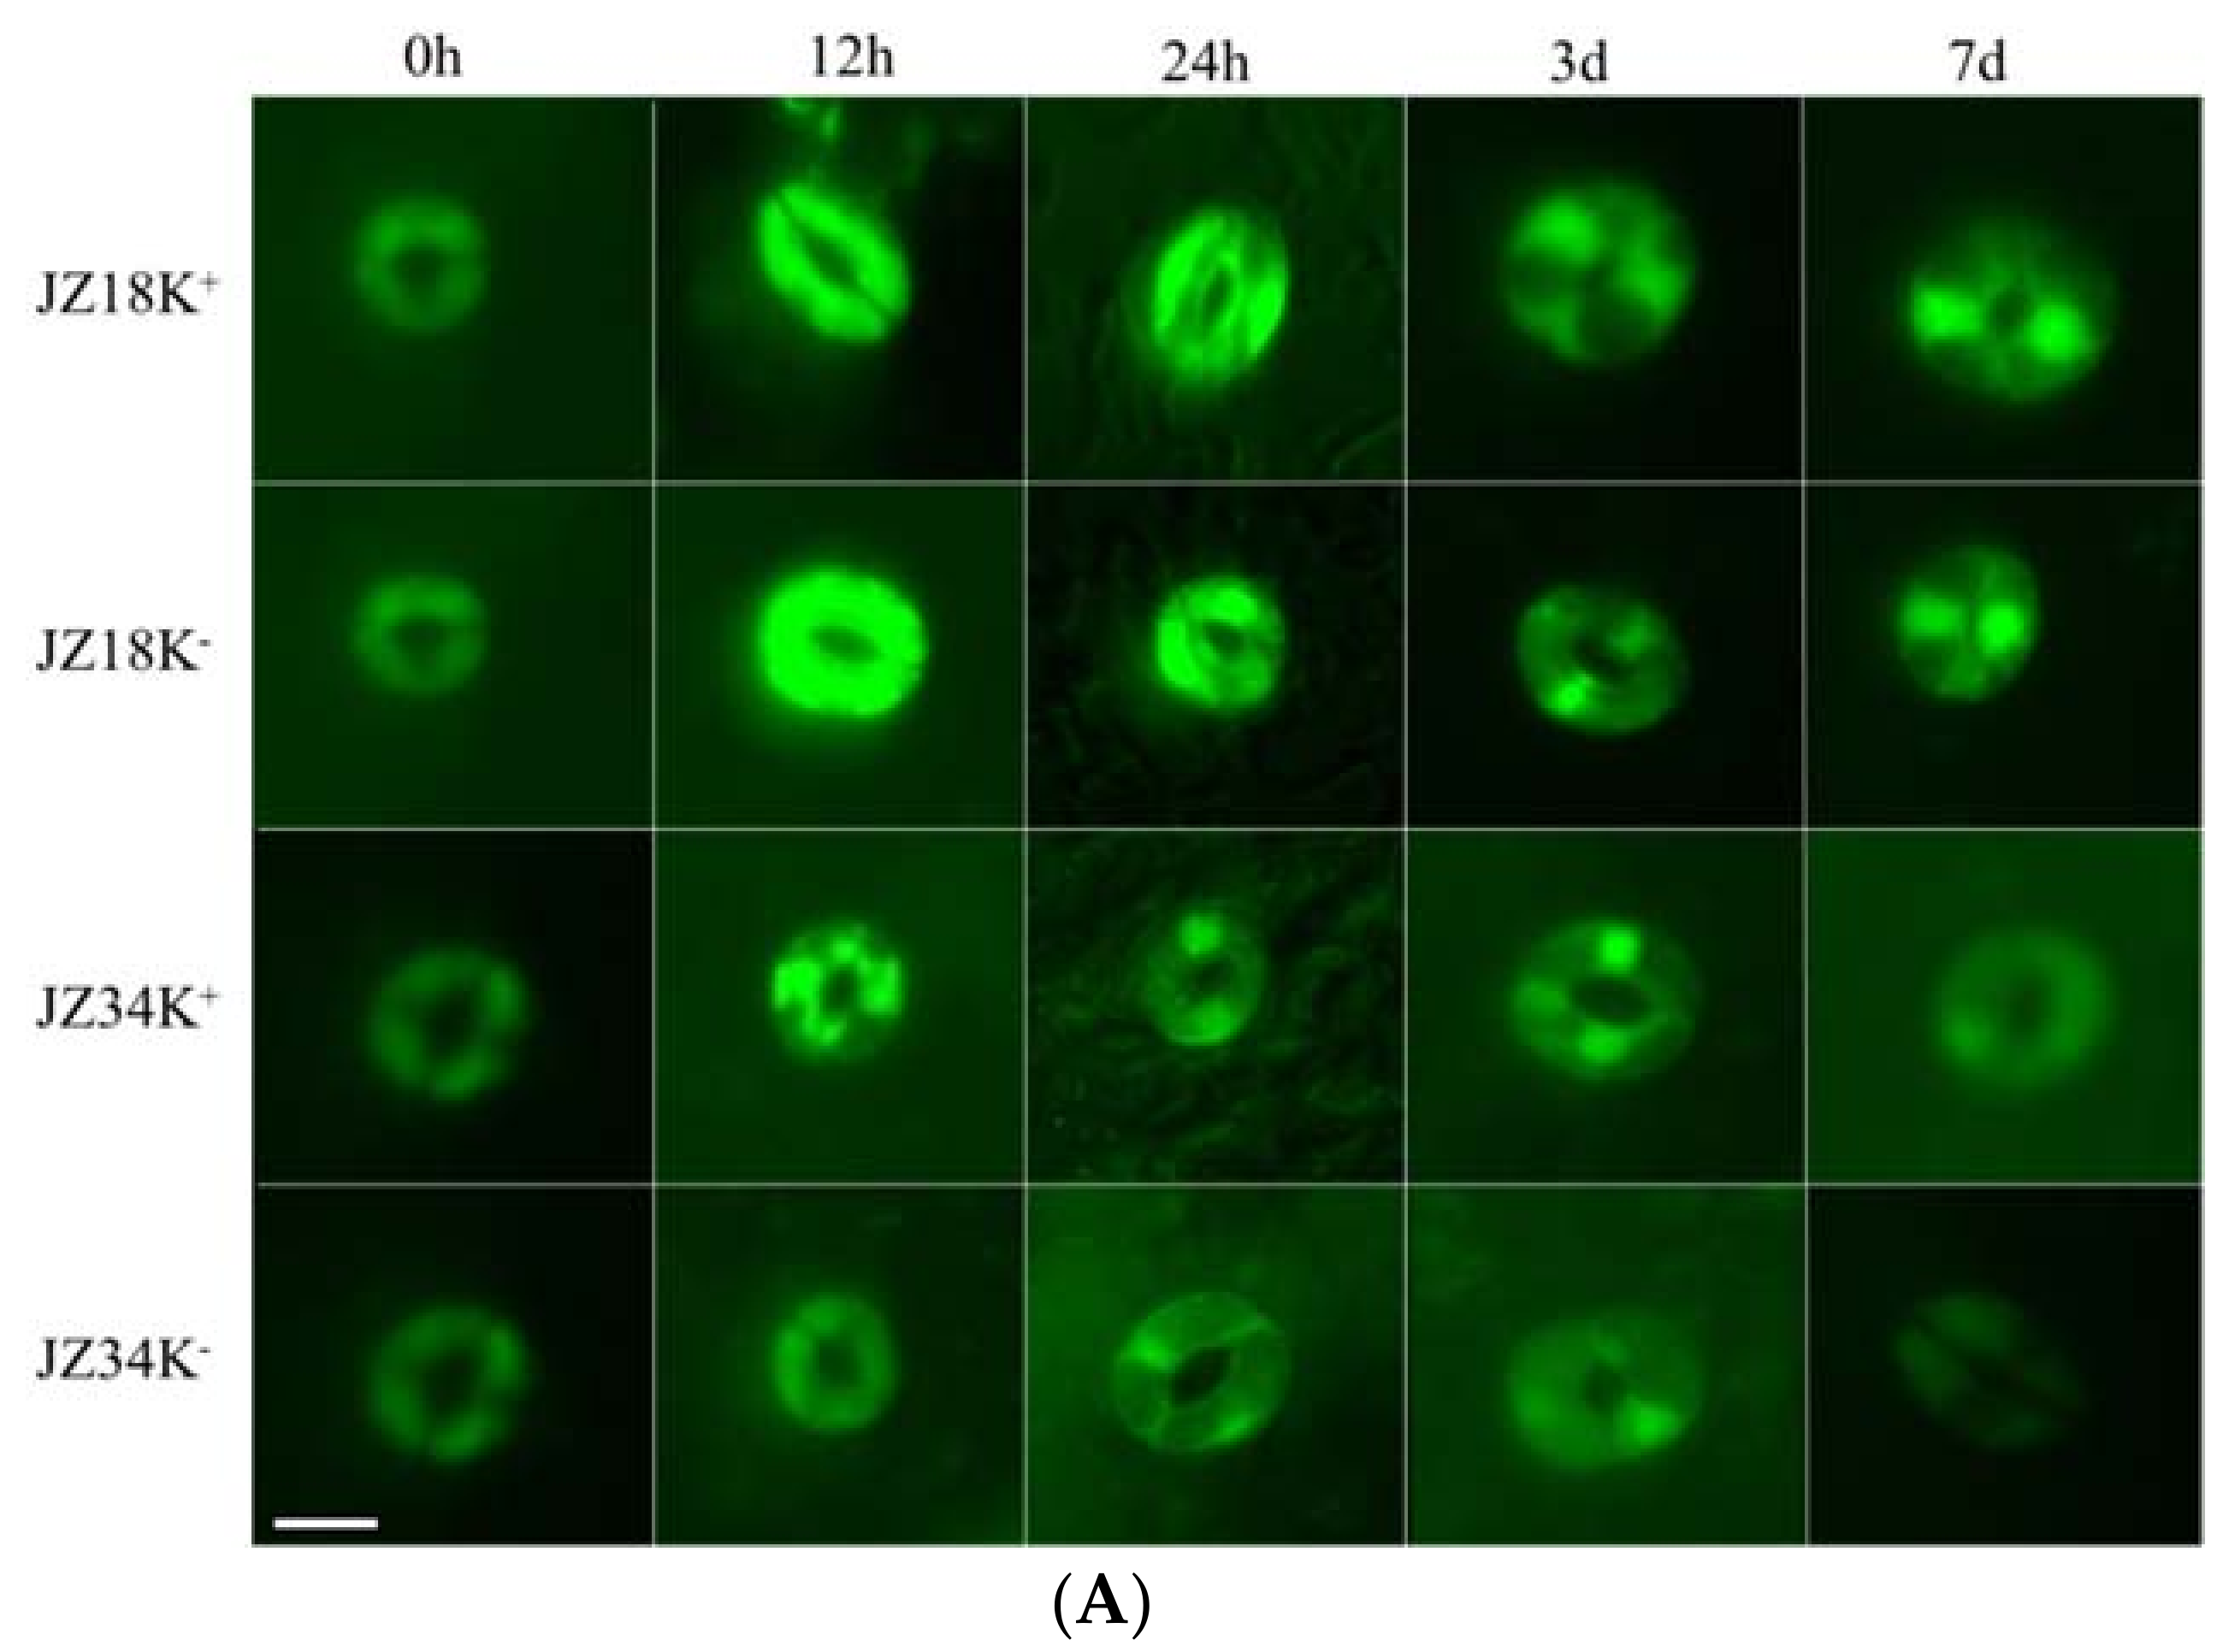
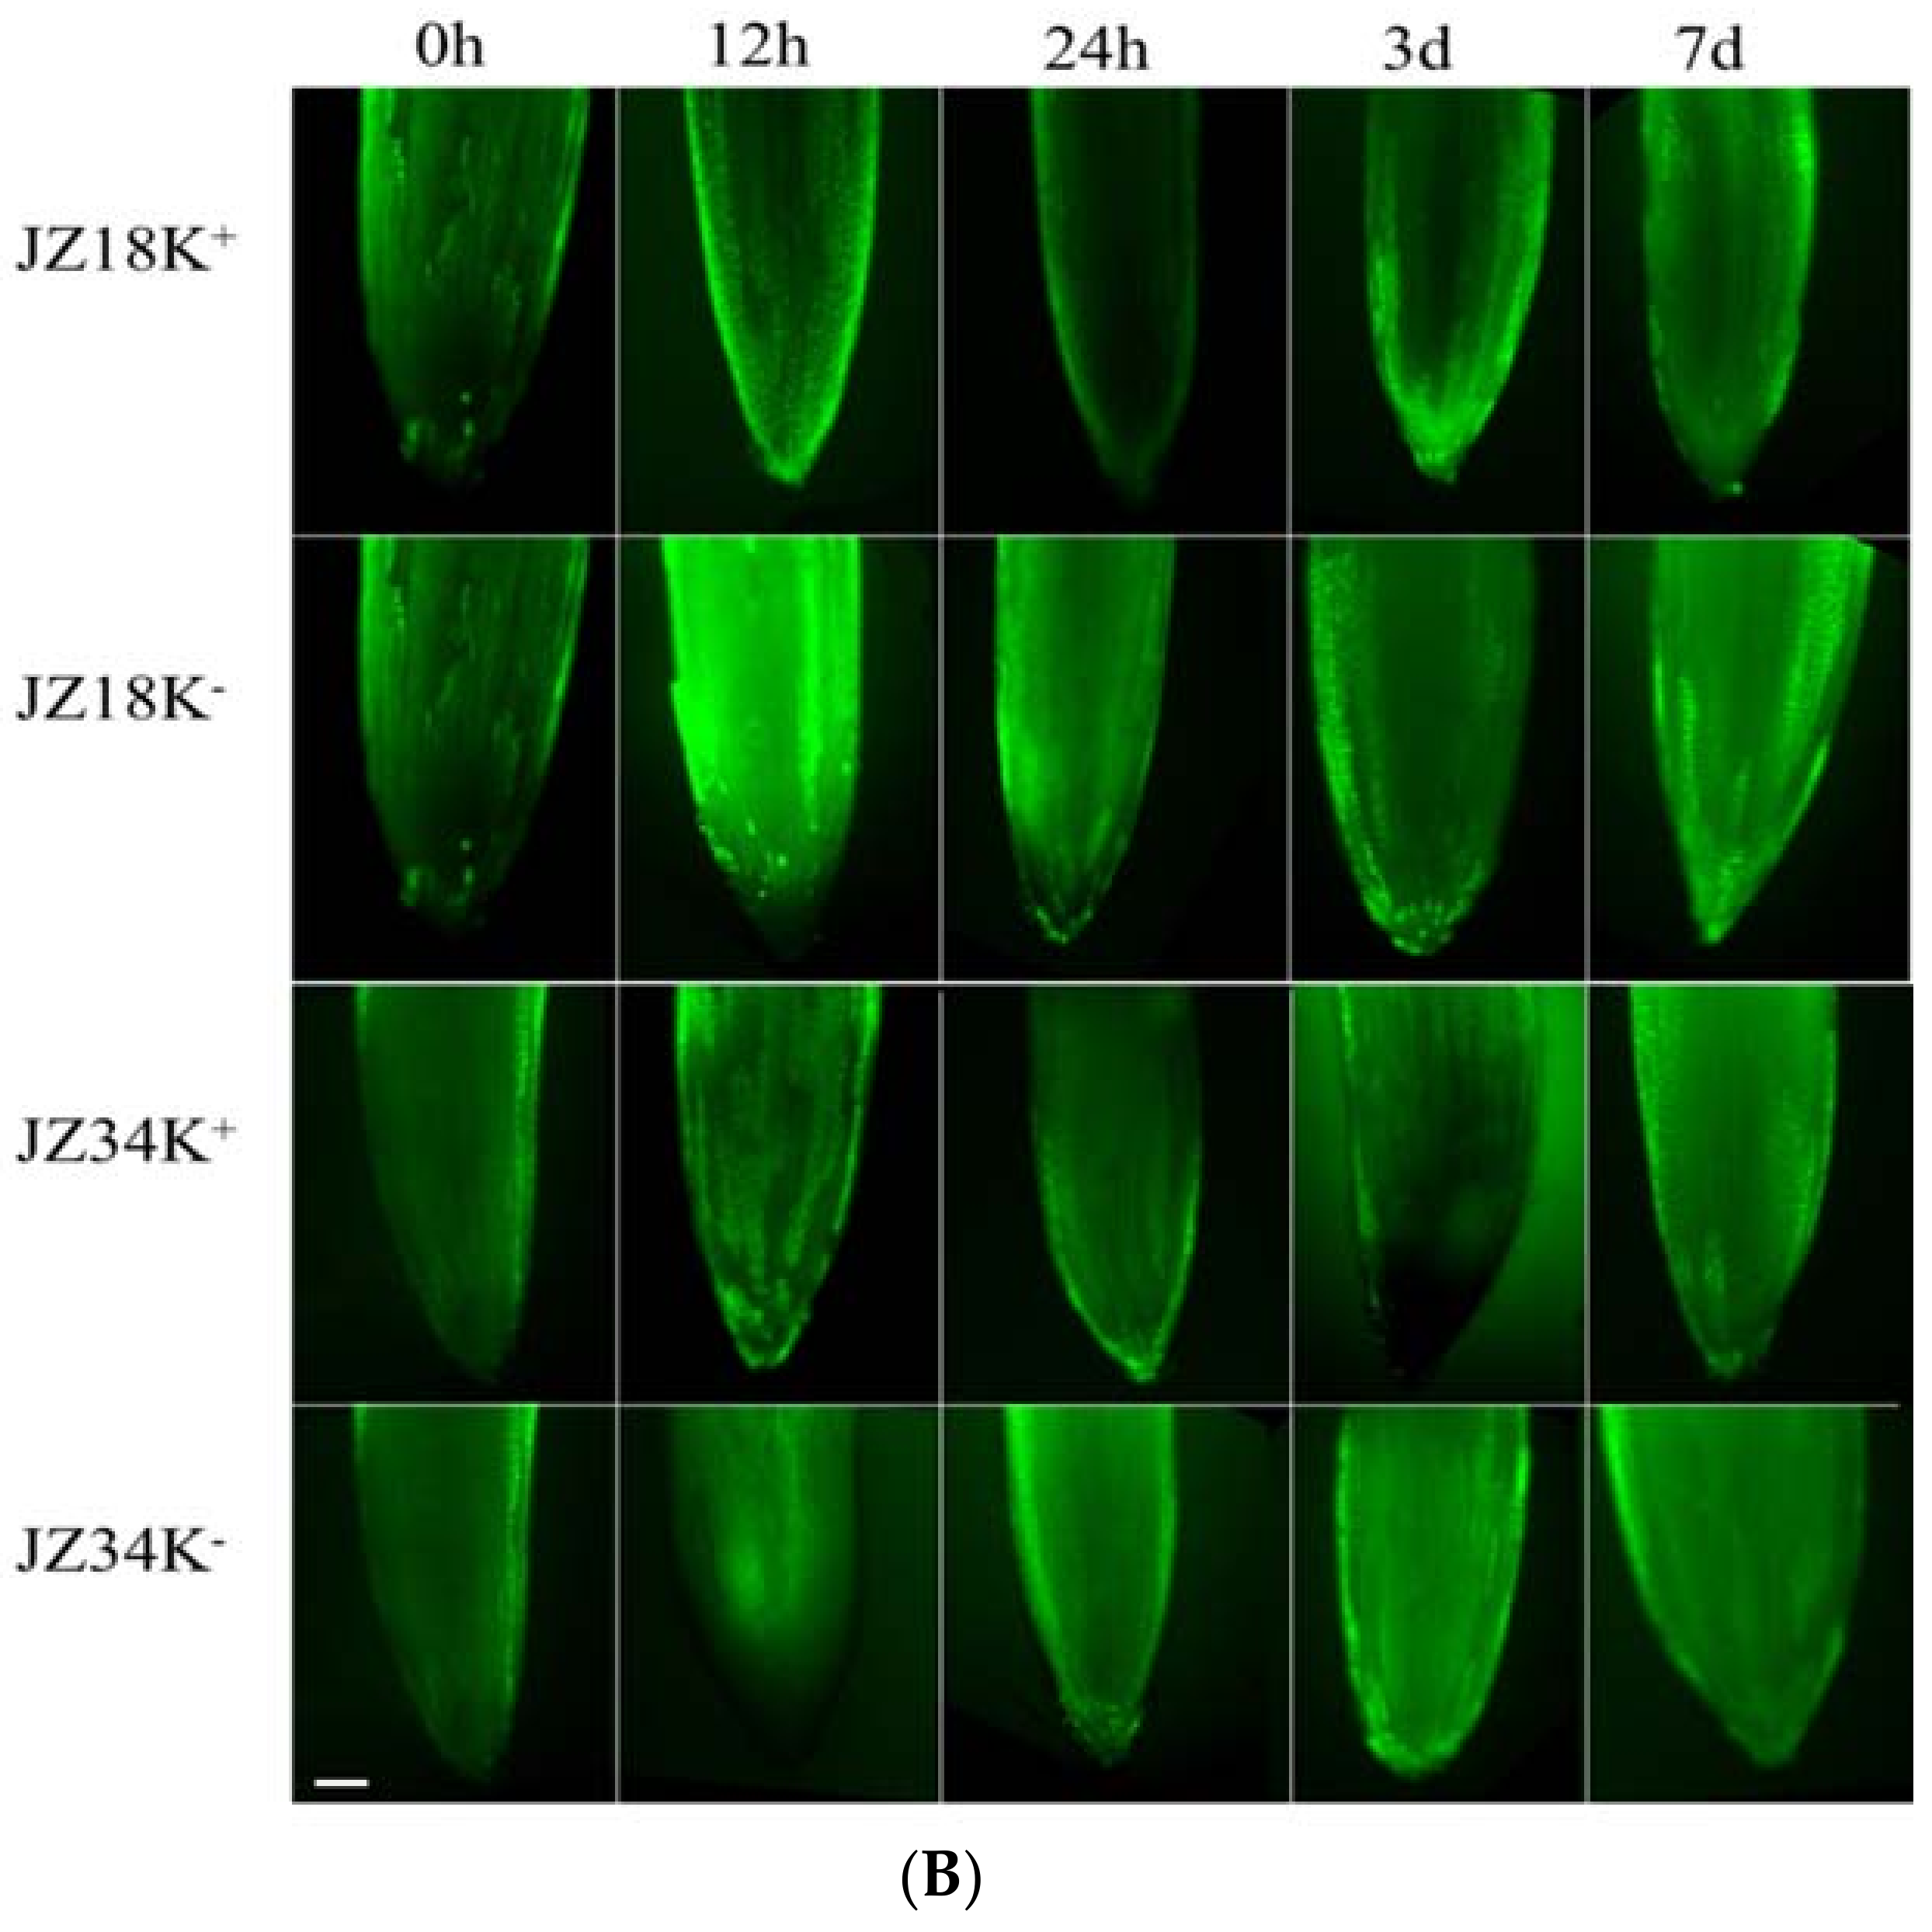
The number of DEGs associated with oxidative stress metabolism was highest among all categories analyzed in the present study (Table S2). Among these genes, 42 peroxidase, 44 cytochrome P450, and 24 glutathione S-transferase genes were identified, including 46 upregulated and 56 downregulated genes. Approximately eight times as many genes were downregulated as upregulated in JZ18, whereas six times as many genes were upregulated as were downregulated in JZ34. The fluorescence signal was particularly strong in the guard cells and roots of JZ18 (Figure 6). The determination of ROS concentrations in the plants revealed significant accumulation in the leaves and roots of JZ18 at 12 h and 24 h (Table 5). These results show that stronger ROS scavenging activity is induced by K+-deficiency stress in JZ34 than in JZ18.
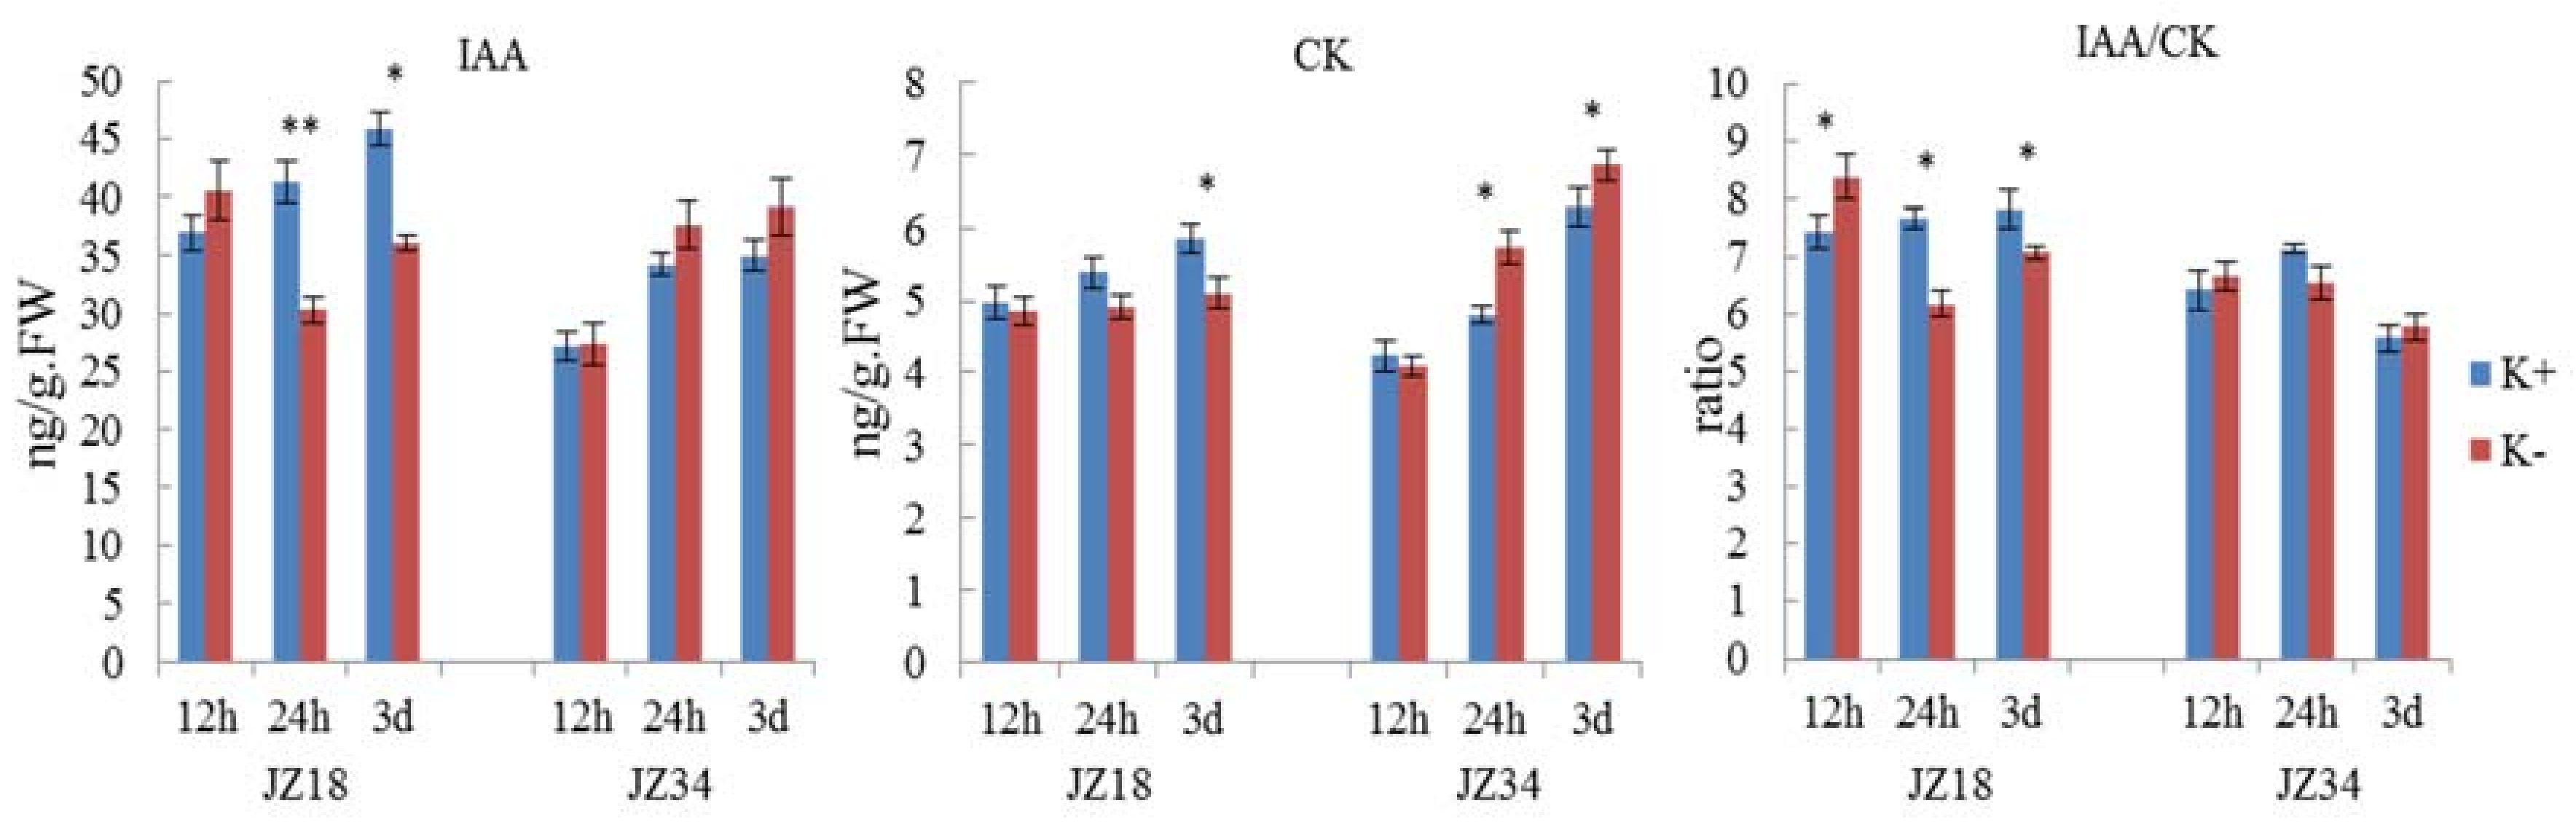
DEGs involved in hormone signaling were analyzed (Table 5), including auxin (5), gibberellin (12), cytokinin (8), ethylene (3), and salicylic acid (2). Genes encoding abscisic acid (ABA) -related genes were not found among the DEGs. Most DEGs were downregulated in JZ18 and upregulated in JZ34. The number of auxin, gibberellin, and cytokinin genes was greater than five (Table 6). Plant hormones are very closely related to plant morphogenesis. To better explore the effects of phytohormones on tomato resistance under K+-deficiency and the effects on root architecture, the IAA and CK contents were determined and used to calculate the IAA/CK ratio under K+-deficiency (0.5 mM) treatment in the root systems of the two genotypes (Figure 7). The IAA content in the roots of the two genotypes was higher after K+-deficiency treatment than in the control at 12 h. The content in JZ18 when the treatment was conducted for 24 h to 3 d was lower than that in the control group (Figure 7). At the same, the IAA content in JZ34 was higher than that in the control group. These results showed that the IAA contents in the roots of the two genotypes were differentially altered after K+-deficiency stress. The CK content in the roots of the two genotypes showed an almost opposite trend after K+-deficiency stress, with lower levels in JZ18 and higher levels in JZ34 compared with those in the control group, except at 12 h. Typically, the IAA/CK ratio is used to determine whether to promote bud growth or root growth. A lower ratio enables promotion of bud differentiation, whereas a higher ratio is more conducive for root formation.
The IAA/CK ratio was higher in the treatment group than in the control group at 12 h in both genotypes. With extended treatment, the ratio was lower in the treatment group than in the control group at 24 h, and the difference was significant in JZ18. At 3 d of treatment, JZ18 still showed a significantly lower ratio, whereas the JZ34 treatment group had a higher ratio than did the control group.
In this study, 14 DEGs were associated with glycometabolism and transport. These genes included members of the SWEET family, as well as a glucose transporter, sucrose phosphate synthase, and ATP-dependent 6-phosphofructokinase. Of these DEGs, 11 were upregulated, and two were downregulated in JZ34 (Table 7). Most of the genes related to glycometabolism were detected in JZ34, and almost all were upregulated. Although a few genes were detected in JZ18, most of these genes were downregulated.
2.7. DEGs Associated with Root Architecture
In the transcriptome analysis, five DEGs directly related to root architecture were found. All these DEGs were all upregulated in JZ34 at 24 h (Table S3), with Solyc08g066590 was upregulated (2.31-fold) to the highest level compared to the expression of the other four genes.
2.8. GO and KEGG Analyses of K+-Deficiency Stress Tolerance-Related DEGs
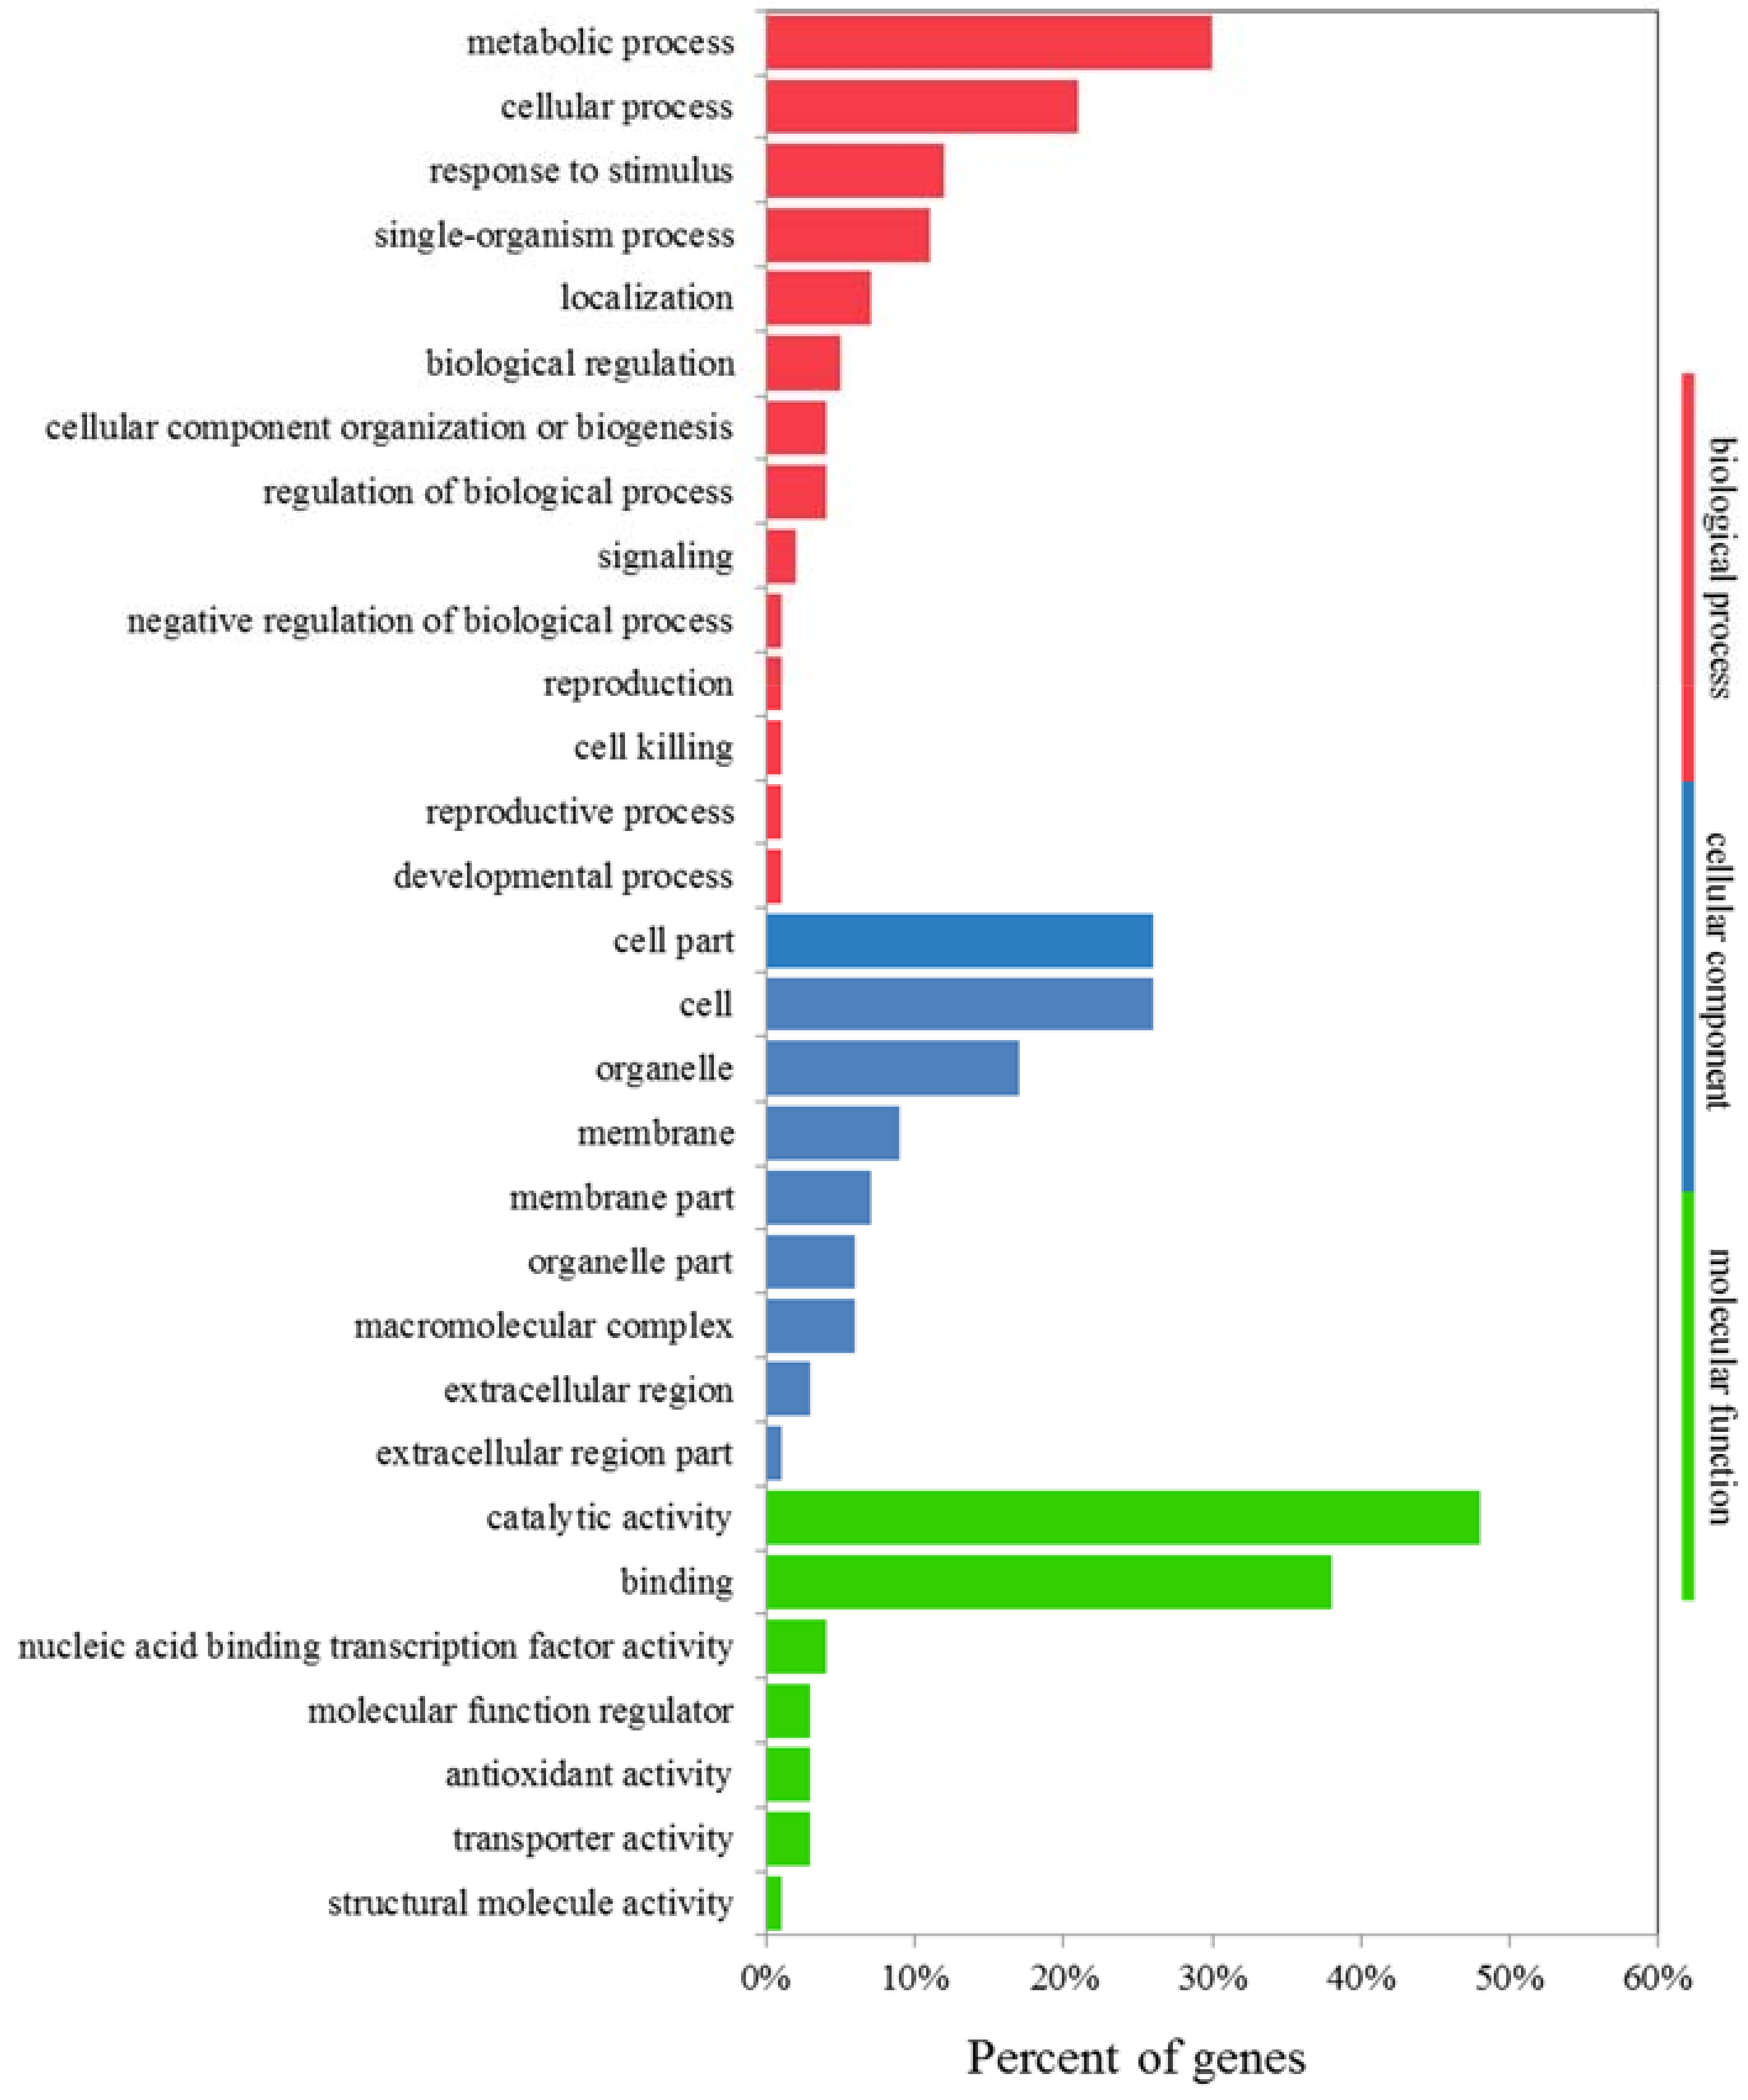
Expression analysis by GO enrichment was conducted to identify DEGs that were significantly upregulated in JZ34, but downregulated or unchanged in JZ18, and DEGs that barely changed in JZ34, but were downregulated in JZ18. A total of 1210 DEGs met the above criteria under K+-deficiency stress in the two varieties (Figure S2 and Table S4). A total of 551 DEGs was downregulated in JZ18 but unchanged in JZ34, whereas 517 DEGs were upregulated in JZ34 but unchanged in JZ18. Only 161 DEGs that were found in both genotypes were upregulated in JZ34 and downregulated in JZ18. More genes were differentially expressed at 24 h than at 12 h in the two accessions (Figure S2 and Table S4). The DEGs were divided into 36 functional groups. GO functional enrichment analysis showed that genes associated with binding (GO: 0005488) and catalytic activity (GO: 0003824) were significantly enriched, accounting for as much as 86% of the molecular function domain (Figure 8). The GO terms “metabolic process”, “cellular process”, “response to stimulus”, “single-organism process”, and “biological regulation” accounted for the majority of biological processes (Figure 8). The top two dominant terms in the cellular components were cell and cell part.
In total, 1210 DEGs encoding various enzymes were further matched with the enrichment of 117 KEGG pathways (Figure S3). The pathways with the greatest numbers of unique sequences were all metabolic pathways, including those related to secondary metabolites, amino acids, nucleotides, lipids, carbohydrates, energy, and other metabolism. The significantly enriched KEGG pathways are shown in Figure S3. The comparative transcriptome analysis of JZ34 and JZ18 under K+-deficiency stress laid a foundation for further elucidation of gene functions and the metabolic pathways in tomatoes.
3. Discussion
K+-deficiency stress in soil is quite common and becomes more severe during crop production [21]. Plants have evolved different strategies to cope with K+-deficiency. In the present study, a transcriptome analysis was performed 12 h and 24 h after K+-deficiency stress in two tomato genotypes. The early sequencing of adversity stress is more conducive to a comprehensive analysis of the differences in resistance caused by changes in the molecular mechanisms within the two genotypes. At the same time, we observed apparent differences in the root systems of the two genotypes after K+-deficiency treatment for 7 d. The experimental results proved that plants start from sensory signals, transmit the signals for self-regulation, change their phenotype, and finally adapt or not adapt to stress.
3.1. K+ Transporter Expression Results in Differences in Tolerance to K+ Deficiency between the Genotypes
K+ acquisition typically exhibits dual (high- and low-) affinity mechanisms in plants [9,22]. K+ uptake permeases (KUPs) encode plasma membrane K+/H+ symporters and catalyze K+ influx into cells under low-apoplastic-K+ conditions [23]. The transcript representing the KUP-related K+ transporter is Solyc12g009540; its expression was downregulated (6.79-fold) in JZ18, implying that this gene might assist the KUP gene family in K+ absorption under K+-deficient conditions. K+ translocation between different organs and tissues inside a plant and K+ secretion from root cortex cells into the xylem are mediated by outward-rectifying channels, such as SKOR [24]. Solyc03g097930 is a SKOR-like K+ channel whose expression was upregulated in the low-K+-tolerant variety JZ34. Solyc01g010480 is a voltage dependent K+-channel that is expressed in root hairs, and it displayed upregulated expression in JZ34. KAT1 is a highly selective inward-rectifying voltage-gated K+ channel that mediates long-term K+ influx into guard cells, leading to stomatal openings [25]. Expression of the KAT1 gene transcript Solyc01g010480 was upregulated (1.60-fold) in JZ34, suggesting that this variety was better able to perceive K+ deficiency, open stoma, and stimulate K+ transport. In our research, these genes were verified by qRT-PCR (Table S1).
3.2. Root-Related Genes, the ROS Signaling Pathway, and ERFs Cause Changes in Root Growth under K+ D Eficiency
Root morphological and physiological traits are important for the absorption of nutrients from the soil [26]. K+-efficient genotypes have a longer root system than do inefficient genotypes under K+-deficiency stress in rice [27], tomatoes [28], and Hordeum maritimum [29]. The differences in the root system of the two genotypes after K+-deficiency stress were very notable in our study. Similarly, K+ accumulation was positively correlated with the root length and root surface area in cotton [30]. Ethylene and ROS were also essential for root hair elongation [31]. Ethylene signaling plays an important role in low-K+-induced plant responses, such as root hair elongation, ROS production, and HAK5 expression [32].
Our study showed that the expression of many ERFs was upregulated, including Solyc03g005520 (ERF1a) (8.16-fold) and Solyc03g005500 (ERF14) (8.37-fold) (Table S1), were significantly higher in JZ34 than in JZ18 under the same conditions. The root fresh/ dry weight of JZ34 was also higher than that of JZ18. Therefore, some ERFs may play an important role in root growth in tomatoes in response to low-K+ signaling in tomato. Furthermore, ethylene is known to act upstream of ROS in response to K+ deprivation in Arabidopsis [32]. K+-deprived plants rapidly accumulate ROS, and the expression of some K+ transporters is thought to be dependent on ROS production [33].
Peroxidase, cytochrome P450, and glutathione S-transferase are critical for the regulation of ROS production, and for reducing cellular damage during oxidative stress in plants [34]. In the present study, the highest number of DEGs was associated with oxidative metabolism than any other category. Whether or not this effect is related to ethylene needs further validation, but the oxidative stress response is clearly a key physiological activity in the response to short-term K+-deficiency stress. Our results showed differences in the ROS scavenging capacities of the two genotypes under K+-deficiency stress conditions, which was most likely a key factor underlying the different tolerances of these genotypes to low-K+. Peroxidase activity and ROS signaling are specifically required during LR emergence [35]. GPX was a peroxidase-encoding gene. In transcriptome analysis, Solyc04g071890 (GPX1) and Solyc07g056480 (GPX7) were upregulated (2.07-fold) in JZ34 and downregulated (1.64-fold) in JZ18, respectively (Table S2). Overexpression of the two genes in Arabidopsis could enhanced root growth [36]. Solyc07g052370 (CYP) is a cytochrome P450 gene that was upregulated (6.13-fold) (Table S1) in JZ34 in the transcriptome analysis; this gene is involved in root defensive mechanisms in tomatoes [37]. Therefore, DEGs associated with oxidative stress are most likely key factors leading to differences in the root systems of the two genotypes under K+-deficiency stress.
3.3. K+ Deficiency between the Genotypes Leads to Changes in Hormonal Responses and Biosynthesis-Related DEGs
Plant hormones are continuously involved in the regulation of plant morphological changes under adverse conditions. Auxins play an important role in the development of plants, LRs, adventitious roots and root hairs. The PIN-FORMED (PIN) family serves as auxin export carrier proteins [38]. Many PIN family members participate in the transport and distribution of auxins, and thus play an important role in the establishment of auxin distribution patterns. The present study identified five auxin-related DEGs, four of which belong to the PIN family. Solyc01g068410 (PIN5) was downregulated (2.65-fold) in JZ18 and up-regulated (2.83-fold) in JZ34. Studies have suggested that PIN5 is mainly located in the endoplasmic reticulum; its expression in root hair cells can stimulate root hair growth to a certain extent, and PIN5 enhances the availability of internal IAA [39]. Solyc10g080880 (PIN7) was downregulated in JZ18, and Solyc07g006900 (PIN2) was upregulated in JZ34. Both genes are involved in IAA transport, and they regulate root growth and development [40]. This observation shows that genes associated with IAA transport are more active in JZ34 than in JZ18 and that the IAA content is increased in JZ34 and is reduced in JZ18 after K+-deficiency stress. Therefore, under K+-deficiency stress conditions, the PIN family showed differential expression patterns in the two genotypes, leading to differences in the IAA content to a certain extent, which might be one cause of the root system differences between the two genotypes. In addition, ROS have the ability to decrease IAA signaling [41], and therefore ROS accumulation in the roots of JZ18 may inhibit IAA production and transport.
In our study, eight genes related to CK metabolism were identified. Solyc10g017990, (CKX3) was downregulated (7.65-fold) in JZ18 (Table S1). In Arabidopsis thaliana, CKX3 promotes the growth of the main roots and LRs, and has a higher root biomass than does the wild type. Similar effects have also been found for CKX1, CKX2, and a family member of CKX in tobacco [42]. Therefore, we believe that DEGs that are associated with CKs are probably key factors leading to differences in the root systems of the two genotypes under K+-deficiency stress. We also measured the CK content. The JZ18 CK content decreased after K+-deficiency stress, whereas that of JZ34 increased. Existing studies suggest that CK has a negative regulatory effect on root growth and development [43]. However, the physiological processes of plants are often achieved by the coordinated regulation of various hormones. CKs can regulate the expression of auxin and PINs, and the ratio of IAA and CK can be used to explore synergistic on plant configurations more reasonably. Studies have suggested that a higher ratio indicates a greater utilization of root development. In terms of the IAA/CK ratio, JZ34 gradually surpassed the control group at 3 d. At this time point, the root systems of the two genotypes began to change gradually in configuration (Figure 1). Notably, DEGs related to salicylic acid metabolism were also identified in the present study. Salicylic acid is a new type of plant hormone that regulates some important metabolic processes in plants [44]. Studies have shown that exogenous salicylic acid can induce increased growth in soybean roots [45] and act as a signaling molecule to induce sustained resistance to abiotic or abiotic stresses in various plants. Salicylic acid induces the production of many enzymes related to plant resistance, and regulates their activities [46]. After the initiation of K+-deficiency stress in the present study, salicylic acid related genes were downregulated in JZ18 and upregulated in JZ34, with significant differences observed between the two genotypes. This hormone may be one key factor affecting the different tolerances of the two genotypes.
3.4. Glycometabolism and Transport Involved in K+-D Eficiency Stress
Sugar is not only is the energy source for plants, but also functions in signal transduction, regulates the expression and enzyme activity of related genes, and participates in the regulation of physiological activities [47,48]. Some studies have suggested that soluble sugars are involved in the production of NADPH, such as oxidation of the pentose phosphate pathway (OPP), to promote the clearance of ROS [49,50] and can also be used directly to scavenge hydroxyl radicals [51]. In the present study, the low-K+-tolerant strain showed no obvious ROS accumulation during the K+-deficiency treatment. This effect may be due to not only its strong ability to clear ROS, but also differences in sugar metabolism. SWEET family, glucose transporter, and solute carrier family genes involved in transporting sugar from the source to sink were also detected among the DEGs [52]. These DEGs were upregulated in JZ34 and downregulated in JZ18. These genes promote the transport of sugar from the leaves to the roots, and provided a basis for root growth in JZ34; however, the sugar transport capacity was decreased, and root growth was inhibited in JZ18 under K+-deficiency stress. Of these DEGs, Solyc03g097560 (SWEET14) was most downregulated (6.82-fold) in JZ18 (Table S1), which include cis-acting elements that respond to auxin. Thus, this gene is very likely to have a negative impact on IAA production. Based on our analysis, sugar metabolism and transport-related genes appear to play a positive role in improving plant resistance to K+-deficiency stress. Genes directly related to root development were also screened by the transcriptome analysis, but no further studies were found for these genes in tomatoes. Among the 20 genes identified in this study, the genes discussed include ERF, PIN, CKX, CYP, and SWEET14, which we believe were more likely to have an effect on root configuration under low K+ stress, and could provide a good basis for subsequent in-depth experiments.
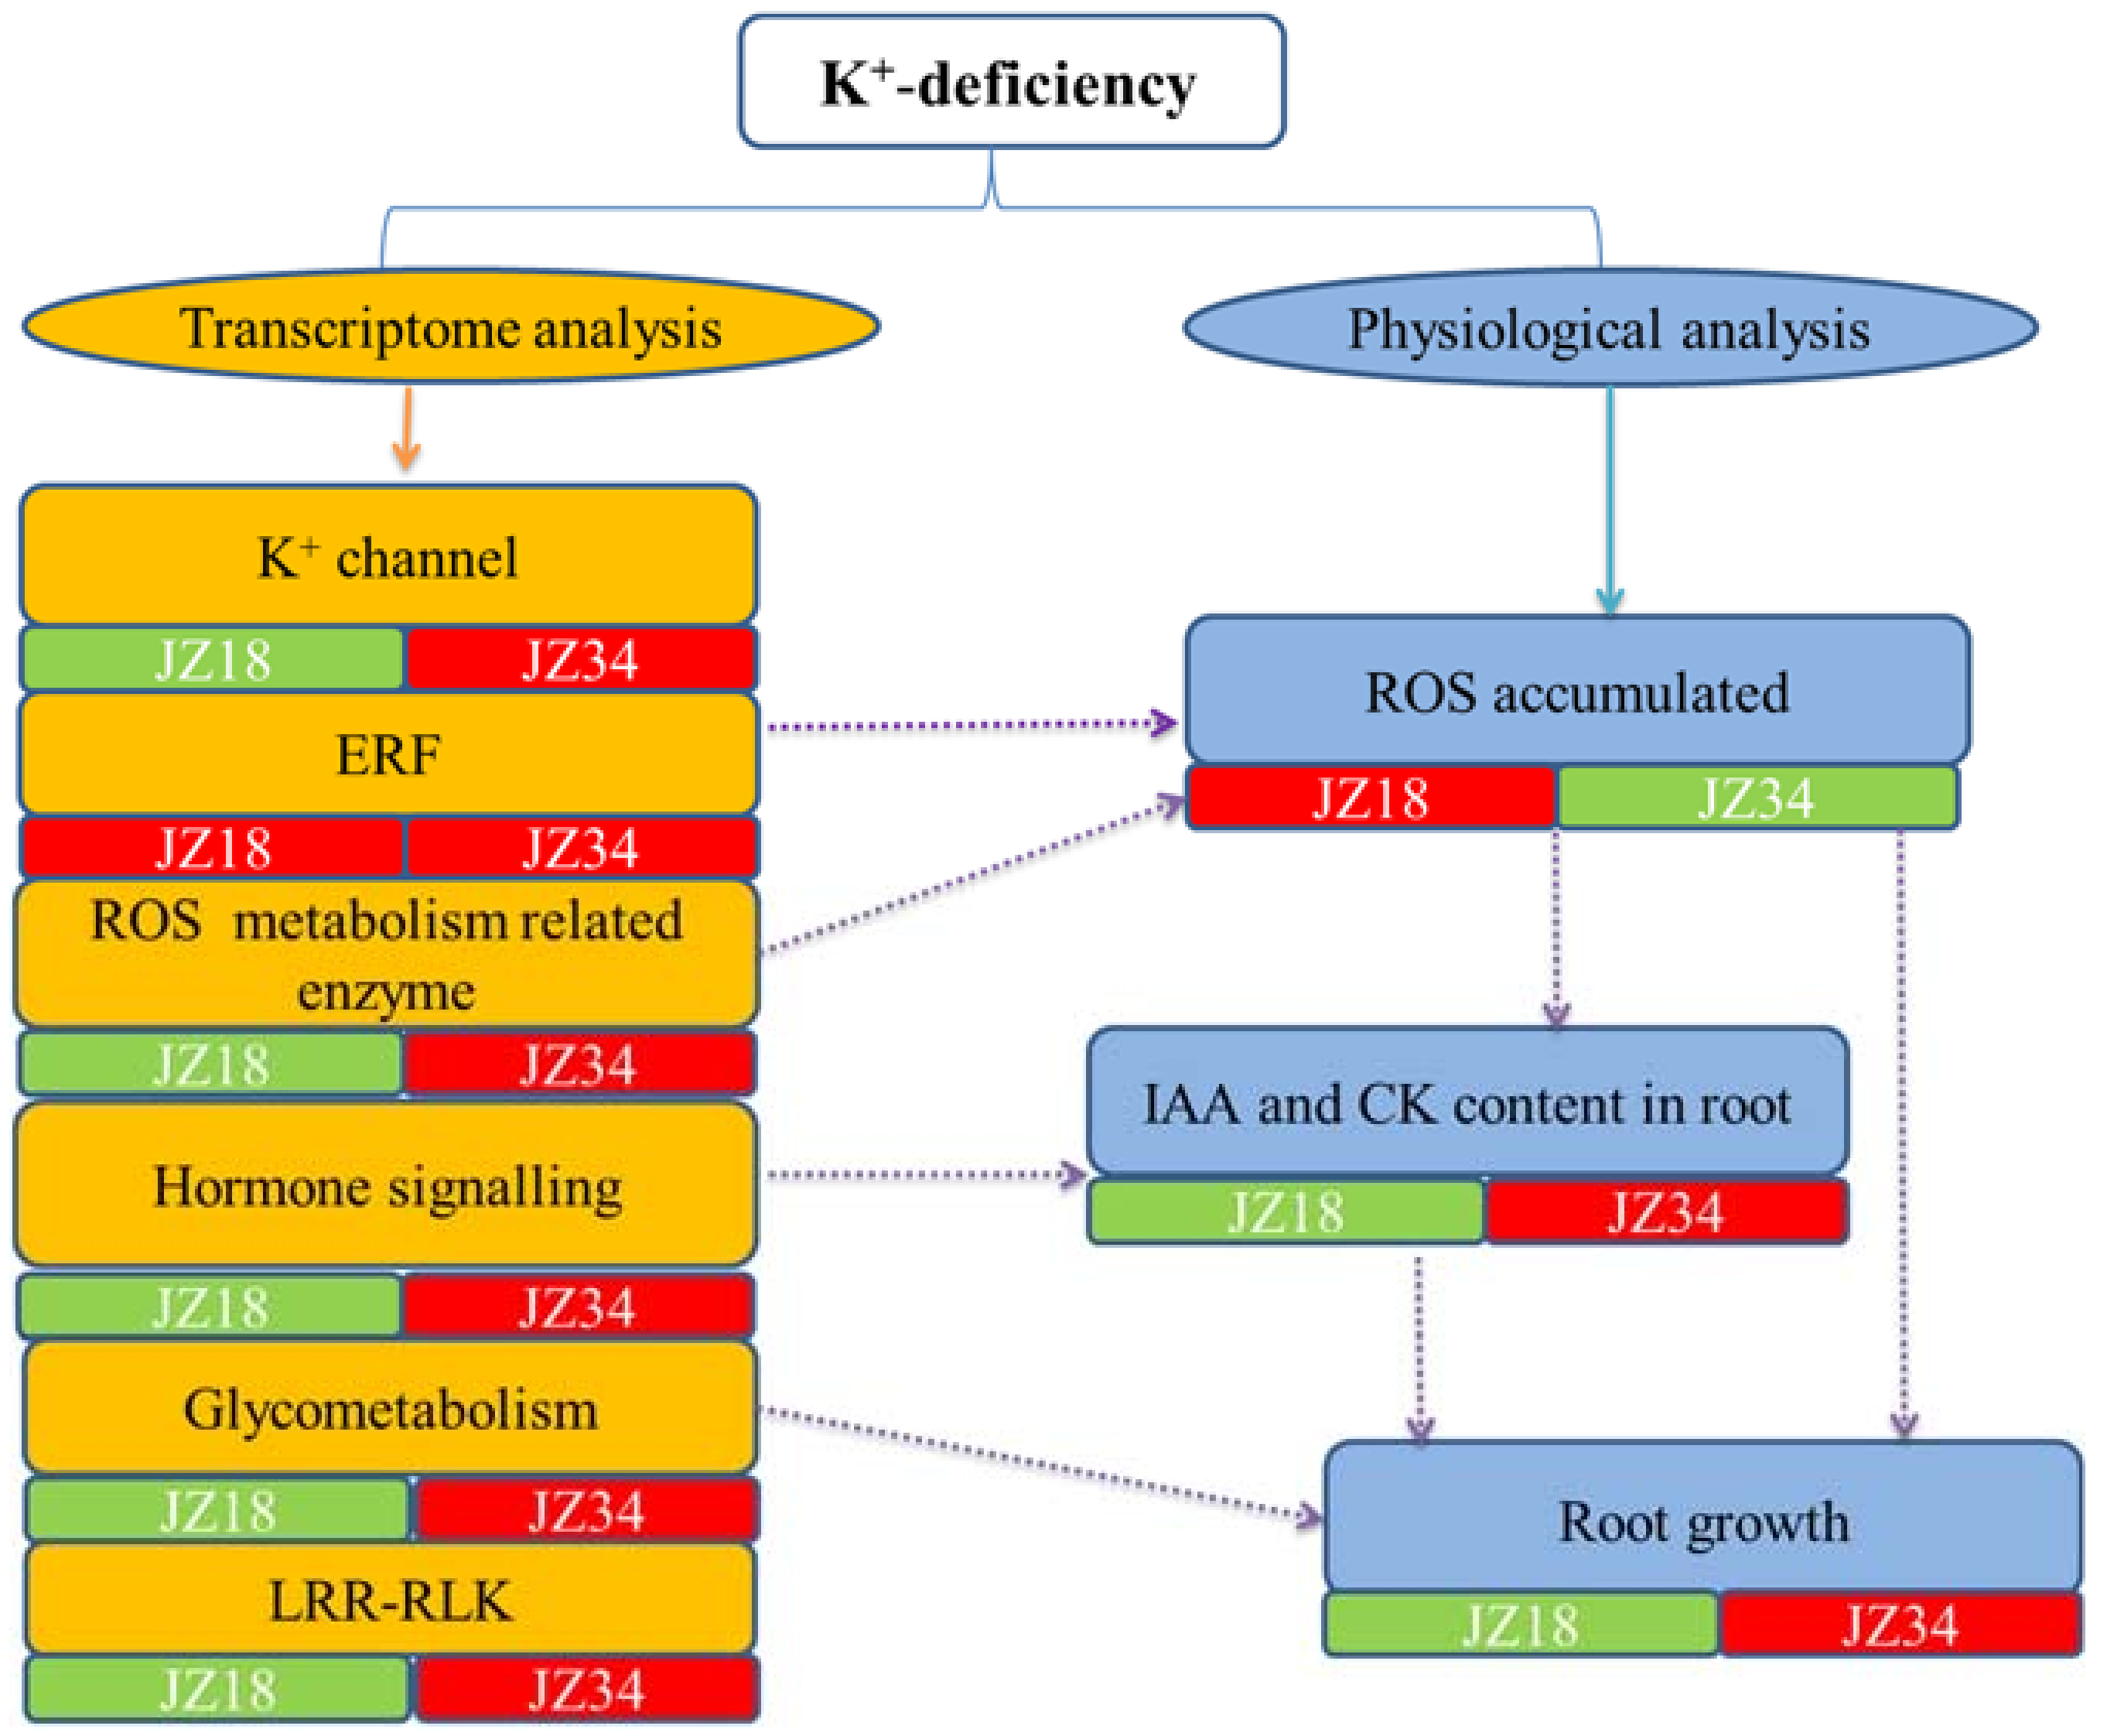
Two tomato genotypes were exposed to short-term K+-deficiency stress in this work. Multiple physiological metabolic pathways are involved in responses to K+-deficiency stress (Figure 9). Combining the transcriptome analysis and physiological analysis results suggested that a potential interaction occurred between them. ERF and ROS metabolism-related enzymes are probably involved in ROS accumulation and clearance. Hormone signaling is instructive for changes in the IAA and CK contents. Glycometabolism may play a very positive role in changes in the root architecture. No investigation found that LRR-RLKs affected the root architecture under K+-deficiency stress conditions, but these results indicated that LRR-RLKs might be more important in the tomato response to K+-deficiency. The changes in the ROS, IAA, and CK contents at the physiological level explained the changes in root architecture, although the mechanism underlying K+-deficiency stress resistance requires further study. In addition, the mechanisms regulating K+ absorption, transport, and utilization are important for tomato root system growth and plant yields with the increasingly widespread issue of K+-deficient soil. Our current study has provided valuable materials and data for further research into K+-deficiency stress.
4. Materials and Methods
4.1. Plant Materials and K+ Deficiency
Seeds of two tomato genotypes (JZ34, low-K+-tolerant, and JZ18, low-K+-sensitive) were surface sterilized in 1.0 mL 10% (v/v) NaClO for 15 min and rinsed five times with distilled water. The seeds were incubated to allow them to germinate in plastic Petri dishes in the dark for 3 d at 25 °C on two layers of sterile filter paper that were previously soaked in water. Tomato seedlings were transferred to a tray containing a 1:1:1 (v/v/v) mix of peat: perlite: vermiculite and grown in a greenhouse from March to April with day/night temperatures of approximately 26/18 °C in a daily average irradiance of 350 μmol·m−2·s−1 and at 70% relative humidity (RH). Seedlings at the vegetative growing stage (25 d) were cleaned with water, washed three times with distilled water and transferred to a pot (50 cm length, 30 cm width, 10 cm height) containing 12 L of nutrient solution. Each pot was filled with nutrient solution containing 1.5 mM Ca(NO3)2·4H2O, 4 mM KNO3, 0.67 mM NH4H2PO4, 2 mM MgSO4·7H2O, 0.05 mM H3BO3, 0.009 mM MnSO4·4H2O, 0.7 mM ZnSO4·7H2O, 0.32 mM CuSO4·5H2O, 0.1 mM (NH4)2MoO4, 0.05 mM FeSO4·7H2O, and 0.04 mM Na2-EDTA. The pH was adjusted to 5.8 ± 0.1 as required. The nutrient solution was replaced once every 3 d. A total 24 pots were used, with each pot containing nine plants. At the vegetative growing stage (30 d), K+ deficiency treatment was applied by reducing the concentration of KNO3 from 4 mM (normal K+) to 0.5 mM (K+ deficiency) in the nutrient solution. A concentration of 4 mM KNO3 was used as a control. After 7 d of K+-deficiency stress, different parts of the plant were sampled and dried to assess plant length, dry weight, and K+ content. K+ accumulation = K+ content × dry weight; K+ use efficiency (KUE) = dry weight (g) × 1000/K+ content (mg/g). To more clearly observe the apparent difference between the two genotypes after K+-deficiency stress, K+-free nutrient solution was also used. Differences in the leaf (Figure S1) and root systems of the two genotypes were examined at 3 d and 7 d, respectively. The experiments were repeated at least three times.
4.2. Measurement of K+ Uptake Kinetics
The nutrient solution of four-leaf-stage (25 day) tomato seedlings was replaced with a solution without K+ for 3 d with day/night temperatures of approximately 26/18 °C. Three seedlings with consistent growth were washed three times with 0.2 mM CaSO4 and placed into a black triangular flask with 100 mL of absorption liquid (0.2 mM KCl + 0.2 mM CaSO4). This process was repeated three times with each strain. Next, 1 mL of absorption liquid was removed from the triangular flask at different time points, and 1 mL of distilled water was added; this process was repeated until the absorption liquid K+ concentration was stable or close to zero. The K+ uptake kinetic parameters (Km and Imax) were calculated according to the method of Drew et al. [53]. Imax is the maximum uptake rate, and Km is the Michaelis-Menten constant.
4.3. RNA-seq Sampling and RNA Isolation
Seeds of JZ34 and JZ18 were germinated for RNA-seq sampling under the conditions described above and placed into a plant growth chamber. Four-leaf-stage seedlings at the vegetative growth stage (30 d) were exposed to K+-deficiency stress (0.5 mM) or the full-strength solution as control for 12 h and 24 h. Three whole independent seedlings were collected and mixed together at each time point to reduce the differences between individual plants. Three biological replicates were included for each treatment. The samples were snap-frozen in liquid nitrogen and stored at −80 °C for the RNA-seq analysis.
RNA was isolated according to the instructions of the RNeasy mini kit (Qiagen, Hilden, Germany). The RNA purity was determined using the NanoPhotometer® spectrophotometer (IMPLEN, Westlake Village, CA, USA). The RNA concentration was measured using the Qubit® RNA Assay Kit in the Qubit® 2.0 Fluorometer (Life Technologies, Carlsbad, CA, USA). The RNA integrity number (RIN) was assessed using the RNA Nano 6000 Assay Kit on the Agilent Bioanalyzer 2100 system (Agilent Technologies, Santa Clara, CA, USA) with 2.2 ≥ A260/A280 ≥ 2.0, 28 S/JZ18 S ≥ 1.5 and RIN ≥ 7.5. The RNA abundances and purity were tested to confirm that they met our requirements.
4.4. Library Construction, Sequencing, and Data Processing
Library preparations were sequenced on the BGISEQ-500 platform (BGI, Shenzhen, China), and 50-bp single-end (SE) reads were generated. BGISEQ-500 is powered by combinatorial probe-anchor synthesis (cPAS) and improved DNA Nanoballs (DNBs) technology. The cPAS chemistry works by incorporating a fluorescent probe into a DNA anchor on the DNBs, followed by high-resolution digital imaging. This combination of linear amplification and DNB technology reduces the error rate while enhancing the signal. In addition, the size of the DNBs is controlled so that only one DNB is bound per active site. This patterned array technology not only provides sequencing accuracy but also increases chip utilization and sample density.
4.5. Identification of DEGs
High-quality clean reads were mapped to the reference transcriptome, and the transcript levels of the unigenes were identified by TopHat (http://ccb.jhu.edu/software/tophat/index.shtml) and Cufflinks (http://cole-trapnell-lab.github.io/cufflinks/) [54] and normalized by the Fragments Per Kilobase of exon model per million mapped reads (FPKM) approach [55] according to the following formula: FPKM = 106C/NL/103. Given the expression of gene A, C indicates the number of fragments aligned to gene A, N represents the total number of fragments aligned to all genes, and L denotes the number of bases in gene A.
Sequencing was used to identify genes that were differentially expressed in the two different varieties [56]. FDRs were used in multiple hypothesis testing to correct the p-values. The FDRs were statistically preset to values less than 0.05, and the differential gene expression in different samples was calculated based on the FPKM values [57]. The expression ratio of 12 h/0 h or 24 h/0 h is presented as the fold change in the present study. An FDR ≤ 0.001 and an absolute value of log2 (fold-change) ≥ 1 were used as the thresholds to screen DEGs. The Multiexperiment Viewer (MeV; http://www.tm4.org/mev.html) [58] was used to delineate heatmaps based on the DEG results.
4.6. Gene Annotation, GO Enrichment and KEGG Analysis
The GO and pathway enrichment analyses of the DEGs were performed using the PANTHER classification system (http://www.pantherdb.org/data/) [59] and KEGG (http://www.kegg.jp/) [60]. A basic local alignment search tool (BLASTn) programme was used to identify homologues in the tomato genome (https://solgenomics.net/).
4.7. qRT-PCR Analysis
For quantitative qRT-PCR analysis, first-strand cDNA was synthesized using the PrimeScript 1st Strand cDNA Synthesis Kit (TIANGEN, Beijing, China). The qRT-PCR was performed in triplicate for each sample using the SYBR Green Real Master Mix, according to the manufacturer’s instructions. qRT-PCR amplification was performed using the Bio-Rad CFX Manager 3.1 Real Time PCR System (Applied Biosystems, Foster City, CA, USA) and software (Applied Biosystems). The 2−∆∆Ct method was used to analyze the relative changes in the gene expression levels from three biological replicates. The data were analyzed based on the mean values of triplicates. The specificity of the reactions was verified through melting-curve analysis. Actin was used as an internal control. The primers used for the qRT-PCR are listed in Table S5.
4.8. Determination of ROS
The cultivation method was the same as described above, and K+-deficiency treatment was used to detect ROS in tomato leaves and roots at 0, 12 h, 24 h, 3 d, and 7 d. Three biological replicates were conducted for each treatment. ROS accumulation was detected using the Reactive Oxygen Species Assay kit (Beyotime Biotechnology Shanghai, Shanghai, China) on the ZEISS Axio Observer A1 inverted fluorescence microscope. The H2O2 and O2− concentrations in the leaves and roots were determined according to a modified method [61,62].
4.9. Endogenous Hormone Content Determination
At 12 h, 24 h, and 3 d of K+-deficiency treatment, 0.1 g of root material was collected from each genotype. The experiments were repeated at least three times. The hormone contents were analyzed using an enzyme-linked immunosorbent assay [63].
4.10. Statistical Analysis
The data were analyzed using one-way analysis of variance (ANOVA) followed by Tukey’s honestly significant difference (HSD) multiple comparison tests in Statistical Productions and Service Solutions 17.0 (SPSS, Chicago, IL, USA). p < 0.05 was considered significant. Asterisks (* and **) indicate a significant difference between the controls and transgenic plants at p < 0.05 and 0.01, respectively.
Supplementary Materials
Supplementary materials can be found at https://www.mdpi.com/1422-0067/19/8/2402/s1.
Author Contributions
X.Z. contributed to the experimental design, tomato planting, and sampling, bioinformatic analysis and biological and data interpretation; Y.L., X.L. contributed to sampling and data interpretation. J.J. defined the work objectives and technical approach, and contributed to the experimental design, bioinformatics analysis and data interpretation.
Funding
This study was financially supported by the National Natural Science Foundation of China (31372054 and 31672138) and the State Key Laboratory of Plant Physiology and Biochemistry Open Project (No. SKLPPBKF1404).
Conflicts of Interest
The authors declare no conflict of interest.
Abbreviations
| ABA | Abscisic acid |
| AP2/ERF | Apetala 2 DNA binding domain transcription factor/ethylene-responsive factor |
| ARF | Auxin response factor |
| BGISEQ-500 | Big sequencing system-500 |
| bHLH | Basic helix-loop-helix |
| BLAST | Basic local alignment search tool |
| cPAS | Combinatorial probe-anchor synthesis |
| CK | Cytokinin |
| CKX | Cytokinin oxidase genes |
| CPA | Cation proton antiporters |
| DEGs | Differentially expressed genes |
| DNB | DNA nanoballs |
| ERF | Ethylene-responsive factor |
| EDTA | Ethylenediamine tetraacetic acid |
| FDR | False discovery rate |
| FPKM | Fragments per kilobase of exon model per million mapped reads |
| GO | Gene ontology |
| GA | Gibberellins |
| GAPDH | Glyceraldehyde-3-phosphate dehydrogenase |
| GPX | Glutathione peroxidase |
| IAA | Auxin |
| Imax | Ion maximum absorption rate |
| Km | Michaelis-Menten constant |
| KEGG | Kyoto encyclopedia of genes and genomes |
| KUE | K use efficiency |
| LR | Lateral root |
| LRR-RLKs | Leucine-rich repeat receptor-like protein kinases |
| GRF | Growth-regulating factor genes |
| OFP | Ovate family proteins |
| RH | Relative humidity |
| PIN | PIN-formed |
| ROS | Reactive oxygen species |
| SWEET | Sugars will eventually be exported transporter |
| SKOR | Stelar K+ outward rectifying channel |
| TFs | Transcription factors. |
References
- Besford, R.; Maw, G. Effect of potassium nutrition on tomato plant growth and fruit development. Plant Soil 1975, 42, 395–412. [Google Scholar] [CrossRef]
- Pujos, A.; Morard, P. Effects of potassium deficiency on tomato growth and mineral nutrition at the early production stage. Plant Soil 1997, 189, 189–196. [Google Scholar] [CrossRef]
- Kanai, S.; Moghaieb, R.E.; El-Shemy, H.A.; Panigrahi, R.; Mohapatra, P.K.; Ito, J.; Nguyen, N.T.; Saneoka, H.; Fujita, K. Potassium deficiency affects water status and photosynthetic rate of the vegetative sink in green house tomato prior to its effects on source activity. Plant Sci. 2011, 180, 368–374. [Google Scholar] [CrossRef] [PubMed]
- Sheldrick, W.F.; Syers, J.K.; Lingard, J. Soil nutrient audits for China to estimate nutrient balances and output/input relationships. Agric. Ecosyst. Environ. 2003, 94, 341–354. [Google Scholar] [CrossRef]
- Schwarz, D.; Öztekin, G.B.; Tüzel, Y.; Brückner, B.; Krumbein, A. Rootstocks can enhance tomato growth and quality characteristics at low potassium supply. Sci. Hortic. 2013, 149, 70–79. [Google Scholar] [CrossRef]
- Jungk, A.; Claassen, N. Ion diffusion in the soil-root system. Adv. Agron. (USA) 1997, 61, 53–110. [Google Scholar]
- Hussain, Z.; Arshad, M. Relationship among root characteristics and differential potassium uptake and use efficiency of selected cotton genotypes under potassium deficiency stress. Pak. J. Bot. 2011, 43, 1831–1935. [Google Scholar]
- Jia, Y.-B.; Yang, X.-E.; Feng, Y.; Jilani, G. Differential response of root morphology to potassium deficient stress among rice genotypes varying in potassium efficiency. J. Zhejiang Univ. Sci. B 2008, 9, 427. [Google Scholar] [CrossRef] [PubMed]
- Pyo, Y.J.; Gierth, M.; Schroeder, J.I.; Cho, M.H. High-affinity K+ transport in Arabidopsis: AtHAK5 and AKT1 are vital for seedling establishment and postgermination growth under low-potassium conditions. Plant Physiol. 2010, 153, 863–875. [Google Scholar] [CrossRef] [PubMed]
- Hyun, T.K.; Rim, Y.; Kim, E.; Kim, J.S. Genome-wide and molecular evolution analyses of the KT/HAK/KUP family in tomato (Solanum lycopersicum L.). Genes Genom. 2014, 36, 365–374. [Google Scholar] [CrossRef]
- Pettersson, S.; Jensen, P. Variation among species and varieties in uptake and utilization of potassium. Plant Soil 1983, 72, 231–237. [Google Scholar] [CrossRef]
- Zeng, J.; He, X.; Wu, D.; Zhu, B.; Cai, S.; Nadira, U.A.; Jabeen, Z.; Zhang, G. Comparative Transcriptome Profiling of Two Tibetan Wild Barley Genotypes in Responses to Low Potassium. PLoS ONE 2014, 9, e100567. [Google Scholar] [CrossRef] [PubMed]
- Gerardeaux, E.; Jordan-Meille, L.; Constantin, J.; Pellerin, S.; Dingkuhn, M. Changes in plant morphology and dry matter partitioning caused by potassium deficiency in Gossypium hirsutum (L.). Environ. Exp. Bot. 2011, 67, 451–459. [Google Scholar] [CrossRef]
- Zhao, X.M.; Jiang, J.; Zhang, Y.C. Different tomato strains growth and development affected by K+ deficiency stress. Jiangsu Agric. Sci. 2011, 39, 219–223. [Google Scholar]
- Armengaud, P.; Breitling, R.; Amtmann, A. The potassium-dependent transcriptome of Arabidopsis reveals a prominent role of jasmonic acid in nutrient signaling. Plant Physiol. 2004, 136, 2556–2576. [Google Scholar] [CrossRef] [PubMed]
- Ma, T.-L.; Wu, W.-H.; Wang, Y. Transcriptome analysis of rice root responses to potassium deficiency. BMC Plant Biol. 2012, 12, 161. [Google Scholar] [CrossRef] [PubMed]
- Lu, L.; Chen, Y.; Lu, L.; Lu, Y.; Li, L. Transcriptome analysis reveals dynamic changes in the gene expression of tobacco seedlings under low potassium stress. J. Genet. 2015, 94, 397–406. [Google Scholar] [CrossRef] [PubMed]
- Shen, C.; Wang, J.; Shi, X.; Kang, Y.; Xie, C.; Peng, L.; Dong, C.; Shen, Q.; Xu, Y. Transcriptome Analysis of Differentially Expressed Genes Induced by Low and High Potassium Levels Provides Insight into Fruit Sugar Metabolism of Pear. Front. Plant Sci. 2017, 8, 938. [Google Scholar] [CrossRef] [PubMed]
- Zhang, X.; Jiang, H.; Wang, H.; Cui, J.; Wang, J.; Hu, J.; Guo, L.; Qian, Q.; Xue, D. Transcriptome Analysis of Rice Seedling Roots in Response to Potassium Deficiency. Sci. Rep. 2017, 7, 5523. [Google Scholar] [CrossRef] [PubMed]
- Claassen, N.; Barber, S.A. A method for characterizing the relation between nutrient concentration and flux into roots of intact plants. Plant Physiol. 1974, 54, 564–568. [Google Scholar] [CrossRef] [PubMed]
- Rengel, Z.; Damon, P.M. Crops and genotypes differ in efficiency of potassium uptake and use. Physiol. Plant. 2008, 133, 624–636. [Google Scholar] [CrossRef] [PubMed]
- Epstein, E.; Rains, D.; Elzam, O. Resolution of dual mechanisms of potassium absorption by barley roots. Proc. Natl. Acad. Sci. USA 1963, 49, 684–692. [Google Scholar] [CrossRef] [PubMed]
- Zhao, J.; Cheng, N.-H.; Motes, C.M.; Blancaflor, E.B.; Moore, M.; Gonzales, N.; Padmanaban, S.; Sze, H.; Ward, J.M.; Hirschi, K.D. AtCHX13 is a plasma membrane K+ transporter. Plant Physiol. 2008, 148, 796–807. [Google Scholar] [CrossRef] [PubMed]
- Gaymard, F.; Pilot, G.; Lacombe, B.; Bouchez, D.; Bruneau, D.; Boucherez, J.; Michaux-Ferriere, N.; Thibaud, J.-B.; Sentenac, H. Identification and disruption of a plant shaker-like outward channel involved in K+ release into the xylem sap. Cell 1998, 94, 647–655. [Google Scholar] [CrossRef]
- Nakamura, R.L.; McKendree, W.L., Jr.; Hirsch, R.E.; Sedbrook, J.C.; Gaber, R.F.; Sussman, M.R. Expression of an Arabidopsis potassium channel gene in guard cells. Plant Physiol. 1995, 109, 371–374. [Google Scholar] [CrossRef] [PubMed] [Green Version]
- Sattelmacher, B.; Horst, W.J.; Becker, H.C. Factors that contribute to genetic variation for nutrient efficiency of crop plants. J. Plant Nutr. Soil Sci. 1994, 157, 215–224. [Google Scholar] [CrossRef]
- Yang, X.; Liu, J.; Wang, W.; Li, H.; Luo, A.; Ye, Z.; Yang, Y. Genotypic differences and some associated plant traits in potassium internal use efficiency of lowland rice (Oryza sativa L.). Nutr. Cycl. Agroecosyst. 2003, 67, 273–282. [Google Scholar] [CrossRef]
- Chen, J.; Gabelman, W. Isolation of tomato strains varying in potassium acquisition using a sand-zeolite culture system. Plant Soil 1995, 176, 65–70. [Google Scholar] [CrossRef]
- Hafsi, C.; Romero-Puertas, M.C.; Luis, A.; Abdelly, C.; Sandalio, L.M. Antioxidative response of Hordeum maritimum L. to potassium deficiency. Acta Physiol. Plant. 2011, 33, 193–202. [Google Scholar] [CrossRef]
- Brouder, S.; Cassman, K. Root development of two cotton cultivars in relation to potassium uptake and plant growth in a vermiculitic soil. Field Crops Res. 1990, 23, 187–203. [Google Scholar] [CrossRef]
- Tanimoto, M.; Roberts, K.; Dolan, L. Ethylene is a positive regulator of root hair development in Arabidopsis thaliana. Plant J. 1995, 8, 943–948. [Google Scholar] [CrossRef] [PubMed]
- Jung, J.-Y.; Shin, R.; Schachtman, D.P. Ethylene mediates response and tolerance to potassium deprivation in Arabidopsis. Plant Cell 2009, 21, 607–621. [Google Scholar] [CrossRef] [PubMed]
- Shin, R.; Schachtman, D.P. Hydrogen peroxide mediates plant root cell response to nutrient deprivation. Proc. Natl. Acad. Sci. USA 2004, 101, 8827–8832. [Google Scholar] [CrossRef] [PubMed] [Green Version]
- Halušková, L.U.; Valentovičová, K.; Huttová, J.; Mistrík, I.; Tamás, L. Effect of abiotic stresses on glutathione peroxidase and glutathione S-transferase activity in barley root tips. Plant Physiol. Biochem. 2009, 47, 1069–1074. [Google Scholar] [CrossRef] [PubMed]
- Manzano, C.; Pallerobaena, M.; Casimiro, I.; De, R.B.; Ormanligeza, B.; Van, I.G.; Beeckman, T.; Draye, X.; Casero, P.; Del Pozo, J.C. The Emerging Role of Reactive Oxygen Species Signaling during Lateral Root Development. Plant Physiol. 2014, 165, 1105–1119. [Google Scholar] [CrossRef] [PubMed] [Green Version]
- Passaia, G.; Queval, G.; Bai, J.; Margispinheiro, M.; Foyer, C.H. The effects of redox controls mediated by glutathione peroxidases on root architecture in Arabidopsis thaliana. J. Exp. Bot. 2014, 65, 1403–1413. [Google Scholar] [CrossRef] [PubMed]
- Vegamás, I.; Pérezdelgado, C.M.; Marino, D.; Fuertesmendizábal, T.; Gonzálezmurua, C.; Márquez, A.J.; Betti, M.; Estavillo, J.M.; Gonzálezmoro, M.B. Elevated CO2 induces root defensive mechanisms in tomato plants when dealing with ammonium toxicity. Plant Cell Physiol. 2017, 58, 2112–2125. [Google Scholar] [CrossRef] [PubMed]
- Ljung, K. Auxin metabolism and homeostasis during plant development. Development 2013, 140, 943–950. [Google Scholar] [CrossRef] [PubMed] [Green Version]
- Ganguly, A.; Sangho, L.; Misuk, C.; Okran, L.; Heejin, Y.; Hyungtaeg, C. Differential auxin-transporting activities of PIN-FORMED proteins in Arabidopsis root hair cells. Plant Physiol. 2010, 153, 1046–1061. [Google Scholar] [CrossRef] [PubMed]
- Evans, N.H. Modulation of guard cell plasma membrane potassium currents by methyl jasmonate. Plant Physiol. 2003, 131, 8–11. [Google Scholar] [CrossRef] [PubMed]
- Blomster, T.; Salojärvi, J.; Sipari, N.; Brosché, M.; Ahlfors, R.; Keinänen, M.; Overmyer, K.; Kangasjärvi, J. Apoplastic Reactive Oxygen Species Transiently Decrease Auxin Signaling and Cause Stress-Induced Morphogenic Response in Arabidopsis. Plant Physiol. 2011, 157, 1866–1883. [Google Scholar] [CrossRef] [PubMed]
- Werner, T.; Nehnevajova, E.; Köllmer, I.; Novák, O.; Strnad, M.; Krämer, U.; Schmülling, T. Root-Specific Reduction of Cytokinin Causes Enhanced Root Growth, Drought Tolerance, and Leaf Mineral Enrichment in Arabidopsis and Tobacco. Plant Cell 2010, 22, 3905–3920. [Google Scholar] [CrossRef] [PubMed]
- Riefler, M.; Novak, O.; Strnad, M.; Schmülling, T. Arabidopsis cytokinin receptor mutants reveal functions in shoot growth, leaf senescence, seed size, germination, root development, and cytokinin metabolism. Plant Cell 2006, 18, 40–54. [Google Scholar] [CrossRef] [PubMed]
- Raskin, I. Role of Salicylic Acid in Plants. Annu. Rev. Plant Physiol. 1992, 43, 439–463. [Google Scholar] [CrossRef]
- Gutiérrez-Coronado, M.A.; Trejo-López, C.; Larqué-Saavedra, A. Effects of salicylic acid on the growth of roots and shoots in soybean. Plant Physiol. Biochem. 1998, 36, 563–565. [Google Scholar] [CrossRef]
- Malamy, J.; Carr, J.P.; Klessig, D.F.; Raskin, I. Salicylic Acid: A Likely Endogenous Signal in the Resistance Response of Tobacco to Viral Infection. Science 1990, 250, 1002–1004. [Google Scholar] [CrossRef] [PubMed]
- Proels, R.K.; Hückelhoven, R. Cell-wall invertases, key enzymes in the modulation of plant metabolism during defence responses. Mol. Plant Pathol. 2014, 15, 858–864. [Google Scholar] [CrossRef] [PubMed]
- Sleiman, M.S.B.; Schüpfer, F.; Lemaitre, B. Transforming Growth Factor β/Activin Signaling Functions as a Sugar-Sensing Feedback Loop to Regulate Digestive Enzyme Expression. Cell Res. 2014, 9, 336–348. [Google Scholar]
- Couée, I.; Sulmon, C.; Gouesbet, G.; El, A.A. Involvement of soluble sugars in reactive oxygen species balance and responses to oxidative stress in plants. J. Exp. Bot. 2006, 57, 449–459. [Google Scholar] [CrossRef] [PubMed] [Green Version]
- Bolourimoghaddam, M.R.; Roy, K.L.; Li, X.A.; Rolland, F.; Ende, W.V.D. Sugar signalling and antioxidant network connections in plant cells. FEBS J. 2010, 277, 2022–2037. [Google Scholar] [CrossRef] [PubMed] [Green Version]
- Matros, A.; Peshev, D.; Peukert, M.; Mock, H.P.; Wim, V.D.E. Sugars as hydroxyl radical scavengers: Proof-of-concept by studying the fate of sucralose in Arabidopsis. Plant J. 2015, 82, 822–839. [Google Scholar] [CrossRef] [PubMed]
- Baker, R.F.; Leach, K.A.; Braun, D.M. SWEET as sugar: New sucrose effluxers in plants. Mol. Plant 2012, 5, 766–768. [Google Scholar] [CrossRef] [PubMed]
- Drew, M.; Saker, L.; Barber, S.; Jenkins, W. Changes in the kinetics of phosphate and potassium absorption in nutrient-deficient barley roots measured by a solution-depletion technique. Planta 1984, 160, 490–499. [Google Scholar] [CrossRef] [PubMed]
- Trapnell, C.; Roberts, A.; Goff, L.; Pertea, G.; Kim, D.; Kelley, D.R.; Pimentel, H.; Salzberg, S.L.; Rinn, J.L.; Pachter, L. Differential gene and transcript expression analysis of RNA-seq experiments with TopHat and Cufflinks. Nat. Protoc. 2012, 7, 562. [Google Scholar] [CrossRef] [PubMed]
- Trapnell, C.; Williams, B.A.; Pertea, G.; Mortazavi, A.; Kwan, G.; Van Baren, M.J.; Salzberg, S.L.; Wold, B.J.; Pachter, L. Transcript assembly and quantification by RNA-Seq reveals unannotated transcripts and isoform switching during cell differentiation. Nat. Biotechnol. 2010, 28, 511–515. [Google Scholar] [CrossRef] [PubMed] [Green Version]
- Audic, S.; Claverie, J.-M. The significance of digital gene expression profiles. Genome Res. 1997, 7, 986–995. [Google Scholar] [CrossRef] [PubMed]
- Zenoni, S.; Ferrarini, A.; Giacomelli, E.; Xumerle, L.; Fasoli, M.; Malerba, G.; Bellin, D.; Pezzotti, M.; Delledonne, M. Characterization of transcriptional complexity during berry development in Vitis vinifera using RNA-Seq. Plant Physiol. 2010, 152, 1787–1795. [Google Scholar] [CrossRef] [PubMed]
- Eisen, M.B.; Spellman, P.T.; Brown, P.O.; Botstein, D. Cluster analysis and display of genome-wide expression patterns. Proc. Natl. Acad. Sci. USA 1998, 95, 14863–14868. [Google Scholar] [CrossRef] [PubMed] [Green Version]
- Mi, H.; Lazareva-Ulitsky, B.; Loo, R.; Kejariwal, A.; Vandergriff, J.; Rabkin, S.; Guo, N.; Muruganujan, A.; Doremieux, O.; Campbell, M.J. The PANTHER database of protein families, subfamilies, functions and pathways. Nucleic Acids Res. 2005, 33 (Suppl. 1), D284–D288. [Google Scholar] [CrossRef] [PubMed]
- Kanehisa, M.; Araki, M.; Goto, S.; Hattori, M.; Hirakawa, M.; Itoh, M.; Katayama, T.; Kawashima, S.; Okuda, S.; Tokimatsu, T. KEGG for linking genomes to life and the environment. Nucleic Acids Res. 2007, 36 (Suppl. 1), D480–D484. [Google Scholar] [CrossRef] [PubMed] [Green Version]
- Patterson, B.D.; Macrae, E.A.; Ferguson, I.B. Estimation of hydrogen peroxide in plant extracts using titanium(IV). Anal. Biochem. 1984, 139, 487–492. [Google Scholar] [CrossRef]
- Elstner, E.F.; Heupel, A. Inhibition of nitrite formation from hydroxylammoniumchloride: A simple assay for superoxide dismutase. Anal. Biochem. 1976, 70, 616–620. [Google Scholar] [CrossRef]
- Sun, C.; Li, Y.; Zhao, W.; Song, X.; Lu, M.; Li, X.; Li, X.; Liu, R.; Yan, L.; Zhang, X. Integration of hormonal and nutritional cues orchestrates progressive corolla opening. Plant Physiol. 2016, 171, 1209–1229. [Google Scholar] [PubMed]
Figure 1.
Comparison of morphological changes in the roots of different tomato genotypes under K+-deficiency stress conditions at 3 d and 7 d (A); changes in the root hair region in different tomato genotypes under K+-deficiency stress conditions at 7 d. Roots were observed at 100 × magnification; scale bars: 0.01 cm (B). K+ represents normal K+ (4 mM); K− represents K+ deficiency (0 mM). The experiments were repeated three times.
Figure 2.
The K+ uptake ability was compared using K+ depletion between two different genotypes. The experiments were repeated three times. * and ** denote significant differences at p < 0.05 and p < 0.01, respectively.
Figure 2.
The K+ uptake ability was compared using K+ depletion between two different genotypes. The experiments were repeated three times. * and ** denote significant differences at p < 0.05 and p < 0.01, respectively.
Figure 3.
Quantitative real-time PCR validation of 20 differentially expressed genes (DEGs). The blue column represents RNA-seq data, and the red column represents real-time PCR data. The experiments were repeated three times. The genes (A–T) function annotations are shown Table S1.Gene-specific primers used for real-time PCR are listed in Table S5.
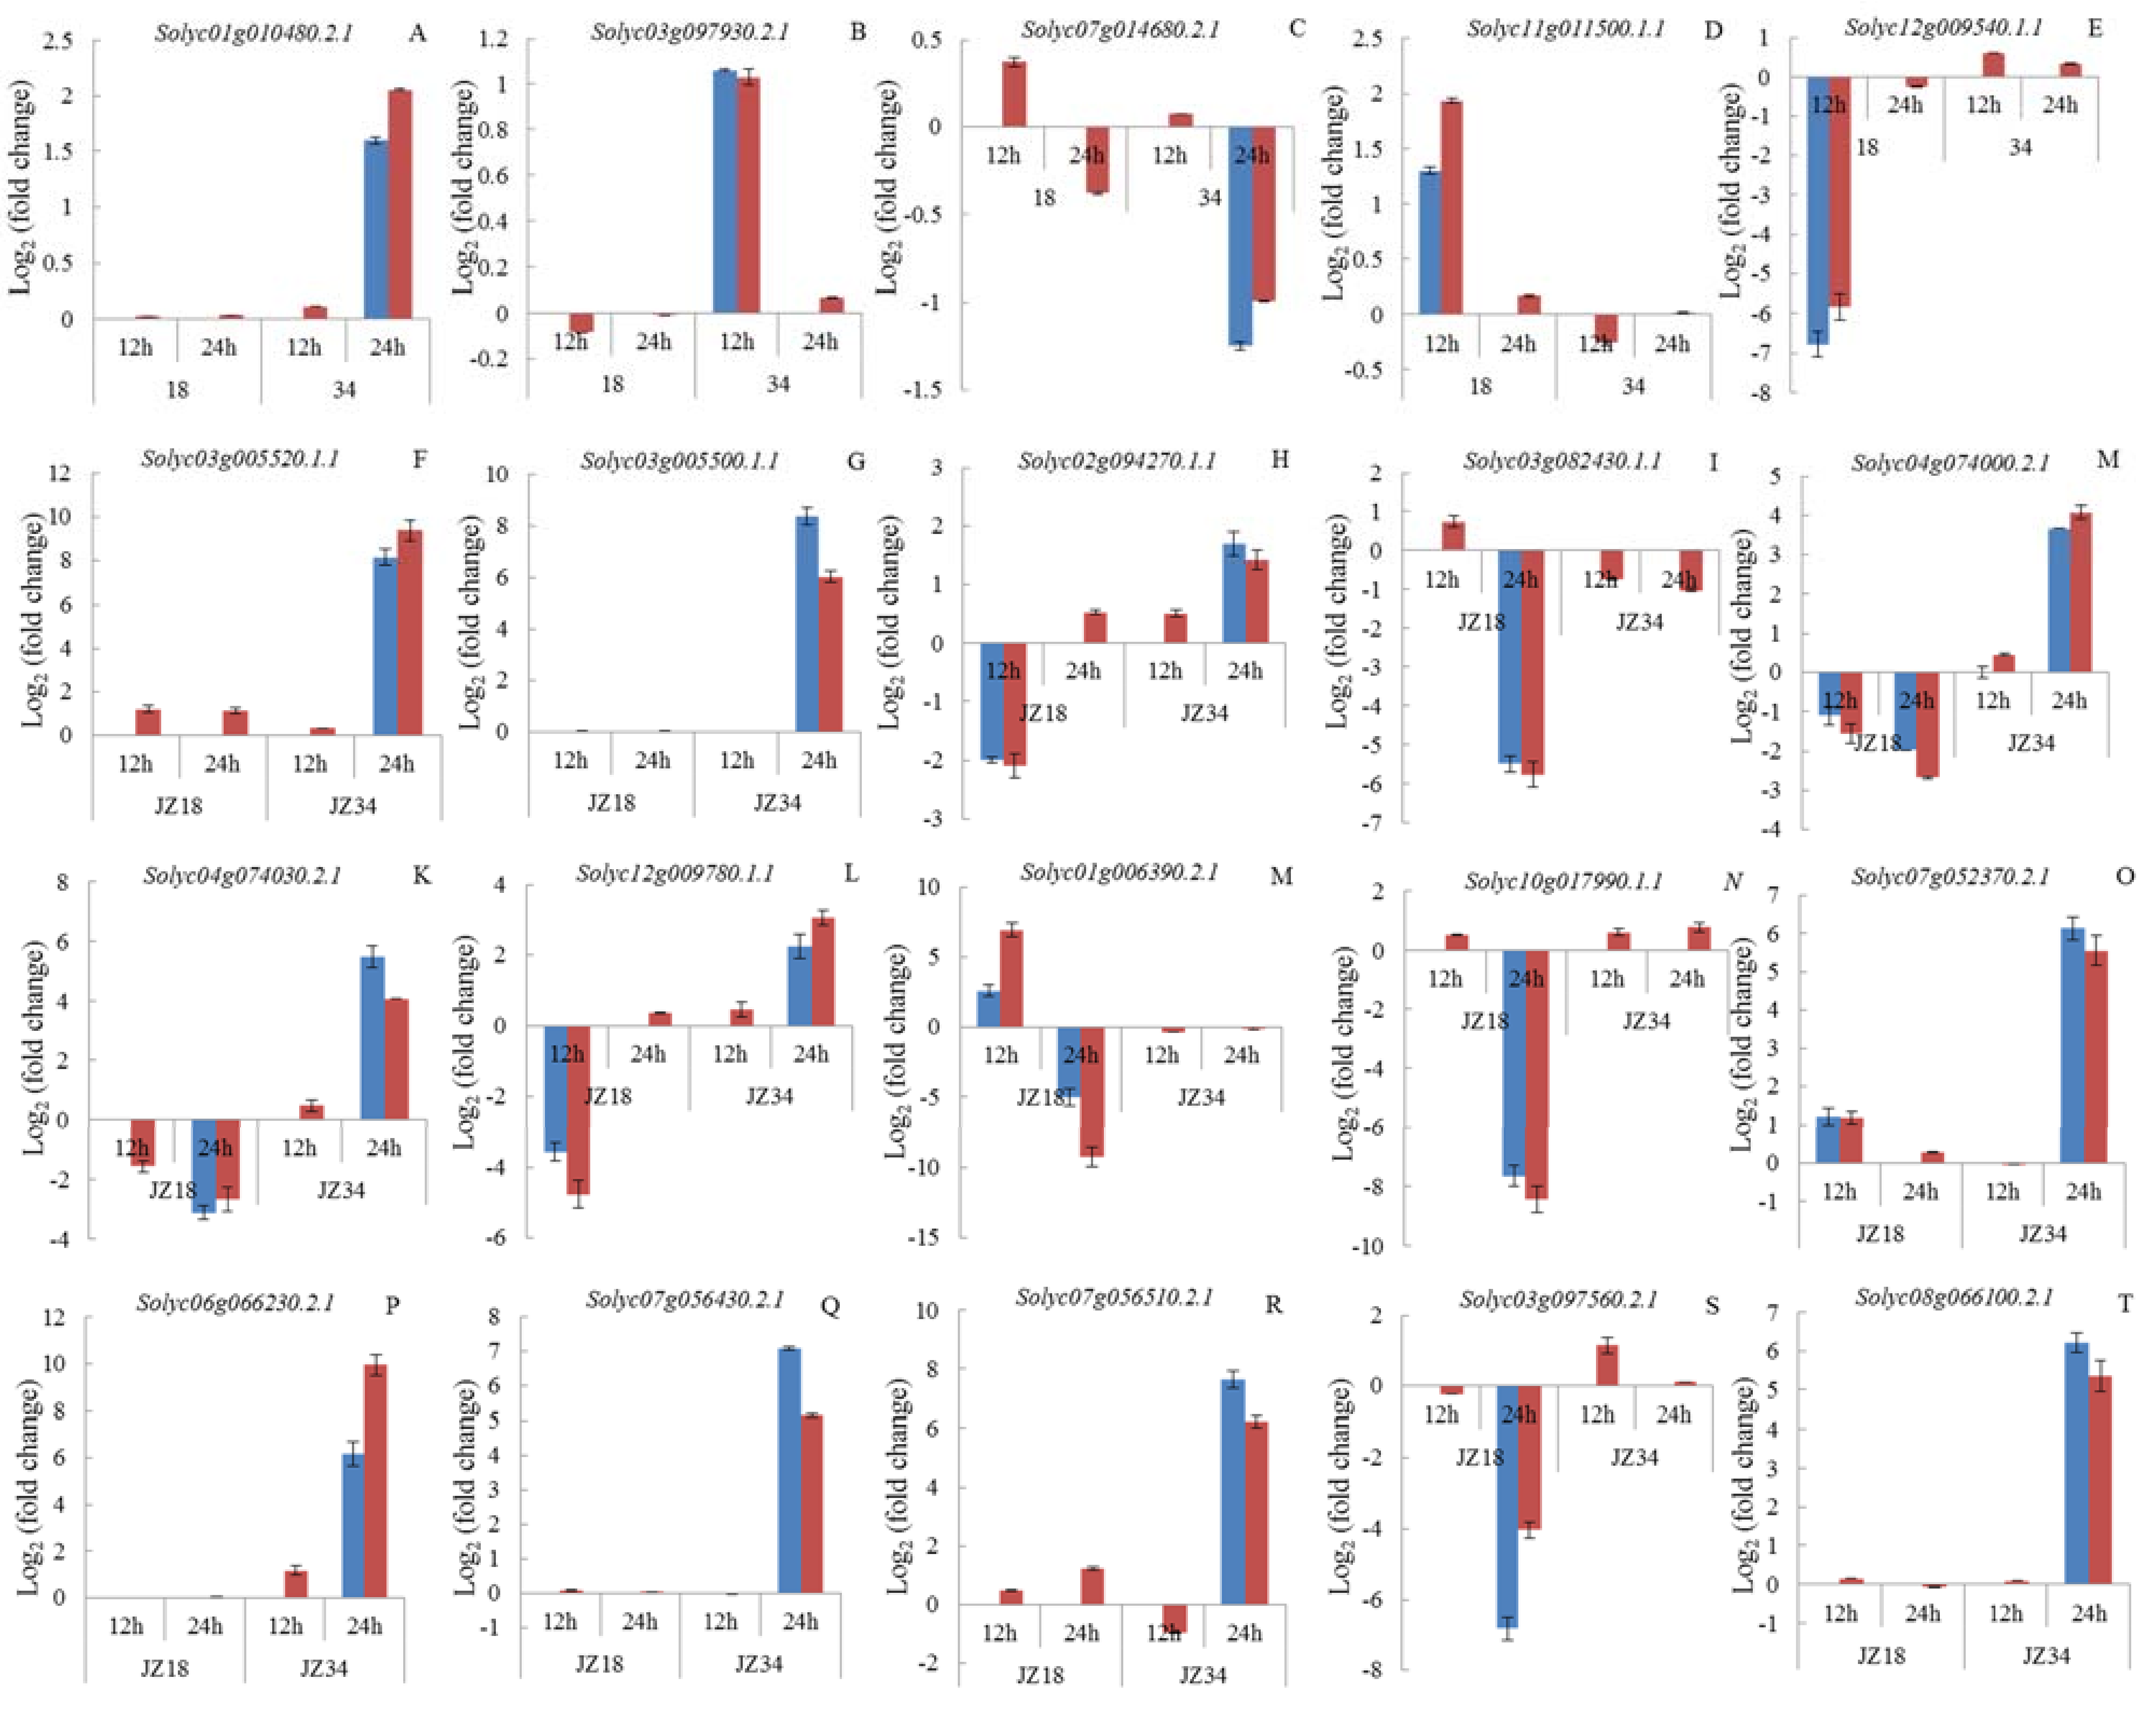
Figure 4.
A Venn diagram showing overlaps among DEGs in JZ18 and JZ34. The numbers of upregulated genes at 12 h and 24 h after K+-deficiency (0.5 mM) treatment (A); the numbers of downregulated genes at 12 h and 24 h after K+-deficiency (0.5 mM) treatment (B).
Figure 4.
A Venn diagram showing overlaps among DEGs in JZ18 and JZ34. The numbers of upregulated genes at 12 h and 24 h after K+-deficiency (0.5 mM) treatment (A); the numbers of downregulated genes at 12 h and 24 h after K+-deficiency (0.5 mM) treatment (B).
Figure 5.
Average linkage hierarchical clustering analysis of transcription factors (TFs) identified among the DEGs.
Figure 5.
Average linkage hierarchical clustering analysis of transcription factors (TFs) identified among the DEGs.
Figure 6.
Comparison of the reactive oxygen species (ROS) content in the guard cells (A) and roots (B) of different tomato varieties under K+-deficiency stress conditions at 0 h, 12 h, 24 h, 3 d, and 7 d. K+ represents normal K+ (4 mM); K− represents K+ deficiency (0.5 mM). The experiments were repeated three times. (A) Scale Bar: 10µm (B) Scale Bar: 30 µm.
Figure 7.
Comparison of the IAA and CK contents and the IAA/CK ratio in the roots of different tomato genotypes under K+-deficiency stress conditions at 12 h, 24 h, and 3 d. K+ represents normal K+ (4 mM); K− represents K+ deficiency (0.5 mM). The experiments were repeated three times. * and ** denote significant differences at p < 0.05 and 0.01.
Figure 8.
Gene Ontology (GO) for the co-expressed DEGs in the JZ18 and JZ34 genotypes.
Figure 9.
A hypothetical model of the response to K+-deficiency stress in two tomato genotypes. The green box represents downregulated DEGs, and the red box represents upregulated DEGs. The dotted lines represent potential relationships.
Figure 9.
A hypothetical model of the response to K+-deficiency stress in two tomato genotypes. The green box represents downregulated DEGs, and the red box represents upregulated DEGs. The dotted lines represent potential relationships.

Table 1.
Effect of K+ level on the biomass, K+ concentration and accumulation in two different genotypes at 7 d.
Table 1.
Effect of K+ level on the biomass, K+ concentration and accumulation in two different genotypes at 7 d.
| Genotype | K+ | K− | Relative Index | |
|---|---|---|---|---|
| Stem length (mm) | JZ34 | 36.33a | 34.67a | 0.95 |
| JZ18 | 28.67a | 24.00a | 0.84 | |
| Root length (mm) | JZ34 | 21.67a | 21.50a | 0.99 |
| JZ18 | 25.00a | 21.50b | 0.86 | |
| Fresh weight (mg·plant−1 FW) | JZ34 | 12.08a | 12.44a | 1.03 |
| JZ18 | 10.46a | 10.01a | 0.96 | |
| Dry weight (mg·plant−1 DW) | JZ34 | 0.79a | 0.85a | 1.07 |
| JZ18 | 0.77a | 0.55b | 0.71 | |
| K+ content (mg·g−1 DW) | JZ34 | 367.00a | 325.71a | 0.89 |
| JZ18 | 389.88a | 223. 34b | 0.57 | |
| K accumulation (mg·plant−1) | JZ34 | 289.20a | 276.53a | 0.95 |
| JZ18 | 286.17A | 129.98B | 0.45 |
The experiments were repeated three times. K+ represents normal K+ (4 mM); K− represents K+ deficiency (0.5 mM). For each line, different lowercase and uppercase letters indicate significant differences (p < 0.05 and p < 0.01 respectively) among the treatments.
Table 2.
Overview of the digital gene expression profiling of the sequencing data.
| Sample | Raw Data Size (nt) | Raw Reads Number | Clean Data Size | Clean Reads Number | Clean Data Rate (%) | Total Mapped Reads (%) | Q20 (%) |
|---|---|---|---|---|---|---|---|
| JZ18-ck12h | 1206807650 | 24136153 | 1204621000 | 24092420 | 99.81 | 80.53 | 96.7 |
| JZ18-lk12h | 1206819150 | 24136383 | 1201320750 | 24026415 | 99.54 | 81.54 | 96.9 |
| JZ18-ck24h | 1206831700 | 24136634 | 1202634100 | 24052682 | 99.65 | 81.69 | 96.7 |
| JZ18-lk24h | 1206825700 | 24136514 | 1202777750 | 24055555 | 99.66 | 80.22 | 96.9 |
| JZ34-ck12h | 1206841700 | 24136834 | 1176860650 | 23537213 | 97.51 | 81.98 | 97.0 |
| JZ34-lk12h | 1206833100 | 24136662 | 1199255700 | 23985114 | 99.37 | 80.78 | 97.5 |
| JZ34-ck24h | 1206848550 | 24136971 | 1203941400 | 24078828 | 99.75 | 83.08 | 97.6 |
| JZ34-lk24h | 1206808900 | 24136178 | 1204460950 | 24089219 | 99.8 | 83.75 | 97.6 |
Table 3.
Expression levels of the housekeeping control genes at 12 h and 24 h.
| Housekeeping Gene | Gene ID | Treatment Time (h) | JZ18 Log2 Fold Change | FDR | Significant | JZ34 Log2 Fold Change | FDR | Significant |
|---|---|---|---|---|---|---|---|---|
| GAPDH | Solyc04g009030.2 | 12 | 0.01 | 1.00 | no | 0.02 | 1.00 | no |
| 24 | 0.03 | 1.00 | no | 0.02 | 1.00 | no | ||
| GAPDH | Solyc12g094640.1 | 12 | −0.10 | 1.00 | no | 0.00 | 0.99 | no |
| 24 | 0.81 | 1.00 | no | −0.76 | 1.00 | no | ||
| Catalase | Solyc02g082760.2 | 12 | 0.13 | 1.00 | no | 0.13 | 1.00 | no |
| 24 | 0.14 | 1.00 | no | 0.05 | 0.07 | no | ||
| Catalase | Solyc12g094620.1 | 12 | 0.49 | 1.00 | no | −0.27 | 1.00 | no |
| 24 | 0.72 | 1.00 | no | 0.21 | 1.00 | no | ||
| Cys protease | Solyc08g082400.1 | 12 | 0.05 | 0.83 | no | −0.14 | 0.15 | no |
| 24 | 0.15 | 0.24 | no | −0.31 | 1.00 | no | ||
| Cys protease | Solyc12g095910.1 | 12 | 0.24 | 1.00 | no | −0.12 | 1.00 | no |
| 24 | 0.04 | 0.70 | no | 0.26 | 1.00 | no | ||
| α-Tubulin | Solyc04g077020.2 | 12 | 0.15 | 1.00 | no | −0.03 | 0.23 | no |
| 24 | −0.06 | 0.11 | no | −0.04 | 0.12 | no | ||
| Ubiquitin | Solyc07g064130.1 | 12 | −0.16 | 1.00 | no | 0.00 | 0.86 | no |
| 24 | −0.05 | 1.00 | no | −0.22 | 1.00 | no | ||
| Actin | Solyc04g011500.2 | 12 | 0.04 | 0.75 | no | 0.13 | 0.19 | no |
| 24 | −0.07 | 0.27 | no | 0.05 | 0.41 | no | ||
| DNAJ chaperone | Solyc11g006460.1 | 12 | 0.19 | 1.00 | no | 0.04 | 0.25 | no |
| 24 | 0.03 | 0.36 | no | −0.02 | 0.71 | no | ||
| Translation initiation factor 5A | Solyc12g010060.1 | 12 | 0.12 | 1.00 | no | 0.11 | 1.00 | no |
| 24 | 0.01 | 0.87 | no | 0.24 | 1.00 | no |
Table 4.
Genes encoding protein transporters and kinases showed genotypic differences in response to K+-deficiency (0.5 mM) stress.
Table 4.
Genes encoding protein transporters and kinases showed genotypic differences in response to K+-deficiency (0.5 mM) stress.
| Group | Gene ID | log2 (Fold Change) | Seq Description | |||
|---|---|---|---|---|---|---|
| JZ18 | JZ34 | |||||
| 12 h | 24 h | 12 h | 24 h | |||
| potassium | Solyc11g011500 | 1.30 | Potassium channel | |||
| Solyc03g097930 | 1.06 | potassium channel SKOR-like | ||||
| Solyc01g010480 | 1.60 | Potassium voltage-gated channel | ||||
| Solyc12g009540 | −6.79 | KUP system potassium uptake protein | ||||
| Solyc07g014680 | −1.25 | Potassium transporter | ||||
| Nitrate | Solyc11g069760 | 1.36 | −2.69 | High affinity nitrate transporter protein | ||
| Solyc08g007430 | 1.23 | Nitrate transporter | ||||
| Solyc06g010250 | −2.20 | −1.85 | Nitrate transporter | |||
| Solyc00g090860 | 1.21 | −1.83 | Nitrate transporter | |||
| Solyc07g032490 | 1.10 | Nitrate transporter | ||||
| Solyc08g078950 | −1.18 | Nitrate transporter | ||||
| Solyc08g007430 | −1.23 | Nitrate transporter | ||||
| Solyc11g069750 | 1.70 | Nitrate transporter | ||||
| Solyc03g113250 | −1.15 | Nitrate transporter | ||||
| Solyc11g069740 | −1.56 | Nitrate transporter | ||||
| Yellow-strike | Solyc03g082620 | 2.10 | Metal-nicotianamine transporter | |||
| Mate | Solyc07g006740 | 1.63 | MATE efflux family protein | |||
| Solyc11g065820 | 1.13 | MATE efflux family protein | ||||
| Solyc03g026230 | 1.57 | MATE efflux family protein | ||||
| Solyc08g080310 | 1.12 | −1.32 | MATE efflux family protein | |||
| LRR | Solyc01g005870 | 1.74 | LRR receptor-like protein kinase | |||
| Solyc06g033920 | −1.01 | LRR receptor-like protein kinase | ||||
| Solyc01g009810 | −2.04 | LRR receptor-like protein kinase | ||||
| Solyc01g091230 | −1.20 | LRR receptor-like protein kinase | ||||
| Solyc01g098690 | 1.56 | LRR receptor-like protein kinase | ||||
| Solyc02g071820 | 1.57 | LRR receptor-like protein kinase | ||||
| Solyc03g005960 | −1.65 | LRR receptor-like protein kinase | ||||
| Solyc03g007050 | −1.41 | LRR receptor-like protein kinase | ||||
| Solyc04g014400 | −1.16 | 1.74 | LRR receptor-like protein kinase | |||
| Solyc04g014900 | −1.06 | LRR receptor-like protein kinase | ||||
| Solyc04g054450 | −1.66 | LRR receptor-like protein kinase | ||||
| Solyc04g074000 | −1.10 | −1.97 | 3.67 | LRR receptor-like protein kinase | ||
| Solyc04g074020 | −1.73 | LRR receptor-like protein kinase | ||||
| Solyc04g074030 | −3.12 | 5.49 | LRR receptor-like protein kinase | |||
| Solyc04g074050 | −2.08 | 2.11 | LRR receptor-like protein kinase | |||
| Solyc04g081080 | −1.10 | LRR receptor-like protein kinase | ||||
| Solyc06g006020 | −2.89 | −1.23 | LRR receptor-like protein kinase | |||
| Solyc09g014480 | 1.14 | LRR receptor-like protein kinase | ||||
| Solyc09g082530 | −1.15 | LRR receptor-like protein kinase | ||||
| Solyc10g007830 | −3.32 | LRR receptor-like protein kinase | ||||
| Solyc12g009730 | −1.43 | LRR receptor-like protein kinase | ||||
| Solyc12g009750 | −1.43 | LRR receptor-like protein kinase | ||||
| Solyc12g009780 | −3.56 | 2.25 | LRR receptor-like protein kinase | |||
| Solyc11g011180 | 2.83 | LRR receptor-like protein kinase | ||||
| CRK | Solyc01g006390 | 2.60 | −5.03 | Cysteine-rich receptor-like protein kinase | ||
| Solyc03g111530 | −4.90 | Cysteine-rich receptor-like protein kinase | ||||
| Solyc11g006430 | −2.52 | −1.29 | Cysteine-rich receptor-like protein kinase | |||
| Solyc07g005110 | 1.34 | Cysteine-rich receptor-like protein kinase | ||||
| Solyc05g018930 | −2.59 | Cysteine-rich receptor-like protein kinase | ||||
Table 5.
H2O2 and O2− levels in the leaves and roots of JZ18 and JZ34 under K+-deficiency stress conditions at 0 h, 12 h, 24 h, 3 d, and 7 d. K+ represents normal K+ (4 mM); K− represents K+ deficiency (0.5 mM). The experiments were repeated three times.
Table 5.
H2O2 and O2− levels in the leaves and roots of JZ18 and JZ34 under K+-deficiency stress conditions at 0 h, 12 h, 24 h, 3 d, and 7 d. K+ represents normal K+ (4 mM); K− represents K+ deficiency (0.5 mM). The experiments were repeated three times.
| H2O2 Concentration/nmol·min−1·g−1 FW | O2− Concentration/nmol·min−1·g−1 FW | |||||||
|---|---|---|---|---|---|---|---|---|
| JZ18K+ | JZ18K− | JZ34K+ | JZ34K− | JZ18K+ | JZ18K− | JZ34K+ | JZ34K− | |
| Leaf | ||||||||
| 0 h | 31.07 ± 1.73 | 30.66 ± 2.35 | 19.02 ± 1.42 | 19.33 ± 1.43 | 3.91 ± 0.06 | 3.89 ± 0.22 | 3.07 ± 0.05 | 3.21 ± 0.25 |
| 12 h | 30.88 ± 1.09 | 40.10 ± 2.07 ** | 22.00 ± 1.47 | 22.66 ± 1.67 | 3.80 ± 0.14 | 4.72 ± 0.15 * | 2.88 ± 0.14 | 2.87 ± 0.24 |
| 24 h | 31.01 ± 1.33 | 33.40 ± 2.31 | 21.16 ± 2.00 | 23.97 ± 2.05 | 3.49 ± 0.21 | 4.43 ± 0.20 * | 2.66 ± 0.04 | 2.46 ± 0.12 |
| 3 d | 32.00 ± 1.68 | 36.73 ± 0.66 | 18.62 ± 1.01 | 18.12 ± 2.01 | 3.58 ± 0.24 | 4.14 ± 0.24 | 2.78 ± 0.17 | 2.44 ± 0.10 |
| 7 d | 31.58 ± 0.77 | 34.95 ± 2.55 | 19.45 ± 1.65 | 19.11 ± 2.23 | 3.70 ± 0.20 | 4.38 ± 0.12 | 2.87 ± 0.15 | 2.70 ± 0.17 |
| Root | ||||||||
| 0 h | 6.45 ± 0.17 | 6.62 ± 0.13 | 4.42 ± 0.21 | 4.44 ± 0.04 | 0.96 ± 0.03 | 0.88 ± 0.04 | 0.83 ± 0.03 | 0.84 ± 0.02 |
| 12 h | 5.98 ± 0.25 | 8.79 ± 0.25 ** | 4.86 ± 0.23 | 4.25 ± 0.14 | 0.71 ± 0.03 | 1.06 ± 0.04 ** | 0.77 ± 0.05 | 0.70 ± 0.04 |
| 24 h | 6.66 ± 0.18 | 7.75 ± 0.16 * | 3.66 ± 0.16 | 4.07 ± 0.13 | 0.66 ± 0.04 | 0.73 ± 0.01 | 0.75 ± 0.02 | 0.87 ± 0.01 * |
| 3 d | 6.10 ± 0.23 | 6.29 ± 0.09 | 3.78 ± 0.09 | 3.65 ± 0.16 | 0.70 ± 0.02 | 0.75 ± 0.03 | 0.71 ± 0.01 | 0.74 ± 0.03 |
| 7 d | 6.98 ± 0.03 | 7.24 ± 0.11 | 3.62 ± 0.19 | 3.76 ± 0.03 | 0.74 ± 0.04 | 0.77 ± 0.03 | 0.73 ± 0.02 | 0.66 ± 0.01 |
* and ** denote significant differences at p < 0.05 and 0.01, respectively.
Table 6.
Folds change of DEGs related to hormone signaling in response to K+-deficiency (0.5 mM) stress.
Table 6.
Folds change of DEGs related to hormone signaling in response to K+-deficiency (0.5 mM) stress.
| Transcript ID | JZ18-12 h | JZ18-24 h | JZ34-12 h | JZ34-24 h | Seq Description |
|---|---|---|---|---|---|
| Solyc01g068410 | −2.65 | 2.83 | Auxin Efflux Carrier | ||
| Solyc10g080880 | −1.00 | Auxin Efflux Carrier | |||
| Solyc04g056620 | 2.11 | Auxin Efflux Carrier | |||
| Solyc07g006900 | 1.14 | 1.13 | Auxin Efflux Carrier | ||
| Solyc02g082450 | −1.63 | Auxin Efflux Carrier | |||
| Solyc12g042980 | 1.83 | Gibberellin 20-oxidase | |||
| Solyc03g006880 | 1.14 | Gibberellin 20-oxidase-1 | |||
| Solyc11g072310 | 1.55 | Gibberellin 20-oxidase-3 | |||
| Solyc03g025490 | 1.44 | Gibberellin 20-oxidase-like protein | |||
| Solyc06g066820 | −1.51 | Gibberellin 3-beta-hydroxylase | |||
| Solyc07g056670 | 1.74 | Gibberellin 3-oxidase | |||
| Solyc12g042980 | −3.27 | Gibberellin 3-beta-dioxygenase | |||
| Solyc00g138060 | 1.91 | 1.35 | Gibberellin 2-oxidase | ||
| Solyc01g090630 | −1.04 | Gibberellin 2-oxidase | |||
| Solyc01g079200 | 2.57 | Gibberellin 2-oxidase | |||
| Solyc02g080120 | 1.36 | 1.89 | Gibberellin 2-beta-dioxygenase | ||
| Solyc02g070430 | 1.11 | Gibberellin 2-oxidase 1 | |||
| Solyc06g076550 | −1.54 | Cytokinin-N-glucosyltransferase | |||
| Solyc04g074380 | −2.12 | Cytokinin-N-glucosyltransferase | |||
| Solyc10g085280 | 1.18 | Cytokinin-N-glucosyltransferase | |||
| Solyc12g057080 | −1.39 | Cytokinin-N-glucosyltransferase | |||
| Solyc12g008900 | −4.91 | Cytokinin dehydrogenase 1 | |||
| Solyc10g017990 | −7.65 | Cytokinin dehydrogenase 1 | |||
| Solyc02g079440 | 1.47 | 1.04 | Cytokinin dehydrogenase | ||
| Solyc06g082730 | 1.42 | Cytokinin trans-hydroxylase | |||
| Solyc09g089580 | −1.49 | −1.31 | Ethylene metabolic process | ||
| Solyc02g091990 | 2.15 | Ethylene metabolic process | |||
| Solyc07g049530 | −1.00 | Ethylene metabolic process | |||
| Solyc09g091550 | −2.9 | 2.44 | Salicylic acid carboxyl methyltransferase | ||
| Solyc09g091540 | 6.92 | Salicylic acid carboxyl methyltransferase |
Table 7.
Fold changes of DEGs related to glycometabolism in response to K+-deficiency (0.5 mM) stress.
Table 7.
Fold changes of DEGs related to glycometabolism in response to K+-deficiency (0.5 mM) stress.
| Transcript ID | JZ18-12 h | JZ18-24 h | JZ34-12 h | JZ34-24 h | Seq Description |
|---|---|---|---|---|---|
| Solyc03g097560 | −6.82 | bidirectional sugar transporter SWEET14 | |||
| Solyc03g097600 | 1.40 | 1.69 | bidirectional sugar transporter SWEET10-like | ||
| Solyc06g072620 | 1.24 | bidirectional sugar transporter SWEET10-like | |||
| Solyc03g097610 | 1.22 | bidirectional sugar transporter SWEET10 | |||
| Solyc06g060590 | 1.41 | bidirectional sugar transporter SWEET1 | |||
| Solyc01g080680 | 1.01 | 1.04 | Glucose transporter 8 | ||
| Solyc06g054270 | 1.05 | Solute carrier family 2 Sugar/inositol transporter | |||
| Solyc09g075820 | 1.81 | Solute carrier family 2 Sugar/inositol transporter | |||
| Solyc11g067340 | 1.02 | Acyltransferase (Fragment) | |||
| Solyc09g092130 | 1.24 | −1.58 | Sucrose phosphate synthase | ||
| Solyc08g066100 | 6.22 | ATP-dependent 6-phosphofructokinase | |||
| Solyc12g009300 | 2.68 | Sucrose synthase | |||
| Solyc08g079080 | −1.33 | 1.17 | vacuolar invertase, Lin9 | ||
| Solyc02g086530 | −3.08 | Alpha-galactosidase |
© 2018 by the authors. Licensee MDPI, Basel, Switzerland. This article is an open access article distributed under the terms and conditions of the Creative Commons Attribution (CC BY) license (http://creativecommons.org/licenses/by/4.0/).
Share and Cite
MDPI and ACS Style
Zhao, X.; Liu, Y.; Liu, X.; Jiang, J. Comparative Transcriptome Profiling of Two Tomato Genotypes in Response to Potassium-Deficiency Stress. Int. J. Mol. Sci. 2018, 19, 2402. https://doi.org/10.3390/ijms19082402
AMA Style
Zhao X, Liu Y, Liu X, Jiang J. Comparative Transcriptome Profiling of Two Tomato Genotypes in Response to Potassium-Deficiency Stress. International Journal of Molecular Sciences. 2018; 19(8):2402. https://doi.org/10.3390/ijms19082402
Chicago/Turabian StyleZhao, Xiaoming, Yang Liu, Xin Liu, and Jing Jiang. 2018. "Comparative Transcriptome Profiling of Two Tomato Genotypes in Response to Potassium-Deficiency Stress" International Journal of Molecular Sciences 19, no. 8: 2402. https://doi.org/10.3390/ijms19082402
Note that from the first issue of 2016, this journal uses article numbers instead of page numbers. See further details here.