Trans-Ethnic Mapping of BANK1 Identifies Two Independent SLE-Risk Linkage Groups Enriched for Co-Transcriptional Splicing Marks

 , , ,
, , ,
Abstract
:1. Introduction
2. Results
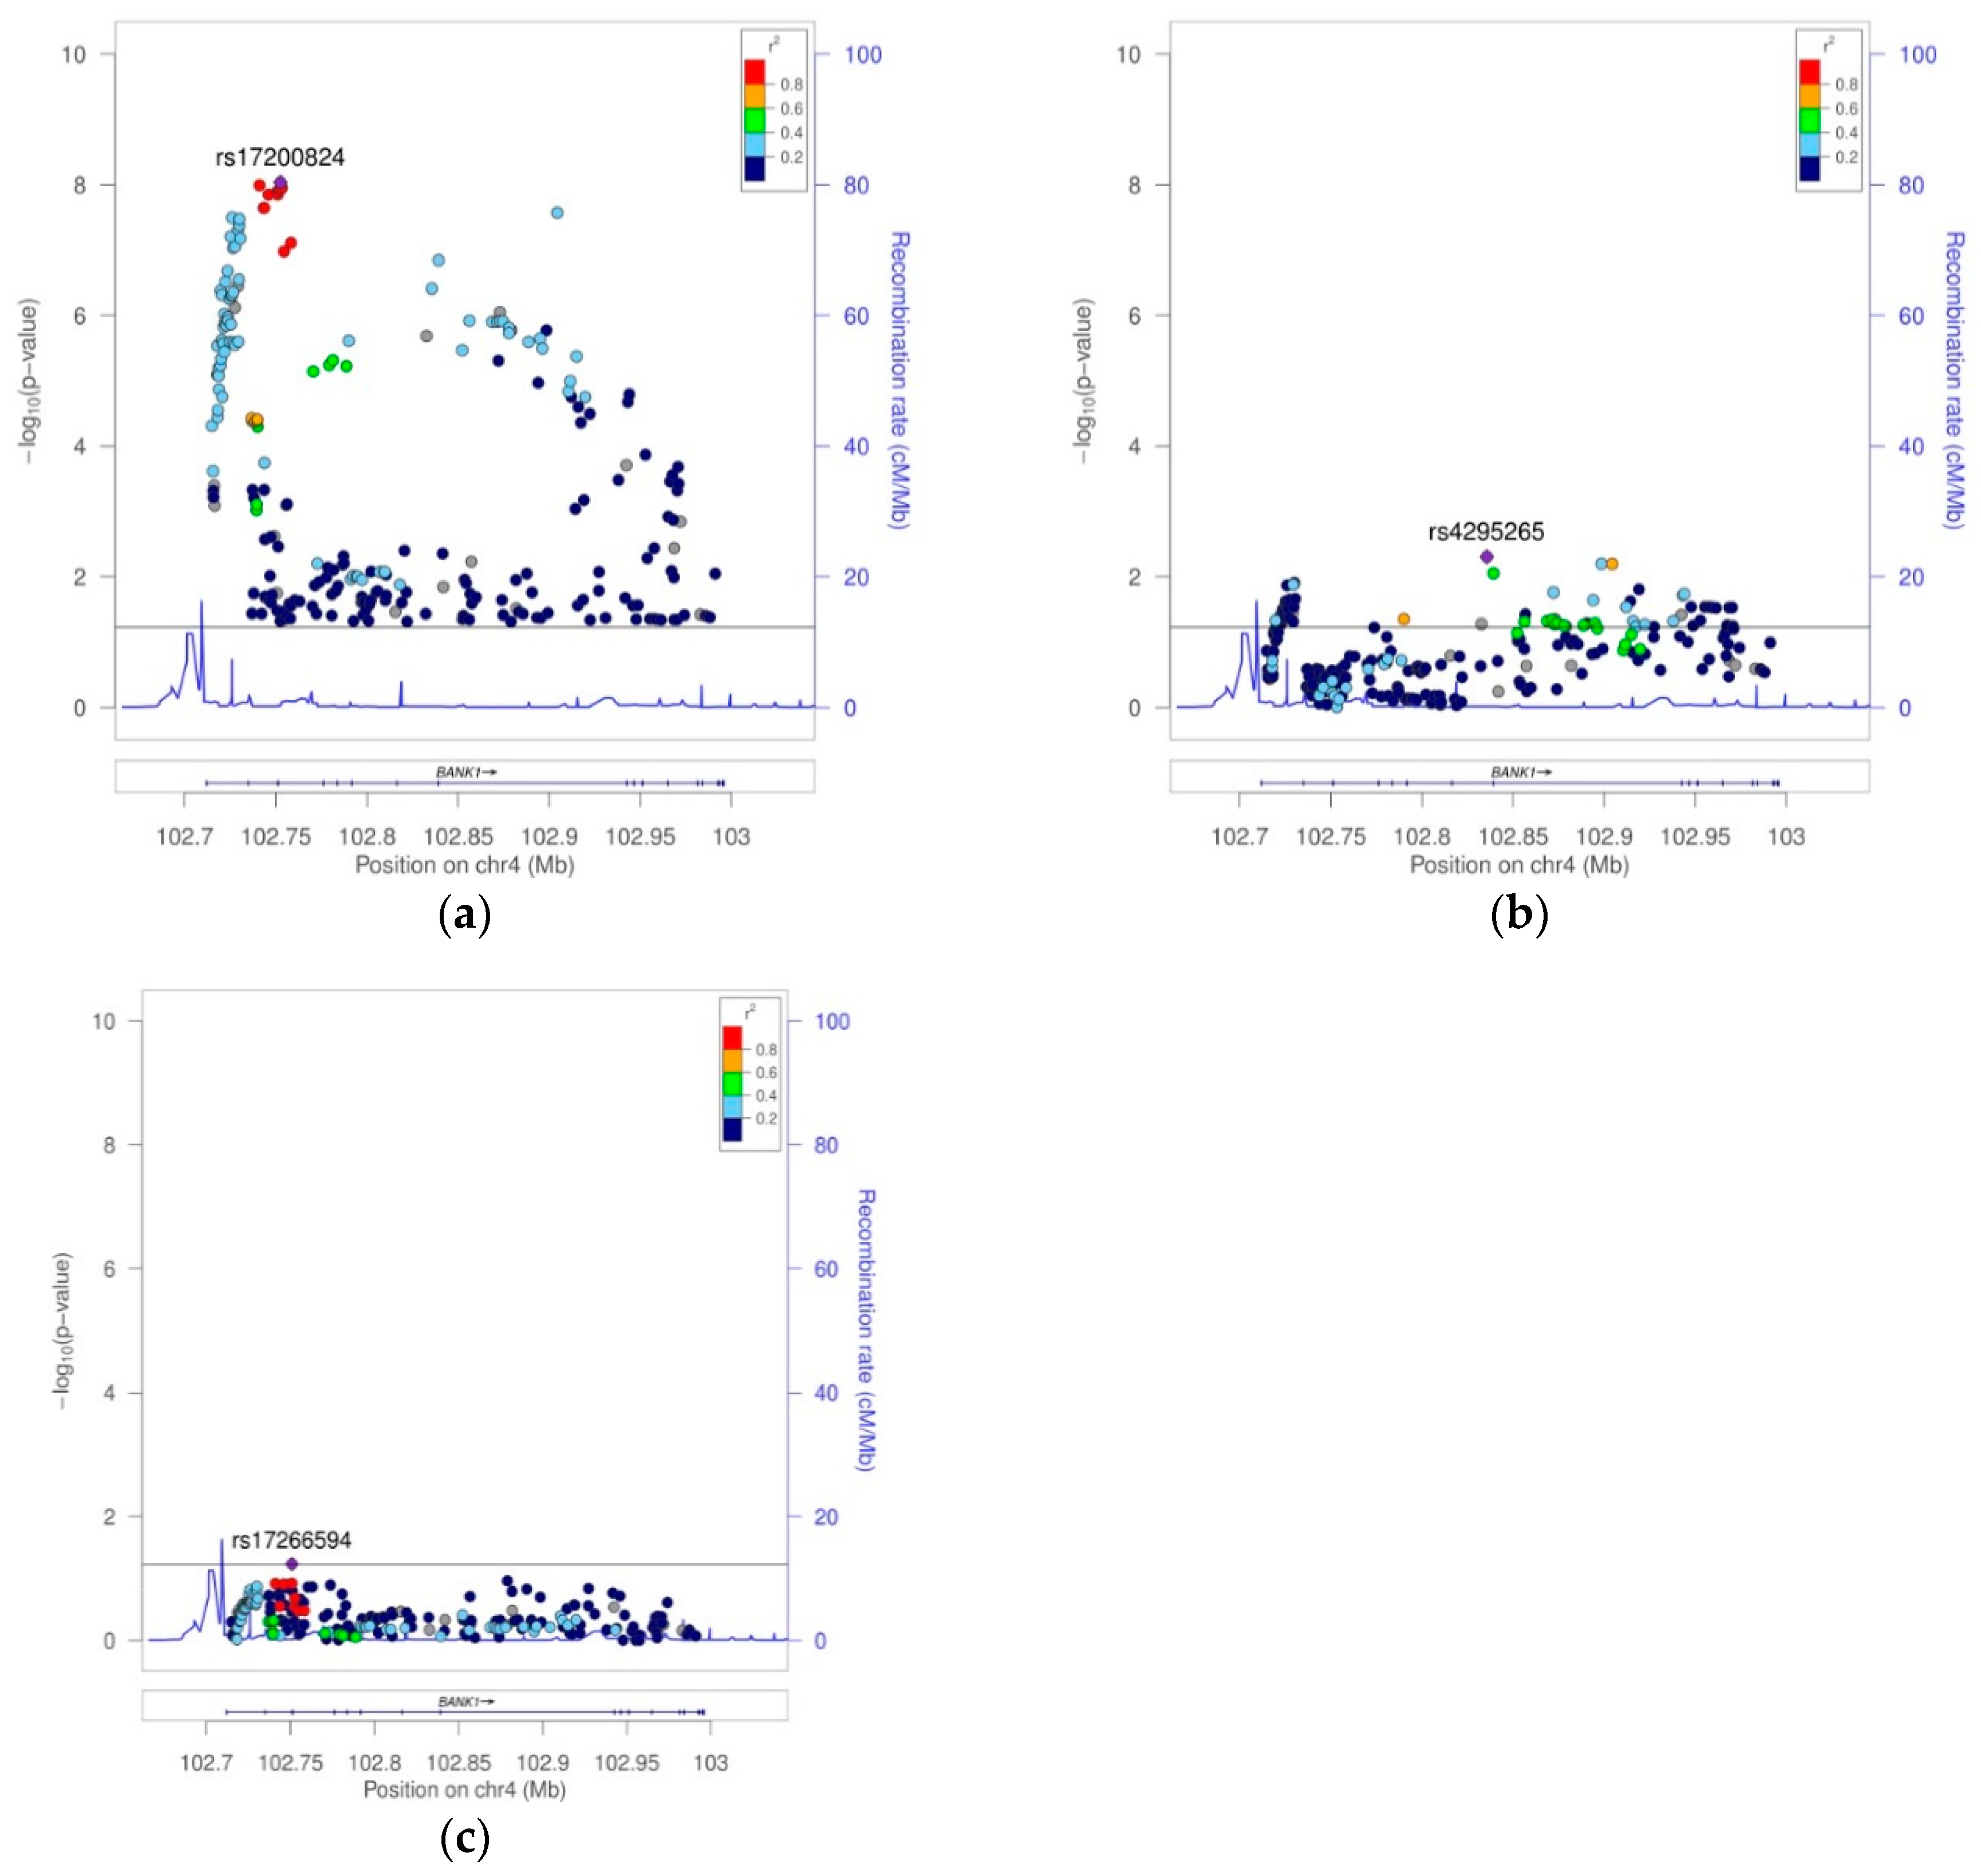
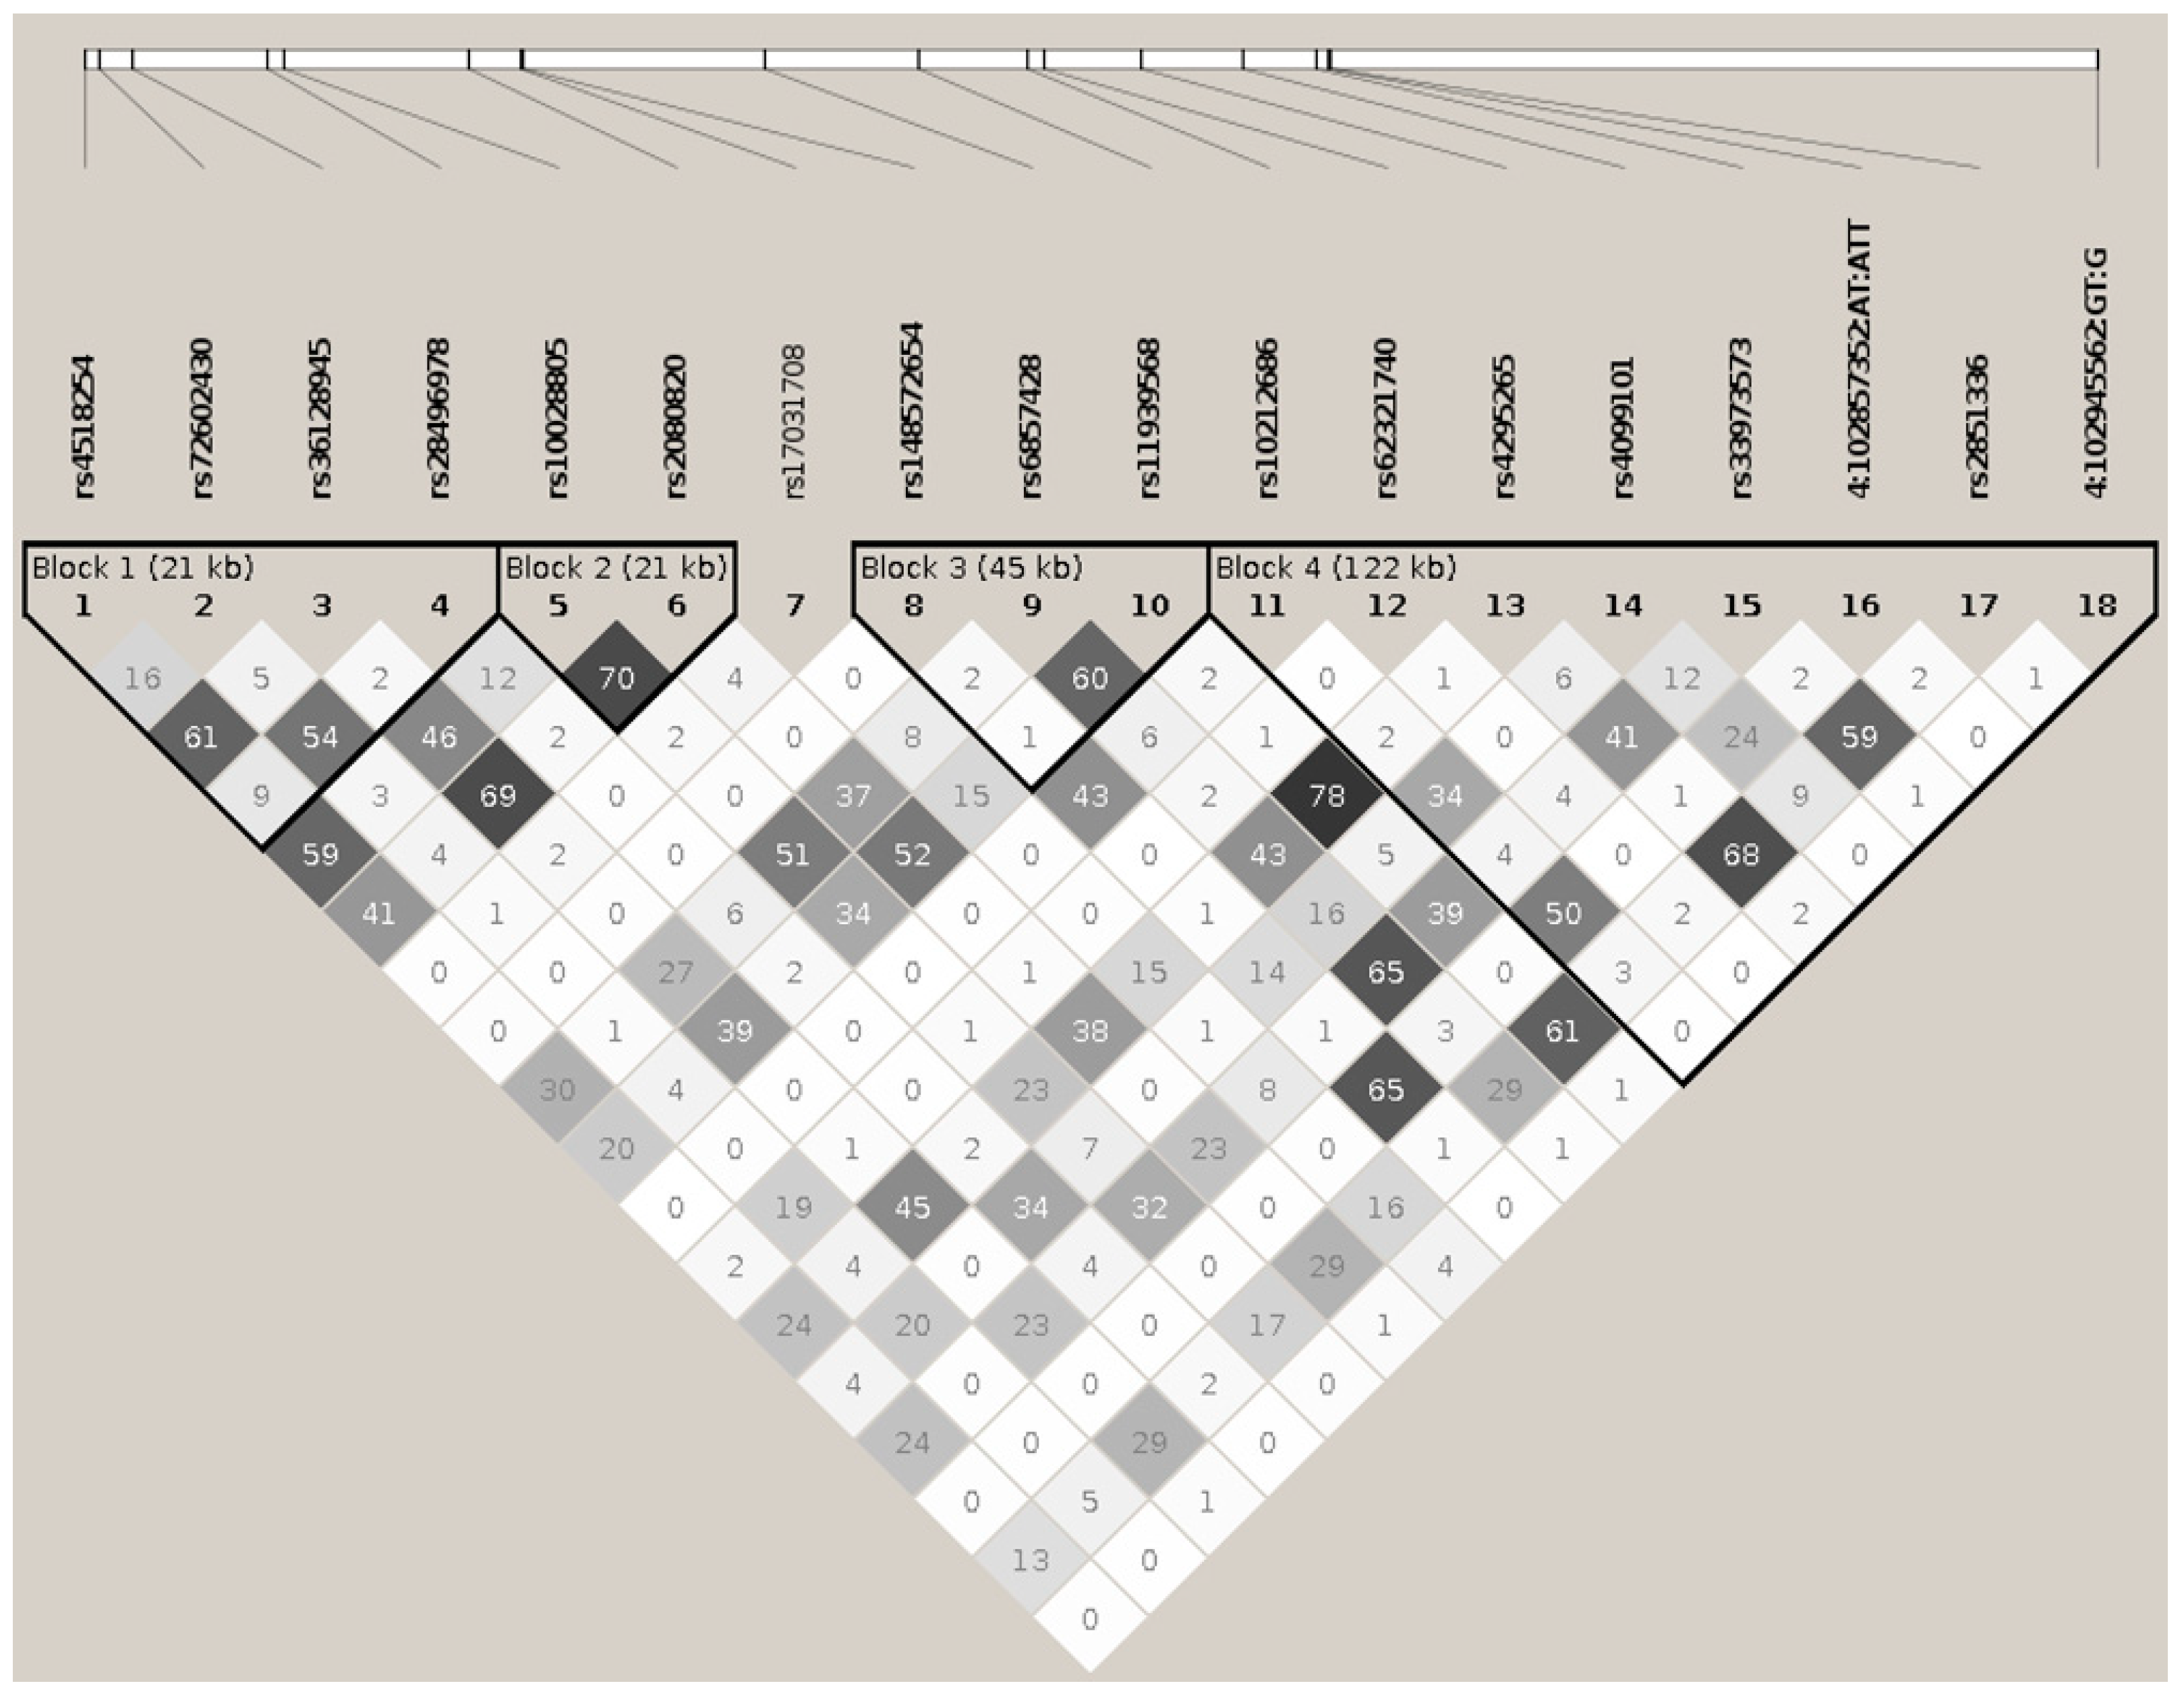
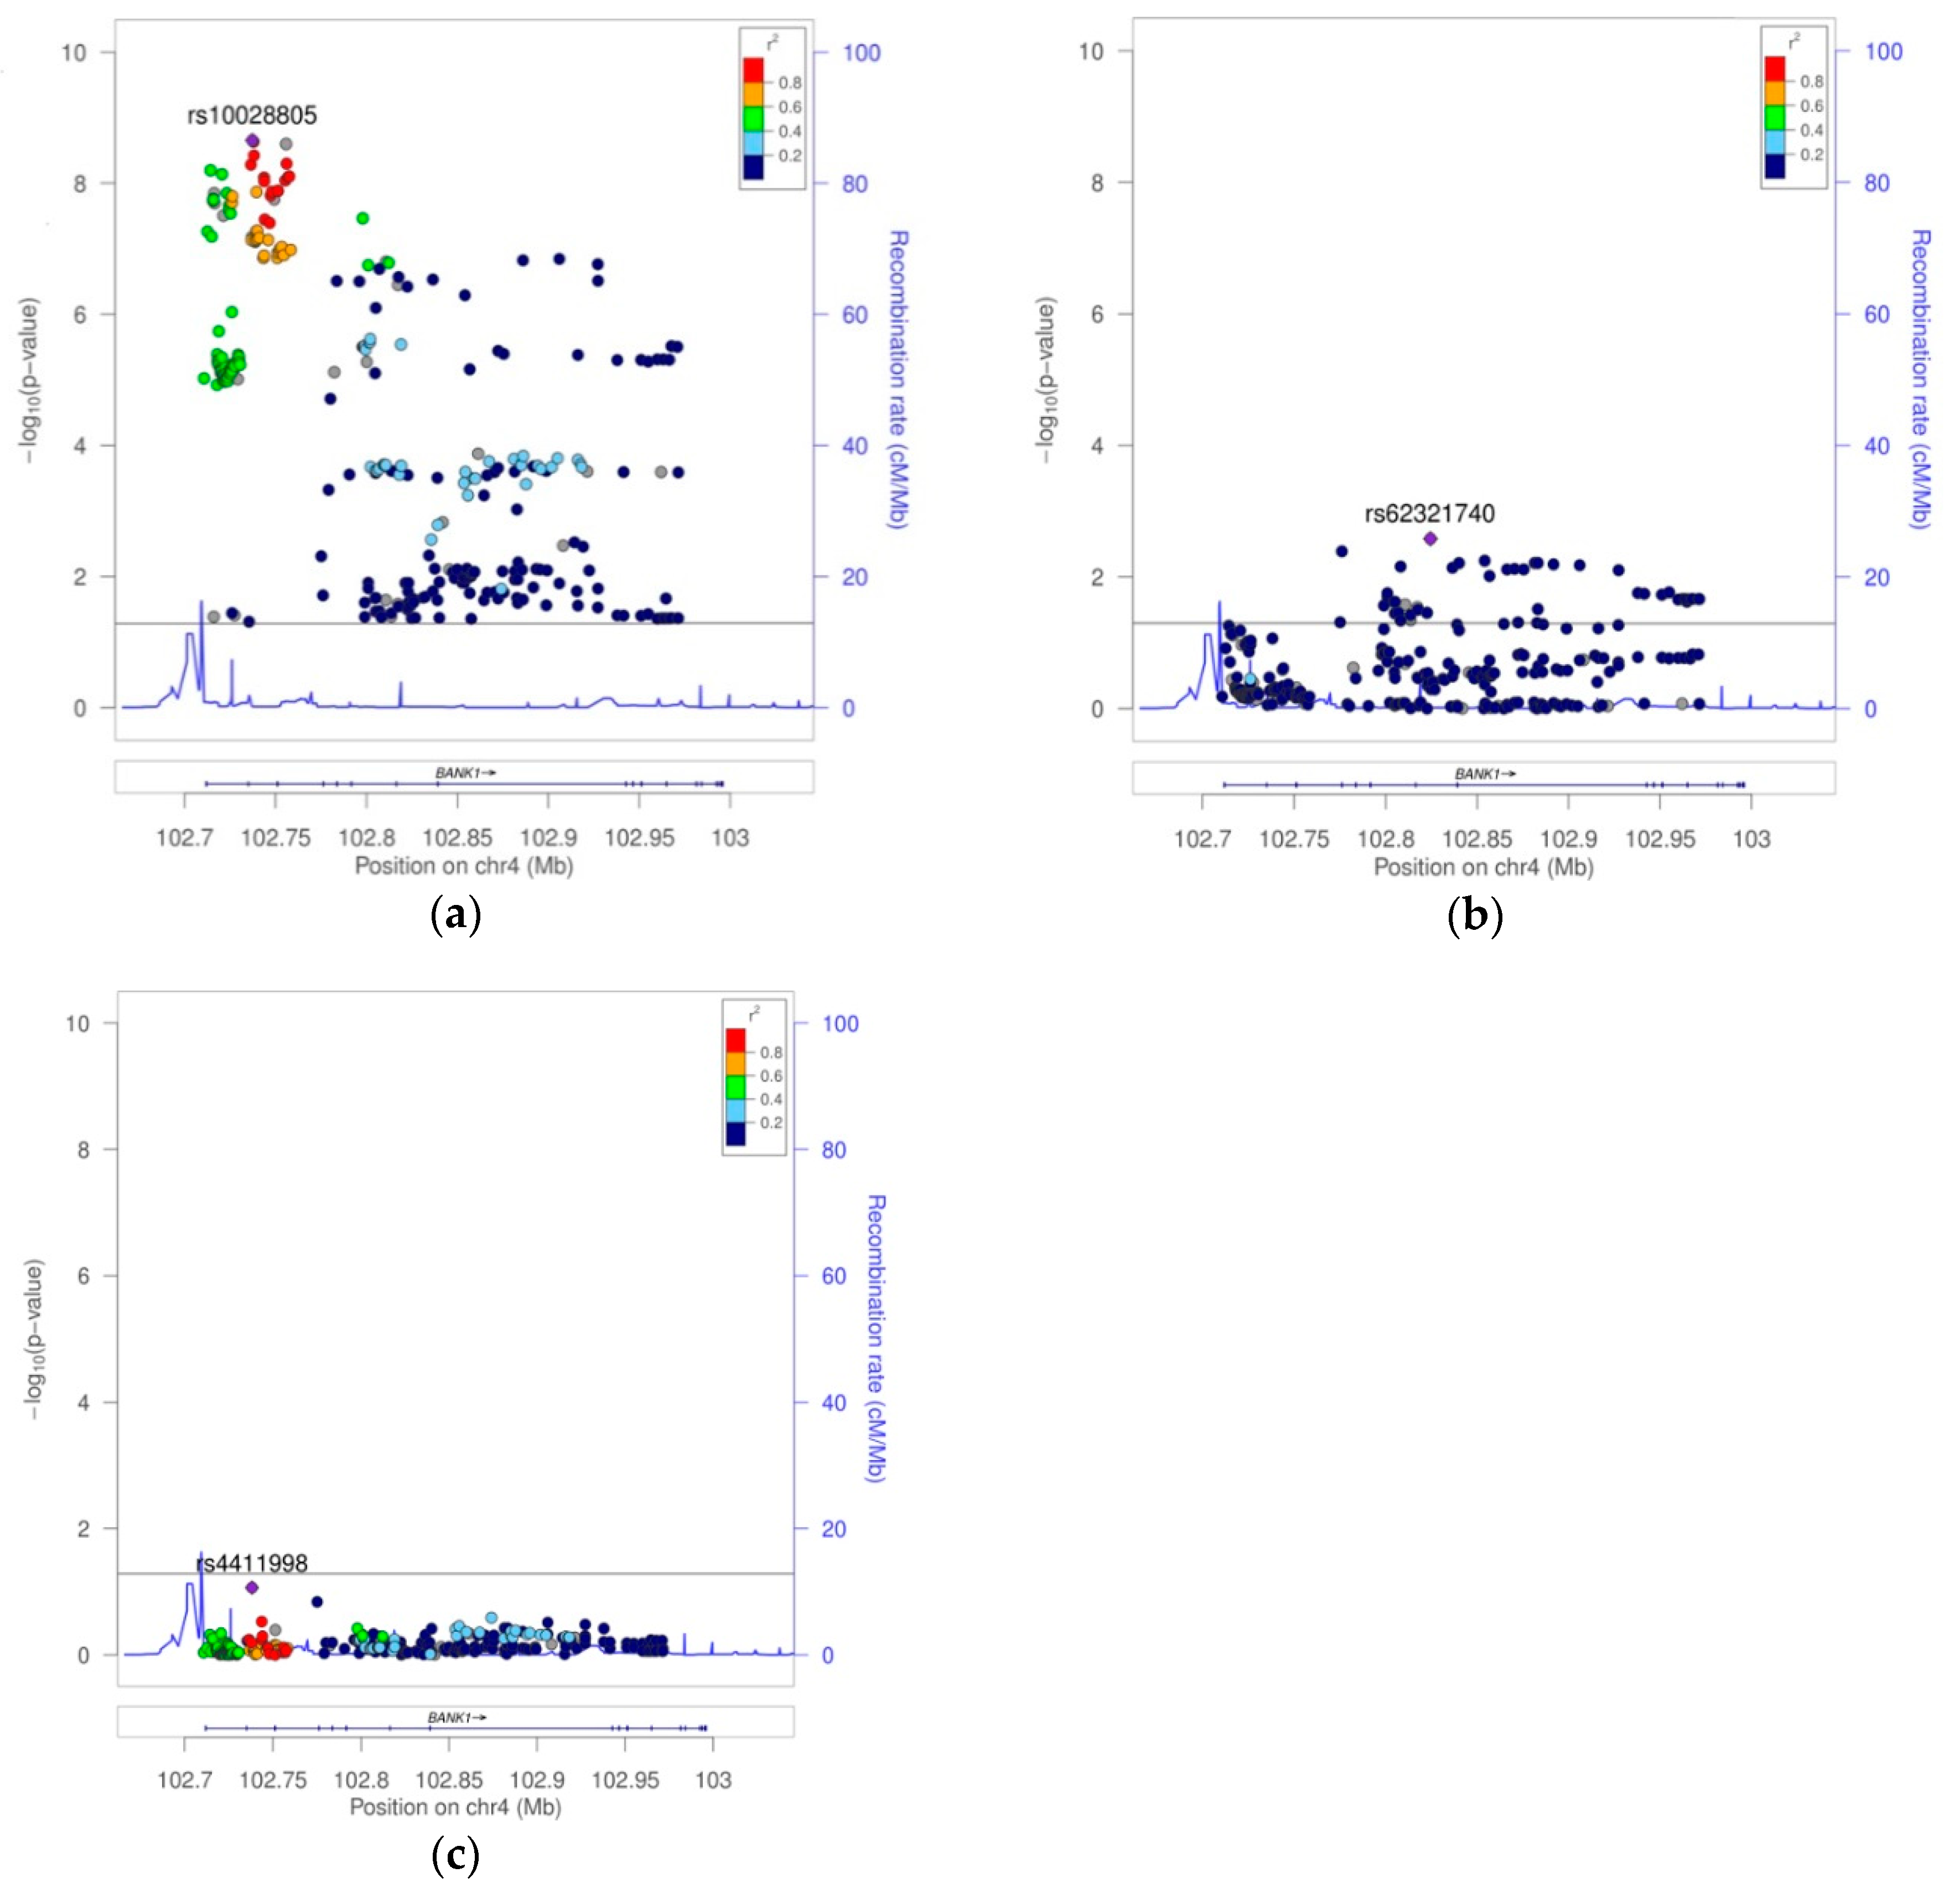
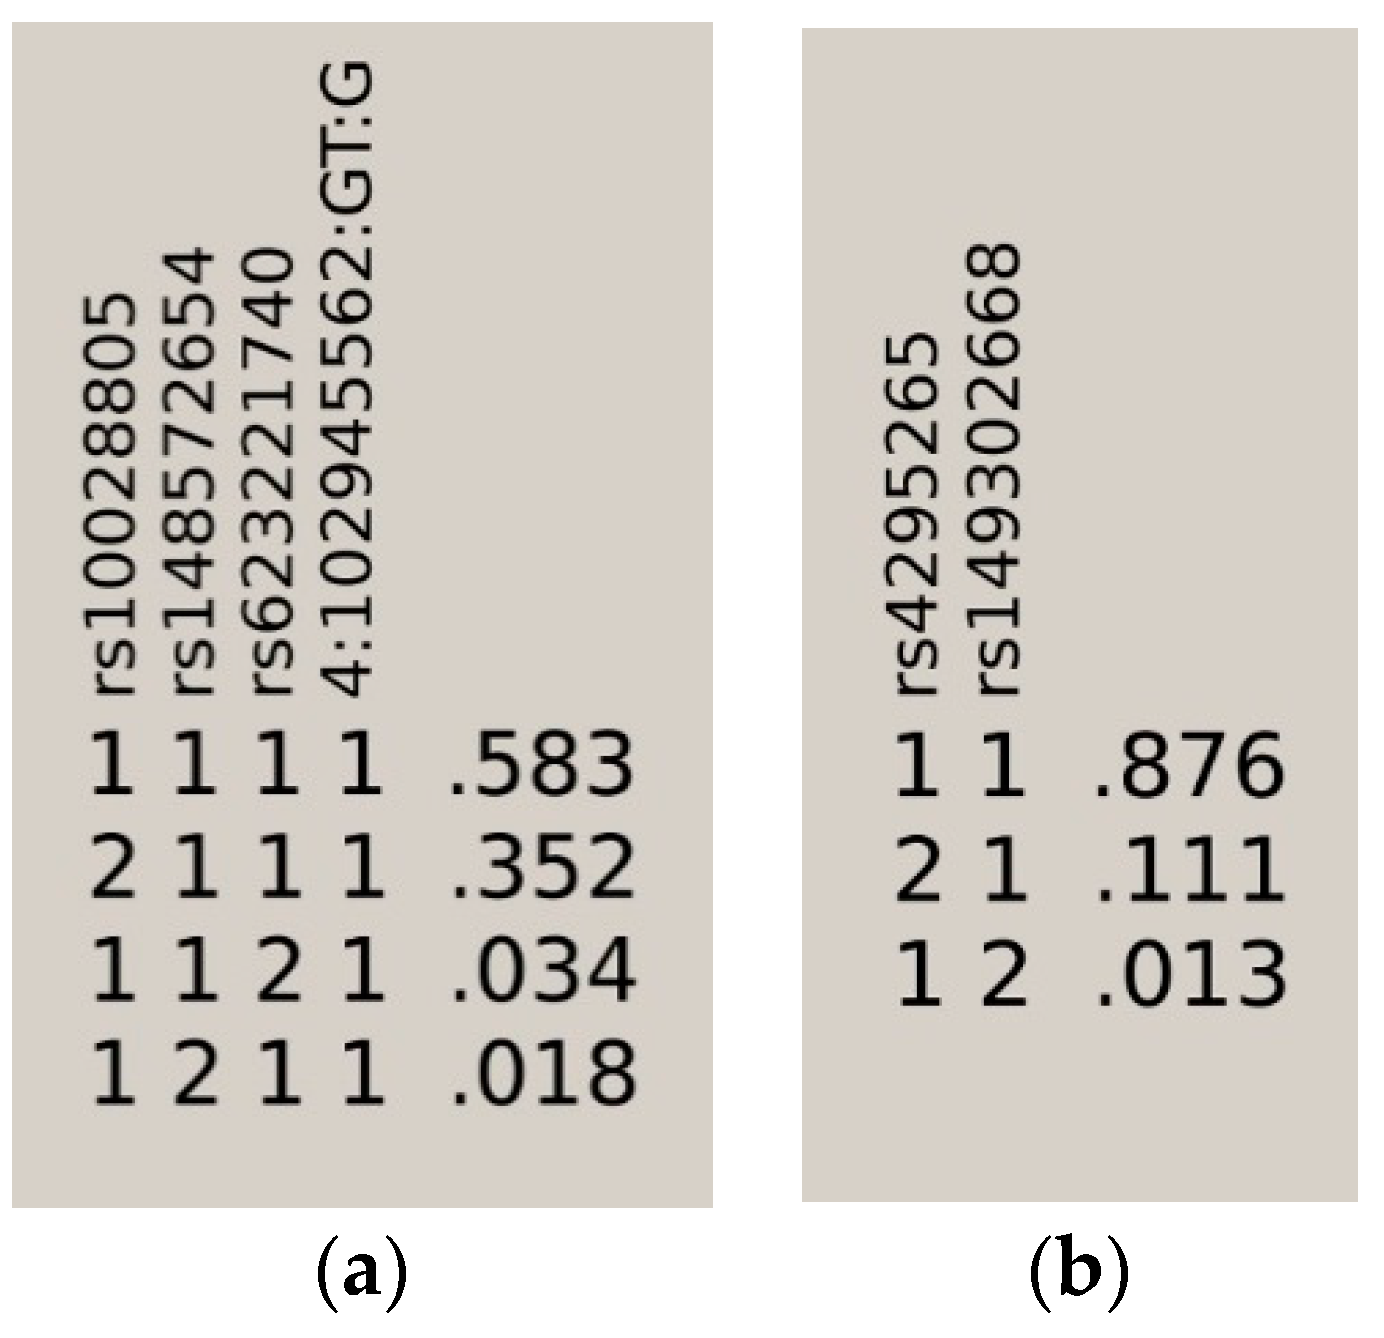
BANK1 Transethnic Finemapping
3. Discussion
4. Materials and Methods
4.1. Sample Collection and Genotyping
4.2. Data Filtering
4.3. Stratification Analysis
4.4. Statistical Analyses
4.5. eQTL/meQTL Analysis
4.6. Annotation Analysis
5. Conclusions
Supplementary Materials
Author Contributions
Funding
Conflicts of Interest
Abbreviations
| AA | African Americans |
| eQTL | expression quantitative trait locus |
| EUR | Europeans |
| GWAS | genome-wide association study |
| meQTL | methylation quantitative trait locus |
| LD | Linkage disequilibrium |
| OR | Odds ratio |
| SLE | Systemic lupus erythematosus |
| SNP | single nucleotide polymorphism |
References
- Kozyrev, S.V.; Abelson, A.K.; Wojcik, J.; Zaghlool, A.; Linga Reddy, M.V.; Sanchez, E.; Gunnarsson, I.; Svenungsson, E.; Sturfelt, G.; Jönsen, A.; et al. Functional variants in the B-cell gene BANK1 are associated with systemic lupus erythematosus. Nat. Genet. 2008, 40, 211–216. [Google Scholar] [CrossRef] [PubMed]
- Yokoyama, K.; Su, I.H.; Tezuka, T.; Yasuda, T.; Mikoshiba, K.; Tarakhovsky, A.; Yamamoto, T. BANK regulates BCR-induced calcium mobilization by promoting tyrosine phosphorylation of IP(3) receptor. EMBO J. 2002, 21, 83–92. [Google Scholar] [CrossRef] [PubMed]
- Aiba, Y.; Yamazaki, T.; Okada, T.; Gotoh, K.; Sanjo, H.; Ogata, M.; Kurosaki, T. BANK negatively regulates Akt activation and subsequent B cell responses. Immunity 2006, 24, 259–268. [Google Scholar] [CrossRef] [PubMed]
- Troutman, T.D.; Hu, W.; Fulenchek, S.; Yamazaki, T.; Kurosaki, T.; Bazan, J.F.; Pasare, C. Role for B-cell adapter for PI3K (BCAP) as a signaling adapter linking Toll-like receptors (TLRs) to serine/threonine kinases PI3K/Akt. Proc. Nat. Acad. Sci. USA 2012, 109, 273–278. [Google Scholar] [CrossRef] [PubMed]
- Wu, Y.Y.; Kumar, R.; Haque, M.S.; Castillejo-Lopez, C.; Alarcon-Riquelme, M.E. BANK1 controls CpG-Induced IL-6 secretion via a p38 and MNK1/2/eIF4E translation initiation pathway. J. Immunol. 2013, 191, 6110–6116. [Google Scholar] [CrossRef] [PubMed]
- Wu, Y.Y.; Kumar, R.; Iida, R.; Bagavant, H.; Alarcon-Riquelme, M.E. BANK1 regulates IgG production in a lupus model by controlling TLR7-dependent STAT1 activation. PLoS ONE 2016, 11, e0156302. [Google Scholar] [CrossRef] [PubMed]
- Kozyrev, S.V.; Bernal-Quiros, M.; Alarcon-Riquelme, M.E.; Castillejo-Lopez, C. The dual effect of the lupus-associated polymorphism rs10516487 on BANK1 gene expression and protein localization. Genes Immun. 2012, 13, 129–138. [Google Scholar] [CrossRef] [PubMed]
- Curado, J.; Iannone, C.; Tilgner, H.; Valcarcel, J.; Guigo, R. Promoter-like epigenetic signatures in exons displaying cell type-specific splicing. Genome Biol. 2015, 16. [Google Scholar] [CrossRef] [PubMed]
- Zhernakova, D.V.; Deelen, P.; Vermaat, M.; van Iterson, M.; van Galen, M.; Arindrarto, W.; van’t Hof, P.; Mei, H.; van Dijk, F.; Westra, H.J.; et al. Identification of context-dependent expression quantitative trait loci in whole blood. Nat. Genet. 2017, 49, 139–145. [Google Scholar] [CrossRef] [PubMed]
- Ferreira, P.G.; Oti, M.; Barann, M.; Wieland, T.; Ezquina, S.; Friedlander, M.R.; Rivas, M.A.; Esteve-Codina, A.; The Geuvadis Consortium; Rosenstiel, P.; et al. Sequence variation between 462 human individuals fine-tunes functional sites of RNA processing. Sci. Rep. 2016, 6, 32406. [Google Scholar] [CrossRef] [PubMed]
- Raj, P.; Rai, E.; Song, R.; Khan, S.; Wakeland, B.E.; Viswanathan, K.; Arana, C.; Liang, C.; Zhang, B.; Dozmorov, I.; et al. Regulatory polymorphisms modulate the expression of HLA class II molecules and promote autoimmunity. eLife 2016, 5. [Google Scholar] [CrossRef] [PubMed] [Green Version]
- Bentham, J.; Morris, D.L.; Cunninghame Graham, D.S.; Pinder, C.L.; Tombleson, P.; Behrens, T.W.; Martín, J.; Fairfax, B.P.; Knight, J.C.; Chen, L.; et al. Genetic association analyses implicate aberrant regulation of innate and adaptive immunity genes in the pathogenesis of systemic lupus erythematosus. Nat. Genet. 2015, 47, 1457–1464. [Google Scholar] [CrossRef] [PubMed] [Green Version]
- Alarcon-Riquelme, M.E. A RUNX trio with a taste for autoimmunity. Nat. Genet. 2003, 35, 299–300. [Google Scholar] [CrossRef] [PubMed]
- Brady, G.; Whiteman, H.J.; Spender, L.C.; Farrell, P.J. Downregulation of RUNX1 by RUNX3 requires the RUNX3 VWRPY sequence and is essential for Epstein-Barr virus-driven B-cell proliferation. J. Virol. 2009, 83, 6909–6916. [Google Scholar] [CrossRef] [PubMed]
- Spender, L.C.; Whiteman, H.J.; Karstegl, C.E.; Farrell, P.J. Transcriptional cross-regulation of RUNX1 by RUNX3 in human B cells. Oncogene 2005, 24, 1873–1881. [Google Scholar] [CrossRef] [PubMed] [Green Version]
- James, J.A.; Neas, B.R.; Moser, K.L.; Hall, T.; Bruner, G.R.; Sestak, A.L.; Harley, J.B. Systemic lupus erythematosus in adults is associated with previous Epstein-Barr virus exposure. Arthritis Rheum. 2001, 44, 1122–1126. [Google Scholar] [CrossRef] [Green Version]
- Moon, U.Y.; Park, S.J.; Oh, S.T.; Kim, W.U.; Park, S.H.; Lee, S.H.; Cho, C.-S.; Kim, H.Y.; Lee, W.-K.; Lee, S.K. Patients with systemic lupus erythematosus have abnormally elevated Epstein-Barr virus load in blood. Arthritis Res. Ther. 2004, 6, R295–R302. [Google Scholar] [CrossRef] [PubMed] [Green Version]
- Caganova, M.; Carrisi, C.; Varano, G.; Mainoldi, F.; Zanardi, F.; Germain, P.L.; George, L.; Alberghini, F.; Ferrarini, L.; Talukder, A.K.; et al. Germinal center dysregulation by histone methyltransferase EZH2 promotes lymphomagenesis. J. Clin. Investig. 2013, 123, 5009–5022. [Google Scholar] [CrossRef] [PubMed] [Green Version]
- Luco, R.F.; Allo, M.; Schor, I.E.; Kornblihtt, A.R.; Misteli, T. Epigenetics in alternative pre-mRNA splicing. Cell 2011, 144, 16–26. [Google Scholar] [CrossRef] [PubMed]
- Luco, R.F.; Pan, Q.; Tominaga, K.; Blencowe, B.J.; Pereira-Smith, O.M.; Misteli, T. Regulation of alternative splicing by histone modifications. Science 2010, 327, 996–1000. [Google Scholar] [CrossRef] [PubMed]
- Patel, N.A.; Chalfant, C.E.; Watson, J.E.; Wyatt, J.R.; Dean, N.M.; Eichler, D.C.; Cooper, D.R. Insulin regulates alternative splicing of protein kinase C beta II through a phosphatidylinositol 3-kinase-dependent pathway involving the nuclear serine/arginine-rich splicing factor, SRp40, in skeletal muscle cells. J. Biol. Chem. 2001, 276, 22648–22654. [Google Scholar] [CrossRef] [PubMed]
- Sanchez, E.; Nadig, A.; Richardson, B.C.; Freedman, B.I.; Kaufman, K.M.; Kelly, J.A.; Niewold, T.B.; Kamen, D.L.; Gilkeson, G.S.; Ziegler, J.T.; et al. Phenotypic associations of genetic susceptibility loci in systemic lupus erythematosus. Ann. Rheum. Dis. 2011, 70, 1752–1757. [Google Scholar] [CrossRef] [PubMed] [Green Version]
- Purcell, S.; Neale, B.; Todd-Brown, K.T.L.; Ferreira, M.A.R.; Bender, D.; Maller, J.; Sklar, P.; de Bakker, P.I.W.; Daly, M.J.; Sham, P.C. PLINK: A toolset for whole-genome association and population-based linkage analysis. Am. J. Hum. Genet. 2007, 81, 559–575. [Google Scholar] [CrossRef] [PubMed]
- Patterson, N.; Price, A.L.; Reich, D. Population structure and eigenanalysis. PLoS Genet. 2006, 2. [Google Scholar] [CrossRef] [PubMed]
- Thornton, T.; Tang, H.; Hoffmann, T.J.; Ochs-Balcom, H.M.; Caan, B.J.; Risch, N. Estimating kinship in admixed populations. Am. J. Hum. Genet. 2012, 91, 122–138. [Google Scholar] [CrossRef] [PubMed]
- Pruim, R.J.; Welch, R.P.; Sanna, S.; Teslovich, T.M.; Chines, P.S.; Gliedt, T.P.; Boehnke, M.; Abecasis, G.R.; Willer, C.J. LocusZoom: Regional visualization of genome-wide association scan results. Bioinformatics 2010, 26, 2336–2337. [Google Scholar] [CrossRef] [PubMed]
- Barrett, J.C.; Fry, B.; Maller, J.; Daly, M.J. Haploview: Analysis and visualization of LD and haplotype maps. Bioinformatics 2005, 21, 263–265. [Google Scholar] [CrossRef] [PubMed]
- Browning, S.R.; Browning, B.L. Rapid and accurate haplotype phasing and missing data inference for whole genome association studies by use of localized haplotype clustering. Am. J. Hum. Genet. 2007, 81, 1084–1097. [Google Scholar] [CrossRef]
- Marchini, J.; Howie, B. Genotype imputation for genome-wide association studies. Nat. Rev. Genet. 2010, 11, 499–511. [Google Scholar] [CrossRef] [PubMed]
- Delaneau, O.; Marchini, J.; The 1000 Genomes Project Consortium. Integrating sequence and array data to create an improved 1000 Genomes Project haplotype reference panel. Nat. Commun. 2014, 5. [Google Scholar] [CrossRef] [PubMed] [Green Version]
- Willer, C.J.; Li, Y.; Abecasis, G.R. METAL: Fast and efficient meta-analysis of genomewide association scans. Bioinformatics 2010, 26, 2190–2191. [Google Scholar] [CrossRef] [PubMed]
- Grundberg, E.; Small, K.S.; Hedman, A.K.; Nica, A.C.; Buil, A.; Keildson, S.; Bell, J.T.; Yang, T.-P.; Meduri, E.; Barrett, A.; et al. Mapping cis- and trans-regulatory effects across multiple tissues in twins. Nat. Genet. 2012, 44, 1084–1089. [Google Scholar] [CrossRef] [PubMed] [Green Version]
- Ma, B.; Huang, J.; Liang, L. RTeQTL: Real-time online engine for expression quantitative trait loci analyses. Database 2014. [Google Scholar] [CrossRef] [PubMed]
- Dozmorov, M.G.; Cara, L.R.; Giles, C.B.; Wren, J.D. GenomeRunner: Automating genome exploration. Bioinformatics 2012, 28, 419–420. [Google Scholar] [CrossRef] [PubMed]
- Speir, M.L.; Zweig, A.S.; Rosenbloom, K.R.; Raney, B.J.; Paten, B.; Nejad, P.; Lee, B.T.; Learned, K.; Karolchik, D.; Hinrichs, A.S. The UCSC Genome Browser database: 2016 update. Nucl. Acids Res. 2016, 44, D717–D725. [Google Scholar] [CrossRef] [PubMed]
- Roadmap Epigenomics Consortium; Kundaje, A.; Meuleman, W.; Ernst, J.; Bilenky, M.; Yen, A.; Heravi-Moussavi, A.; Kheradpour, P.; Zhang, Z.; Wang, J.; et al. Integrative analysis of 111 reference human epigenomes. Nature 2015, 518, 317–330. [Google Scholar] [CrossRef] [PubMed] [Green Version]


| HP.BK | LK.GR | CHR | MK.ID | BP | A1 | A2 | A* | F.ALL | F.CAS | F.CTR | NMISS | OR | L95 | U95 | p | p * | p ** |
|---|---|---|---|---|---|---|---|---|---|---|---|---|---|---|---|---|---|
| 1 | 1 | 4 | rs4518254 | 102714254 | G | T | 1 | 0.42 | 0.3913 | 0.4468 | 8059 | 0.8256 | 0.7738 | 0.8807 | 6.36E−09 | 5.52E−02 | 4.81E−01 |
| 1 | 2 | 4 | rs72602430 | 102715998 | T | TG | 1 | 0.1040 | 0.1000 | 0.1081 | 8111 | 0.8968 | 0.8079 | 0.9956 | 4.10E−02 | 3.66E−01 | 8.95E−01 |
| 1 | 3 | 4 | rs36128945 | 102719913 | A | C | 2 | 0.3051 | 0.2831 | 0.3279 | 8229 | 0.8541 | 0.7970 | 0.9153 | 7.88E−06 | 6.06E−01 | 9.88E−01 |
| 1 | 4 | 4 | rs28496978 | 102735437 | T | A | 2 | 0.0650 | 0.0641 | 0.0659 | 7891 | 0.8760 | 0.7679 | 0.9993 | 4.88E−02 | 8.82E−01 | 5.99E−01 |
| 2 | 5 | 4 | rs10028805 | 102737250 | G | A | 2 | 0.3631 | 0.3384 | 0.3887 | 8277 | 0.8177 | 0.7656 | 0.8735 | 2.22E−09 | NA | NA |
| 2 | 6 | 4 | rs2080820 | 102758403 | C | A | 2 | 0.2907 | 0.2668 | 0.3153 | 8240 | 0.8268 | 0.7709 | 0.8867 | 9.87E−08 | 6.00E−01 | 8.16E−01 |
| # | 7 | 4 | rs17031708 | 102764358 | G | A | 2 | 0.1307 | 0.1209 | 0.1409 | 8259 | 0.8724 | 0.7933 | 0.9594 | 4.89E−03 | 4.88E−02 | 1.45E−01 |
| 3 | 8 | 4 | rs148572654 | 102764832 | G | T | 2 | 0.0195 | 0.0161 | 0.0231 | 8114 | 0.7551 | 0.5968 | 0.9555 | 1.93E−02 | 4.08E−03 | NA |
| 3 | 9 | 4 | rs6857428 | 102792611 | T | G | 2 | 0.4496 | 0.4265 | 0.4737 | 8239 | 0.8442 | 0.7925 | 0.8992 | 1.43E−07 | 1.84E−01 | 4.71E−01 |
| 3 | 10 | 4 | rs11939568 | 102810162 | A | G | 2 | 0.3278 | 0.3094 | 0.3469 | 8235 | 0.8805 | 0.8233 | 0.9417 | 2.04E−04 | 8.33E−01 | 7.82E−01 |
| 3 | 11 | 4 | rs10212686 | 102822654 | A | G | 1 | 0.0473 | 0.0439 | 0.0508 | 8183 | 0.8474 | 0.7286 | 0.9856 | 3.17E−02 | 3.50E−02 | 7.42E−01 |
| 4 | 12 | 4 | rs62321740 | 102824467 | A | G | 2 | 0.0339 | 0.0301 | 0.0378 | 8050 | 0.8172 | 0.6831 | 0.9777 | 2.73E−02 | 2.62E−03 | NA |
| 4 | 13 | 4 | rs4295265 | 102835645 | C | T | 2 | 0.3179 | 0.3000 | 0.3363 | 8052 | 0.9009 | 0.8414 | 0.9645 | 2.73E−03 | 9.34E−01 | 9.83E−01 |
| 4 | 14 | 4 | rs4099101 | 102847428 | A | G | 1 | 0.1251 | 0.1203 | 0.1301 | 8244 | 0.8790 | 0.7985 | 0.9677 | 8.57E−03 | 3.03E−01 | 8.05E−01 |
| 4 | 15 | 4 | rs33973573 | 102855806 | G | A | 2 | 0.4645 | 0.4812 | 0.4472 | 8210 | 1.1180 | 1.0490 | 1.1910 | 5.75E−04 | 9.17E−01 | 3.50E−01 |
| 4 | 16 | 4 | 4:102857352:AT:ATT | 102857352 | AT | ATT | 2 | 0.0312 | 0.0274 | 0.0351 | 8080 | 0.7753 | 0.6447 | 0.9324 | 6.85E−03 | 1.96E−03 | 1.87E−01 |
| 4 | 17 | 4 | rs2851336 | 102857563 | C | T | 2 | 0.4128 | 0.4000 | 0.4261 | 8120 | 0.9355 | 0.8768 | 0.9982 | 4.40E−02 | 5.58E−01 | 4.58E−01 |
| 4 | 18 | 4 | 4:102945562:GT:G | 102945562 | GT | G | 2 | 0.0109 | 0.0082 | 0.0137 | 8181 | 0.5969 | 0.4351 | 0.8187 | 1.37E−03 | 9.43E−03 | NA |
| HAPLOTYPE | F.CAS | F.CTR | F.ALL | p |
|---|---|---|---|---|
| 1111 | 0.6212 | 0.5605 | 0.5830 | 3.89E−13 |
| 2111 | 0.3335 | 0.3810 | 0.3520 | 7.64E−08 |
| 1121 | 0.0297 | 0.0372 | 0.0340 | 3.31E−02 |
| 1211 | 0.0155 | 0.0213 | 0.0180 | 5.07E−02 |
| HP.BK | LK.GR | CHR | MK.ID | BP | A1 | A2 | A* | F.ALL | F.CAS | F.CTR | NMISS | OR | L95 | U95 | p | p * | p ** |
|---|---|---|---|---|---|---|---|---|---|---|---|---|---|---|---|---|---|
| # | 1 | 4 | rs10031210 | 102714886 | A | G | 1 | 0.2233 | 0.2010 | 0.2479 | 2529 | 0.7563 | 0.6609 | 0.8655 | 4.92E−05 | 1.37E−01 | 7.25E−01 |
| 1 | 2 | 4 | rs4699262 | 102726005 | G | A | 2 | 0.1316 | 0.1090 | 0.1613 | 2520 | 0.6232 | 0.5271 | 0.7369 | 3.19E−08 | 1.36E−02 | 2.11E−01 |
| 1 | 3 | 4 | rs35828857 | 102729253 | A | AT | 2 | 0.1633 | 0.1393 | 0.1950 | 2465 | 0.6727 | 0.5774 | 0.7836 | 3.58E−07 | 3.52E−02 | 3.74E−01 |
| # | 4 | 4 | rs66638185 | 102729417 | T | C | 2 | 0.1658 | 0.1388 | 0.1974 | 2483 | 0.6574 | 0.5654 | 0.7643 | 4.92E−08 | 1.32E−02 | 3.26E−01 |
| 2 | 5 | 4 | rs13136796 | 102736743 | A | T | 2 | 0.3177 | 0.2929 | 0.3459 | 2494 | 0.7764 | 0.6883 | 0.8757 | 3.78E−05 | 4.88E−01 | 3.36E−01 |
| 2 | 6 | 4 | rs4615176 | 102737936 | C | G | 1 | 0.2351 | 0.2466 | 0.2205 | 2448 | 1.1790 | 1.0290 | 1.3510 | 1.81E−02 | 5.38E−01 | 3.50E−01 |
| 2 | 7 | 4 | rs1421627 | 102739536 | G | A | 2 | 0.4148 | 0.3953 | 0.4393 | 2529 | 0.8230 | 0.7345 | 0.9221 | 7.84E−04 | 6.58E−01 | 6.26E−01 |
| 2 | 8 | 4 | rs13136219 | 102743687 | C | T | 1 | 0.3893 | 0.4098 | 0.3623 | 2466 | 1.2320 | 1.0960 | 1.3850 | 4.70E−04 | 2.67E−01 | 2.10E−01 |
| # | 9 | 4 | rs13112246 | 102743811 | T | C | 2 | 0.4072 | 0.3826 | 0.4361 | 2475 | 0.8045 | 0.7179 | 0.9015 | 1.81E−04 | 8.76E−01 | 9.28E−01 |
| # | 10 | 4 | rs56857058 | 102749300 | A | AT | 1 | 0.3069 | 0.3208 | 0.2837 | 2515 | 1.2080 | 1.0690 | 1.3650 | 2.42E−03 | 3.29E−01 | 1.21E−01 |
| 3 | 11 | 4 | rs144220121 | 102750582 | G | GT | 2 | 0.1755 | 0.1895 | 0.1610 | 2478 | 1.2010 | 1.0320 | 1.3970 | 1.78E−02 | 3.04E−01 | 4.71E−01 |
| 3 | 12 | 4 | rs11938136 | 102750726 | G | A | 2 | 0.1027 | 0.1124 | 0.0925 | 2501 | 1.2240 | 1.0160 | 1.4750 | 3.31E−02 | 2.74E−01 | 3.51E−01 |
| 3 | 13 | 4 | rs17200824 | 102752589 | A | G | 2 | 0.2281 | 0.1984 | 0.2664 | 2516 | 0.6787 | 0.5947 | 0.7747 | 9.24E−09 | NA | NA |
| 3 | 14 | 4 | rs7438361 | 102756142 | G | A | 2 | 0.2143 | 0.2248 | 0.2000 | 2427 | 1.1570 | 1.0070 | 1.3290 | 3.96E−02 | 6.79E−01 | 7.94E−01 |
| # | 15 | 4 | rs72923462 | 102758014 | G | A | 2 | 0.0677 | 0.0725 | 0.0571 | 2427 | 1.2680 | 1.0070 | 1.5980 | 4.37E−02 | 2.21E−01 | 2.50E−01 |
| # | 16 | 4 | rs72923467 | 102760424 | G | A | 2 | 0.0810 | 0.0871 | 0.0692 | 2475 | 1.2780 | 1.0340 | 1.5780 | 2.29E−02 | 1.65E−01 | 1.32E−01 |
| 4 | 17 | 4 | rs4607219 | 102773838 | T | C | 1 | 0.2475 | 0.2619 | 0.2327 | 2473 | 1.1820 | 1.0370 | 1.3460 | 1.21E−02 | 6.01E−02 | 1.54E−01 |
| 4 | 18 | 4 | rs34166099 | 102778580 | C | A | 2 | 0.0427 | 0.0364 | 0.0510 | 2428 | 0.6751 | 0.5069 | 0.8993 | 7.23E−03 | 1.87E−01 | 8.52E−01 |
| 4 | 19 | 4 | rs4426778 | 102780724 | G | A | 1 | 0.2772 | 0.2893 | 0.2658 | 2512 | 1.1400 | 1.0060 | 1.2910 | 3.93E−02 | 2.07E−01 | 4.42E−01 |
| 4 | 20 | 4 | rs35201947 | 102781331 | C | T | 2 | 0.2026 | 0.1792 | 0.2329 | 2427 | 0.7211 | 0.6268 | 0.8297 | 4.87E−06 | 1.83E−01 | 7.15E−01 |
| 4 | 21 | 4 | rs34814827 | 102787117 | C | T | 2 | 0.3850 | 0.3661 | 0.4046 | 2513 | 0.8499 | 0.7589 | 0.9518 | 4.87E−03 | 5.13E−01 | 6.53E−01 |
| 4 | 22 | 4 | rs4493533 | 102820684 | C | T | 1 | 0.4461 | 0.4663 | 0.4251 | 2496 | 1.1790 | 1.0540 | 1.3190 | 3.99E−03 | 1.67E−01 | 5.78E−01 |
| 4 | 23 | 4 | rs34612070 | 102832696 | TC | T | 2 | 0.1222 | 0.1014 | 0.1469 | 2429 | 0.6586 | 0.5543 | 0.7826 | 2.07E−06 | 5.30E−02 | 5.63E−01 |
| 4 | 24 | 4 | rs4295265 | 102835645 | C | T | 2 | 0.1107 | 0.0897 | 0.1344 | 2444 | 0.6206 | 0.5161 | 0.7461 | 3.89E−07 | 4.97E−03 | NA |
| 5 | 25 | 4 | rs3733197 | 102839287 | G | A | 2 | 0.1827 | 0.1571 | 0.2150 | 2516 | 0.6762 | 0.5845 | 0.7824 | 1.44E−07 | 8.90E−03 | 9.33E−01 |
| 5 | 26 | 4 | rs13119516 | 102841605 | G | A | 2 | 0.0295 | 0.0238 | 0.0365 | 2505 | 0.6088 | 0.4325 | 0.8570 | 4.44E−03 | 1.96E−01 | 7.32E−01 |
| 5 | 27 | 4 | rs36073662 | 102841949 | G | GA | 2 | 0.3743 | 0.3584 | 0.3892 | 2485 | 0.8659 | 0.7716 | 0.9717 | 1.44E−02 | 5.73E−01 | 4.27E−01 |
| # | 28 | 4 | rs59723463 | 102857343 | G | GAT | 2 | 0.4205 | 0.4372 | 0.3982 | 2445 | 1.1740 | 1.0470 | 1.3150 | 5.89E−03 | 2.33E−01 | 5.17E−01 |
| # | 29 | 4 | rs2851336 | 102857563 | C | T | 2 | 0.4564 | 0.4414 | 0.4702 | 2452 | 0.8779 | 0.7830 | 0.9844 | 2.57E−02 | 5.68E−01 | 5.43E−01 |
| 6 | 30 | 4 | rs150123613 | 102879041 | G | A | 2 | 0.0114 | 0.0137 | 0.0081 | 2424 | 1.8240 | 1.0030 | 3.3170 | 4.88E−02 | 8.45E−02 | 1.10E−01 |
| 6 | 31 | 4 | rs72916176 | 102881821 | T | G | 2 | 0.1235 | 0.1335 | 0.1081 | 2432 | 1.2560 | 1.0530 | 1.4970 | 1.12E−02 | 1.06E−01 | 1.64E−01 |
| 6 | 32 | 4 | rs72929915 | 102890546 | A | G | 2 | 0.1616 | 0.1731 | 0.1451 | 2423 | 1.2110 | 1.0340 | 1.4180 | 1.75E−02 | 5.19E−02 | 1.44E−01 |
| 6 | 33 | 4 | rs976654 | 102898570 | A | C | 2 | 0.2763 | 0.2478 | 0.3088 | 2502 | 0.7336 | 0.6462 | 0.8328 | 1.69E−06 | 6.37E−03 | 2.29E−01 |
| 6 | 34 | 4 | rs1027013 | 102904490 | G | A | 2 | 0.1700 | 0.1433 | 0.2018 | 2526 | 0.6497 | 0.5581 | 0.7564 | 2.69E−08 | 6.41E−03 | 6.95E−01 |
| 6 | 35 | 4 | rs2851318 | 102915668 | A | T | 1 | 0.3250 | 0.3400 | 0.3107 | 2446 | 1.1450 | 1.0150 | 1.2920 | 2.76E−02 | 1.45E−01 | 6.21E−01 |
| 6 | 36 | 4 | rs6817137 | 102918724 | G | A | 2 | 0.1192 | 0.1299 | 0.1061 | 2496 | 1.2300 | 1.0300 | 1.4690 | 2.26E−02 | 1.91E−01 | 2.83E−01 |
| 6 | 37 | 4 | rs2903274 | 102919138 | T | C | 2 | 0.4800 | 0.4553 | 0.4940 | 2500 | 0.8204 | 0.7320 | 0.9195 | 6.71E−04 | 1.57E−02 | 2.34E−01 |
| 6 | 38 | 4 | rs6532981 | 102927216 | T | C | 2 | 0.2169 | 0.2314 | 0.2005 | 2470 | 1.1850 | 1.0320 | 1.3600 | 1.64E−02 | 8.45E−02 | 3.02E−01 |
| 6 | 39 | 4 | rs6532982 | 102927310 | A | G | 2 | 0.1763 | 0.1906 | 0.1593 | 2529 | 1.2200 | 1.0520 | 1.4150 | 8.47E−03 | 5.84E−02 | 1.72E−01 |
| # | 40 | 4 | rs1486571 | 102938040 | A | T | 1 | 0.1934 | 0.1725 | 0.2168 | 2415 | 0.7597 | 0.6538 | 0.8827 | 3.32E−04 | 4.79E−02 | 7.27E−01 |
| 7 | 41 | 4 | rs11412036 | 102942316 | G | GA | 1 | 0.0763 | 0.0626 | 0.0917 | 2419 | 0.6614 | 0.5320 | 0.8222 | 1.97E−04 | 3.86E−02 | 3.06E−01 |
| 7 | 42 | 4 | rs2850390 | 102943996 | A | C | 1 | 0.1462 | 0.1247 | 0.1693 | 2529 | 0.7007 | 0.5961 | 0.8237 | 1.62E−05 | 1.85E−02 | 6.68E−01 |
| 7 | 43 | 4 | rs2631268 | 102948730 | G | T | 2 | 0.3030 | 0.3151 | 0.2852 | 2530 | 1.1470 | 1.0150 | 1.2950 | 2.74E−02 | 5.63E−02 | 3.14E−01 |
| 7 | 44 | 4 | rs3133078 | 102952819 | C | A | 1 | 0.1673 | 0.1467 | 0.1890 | 2440 | 0.7383 | 0.6317 | 0.8628 | 1.36E−04 | 4.67E−02 | 7.79E−01 |
| 7 | 45 | 4 | rs149302668 | 102955310 | G | A | 2 | 0.0135 | 0.0114 | 0.0182 | 2507 | 0.6105 | 0.3773 | 0.9876 | 4.44E−02 | 2.91E−02 | NA |
| # | 46 | 4 | rs11326096 | 102968589 | CT | C | 1 | 0.3067 | 0.2886 | 0.3298 | 2436 | 0.8334 | 0.7370 | 0.9423 | 3.65E−03 | 1.92E−01 | 6.33E−01 |
| 8 | 47 | 4 | rs2850397 | 102970744 | G | T | 1 | 0.2362 | 0.2135 | 0.2629 | 2409 | 0.7759 | 0.6785 | 0.8873 | 2.10E−04 | 5.74E−02 | 4.17E−01 |
| 8 | 48 | 4 | rs2658535 | 102971016 | G | A | 1 | 0.3901 | 0.3674 | 0.4214 | 2454 | 0.8118 | 0.7237 | 0.9107 | 3.78E−04 | 6.30E−02 | 6.12E−01 |
| 8 | 49 | 4 | rs116552800 | 102974226 | A | G | 2 | 0.0386 | 0.0438 | 0.0318 | 2410 | 1.3840 | 1.0170 | 1.8840 | 3.88E−02 | 1.23E−01 | 2.06E−01 |
| # | 50 | 4 | rs2129292 | 102991139 | C | G | 1 | 0.3598 | 0.3400 | 0.3802 | 2418 | 0.8531 | 0.7572 | 0.9611 | 9.00E−03 | 1.03E−01 | 8.72E−01 |
| HAPLOTYPE | F.CAS | F.CTR | F.ALL | p |
|---|---|---|---|---|
| 11 | 0.8999 | 0.8464 | 0.8760 | 3.17E−08 |
| 12 | 0.0112 | 0.0179 | 0.0130 | 5.21E−02 |
| 21 | 0.0889 | 0.1357 | 0.1110 | 4.02E−07 |
| MKID | BP | POS | EUR | AA | META | ||||||||||||||||||||||
|---|---|---|---|---|---|---|---|---|---|---|---|---|---|---|---|---|---|---|---|---|---|---|---|---|---|---|---|
| A1 | A2 | A* | H.B | L.G | N | F | FCAS | FCTR | Pval | A* | H.B | L.G | N | F | FCAS | FCTR | Pval | OREUR | ORAA | ORFEM | L95FEM | U95FEM | Pval | HetPval | |||
| rs13136796 | 102736743 | I2 | A | T | 2 | 2 | 6 | 8227 | 0.2874 | 0.2634 | 0.3123 | 7.36E−08 | 2 | 3 | 6 | 2494 | 0.3177 | 0.2929 | 0.3459 | 3.78E−05 | 0.8244 | 0.7764 | 0.8119 | 0.7641 | 0.8627 | 2.05E−11 | 0.31 |
| rs66976837 | 102736943 | I2 | CTTGTT | C | 2 | 2 | 6 | 8228 | 0.2874 | 0.2633 | 0.3124 | 6.66E−08 | 2 | 3 | 6 | 2495 | 0.3176 | 0.2929 | 0.3455 | 4.13E−05 | 0.8239 | 0.7774 | 0.8118 | 0.7640 | 0.8626 | 1.97E−11 | 0.32 |
| rs10028805 | 102737250 | I2 | G | A | 2 | 2 | 5 | 8277 | 0.3631 | 0.3384 | 0.3887 | 2.22E−09 | 1 | 3 | 8 | 2528 | 0.3930 | 0.4139 | 0.3665 | 4.72E−04 | 0.8177 | 0.8137 | 0.8167 | 0.7712 | 0.8648 | 4.33E−12 | 0.87 |
| rs4615176 | 102737936 | I2 | C | G | 2 | 2 | 5 | 8190 | 0.3699 | 0.3452 | 0.3955 | 2.33E−09 | 1 | 3 | 5 | 2448 | 0.2351 | 0.2466 | 0.2205 | 1.81E−02 | 0.8177 | 0.8482 | 0.8234 | 0.7759 | 0.8738 | 1.83E−10 | 0.43 |
| rs4411998 | 102738147 | I2 | T | C | 2 | 2 | 5 | 8213 | 0.3639 | 0.3395 | 0.3892 | 3.77E−09 | 1 | 3 | 8 | 2502 | 0.4029 | 0.4237 | 0.3763 | 6.26E−04 | 0.8198 | 0.8177 | 0.8193 | 0.7736 | 0.8677 | 9.57E−12 | 0.88 |
| rs2052445 | 102738722 | I2 | A | G | 2 | 2 | 6 | 8232 | 0.2877 | 0.2636 | 0.3126 | 7.45E−08 | 2 | 3 | 6 | 2495 | 0.3175 | 0.2926 | 0.3454 | 4.19E−05 | 0.8245 | 0.7777 | 0.8123 | 0.7645 | 0.8631 | 2.25E−11 | 0.32 |
| rs5860695 | 102738856 | I2 | TA | T | 2 | 2 | 6 | 8203 | 0.2882 | 0.2641 | 0.3132 | 7.84E−08 | 2 | 3 | 6 | 2495 | 0.3175 | 0.2926 | 0.3454 | 4.19E−05 | 0.8246 | 0.7777 | 0.8124 | 0.7645 | 0.8633 | 2.37E−11 | 0.32 |
| rs35388091 | 102739452 | I2 | C | T | 2 | 2 | 6 | 8255 | 0.2890 | 0.2648 | 0.3140 | 5.36E−08 | 2 | 3 | 7 | 2505 | 0.4146 | 0.3946 | 0.4381 | 9.61E−04 | 0.8229 | 0.8254 | 0.8236 | 0.7758 | 0.8743 | 2.06E−10 | 0.79 |
| rs1421627 | 102739536 | I2 | G | A | 2 | 2 | 6 | 8272 | 0.2899 | 0.2663 | 0.3143 | 9.40E−08 | 2 | 3 | 7 | 2529 | 0.4148 | 0.3953 | 0.4393 | 7.84E−04 | 0.8138 | 0.8230 | 0.8164 | 0.7686 | 0.8671 | 4.24E−11 | 0.88 |
| rs13106926 | 102739791 | I2 | A | G | 2 | 2 | 6 | 8070 | 0.2900 | 0.2654 | 0.3169 | 1.36E−08 | 2 | 3 | 6 | 2499 | 0.3180 | 0.2931 | 0.3458 | 4.12E−05 | 0.8243 | 0.7775 | 0.8121 | 0.7643 | 0.8629 | 2.14E−11 | 0.32 |
| rs13107572 | 102739928 | I2 | C | A | 2 | 2 | 6 | 8240 | 0.2879 | 0.2638 | 0.3127 | 7.19E−08 | 2 | 3 | 6 | 2498 | 0.3179 | 0.2929 | 0.3458 | 3.94E−05 | 0.8243 | 0.7770 | 0.8120 | 0.7642 | 0.8628 | 2.07E−11 | 0.32 |
| rs13107612 | 102739980 | I2 | C | T | 2 | 2 | 6 | 8240 | 0.2879 | 0.2638 | 0.3127 | 7.19E−08 | 2 | 4 | 6 | 2492 | 0.3186 | 0.2939 | 0.3461 | 5.06E−05 | 0.8226 | 0.7798 | 0.8115 | 0.7637 | 0.8623 | 1.80E−11 | 0.35 |
| rs71597109 | 102741002 | I2 | C | T | 2 | 2 | 6 | 8231 | 0.2894 | 0.2652 | 0.3144 | 5.27E−08 | 2 | 4 | 13 | 2494 | 0.2266 | 0.1969 | 0.2652 | 1.02E−08 | 0.8226 | 0.6786 | 0.7898 | 0.7423 | 0.8404 | 6.86E−14 | 0.02 |
| rs13135381 | 102743353 | I2 | A | G | 2 | 2 | 6 | 8211 | 0.2881 | 0.2637 | 0.3133 | 6.80E−08 | 2 | 4 | 13 | 2499 | 0.2267 | 0.1978 | 0.2643 | 2.27E−08 | 0.8278 | 0.6847 | 0.7941 | 0.7463 | 0.8450 | 2.62E−13 | 0.02 |
| rs13136219 | 102743687 | I2 | C | T | 2 | 2 | 5 | 8187 | 0.3661 | 0.3423 | 0.3909 | 8.21E−09 | 1 | 4 | 8 | 2466 | 0.3893 | 0.4098 | 0.3623 | 4.70E−04 | 0.8237 | 0.8117 | 0.8208 | 0.7750 | 0.8693 | 1.63E−11 | 0.77 |
| rs55768089 | 102743698 | I2 | T | A | 2 | 2 | 6 | 8212 | 0.2877 | 0.2641 | 0.3122 | 1.38E−07 | 2 | 4 | 13 | 2499 | 0.2267 | 0.1978 | 0.2643 | 2.27E−08 | 0.8274 | 0.6847 | 0.7938 | 0.7460 | 0.8447 | 2.37E−13 | 0.02 |
| rs13112246 | 102743811 | I2 | T | C | 2 | 2 | 5 | 8163 | 0.3662 | 0.3421 | 0.3912 | 9.33E−09 | 2 | 4 | 9 | 2475 | 0.4072 | 0.3826 | 0.4361 | 1.81E−04 | 0.8241 | 0.8045 | 0.8191 | 0.7736 | 0.8672 | 8.13E−12 | 0.61 |
| rs13137133 | 102744092 | I2 | C | T | 2 | 2 | 5 | 8205 | 0.3740 | 0.3512 | 0.3977 | 3.58E−08 | 1 | 4 | 10 | 2491 | 0.3050 | 0.3187 | 0.2817 | 2.68E−03 | 0.8312 | 0.8285 | 0.8306 | 0.7838 | 0.8802 | 3.49E−10 | 0.98 |
| rs1125271 | 102745985 | I2 | C | T | 2 | 2 | 6 | 8213 | 0.2877 | 0.2640 | 0.3122 | 1.27E−07 | 2 | 4 | 13 | 2505 | 0.2219 | 0.1924 | 0.2593 | 1.42E−08 | 0.8243 | 0.6794 | 0.7904 | 0.7427 | 0.8412 | 9.12E−14 | 0.02 |
| rs4276281 | 102746780 | I2 | A | C | 2 | 2 | 5 | 8252 | 0.3734 | 0.3505 | 0.3969 | 4.04E−08 | 1 | 4 | 10 | 2481 | 0.3020 | 0.3140 | 0.2795 | 9.75E−03 | 0.8318 | 0.8496 | 0.8357 | 0.7886 | 0.8856 | 1.40E−09 | 0.71 |
| rs7698632 | 102747265 | I2 | G | C | 2 | 2 | 5 | 8224 | 0.3724 | 0.3489 | 0.3968 | 1.54E−08 | 1 | 4 | 10 | 2511 | 0.3065 | 0.3202 | 0.2837 | 2.47E−03 | 0.8271 | 0.8278 | 0.8273 | 0.7807 | 0.8766 | 1.40E−10 | 0.93 |
| rs12163856 | 102747927 | I2 | A | G | 2 | 2 | 5 | 8159 | 0.3750 | 0.3514 | 0.3994 | 1.35E−08 | 1 | 4 | 10 | 2462 | 0.3538 | 0.3634 | 0.3351 | 1.89E−02 | 0.8266 | 0.8681 | 0.8362 | 0.7895 | 0.8856 | 1.01E−09 | 0.5 |
| rs56857058 | 102749300 | I2 | A | AT | 2 | 2 | 5 | 8213 | 0.3764 | 0.3530 | 0.4006 | 1.77E−08 | 1 | 4 | 10 | 2515 | 0.3069 | 0.3208 | 0.2837 | 2.42E−03 | 0.8282 | 0.8278 | 0.8281 | 0.7816 | 0.8774 | 1.58E−10 | 0.94 |
| rs17266594 | 102750922 | I2 | T | C | 2 | 2 | 6 | 8124 | 0.2863 | 0.2624 | 0.3109 | 1.25E−07 | 2 | 4 | 13 | 2514 | 0.2249 | 0.1962 | 0.2639 | 1.26E−08 | 0.8285 | 0.6795 | 0.7936 | 0.7459 | 0.8443 | 1.80E−13 | 0.01 |
| rs10516487 | 102751076 | E2 | G | A | 2 | 2 | 6 | 8220 | 0.2864 | 0.2624 | 0.3114 | 7.34E−08 | 2 | 4 | 13 | 2518 | 0.2232 | 0.1936 | 0.2604 | 1.41E−08 | 0.8273 | 0.6798 | 0.7929 | 0.7452 | 0.8437 | 1.53E−13 | 0.02 |
| rs10516486 | 102751276 | E2 | T | C | 2 | 2 | 5 | 8277 | 0.3761 | 0.3528 | 0.4002 | 1.30E−08 | 1 | 4 | 10 | 2530 | 0.3089 | 0.3218 | 0.2866 | 3.47E−03 | 0.8269 | 0.8333 | 0.8283 | 0.7818 | 0.8775 | 1.66E−10 | 0.85 |
| rs34029191 | 102752201 | I3 | A | G | 2 | 2 | 6 | 8237 | 0.2912 | 0.2676 | 0.3155 | 1.38E−07 | 2 | 4 | 13 | 2517 | 0.2275 | 0.1981 | 0.2655 | 1.22E−08 | 0.8270 | 0.6804 | 0.7924 | 0.7448 | 0.8431 | 1.32E−13 | 0.02 |
| rs17200824 | 102752589 | I3 | A | G | 2 | 2 | 6 | 8233 | 0.2887 | 0.2651 | 0.3131 | 1.15E−07 | 2 | 4 | 13 | 2516 | 0.2281 | 0.1984 | 0.2664 | 9.24E−09 | 0.8268 | 0.6787 | 0.7919 | 0.7444 | 0.8424 | 9.88E−14 | 0.01 |
| rs4637409 | 102753408 | I3 | A | G | 2 | 2 | 6 | 7966 | 0.2809 | 0.2565 | 0.3062 | 1.04E−07 | 2 | 4 | 13 | 2527 | 0.2221 | 0.1937 | 0.2604 | 1.12E−08 | 0.8264 | 0.6771 | 0.7917 | 0.7441 | 0.8424 | 1.05E−13 | 0.02 |
| rs34749007 | 102754507 | I3 | G | A | 2 | 2 | 6 | 8239 | 0.2889 | 0.2653 | 0.3133 | 1.09E−07 | 2 | 4 | 13 | 2469 | 0.2313 | 0.2033 | 0.2670 | 1.05E−07 | 0.8265 | 0.6977 | 0.7961 | 0.7480 | 0.8473 | 6.18E−13 | 0.04 |
| rs5860696 | 102755799 | I3 | CA | C | 2 | 2 | 5 | 8004 | 0.3603 | 0.3351 | 0.3863 | 2.52E−09 | 1 | 5 | 8 | 2422 | 0.3906 | 0.4119 | 0.3643 | 8.05E−04 | 0.8165 | 0.8183 | 0.8169 | 0.7709 | 0.8656 | 8.07E−12 | 0.95 |
| rs4643809 | 102756099 | I3 | C | T | 2 | 2 | 5 | 8038 | 0.3611 | 0.3362 | 0.3869 | 5.03E−09 | 1 | 5 | 8 | 2409 | 0.3844 | 0.4051 | 0.3574 | 7.77E−04 | 0.8202 | 0.8163 | 0.8193 | 0.7732 | 0.8682 | 1.56E−11 | 0.89 |
© 2018 by the authors. Licensee MDPI, Basel, Switzerland. This article is an open access article distributed under the terms and conditions of the Creative Commons Attribution (CC BY) license (http://creativecommons.org/licenses/by/4.0/).
Share and Cite
Martínez-Bueno, M.; Oparina, N.; Dozmorov, M.G.; Marion, M.C.; Comeau, M.E.; Gilkeson, G.; Kamen, D.; Weisman, M.; Salmon, J.; McCune, J.W.; et al. Trans-Ethnic Mapping of BANK1 Identifies Two Independent SLE-Risk Linkage Groups Enriched for Co-Transcriptional Splicing Marks. Int. J. Mol. Sci. 2018, 19, 2331. https://doi.org/10.3390/ijms19082331
Martínez-Bueno M, Oparina N, Dozmorov MG, Marion MC, Comeau ME, Gilkeson G, Kamen D, Weisman M, Salmon J, McCune JW, et al. Trans-Ethnic Mapping of BANK1 Identifies Two Independent SLE-Risk Linkage Groups Enriched for Co-Transcriptional Splicing Marks. International Journal of Molecular Sciences. 2018; 19(8):2331. https://doi.org/10.3390/ijms19082331
Chicago/Turabian StyleMartínez-Bueno, Manuel, Nina Oparina, Mikhail G. Dozmorov, Miranda C. Marion, Mary E. Comeau, Gary Gilkeson, Diane Kamen, Michael Weisman, Jane Salmon, Joseph W. McCune, and et al. 2018. "Trans-Ethnic Mapping of BANK1 Identifies Two Independent SLE-Risk Linkage Groups Enriched for Co-Transcriptional Splicing Marks" International Journal of Molecular Sciences 19, no. 8: 2331. https://doi.org/10.3390/ijms19082331
APA StyleMartínez-Bueno, M., Oparina, N., Dozmorov, M. G., Marion, M. C., Comeau, M. E., Gilkeson, G., Kamen, D., Weisman, M., Salmon, J., McCune, J. W., Harley, J. B., Kimberly, R., James, J. A., Merrill, J., Montgomery, C., Langefeld, C. D., & Alarcón-Riquelme, M. E. (2018). Trans-Ethnic Mapping of BANK1 Identifies Two Independent SLE-Risk Linkage Groups Enriched for Co-Transcriptional Splicing Marks. International Journal of Molecular Sciences, 19(8), 2331. https://doi.org/10.3390/ijms19082331