The Micro-RNA Expression Profiles of Autoimmune Arthritis Reveal Novel Biomarkers of the Disease and Therapeutic Response

Abstract
: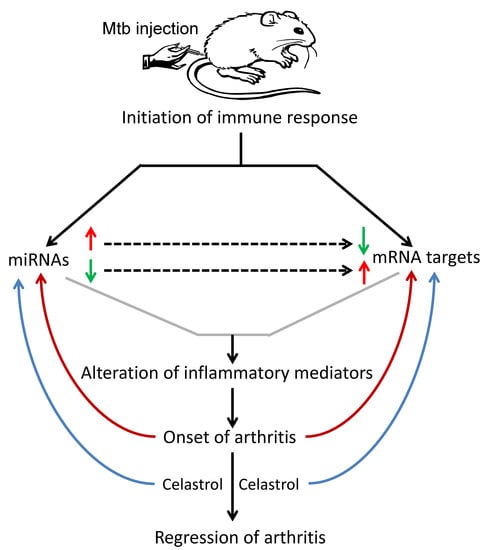
1. Introduction
2. Results
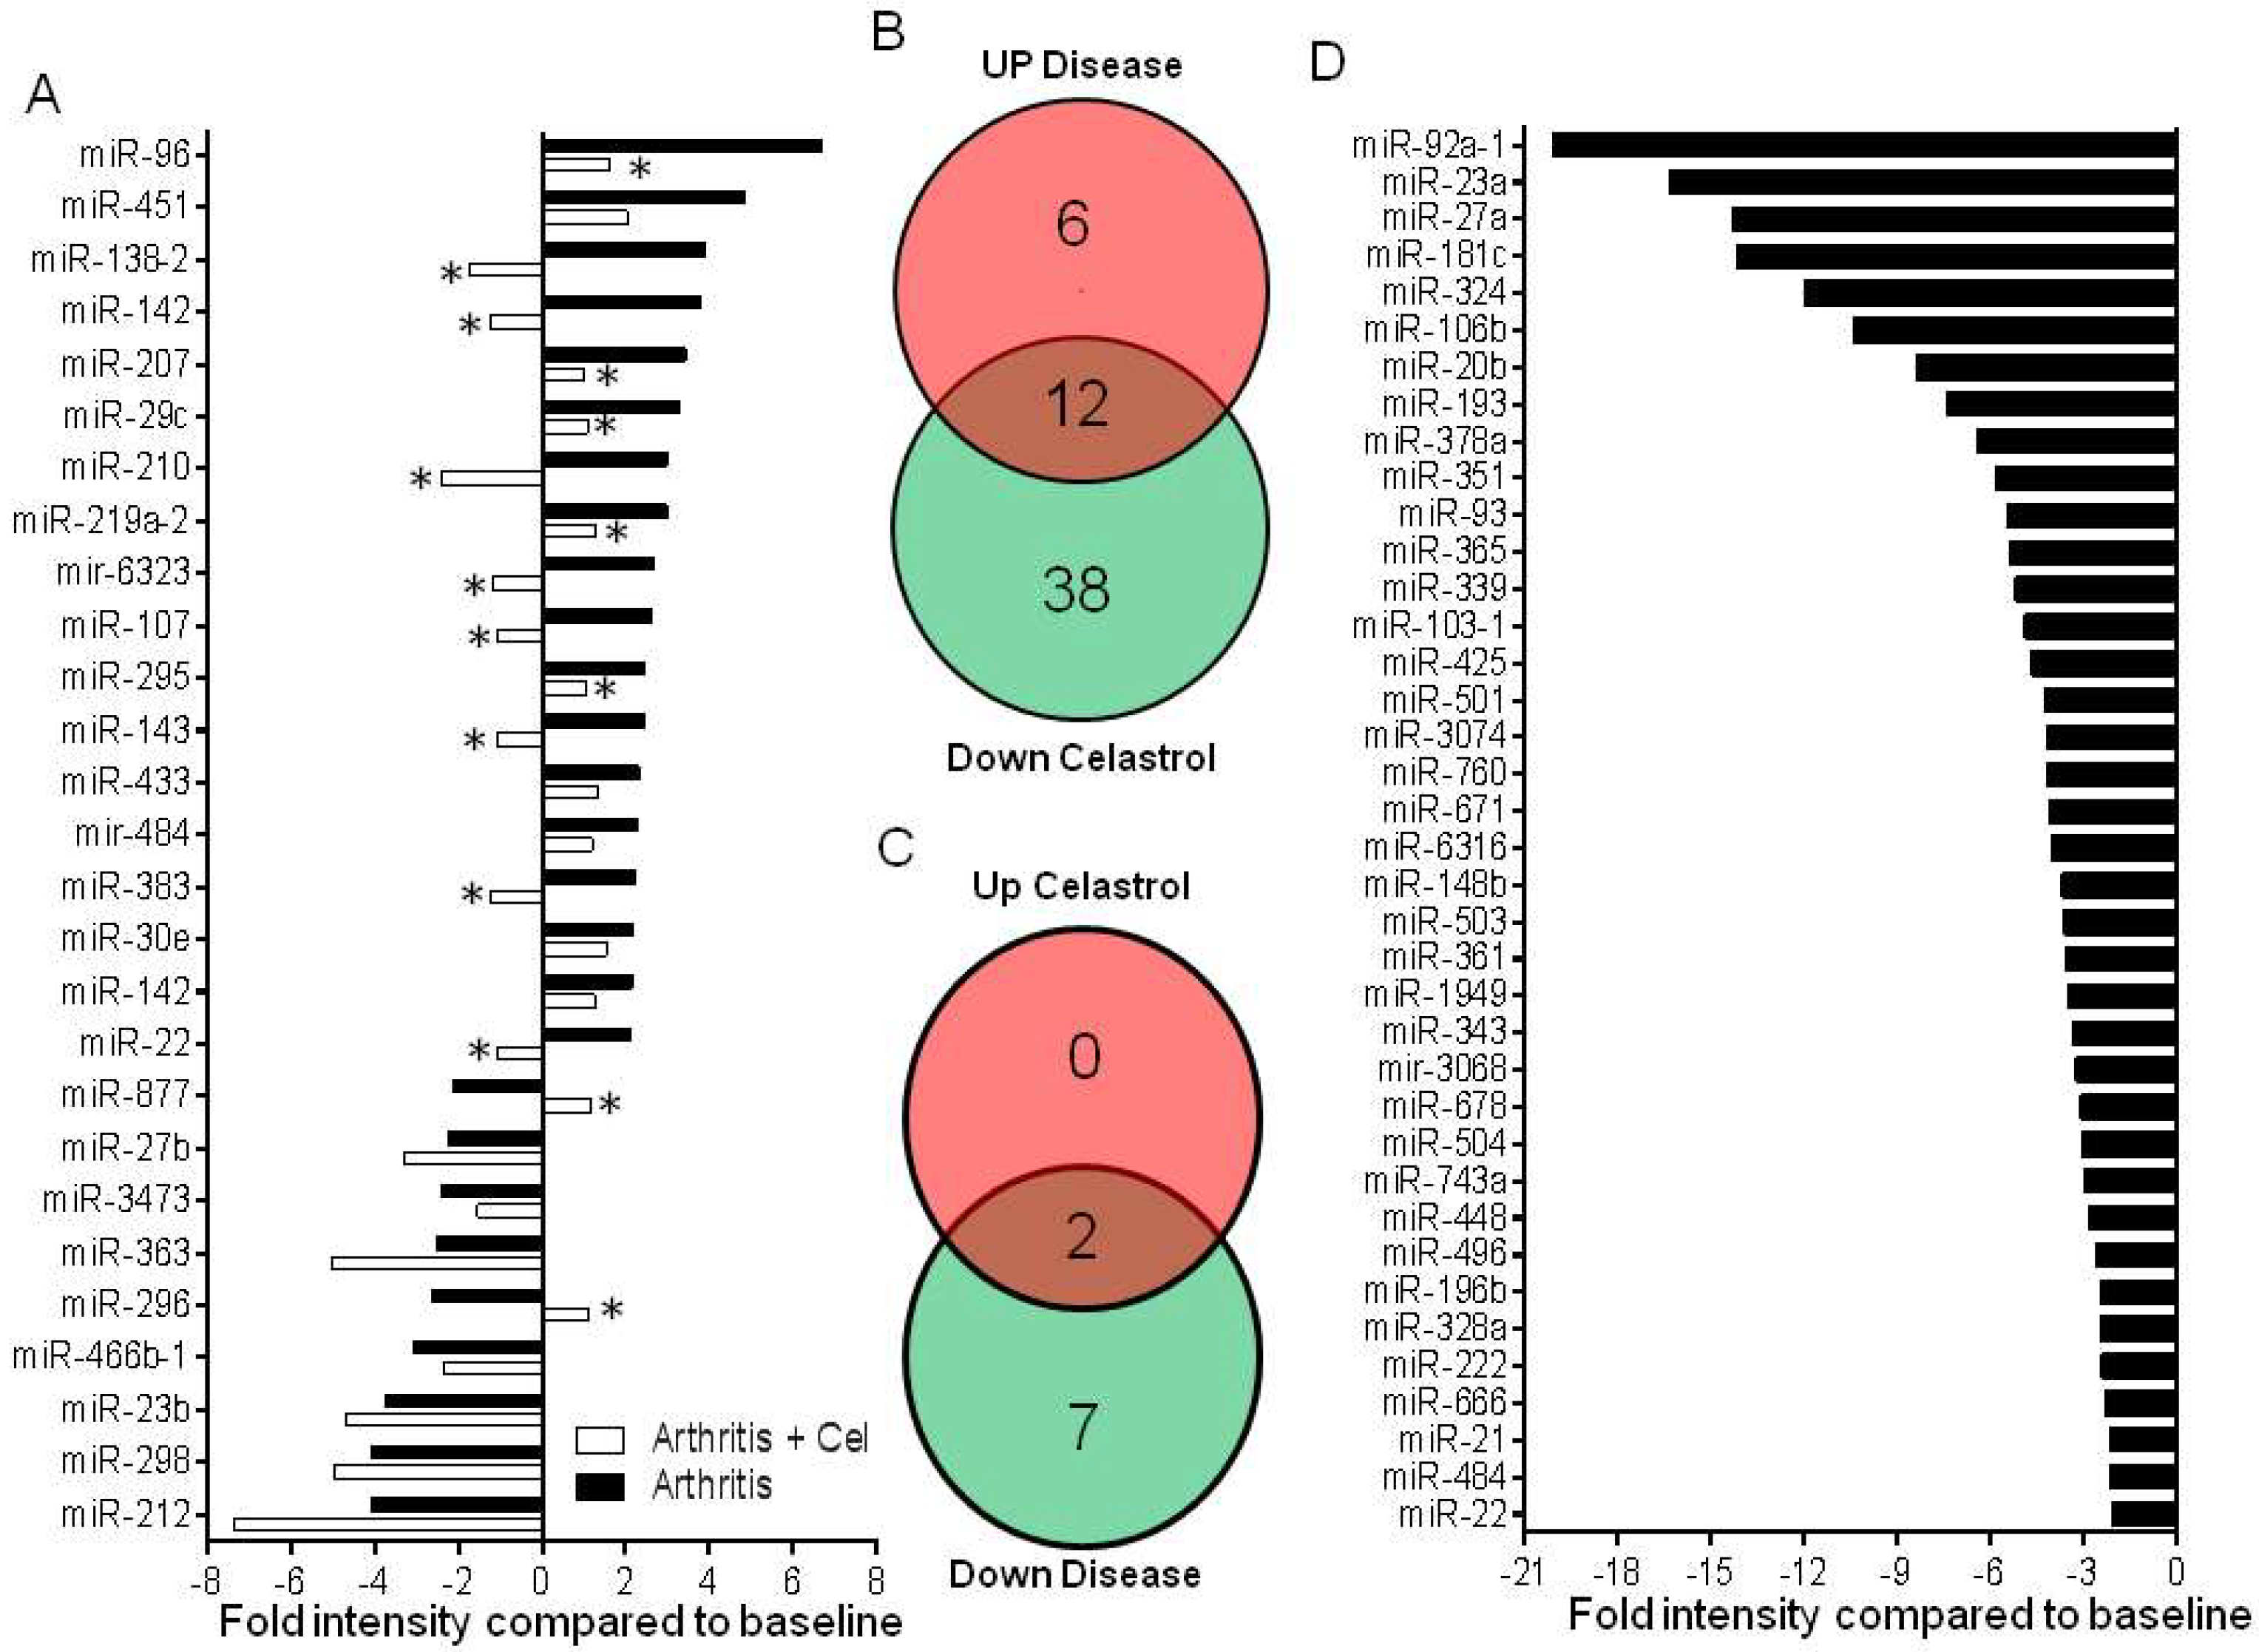
2.1. LNC Micro-RNA Expression Profile of Incubation Phase Rats and Vehicle-Treated Arthritic Rats
2.2. LNC Micro-RNA Expression Profile of Celastrol-Treated Arthritic Rats
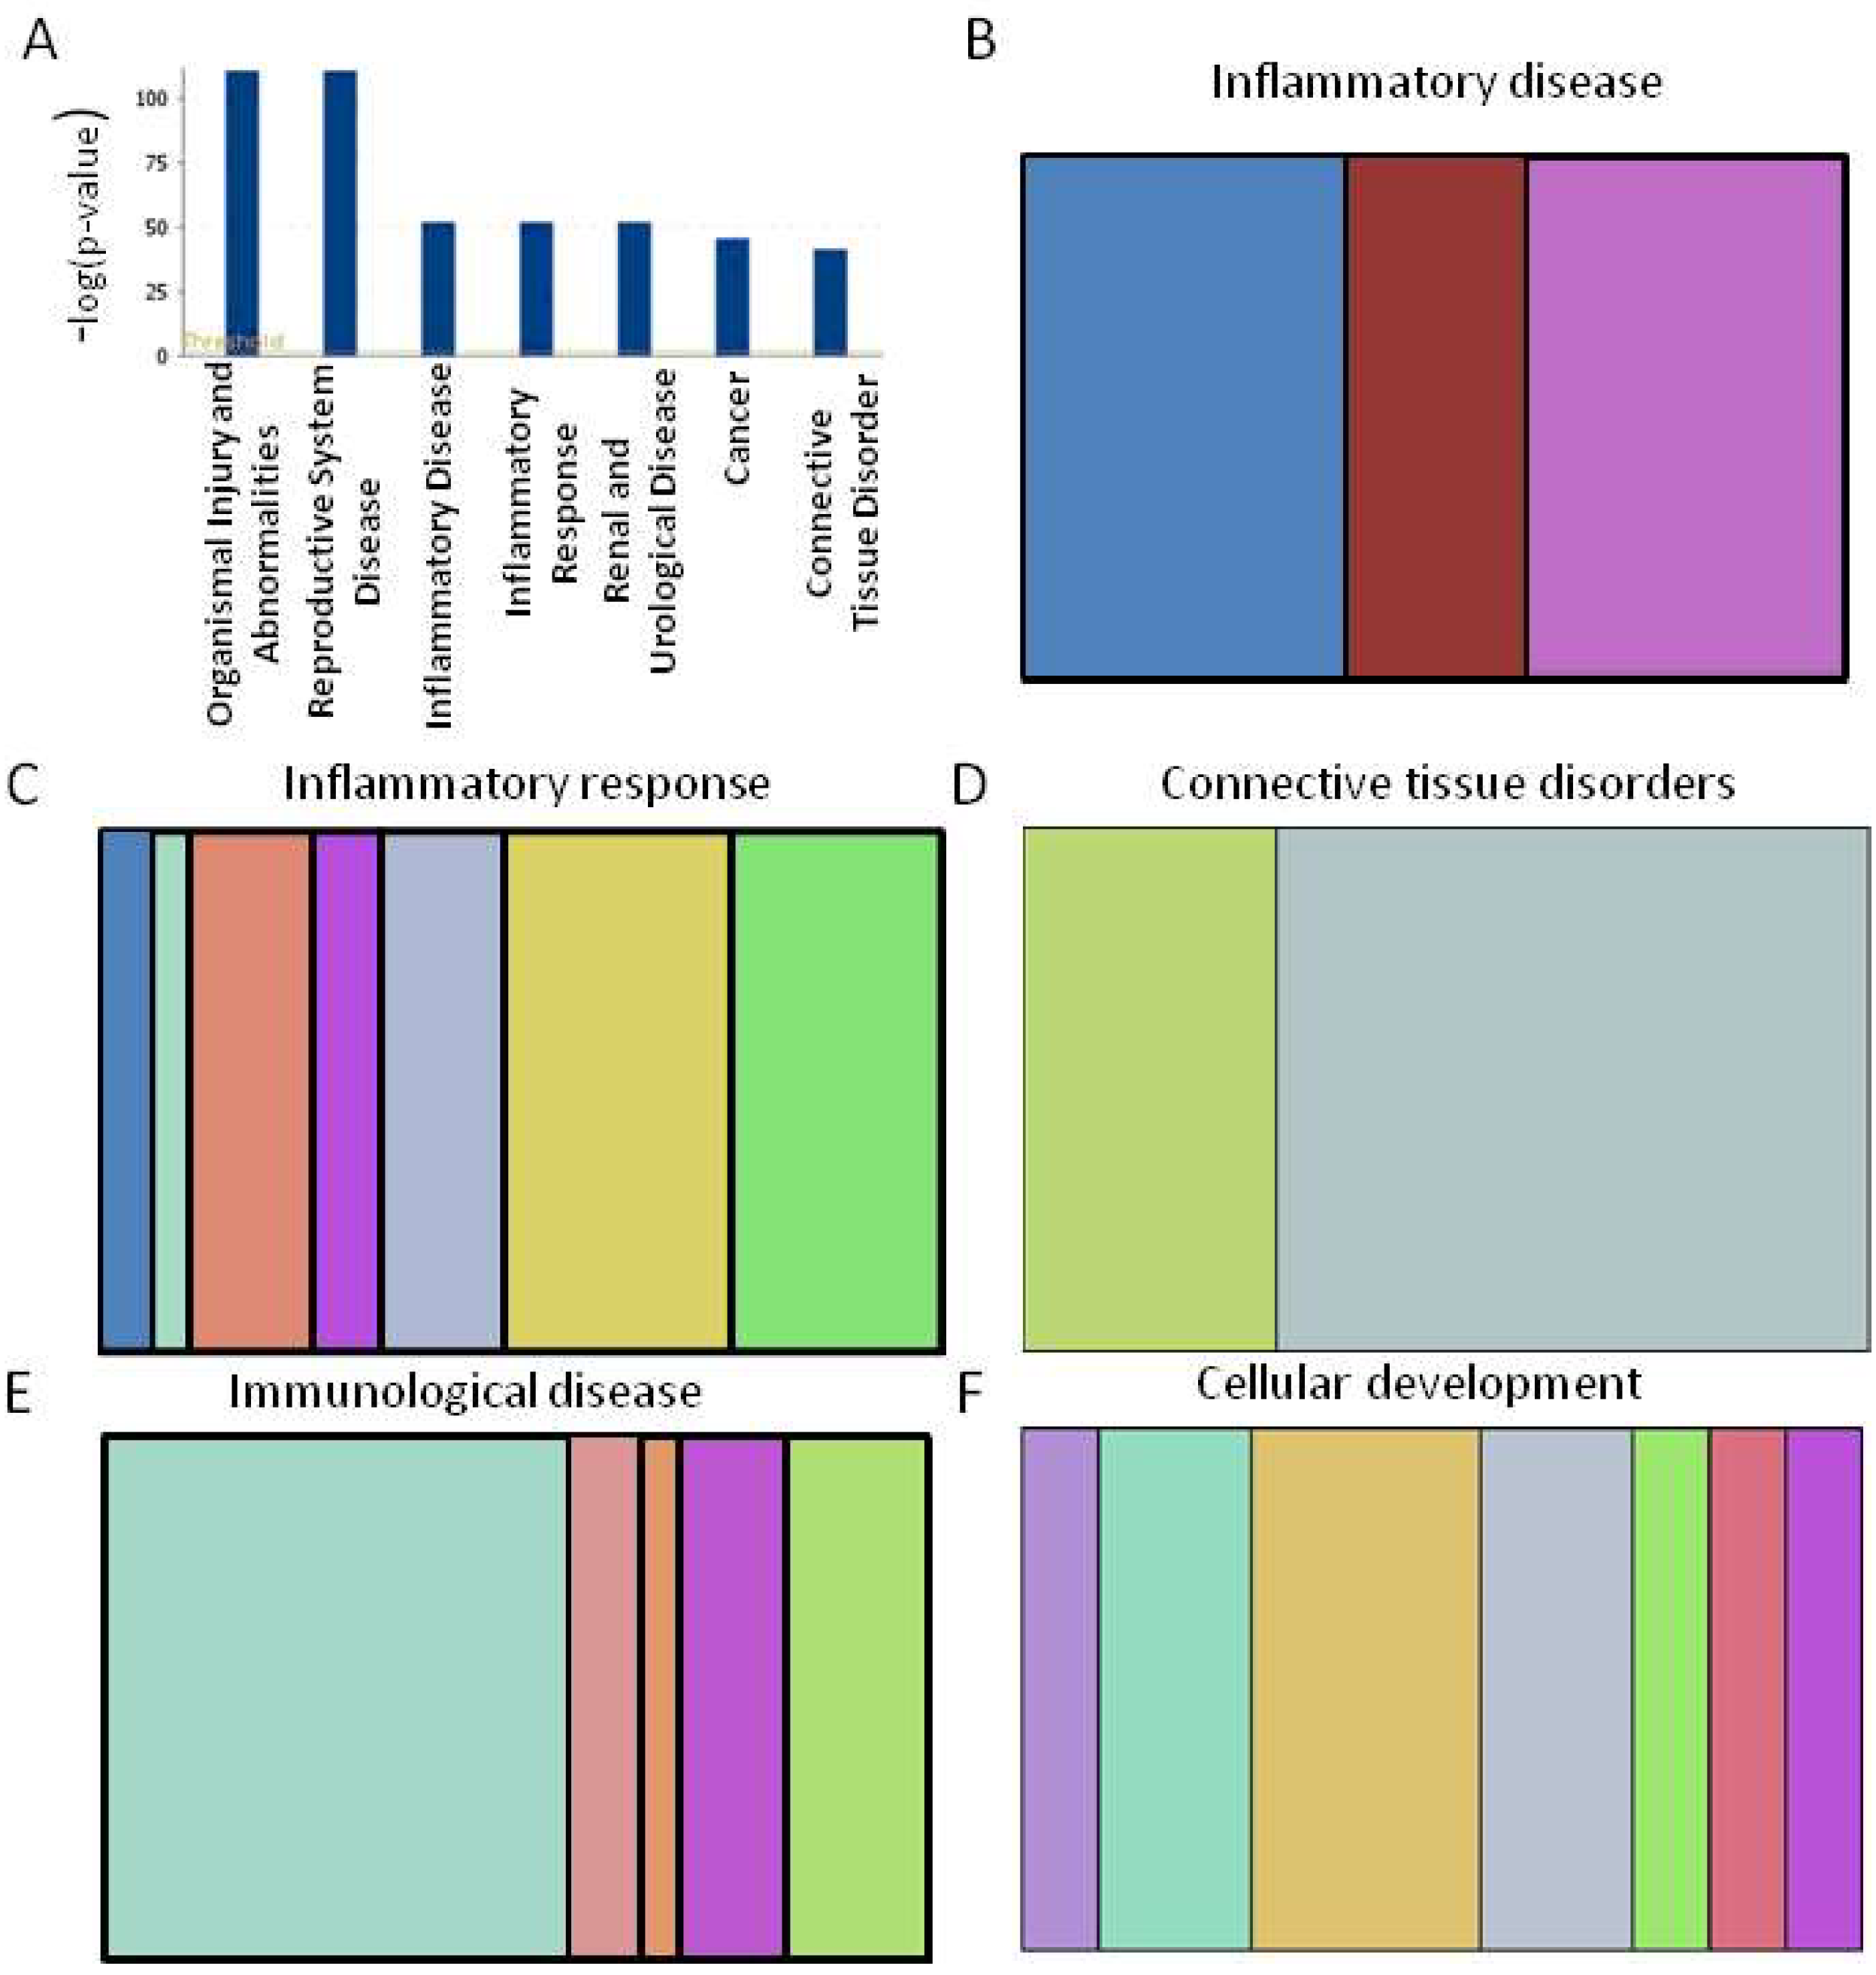
2.3. Functional Analysis of Specific Micro-RNAs Identified Following Initial Screening
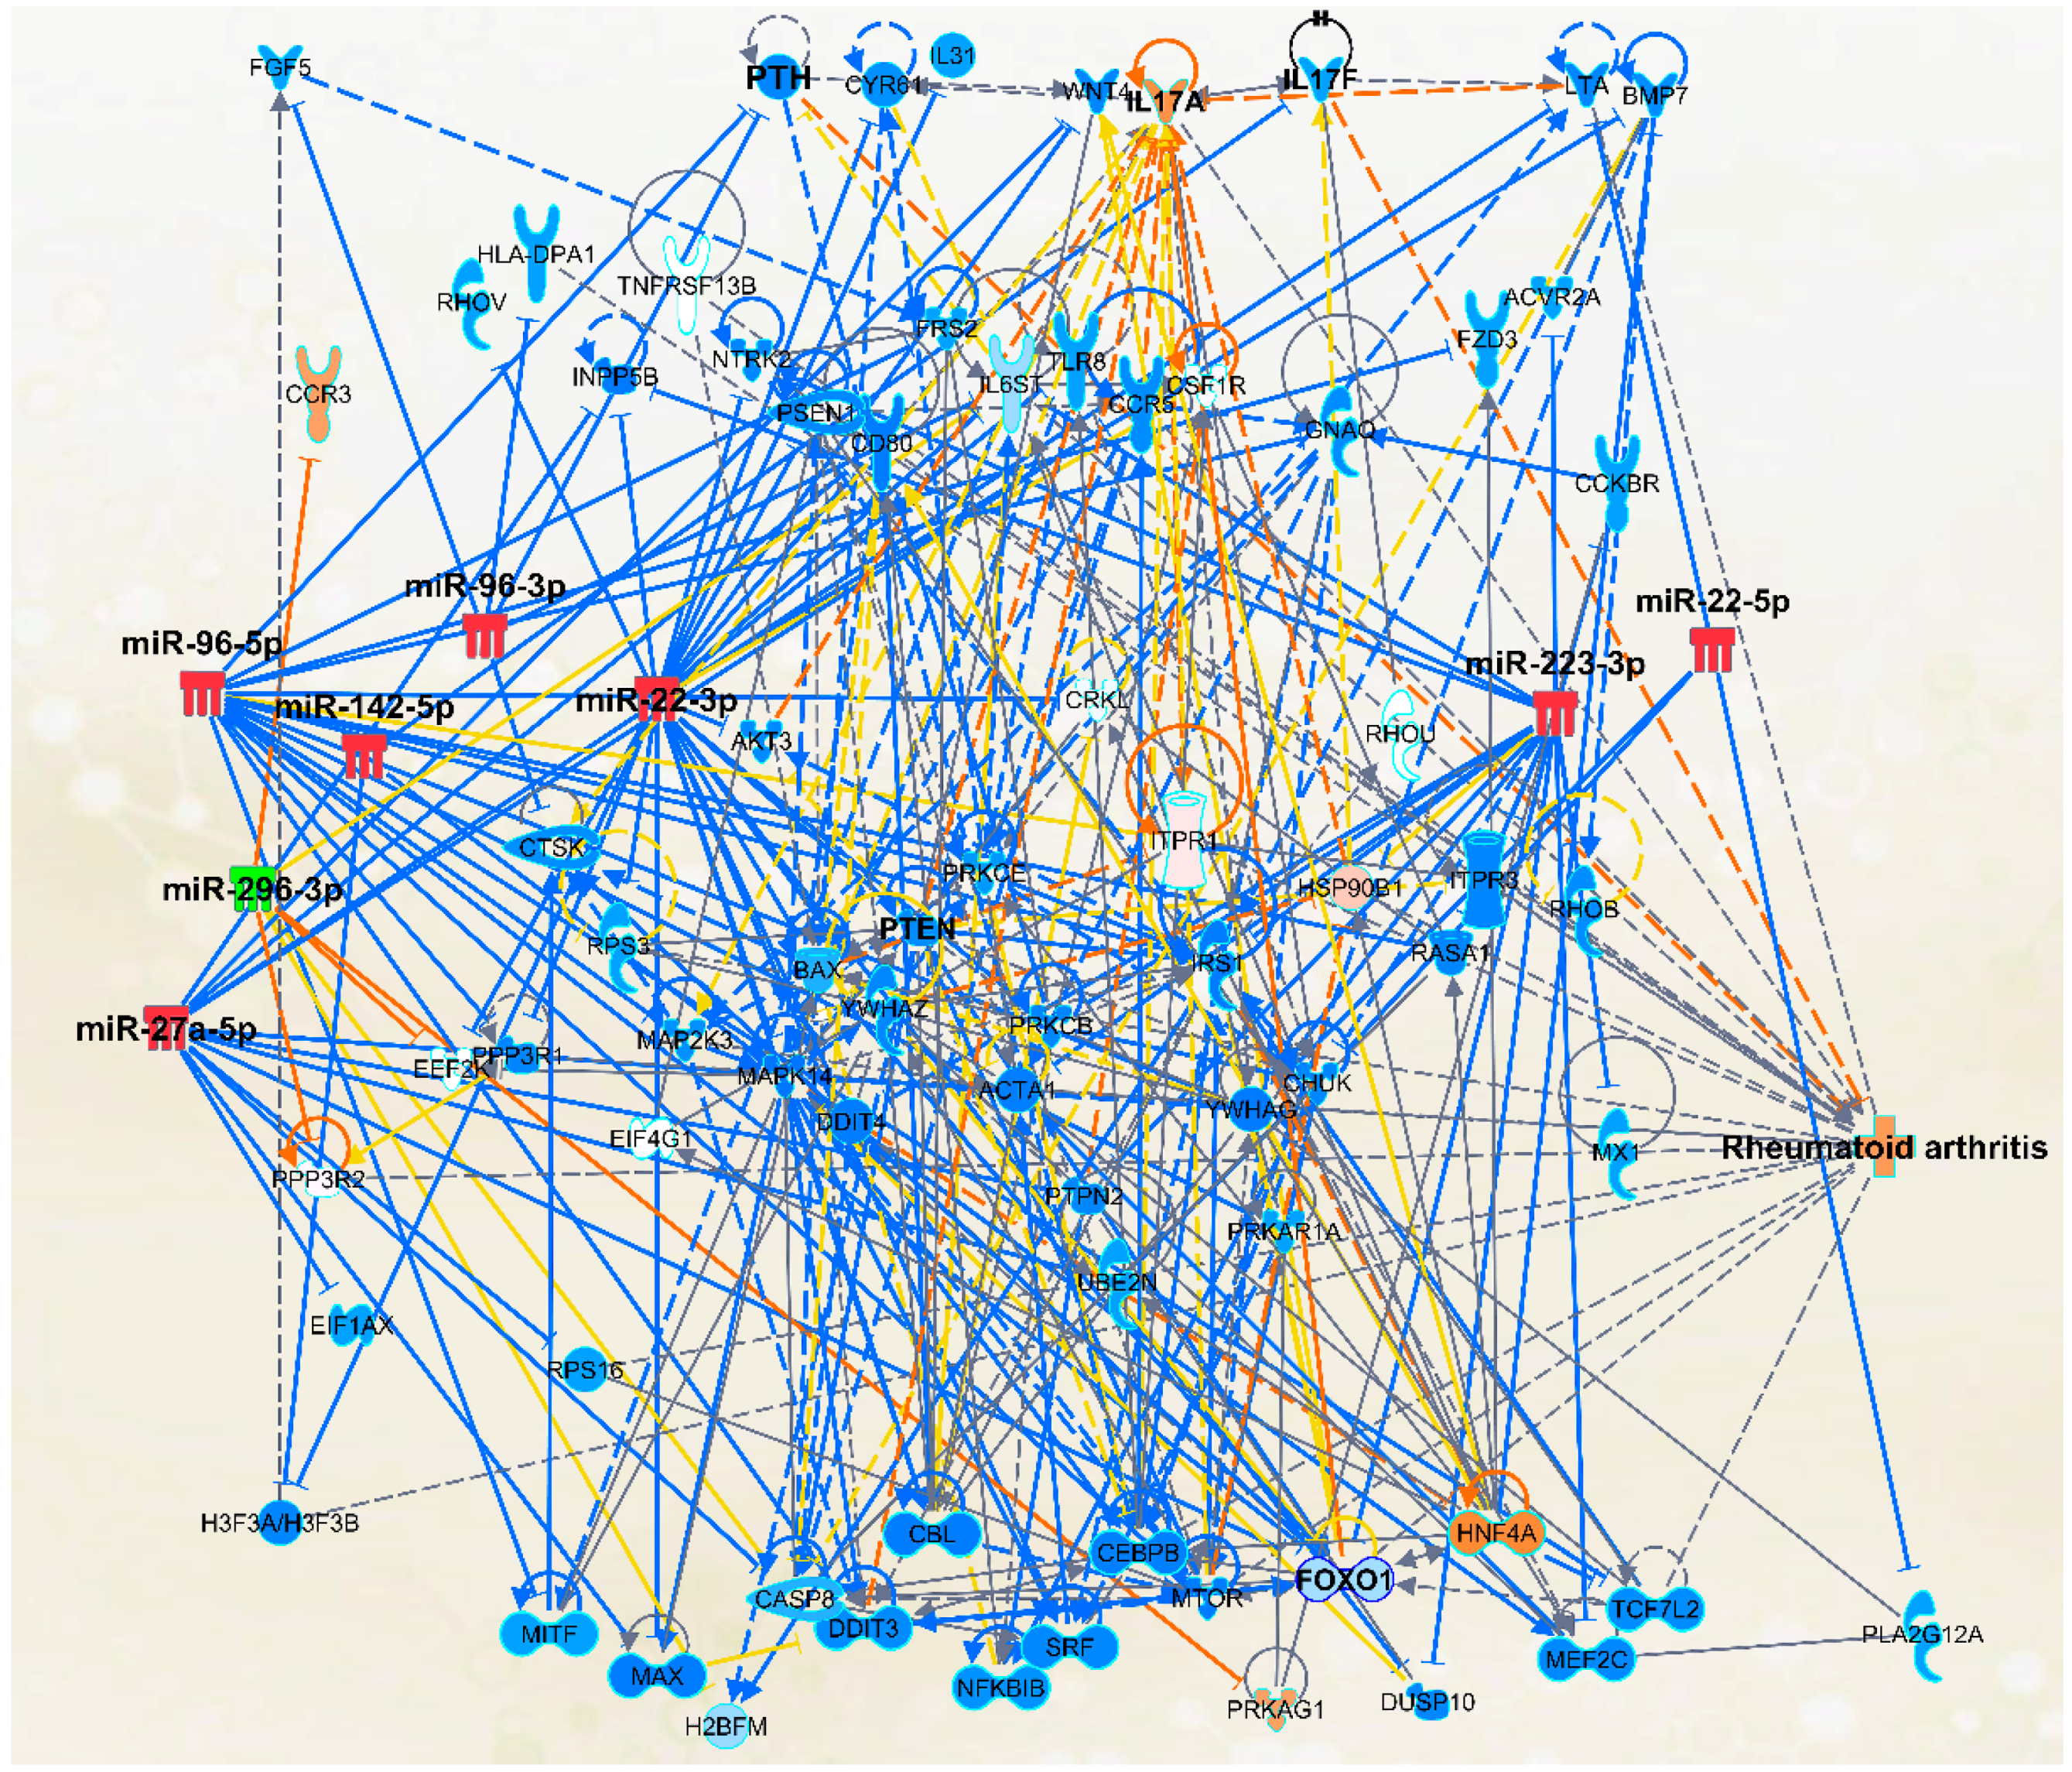
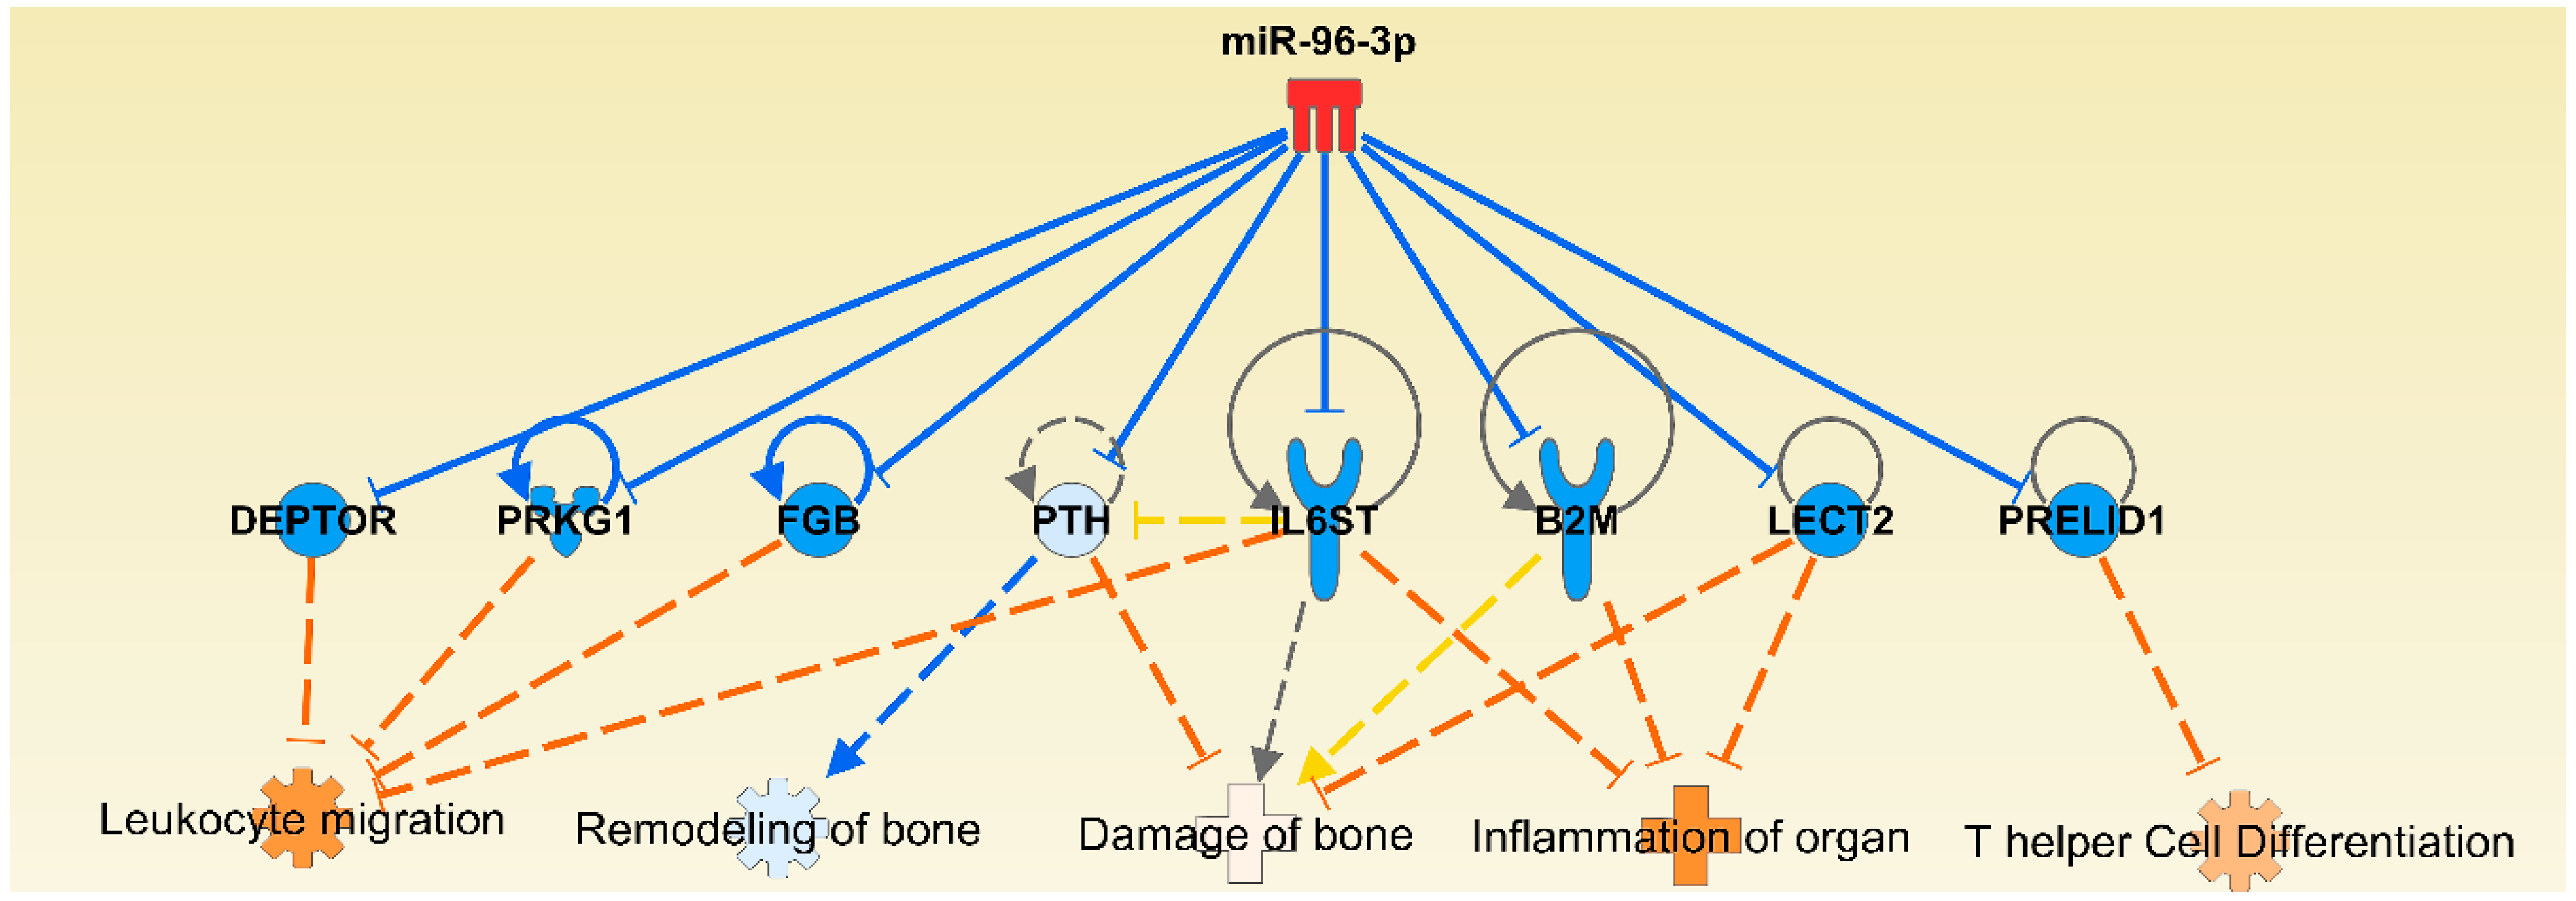
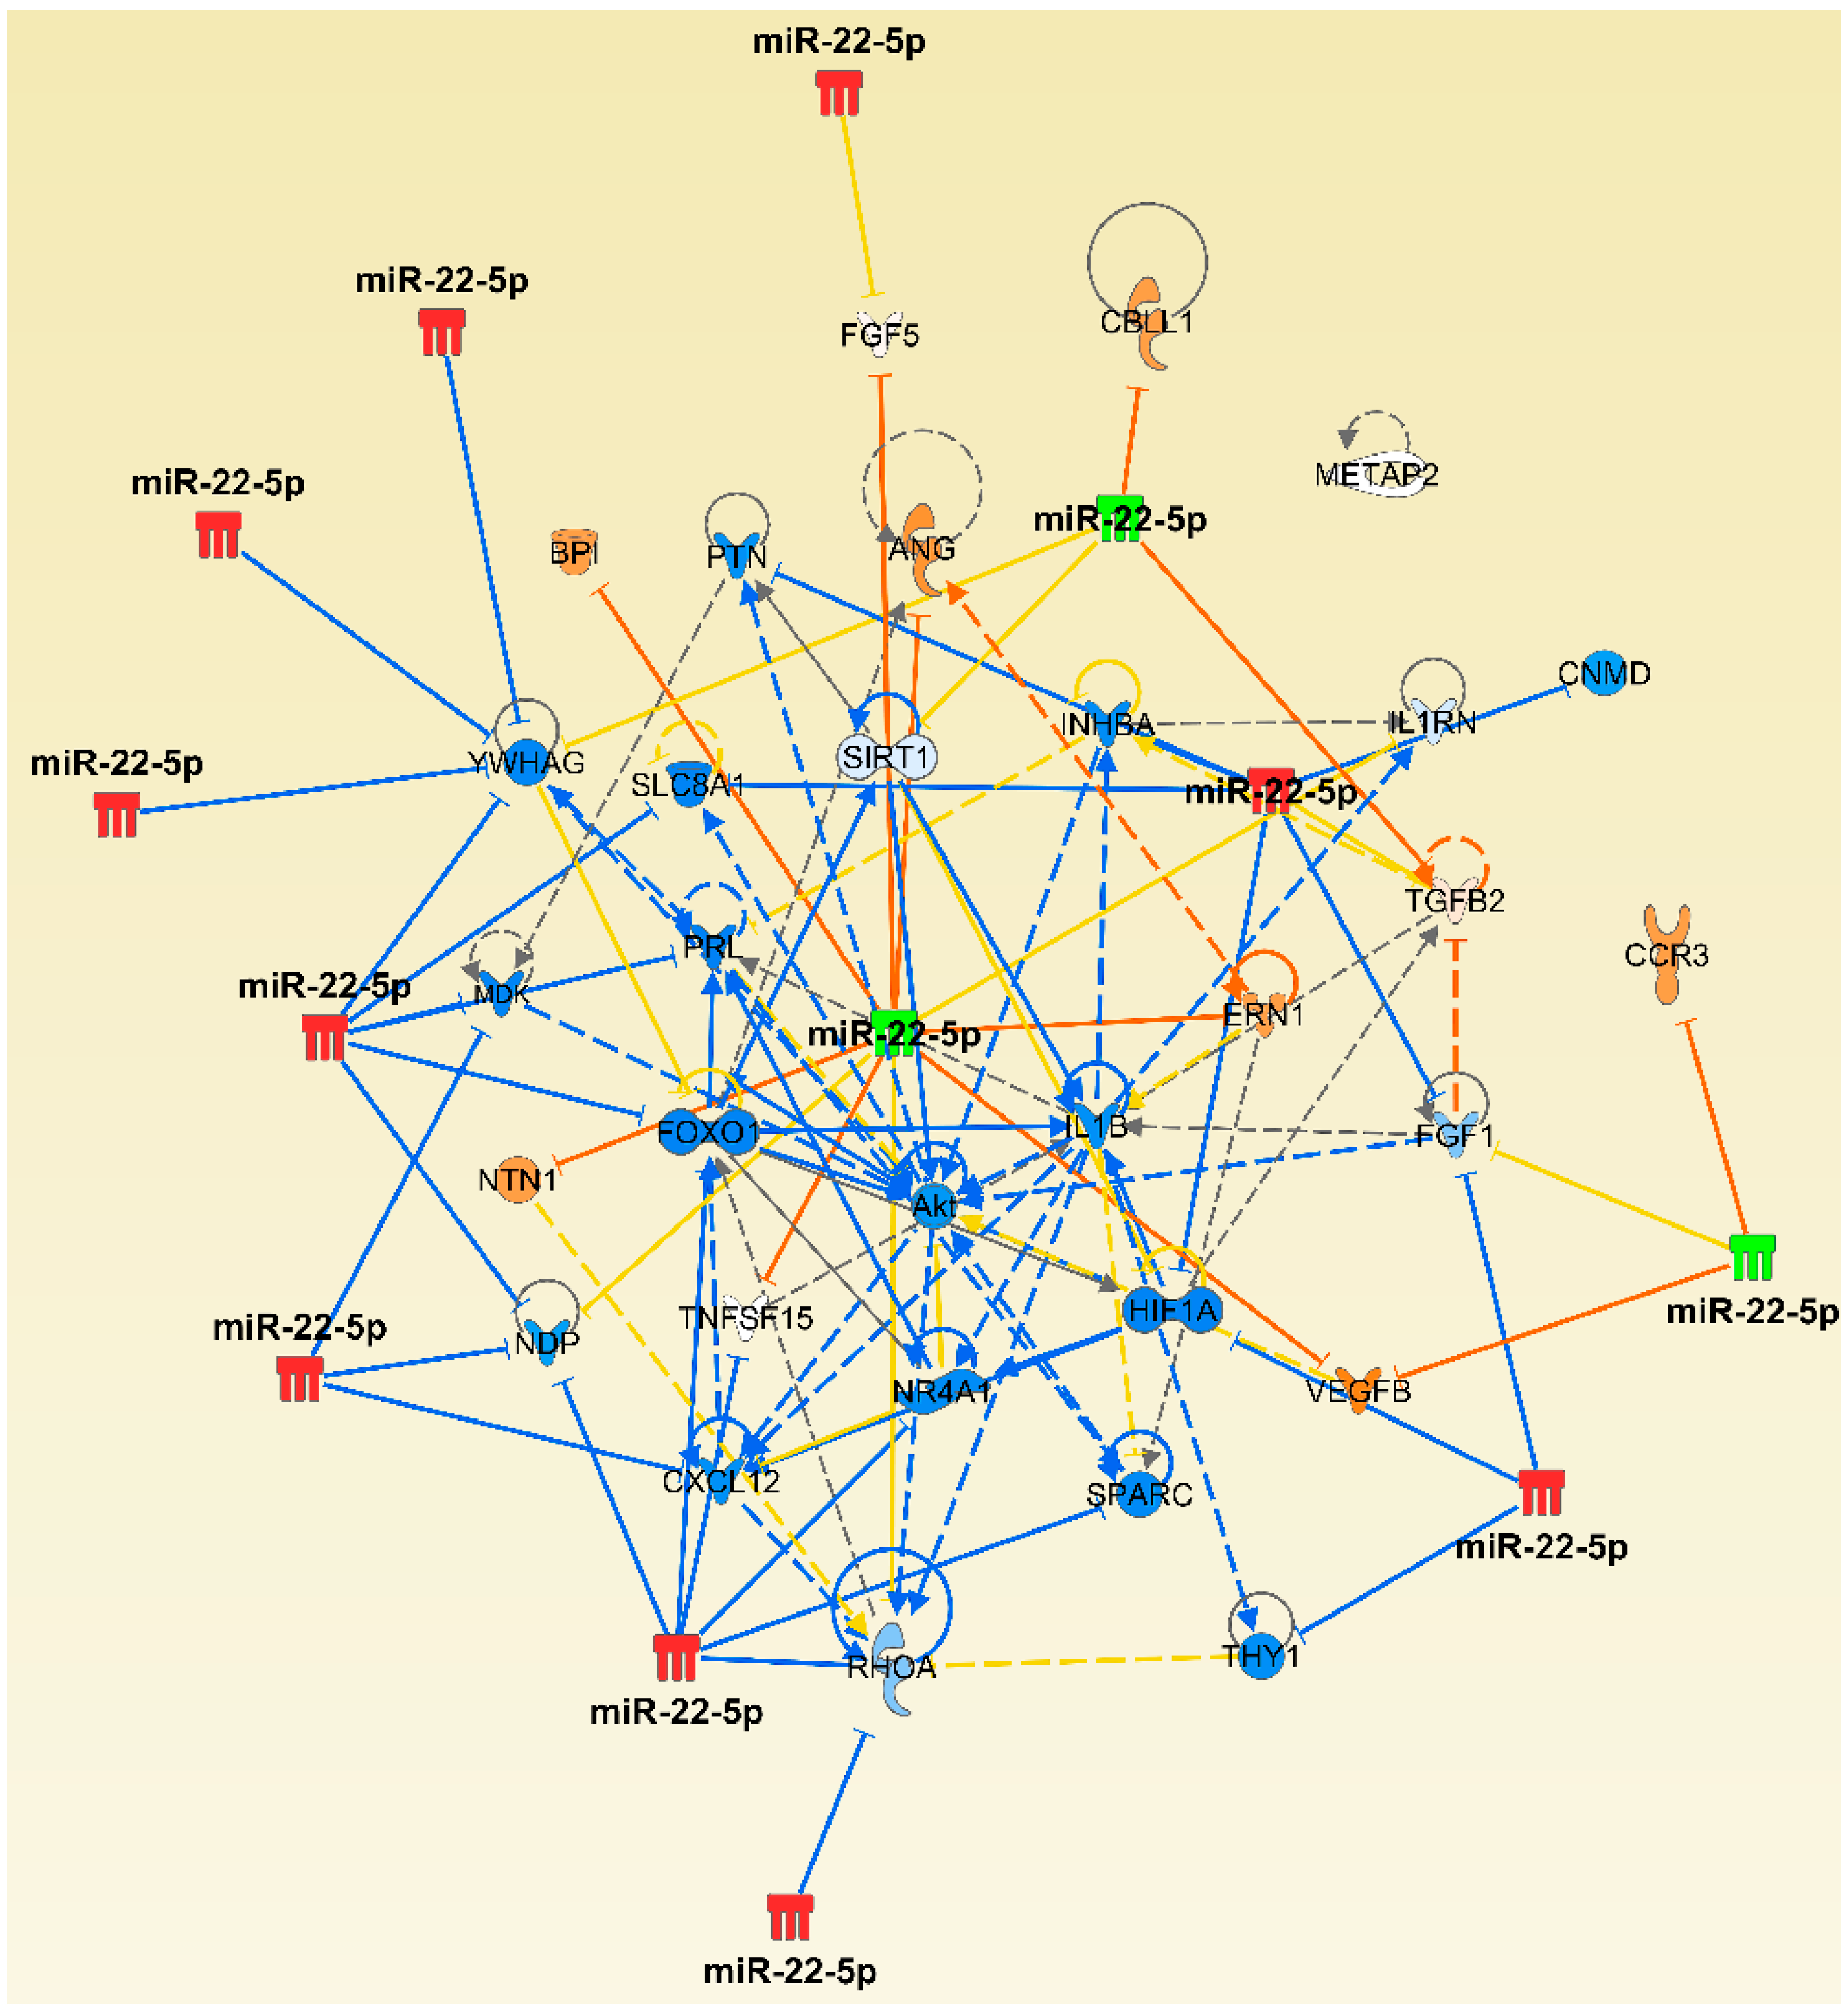
2.4. The Micro-RNA-Messenger RNA Interactions and Network Mapping
2.5. Micro-RNA Expression in Endothelial Cells and Their Functional Relevance
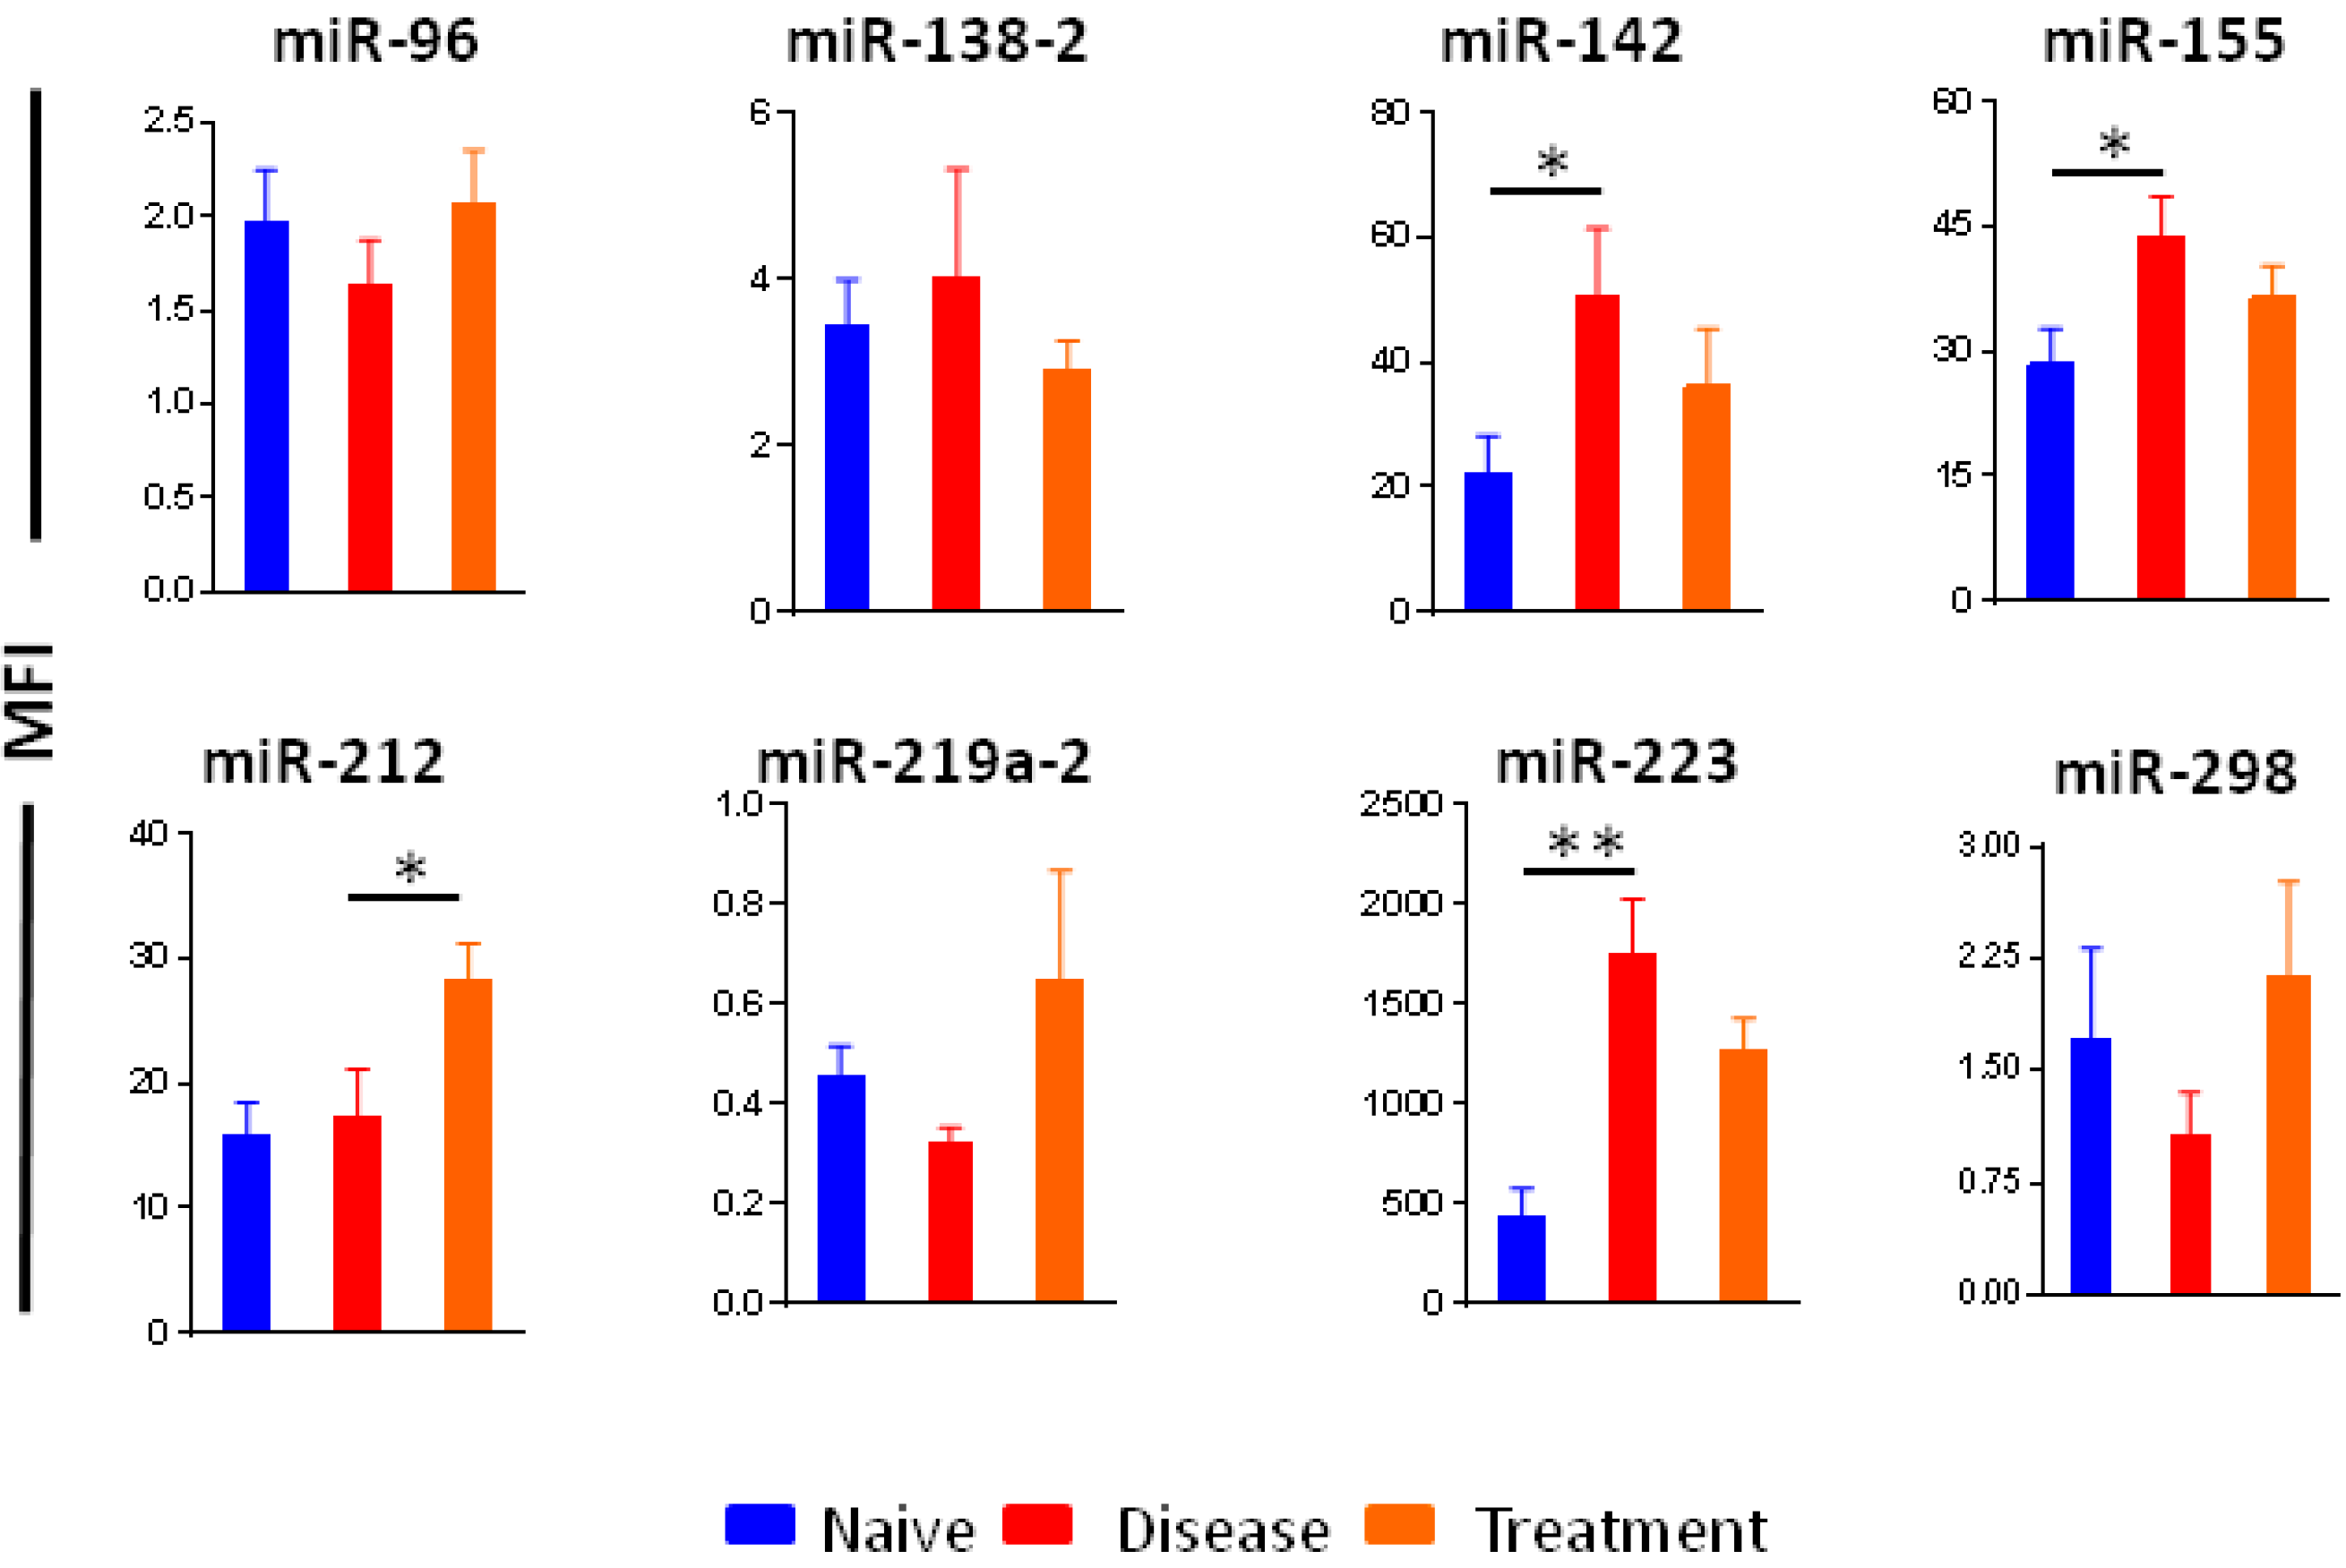
2.6. Selection of Micro-RNAs as Biomarkers of Arthritis and Therapeutic Response
2.7. Circulating Micro-RNAs in Sera of Rats
2.8. Messenger RNA Targets of Select Micro-RNAs
3. Discussion
4. Materials and Methods
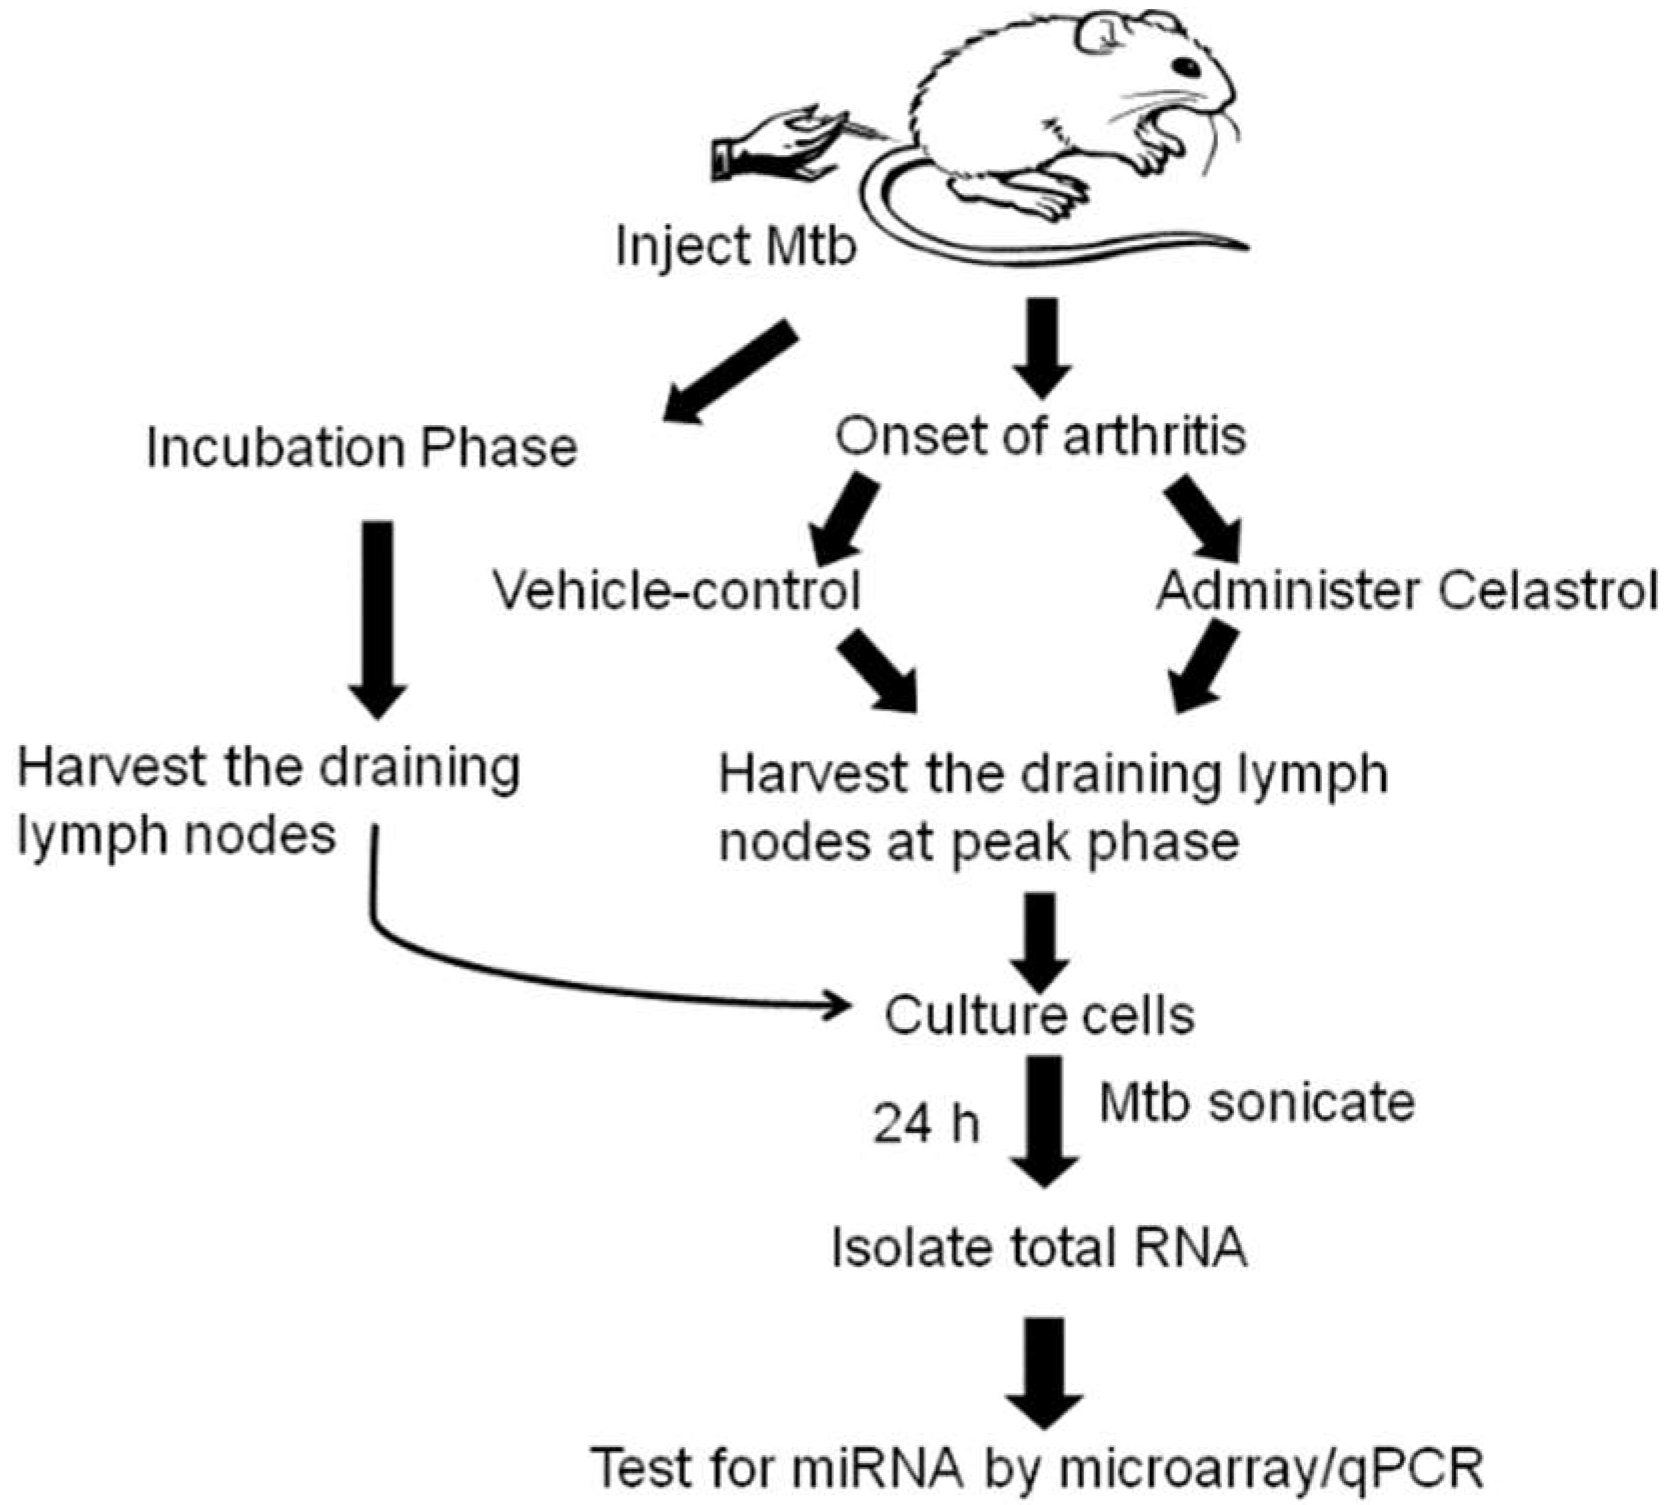
4.1. Induction and Evaluation of Adjuvant-induced Arthritis (AA) in Lewis Rats
4.2. Treatment of Arthritic Rats with Celastrol
4.3. Lymph Node Cell (LNC) Culture and Total RNA Extraction
4.3.1. LNC of In Vivo Vehicle/Celastrol Treatment Group:
4.3.2. LNC of Incubation Phase Rats:
4.3.3. RNA Isolation from LNC of Rats:
4.4. Micro-RNA Hybridization and Microarray Analysis
4.5. Testing Micro-RNA Levels in Sera of Rats
5. Conclusions
Supplementary Materials
Declaration
Author Contributions
Funding
Acknowledgments
Conflicts of Interest
References
- Harris, E.D.J. Rheumatoid arthritis. Pathophysiology and implications for therapy. N. Engl. J. Med. 1990, 322, 1277–1289. [Google Scholar] [PubMed]
- Birch, J.T., Jr.; Bhattacharya, S. Emerging trends in diagnosis and treatment of rheumatoid arthritis. Prim. Care 2010, 37, 779–792. [Google Scholar] [CrossRef] [PubMed]
- Rheumatoid Arthritis: National Clinical Guideline for Management and Treatment in Adults. National Collaborating Centre for Chronic Conditions (UK); Royal College of Physicians (UK): London, UK, 2009; Chapter 1; pp. 3–8.
- Alamanos, Y.; Drosos, A.A. Epidemiology of adult rheumatoid arthritis. Autoimmun. Rev. 2005, 4, 130–136. [Google Scholar] [CrossRef] [PubMed]
- Abou-Zeid, A.; Saad, M.; Soliman, E. MicroRNA 146a expression in rheumatoid arthritis: Association with tumor necrosis factor-α and disease activity. Genet. Test. Mol. Biomark. 2011, 15, 807–812. [Google Scholar] [CrossRef] [PubMed]
- Saferding, V.; Puchner, A.; Goncalves-Alves, E.; Hofmann, M.; Bonelli, M.; Brunner, J.S.; Sahin, E.; Niederreiter, B.; Hayer, S.; Kiener, H.P.; et al. MicroRNA-146a governs fibroblast activation and joint pathology in arthritis. J. Autoimmun. 2017, 82, 74–84. [Google Scholar] [CrossRef] [PubMed]
- Kurowska-Stolarska, M.; Alivernini, S.; Ballantine, L.E.; Asquith, D.L.; Millar, N.L.; Gilchrist, D.S.; Reilly, J.; Ierna, M.; Fraser, A.R.; Stolarski, B.; et al. MicroRNA-155 as a proinflammatory regulator in clinical and experimental arthritis. Proc. Natl. Acad. Sci. USA 2011, 108, 11193–11198. [Google Scholar] [CrossRef] [PubMed] [Green Version]
- Yuasa, S.; Yamaguchi, H.; Nakanishi, Y.; Kawaminami, S.; Tabata, R.; Shimizu, N.; Kohno, M.; Shimizu, T.; Miyata, J.; Nakayama, M.; et al. Treatment responses and their predictors in patients with rheumatoid arthritis treated with biological agents. J. Med. Investig. 2013, 60, 77–90. [Google Scholar] [CrossRef]
- Kastbom, A.; Strandberg, G.; Lindroos, A.; Skogh, T. Anti-CCP antibody test predicts the disease course during 3 years in early rheumatoid arthritis (the Swedish TIRA project). Ann. Rheum. Dis. 2004, 63, 1085–1089. [Google Scholar] [CrossRef] [PubMed] [Green Version]
- Gavrila, B.I.; Ciofu, C.; Stoica, V. Biomarkers in Rheumatoid Arthritis, what is new? J. Med. Life 2016, 9, 144–148. [Google Scholar] [PubMed]
- Skare, T.L.; Nisihara, R.; Barbosa, B.B.; da Luz, A.; Utiyama, S.; Picceli, V. Anti-CCP in systemic lupus erythematosus patients: A cross sectional study in Brazilian patients. Clin. Rheumatol. 2013, 32, 1065–1070. [Google Scholar] [CrossRef] [PubMed]
- Szodoray, P.; Szabo, Z.; Kapitany, A.; Gyetvai, A.; Lakos, G.; Szanto, S.; Szucs, G.; Szekanecz, Z. Anti-citrullinated protein/peptide autoantibodies in association with genetic and environmental factors as indicators of disease outcome in rheumatoid arthritis. Autoimmun. Rev. 2010, 9, 140–143. [Google Scholar] [CrossRef] [PubMed] [Green Version]
- Pillai, R.S. MicroRNA function: Multiple mechanisms for a tiny RNA? RNA 2005, 11, 1753–1761. [Google Scholar] [CrossRef] [PubMed] [Green Version]
- Haseeb, A.; Makki, M.S.; Khan, N.M.; Ahmad, I.; Haqqi, T.M. Deep sequencing and analyses of miRNAs, isomiRs and miRNA induced silencing complex (miRISC)-associated miRNome in primary human chondrocytes. Sci. Rep. 2017, 7, 15178. [Google Scholar] [CrossRef] [PubMed]
- Eades, G.; Yang, M.; Yao, Y.; Zhang, Y.; Zhou, Q. miR-200a regulates NRF2 activation by targeting Keap1 mRNA in breast cancer cells. J. Biol. Chem. 2011, 286, 40725–40733. [Google Scholar] [CrossRef] [PubMed]
- Berindan-Neagoe, I.; Monroig Pdel, C.; Pasculli, B.; Calin, G.A. MicroRNAome genome: A treasure for cancer diagnosis and therapy. CA Cancer J. Clin. 2014, 64, 311–336. [Google Scholar] [CrossRef] [PubMed] [Green Version]
- Brower, J.V.; Clark, P.A.; Lyon, W.; Kuo, J.S. MicroRNAs in cancer: Glioblastoma and glioblastoma cancer stem cells. Neurochem. Int. 2014, 77, 68–77. [Google Scholar] [CrossRef] [PubMed] [Green Version]
- Parrella, P.; Barbano, R.; Pasculli, B.; Fontana, A.; Copetti, M.; Valori, V.M.; Poeta, M.L.; Perrone, G.; Righi, D.; Castelvetere, M.; et al. Evaluation of microRNA-10b prognostic significance in a prospective cohort of breast cancer patients. Mol. Cancer 2014, 13, 142. [Google Scholar] [CrossRef] [PubMed]
- Ceribelli, A.; Nahid, M.A.; Satoh, M.; Chan, E.K. MicroRNAs in rheumatoid arthritis. FEBS Lett. 2011, 585, 3667–3674. [Google Scholar] [CrossRef] [PubMed] [Green Version]
- Stanczyk, J.; Pedrioli, D.M.; Brentano, F.; Sanchez-Pernaute, O.; Kolling, C.; Gay, R.E.; Detmar, M.; Gay, S.; Kyburz, D. Altered expression of MicroRNA in synovial fibroblasts and synovial tissue in rheumatoid arthritis. Arthritis Rheum. 2008, 58, 1001–1009. [Google Scholar] [CrossRef] [PubMed] [Green Version]
- Sode, J.; Krintel, S.B.; Carlsen, A.L.; Hetland, M.L.; Johansen, J.S.; Horslev-Petersen, K.; Stengaard-Pedersen, K.; Ellingsen, T.; Burton, M.; Junker, P.; et al. Plasma MicroRNA Profiles in Patients with Early Rheumatoid Arthritis Responding to Adalimumab plus Methotrexate vs Methotrexate Alone: A Placebo-controlled Clinical Trial. J. Rheumatol. 2018, 45, 53–61. [Google Scholar] [CrossRef] [PubMed]
- Du, C.; Liu, C.; Kang, J.; Zhao, G.; Ye, Z.; Huang, S.; Li, Z.; Wu, Z.; Pei, G. MicroRNA miR-326 regulates TH-17 differentiation and is associated with the pathogenesis of multiple sclerosis. Nat. Immunol. 2009, 10, 1252–1259. [Google Scholar] [CrossRef] [PubMed]
- Lindberg, R.L.; Hoffmann, F.; Mehling, M.; Kuhle, J.; Kappos, L. Altered expression of miR-17-5p in CD4+ lymphocytes of relapsing-remitting multiple sclerosis patients. Eur. J. Immunol. 2010, 40, 888–898. [Google Scholar] [CrossRef] [PubMed]
- Wang, H.; Peng, W.; Ouyang, X.; Li, W.; Dai, Y. Circulating microRNAs as candidate biomarkers in patients with systemic lupus erythematosus. Transl. Res. 2012, 160, 198–206. [Google Scholar] [CrossRef] [PubMed]
- Miller, C.H.; Smith, S.M.; Elguindy, M.; Zhang, T.; Xiang, J.Z.; Hu, X.; Ivashkiv, L.B.; Zhao, B. RBP-J-Regulated miR-182 Promotes TNF-α-Induced Osteoclastogenesis. J. Immunol. 2016, 196, 4977–4986. [Google Scholar] [CrossRef] [PubMed]
- Ma, X.; Zhou, J.; Zhong, Y.; Jiang, L.; Mu, P.; Li, Y.; Singh, N.; Nagarkatti, M.; Nagarkatti, P. Expression, regulation and function of microRNAs in multiple sclerosis. Int. J. Med. Sci. 2014, 11, 810–818. [Google Scholar] [CrossRef] [PubMed]
- Pauley, K.M.; Satoh, M.; Chan, A.L.; Bubb, M.R.; Reeves, W.H.; Chan, E.K. Upregulated miR-146a expression in peripheral blood mononuclear cells from rheumatoid arthritis patients. Arthritis Res. Ther. 2008, 10, R101. [Google Scholar] [CrossRef] [PubMed]
- Li, J.; Wan, Y.; Guo, Q.; Zou, L.; Zhang, J.; Fang, Y.; Zhang, J.; Zhang, J.; Fu, X.; Liu, H.; et al. Altered microRNA expression profile with miR-146a upregulation in CD4+ T cells from patients with rheumatoid arthritis. Arthritis Res. Ther. 2010, 12, R81. [Google Scholar] [CrossRef] [PubMed] [Green Version]
- Nakasa, T.; Miyaki, S.; Okubo, A.; Hashimoto, M.; Nishida, K.; Ochi, M.; Asahara, H. Expression of microRNA-146 in rheumatoid arthritis synovial tissue. Arthritis Rheum. 2008, 58, 1284–1292. [Google Scholar] [CrossRef] [PubMed] [Green Version]
- Kopanska, M.; Szala, D.; Czech, J.; Gablo, N.; Gargasz, K.; Trzeciak, M.; Zawlik, I.; Snela, S. MiRNA expression in the cartilage of patients with osteoarthritis. J. Orthop. Surg. Res. 2017, 12, 51. [Google Scholar] [CrossRef] [PubMed]
- Murata, K.; Yoshitomi, H.; Tanida, S.; Ishikawa, M.; Nishitani, K.; Ito, H.; Nakamura, T. Plasma and synovial fluid microRNAs as potential biomarkers of rheumatoid arthritis and osteoarthritis. Arthritis Res. Ther. 2010, 12, R86. [Google Scholar] [CrossRef] [PubMed] [Green Version]
- Mookherjee, N.; El-Gabalawy, H.S. High degree of correlation between whole blood and PBMC expression levels of miR-155 and miR-146a in healthy controls and rheumatoid arthritis patients. J. Immunol. Methods 2013, 400–401, 106–110. [Google Scholar] [CrossRef] [PubMed]
- Van Eden, W.; Wagenaar-Hilbers, J.P.; Wauben, M.H. Adjuvant arthritis in the rat. Curr. Protoc. Immunol. 2001, 19, 15.4.1–15.4.8. [Google Scholar] [CrossRef]
- Moudgil, K.D.; Chang, T.T.; Eradat, H.; Chen, A.M.; Gupta, R.S.; Brahn, E.; Sercarz, E.E. Diversification of T cell responses to carboxy-terminal determinants within the 65-kD heat-shock protein is involved in regulation of autoimmune arthritis. J. Exp. Med. 1997, 185, 1307–1316. [Google Scholar] [CrossRef] [PubMed]
- Venkatesha, S.H.; Yu, H.; Rajaiah, R.; Tong, L.; Moudgil, K.D. Celastrus-derived celastrol suppresses autoimmune arthritis by modulating antigen-induced cellular and humoral effector responses. J. Biol. Chem. 2011, 286, 15138–15146. [Google Scholar] [CrossRef] [PubMed]
- Venkatesha, S.H.; Dudics, S.; Astry, B.; Moudgil, K.D. Control of autoimmune inflammation by celastrol, a natural triterpenoid. Pathog. Dis. 2016, 74. [Google Scholar] [CrossRef] [PubMed] [Green Version]
- Astry, B.; Venkatesha, S.H.; Laurence, A.; Christensen-Quick, A.; Garzino-Demo, A.; Frieman, M.B.; O’Shea, J.J.; Moudgil, K.D. Celastrol, a Chinese herbal compound, controls autoimmune inflammation by altering the balance of pathogenic and regulatory T cells in the target organ. Clin. Immunol. 2015, 157, 228–238. [Google Scholar] [CrossRef] [PubMed] [Green Version]
- He, D.; Xu, Q.; Yan, M.; Zhang, P.; Zhou, X.; Zhang, Z.; Duan, W.; Zhong, L.; Ye, D.; Chen, W. The NF-κB inhibitor, celastrol, could enhance the anti-cancer effect of gambogic acid on oral squamous cell carcinoma. BMC Cancer 2009, 9, 343. [Google Scholar] [CrossRef] [PubMed]
- Dessein, P.H.; Joffe, B.I.; Singh, S. Biomarkers of endothelial dysfunction, cardiovascular risk factors and atherosclerosis in rheumatoid arthritis. Arthritis Res. Ther. 2005, 7, R634–R643. [Google Scholar] [CrossRef] [PubMed]
- Haruna, Y.; Morita, Y.; Komai, N.; Yada, T.; Sakuta, T.; Tomita, N.; Fox, D.A.; Kashihara, N. Endothelial dysfunction in rat adjuvant-induced arthritis: Vascular superoxide production by NAD(P)H oxidase and uncoupled endothelial nitric oxide synthase. Arthritis Rheum. 2006, 54, 1847–1855. [Google Scholar] [CrossRef] [PubMed] [Green Version]
- Szekanecz, Z.; Koch, A.E. Angiogenesis and its targeting in rheumatoid arthritis. Vascul. Pharmacol. 2009, 51, 1–7. [Google Scholar] [CrossRef] [PubMed] [Green Version]
- Poole, K.E.; Reeve, J. Parathyroid hormone—A bone anabolic and catabolic agent. Curr. Opin. Pharmacol. 2005, 5, 612–617. [Google Scholar] [CrossRef] [PubMed]
- Lombardi, G.; Di Somma, C.; Rubino, M.; Faggiano, A.; Vuolo, L.; Guerra, E.; Contaldi, P.; Savastano, S.; Colao, A. The roles of parathyroid hormone in bone remodeling: Prospects for novel therapeutics. J. Endocrinol. Investig. 2011, 34, 18–22. [Google Scholar]
- Chassot, A.A.; Bradford, S.T.; Auguste, A.; Gregoire, E.P.; Pailhoux, E.; de Rooij, D.G.; Schedl, A.; Chaboissier, M.C. WNT4 and RSPO1 together are required for cell proliferation in the early mouse gonad. Development 2012, 139, 4461–4472. [Google Scholar] [CrossRef] [PubMed] [Green Version]
- Franco, H.L.; Dai, D.; Lee, K.Y.; Rubel, C.A.; Roop, D.; Boerboom, D.; Jeong, J.W.; Lydon, J.P.; Bagchi, I.C.; Bagchi, M.K.; et al. WNT4 is a key regulator of normal postnatal uterine development and progesterone signaling during embryo implantation and decidualization in the mouse. FASEB J. 2011, 25, 1176–1187. [Google Scholar] [CrossRef] [PubMed] [Green Version]
- Yu, B.; Chang, J.; Liu, Y.; Li, J.; Kevork, K.; Al-Hezaimi, K.; Graves, D.T.; Park, N.H.; Wang, C.Y. Wnt4 signaling prevents skeletal aging and inflammation by inhibiting nuclear factor-κB. Nat. Med. 2014, 20, 1009–1017. [Google Scholar] [CrossRef] [PubMed] [Green Version]
- Grabiec, A.M.; Angiolilli, C.; Hartkamp, L.M.; van Baarsen, L.G.; Tak, P.P.; Reedquist, K.A. JNK-dependent downregulation of FoxO1 is required to promote the survival of fibroblast-like synoviocytes in rheumatoid arthritis. Ann. Rheum. Dis. 2015, 74, 1763–1771. [Google Scholar] [CrossRef] [PubMed]
- Yadav, V.R.; Prasad, S.; Sung, B.; Kannappan, R.; Aggarwal, B.B. Targeting inflammatory pathways by triterpenoids for prevention and treatment of cancer. Toxins 2010, 2, 2428–2466. [Google Scholar] [CrossRef] [PubMed]
- Salminen, A.; Lehtonen, M.; Paimela, T.; Kaarniranta, K. Celastrol: Molecular targets of Thunder God Vine. Biochem. Biophys. Res. Commun. 2010, 394, 439–442. [Google Scholar] [CrossRef] [PubMed]
- Cascao, R.; Vidal, B.; Raquel, H.; Neves-Costa, A.; Figueiredo, N.; Gupta, V.; Fonseca, J.E.; Moita, L.F. Effective treatment of rat adjuvant-induced arthritis by celastrol. Autoimmun. Rev. 2012, 11, 856–862. [Google Scholar] [CrossRef] [PubMed] [Green Version]
- Fujiwara, W.; Kato, Y.; Hayashi, M.; Sugishita, Y.; Okumura, S.; Yoshinaga, M.; Ishiguro, T.; Yamada, R.; Ueda, S.; Harada, M.; et al. Serum microRNA-126 and -223 as new-generation biomarkers for sarcoidosis in patients with heart failure. J. Cardiol. 2018. [Google Scholar] [CrossRef] [PubMed]
- Guo, J.; Liu, C.; Wang, W.; Liu, Y.; He, H.; Chen, C.; Xiang, R.; Luo, Y. Identification of serum miR-1915-3p and miR-455-3p as biomarkers for breast cancer. PLoS ONE 2018, 13, e0200716. [Google Scholar] [CrossRef] [PubMed]
- Mandourah, A.Y.; Ranganath, L.; Barraclough, R.; Vinjamuri, S.; Hof, R.V.; Hamill, S.; Czanner, G.; Dera, A.A.; Wang, D.; Barraclough, D.L. Circulating microRNAs as potential diagnostic biomarkers for osteoporosis. Sci. Rep. 2018, 8, 8421. [Google Scholar] [CrossRef] [PubMed] [Green Version]
- Ouboussad, L.; Hunt, L.; Hensor, E.M.A.; Nam, J.L.; Barnes, N.A.; Emery, P.; McDermott, M.F.; Buch, M.H. Profiling microRNAs in individuals at risk of progression to rheumatoid arthritis. Arthritis Res. Ther. 2017, 19, 288. [Google Scholar] [CrossRef] [PubMed] [Green Version]
- Zhang, J.; Li, S.; Li, L.; Li, M.; Guo, C.; Yao, J.; Mi, S. Exosome and exosomal microRNA: Trafficking, sorting, and function. Genom. Proteom. Bioinform. 2015, 13, 17–24. [Google Scholar] [CrossRef] [PubMed]
- Wang, N.; Wang, L.; Yang, Y.; Gong, L.; Xiao, B.; Liu, X. A serum exosomal microRNA panel as a potential biomarker test for gastric cancer. Biochem. Biophys. Res. Commun. 2017, 493, 1322–1328. [Google Scholar] [CrossRef] [PubMed]
- Bellavia, D.; Raimondi, L.; Costa, V.; De Luca, A.; Carina, V.; Maglio, M.; Fini, M.; Alessandro, R.; Giavaresi, G. Engineered exosomes: A new promise for the management of musculoskeletal diseases. Biochim. Biophys. Acta 2018, 1862, 1893–1901. [Google Scholar] [CrossRef] [PubMed]
- Behera, J.; Tyagi, N. Exosomes: Mediators of bone diseases, protection, and therapeutics potential. Oncoscience 2018, 5, 181–195. [Google Scholar] [PubMed]
- Lin, J.; Huo, R.; Xiao, L.; Zhu, X.; Xie, J.; Sun, S.; He, Y.; Zhang, J.; Sun, Y.; Zhou, Z.; et al. A novel p53/microRNA-22/Cyr61 axis in synovial cells regulates inflammation in rheumatoid arthritis. Arthritis Rheumatol. 2014, 66, 49–59. [Google Scholar] [CrossRef] [PubMed]
- Fan, P.; He, L.; Hu, N.; Luo, J.; Zhang, J.; Mo, L.F.; Wang, Y.H.; Pu, D.; Lv, X.H.; Hao, Z.M.; et al. Effect of 1,25-(OH)2D3 on Proliferation of Fibroblast-Like Synoviocytes and Expressions of Pro-Inflammatory Cytokines through Regulating MicroRNA-22 in a Rat Model of Rheumatoid Arthritis. Cell. Physiol. Biochem. 2017, 42, 145–155. [Google Scholar] [CrossRef] [PubMed] [Green Version]
- Shi, D.L.; Shi, G.R.; Xie, J.; Du, X.Z.; Yang, H. MicroRNA-27a Inhibits Cell Migration and Invasion of Fibroblast-Like Synoviocytes by Targeting Follistatin-Like Protein 1 in Rheumatoid Arthritis. Mol. Cells 2016, 39, 611–618. [Google Scholar] [CrossRef] [PubMed] [Green Version]
- Tardif, G.; Hum, D.; Pelletier, J.P.; Duval, N.; Martel-Pelletier, J. Regulation of the IGFBP-5 and MMP-13 genes by the microRNAs miR-140 and miR-27a in human osteoarthritic chondrocytes. BMC Musculoskelet. Disord. 2009, 10, 148. [Google Scholar] [CrossRef] [PubMed]
- Xiao, Y.; Li, B.; Liu, J. miRNA27a regulates arthritis via PPARgamma in vivo and in vitro. Mol. Med. Rep. 2018, 17, 5454–5462. [Google Scholar] [PubMed]
- Suomi, S.; Taipaleenmaki, H.; Seppanen, A.; Ripatti, T.; Vaananen, K.; Hentunen, T.; Saamanen, A.M.; Laitala-Leinonen, T. MicroRNAs regulate osteogenesis and chondrogenesis of mouse bone marrow stromal cells. Gene Regul. Syst. Biol. 2008, 2, 177–191. [Google Scholar] [CrossRef]
- Yang, M.; Pan, Y.; Zhou, Y. miR-96 promotes osteogenic differentiation by suppressing HBEGF-EGFR signaling in osteoblastic cells. FEBS Lett. 2014, 588, 4761–4768. [Google Scholar] [CrossRef] [PubMed] [Green Version]
- Laine, S.K.; Alm, J.J.; Virtanen, S.P.; Aro, H.T.; Laitala-Leinonen, T.K. MicroRNAs miR-96, miR-124, and miR-199a regulate gene expression in human bone marrow-derived mesenchymal stem cells. J. Cell. Biochem. 2012, 113, 2687–2695. [Google Scholar] [CrossRef] [PubMed]
- Wang, X.; Guo, Y.; Wang, C.; Yu, H.; Yu, X.; Yu, H. MicroRNA-142-3p Inhibits Chondrocyte Apoptosis and Inflammation in Osteoarthritis by Targeting HMGB1. Inflammation 2016, 39, 1718–1728. [Google Scholar] [CrossRef] [PubMed]
- Elmesmari, A.; Fraser, A.R.; Wood, C.; Gilchrist, D.; Vaughan, D.; Stewart, L.; McSharry, C.; McInnes, I.B.; Kurowska-Stolarska, M. MicroRNA-155 regulates monocyte chemokine and chemokine receptor expression in Rheumatoid Arthritis. Rheumatology 2016, 55, 2056–2065. [Google Scholar] [CrossRef] [PubMed]
- Kriegsmann, M.; Randau, T.M.; Gravius, S.; Lisenko, K.; Altmann, C.; Arens, N.; Kriegsmann, J. Expression of miR-146a, miR-155, and miR-223 in formalin-fixed paraffin-embedded synovial tissues of patients with rheumatoid arthritis and osteoarthritis. Virchows Arch. 2016, 469, 93–100. [Google Scholar] [CrossRef] [PubMed]
- Balzano, F.; Deiana, M.; Dei Giudici, S.; Oggiano, A.; Pasella, S.; Pinna, S.; Mannu, A.; Deiana, N.; Porcu, B.; Masala, A.G.E.; et al. MicroRNA Expression Analysis of Centenarians and Rheumatoid Arthritis Patients Reveals a Common Expression Pattern. Int. J. Med. Sci. 2017, 14, 622–628. [Google Scholar] [CrossRef] [PubMed] [Green Version]
- Liu, Y.; Zhang, X.L.; Li, X.F.; Tang, Y.C.; Zhao, X. miR-212-3p reduced proliferation, and promoted apoptosis of fibroblast-like synoviocytes via down-regulating SOX5 in rheumatoid arthritis. Eur. Rev. Med. Pharmacol. Sci. 2018, 22, 461–471. [Google Scholar] [PubMed]
- Lu, M.C.; Yu, C.L.; Chen, H.C.; Yu, H.C.; Huang, H.B.; Lai, N.S. Increased miR-223 expression in T cells from patients with rheumatoid arthritis leads to decreased insulin-like growth factor-1-mediated interleukin-10 production. Clin. Exp. Immunol. 2014, 177, 641–651. [Google Scholar] [CrossRef] [PubMed] [Green Version]
- Li, Y.T.; Chen, S.Y.; Wang, C.R.; Liu, M.F.; Lin, C.C.; Jou, I.M.; Shiau, A.L.; Wu, C.L. Brief report: Amelioration of collagen-induced arthritis in mice by lentivirus-mediated silencing of microRNA-223. Arthritis Rheum. 2012, 64, 3240–3245. [Google Scholar] [CrossRef] [PubMed]
- Shibuya, H.; Nakasa, T.; Adachi, N.; Nagata, Y.; Ishikawa, M.; Deie, M.; Suzuki, O.; Ochi, M. Overexpression of microRNA-223 in rheumatoid arthritis synovium controls osteoclast differentiation. Mod. Rheumatol. 2013, 23, 674–685. [Google Scholar] [CrossRef] [PubMed]
- Dai, Y.; Huang, Y.S.; Tang, M.; Lv, T.Y.; Hu, C.X.; Tan, Y.H.; Xu, Z.M.; Yin, Y.B. Microarray analysis of microRNA expression in peripheral blood cells of systemic lupus erythematosus patients. Lupus 2007, 16, 939–946. [Google Scholar] [CrossRef] [PubMed]
- Murata, K.; Yoshitomi, H.; Furu, M.; Ishikawa, M.; Shibuya, H.; Ito, H.; Matsuda, S. MicroRNA-451 down-regulates neutrophil chemotaxis via p38 MAPK. Arthritis Rheumatol. 2014, 66, 549–559. [Google Scholar] [CrossRef] [PubMed] [Green Version]
- Wang, Z.C.; Lu, H.; Zhou, Q.; Yu, S.M.; Mao, Y.L.; Zhang, H.J.; Zhang, P.C.; Yan, W.J. MiR-451 inhibits synovial fibroblasts proliferation and inflammatory cytokines secretion in rheumatoid arthritis through mediating p38MAPK signaling pathway. Int. J. Clin. Exp. Pathol. 2015, 8, 14562–14567. [Google Scholar] [PubMed]
- Smigielska-Czepiel, K.; van den Berg, A.; Jellema, P.; van der Lei, R.J.; Bijzet, J.; Kluiver, J.; Boots, A.M.; Brouwer, E.; Kroesen, B.J. Comprehensive analysis of miRNA expression in T-cell subsets of rheumatoid arthritis patients reveals defined signatures of naive and memory Tregs. Genes Immun. 2014, 15, 115–125. [Google Scholar] [CrossRef] [PubMed] [Green Version]
- Ezaki, T.; Baluk, P.; Thurston, G.; La Barbara, A.; Woo, C.; McDonald, D.M. Time course of endothelial cell proliferation and microvascular remodeling in chronic inflammation. Am. J. Pathol. 2001, 158, 2043–2055. [Google Scholar] [CrossRef]
- Szmitko, P.E.; Wang, C.H.; Weisel, R.D.; de Almeida, J.R.; Anderson, T.J.; Verma, S. New markers of inflammation and endothelial cell activation: Part I. Circulation 2003, 108, 1917–1923. [Google Scholar] [CrossRef] [PubMed]
- Altamemi, I.; Murphy, E.A.; Catroppo, J.F.; Zumbrun, E.E.; Zhang, J.; McClellan, J.L.; Singh, U.P.; Nagarkatti, P.S.; Nagarkatti, M. Role of microRNAs in resveratrol-mediated mitigation of colitis-associated tumorigenesis in Apc(Min/+) mice. J. Pharmacol. Exp. Ther. 2014, 350, 99–109. [Google Scholar] [CrossRef] [PubMed]
- Silva, M.D.; Savinainen, A.; Kapadia, R.; Ruan, J.; Siebert, E.; Avitahl, N.; Mosher, R.; Anderson, K.; Jaffee, B.; Schopf, L.; et al. Quantitative analysis of micro-CT imaging and histopathological signatures of experimental arthritis in rats. Mol. Imaging 2004, 3, 312–318. [Google Scholar] [CrossRef] [PubMed]
- Tackett, M.R.; Diwan, I. Using FirePlexTM Particle Technology for Multiplex MicroRNA Profiling Without RNA Purification. Methods Mol. Biol. 2017, 1654, 209–219. [Google Scholar] [PubMed]


| miRNA | High Prediction | Moderate Prediction | Experimentally Observed |
|---|---|---|---|
| miR-22 | CHUK, LTA | BCL2, CXCL13, IL36G, MMP1, PTK2, TGFA, VCAM1, TLR7 | Cyr61 |
| miR-27a | CASP8, CCR5, EIF1AX, GNAO1, INPP5B, RPS16, UBE2N, WNT4 | BCL2, CD40LG, CD80, CXCL6, CXCR4, CXCR6, FLT1, TGFB1, WNT2, WNT6, LTA, FOXO1, IL10, IL1R1, IL2, IL2RA | FSTL1 |
| miR-96 | CTSB, CTSK, MTOR, PPP3R1, PRKAR1A, PRKCE, PTH, RARG, RASA1, TCF7L2 | AHR, BCL10, BMP5, BMP8B, FGF9, FOXO3, FOXO4, HSP90AA1, IL17B, SMAD7, TGFBR1, TNFSF4, IL12A, IL22RA2, IL6ST, VEGFC | FOXO1, IRS1, MITF |
| miR-142 | IL17F | FGF20, IL22, SOCS1, TNFSF13B | TGFBR1 |
| miR-223 | ACTA1, ACVR2A, CCKBR, DUSP10, FOXO1, HSP90B1, IL6ST, INPP5B, MX1, PTPN2, YWHAG | CCL11, CD86, DKK1, STAT1, FOXO3, IL23A, IL5 | IRS1, RHOB, MEF2C |
| miR-296 | CCR3, H2BFM, PPP3R2, PRKAG1 | CD14, CD40LG, CXCL8, FGF1, ICAM1, IL6ST, MMP13, MMP8, VEGFB | |
| miR-298 | CASP9, CHP1, EIF1, FKBP1A, IL1RN, RHOA, RHOG, VEGFB, WNT3A | SOCS3, TCF7L1, TLR9, ICOS, IL6R, VDR, CXCL13, CXCL5, CXCR3, DKK2, EGFR, MYD88, GATA3, IL10RA, IL12RB2, IL17F, IL2RB | |
| miR-451 | ATF2, PSMB8, TSC1 | BMP6, FGF5, IL6R, NFATC1 | MIF, CPNE3, Rab5 |
© 2018 by the authors. Licensee MDPI, Basel, Switzerland. This article is an open access article distributed under the terms and conditions of the Creative Commons Attribution (CC BY) license (http://creativecommons.org/licenses/by/4.0/).
Share and Cite
Dudics, S.; Venkatesha, S.H.; Moudgil, K.D. The Micro-RNA Expression Profiles of Autoimmune Arthritis Reveal Novel Biomarkers of the Disease and Therapeutic Response. Int. J. Mol. Sci. 2018, 19, 2293. https://doi.org/10.3390/ijms19082293
Dudics S, Venkatesha SH, Moudgil KD. The Micro-RNA Expression Profiles of Autoimmune Arthritis Reveal Novel Biomarkers of the Disease and Therapeutic Response. International Journal of Molecular Sciences. 2018; 19(8):2293. https://doi.org/10.3390/ijms19082293
Chicago/Turabian StyleDudics, Steven, Shivaprasad H. Venkatesha, and Kamal D. Moudgil. 2018. "The Micro-RNA Expression Profiles of Autoimmune Arthritis Reveal Novel Biomarkers of the Disease and Therapeutic Response" International Journal of Molecular Sciences 19, no. 8: 2293. https://doi.org/10.3390/ijms19082293