Semantic Analysis of Posttranslational Modification of Proteins Accumulated in Thyroid Cancer Cells Exposed to Simulated Microgravity


Abstract
:
1. Introduction
2. Results and Discussion
2.1. Selection of Proteins from a Set of Data Obtained in a Preceding Mass Spectrometry (MS) Analysis
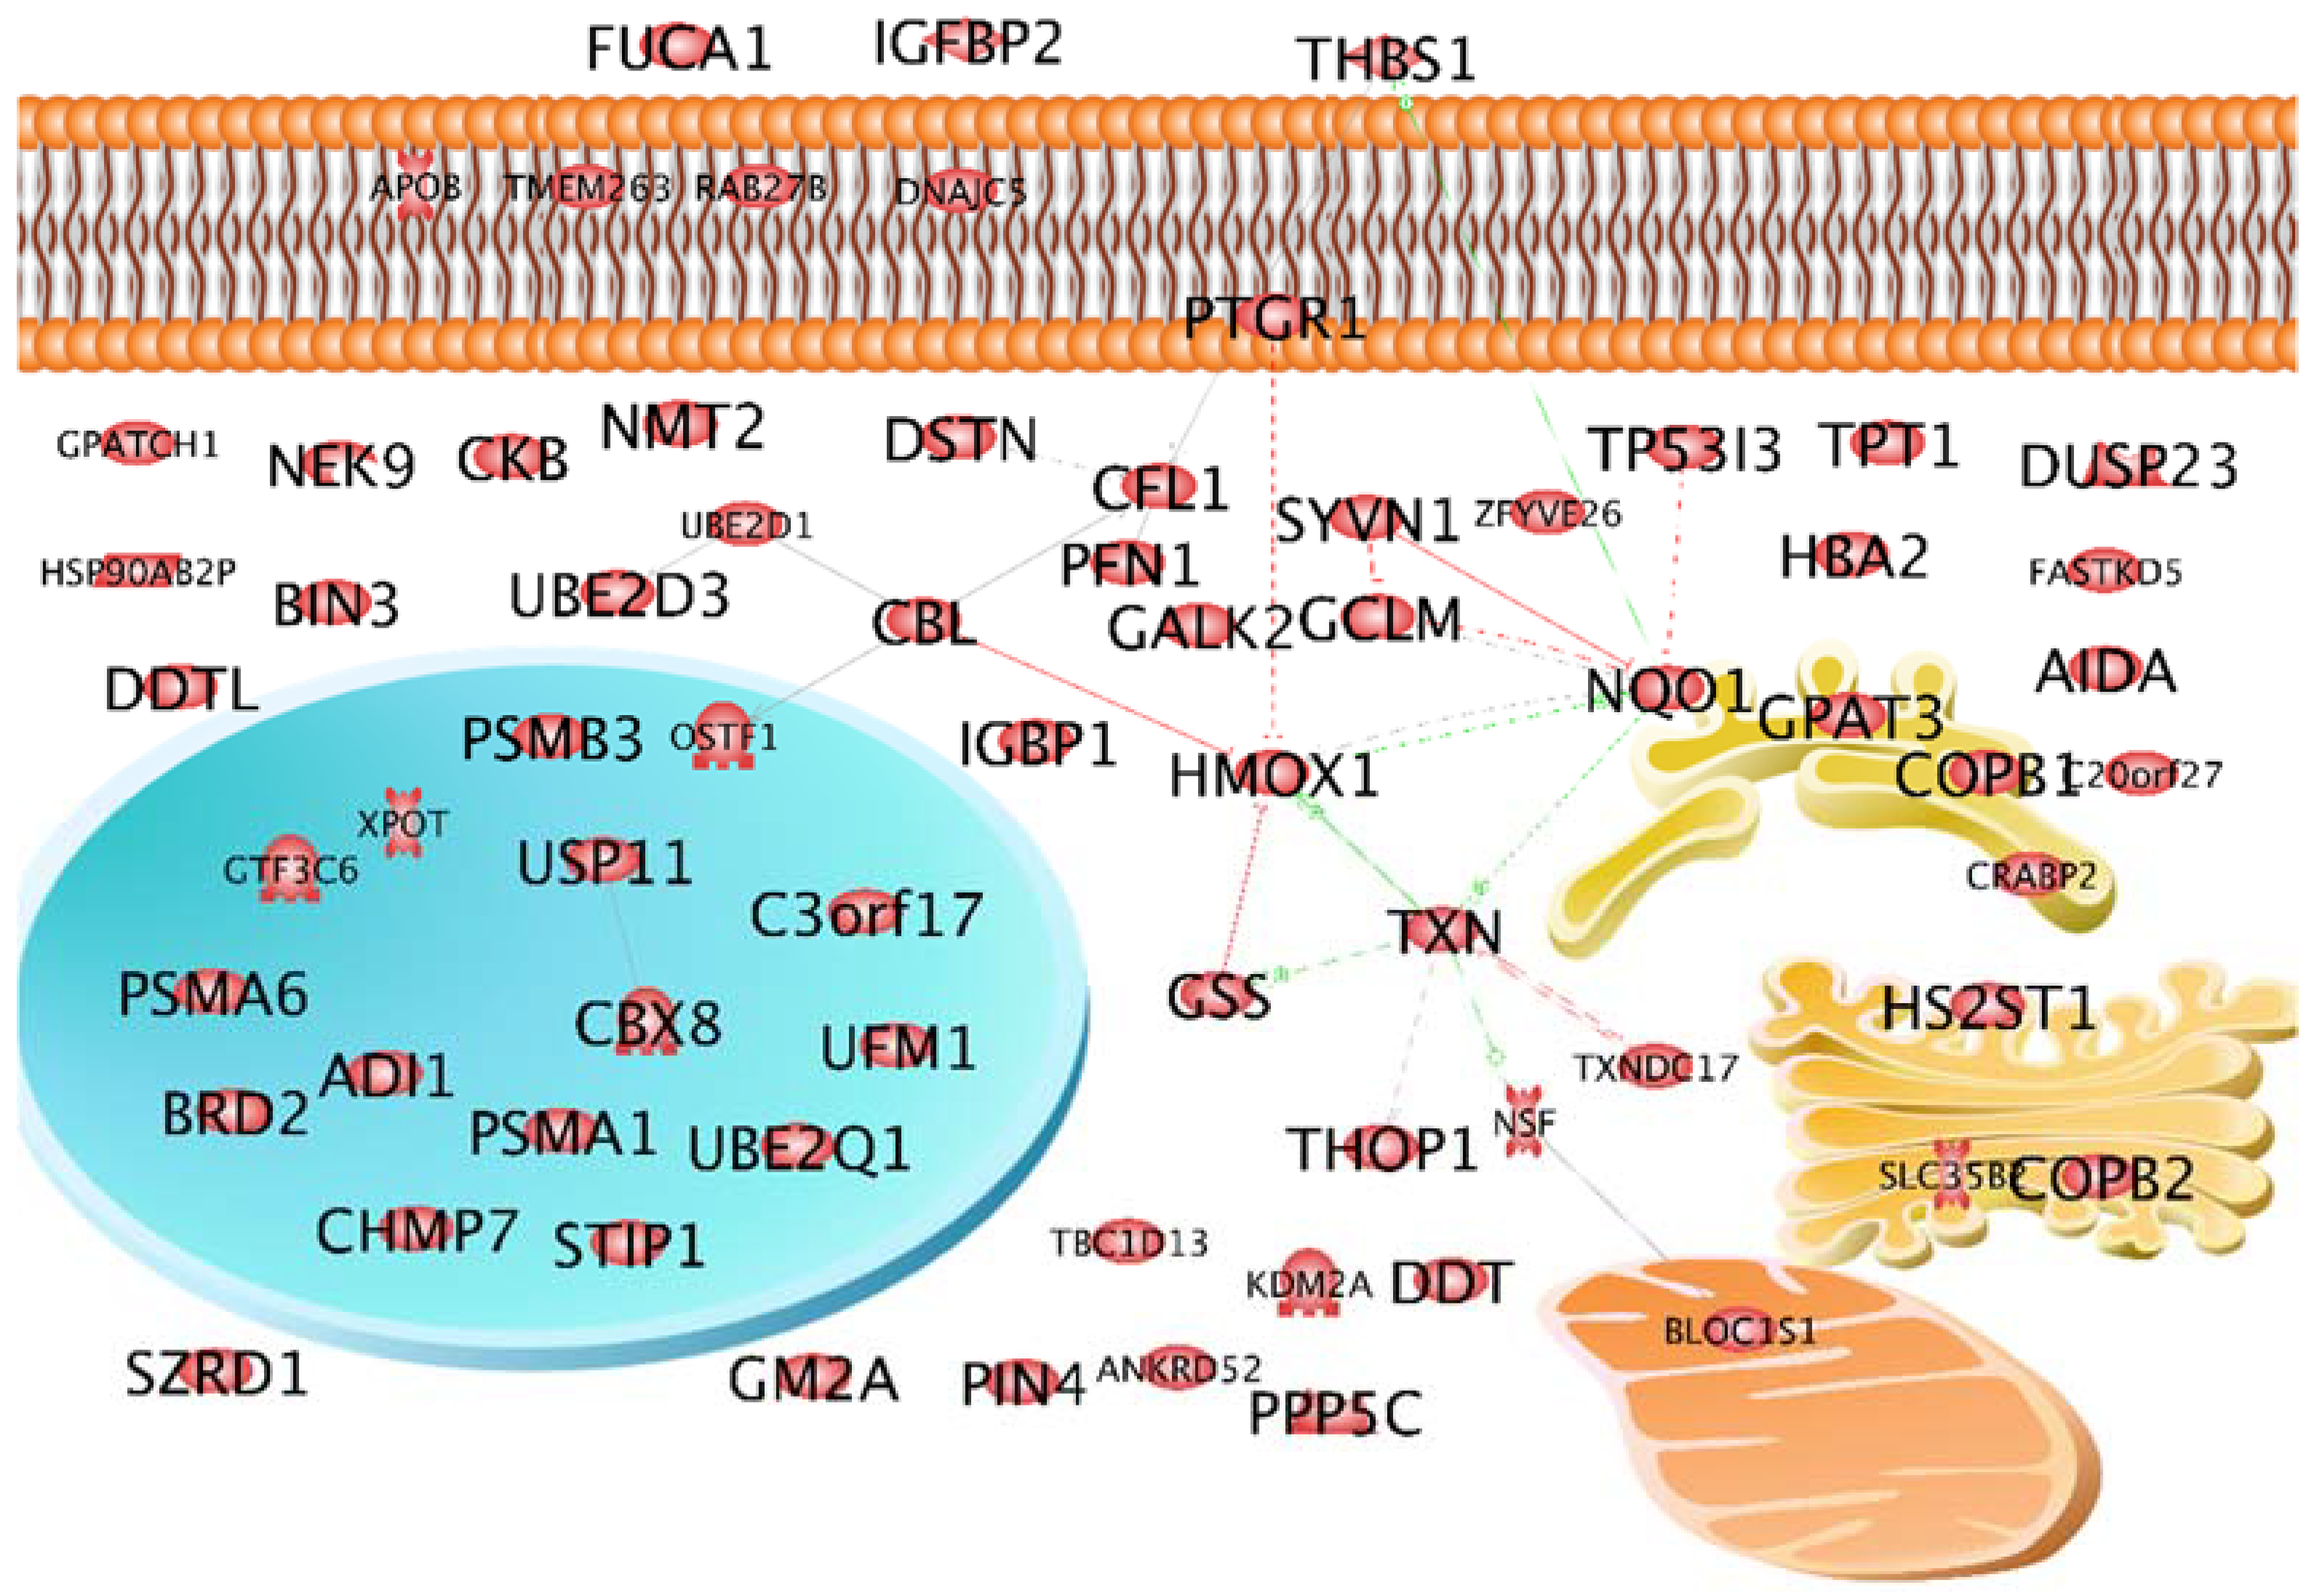
2.2. Characterization of the Selected 69 Proteins According to Localization and Interaction
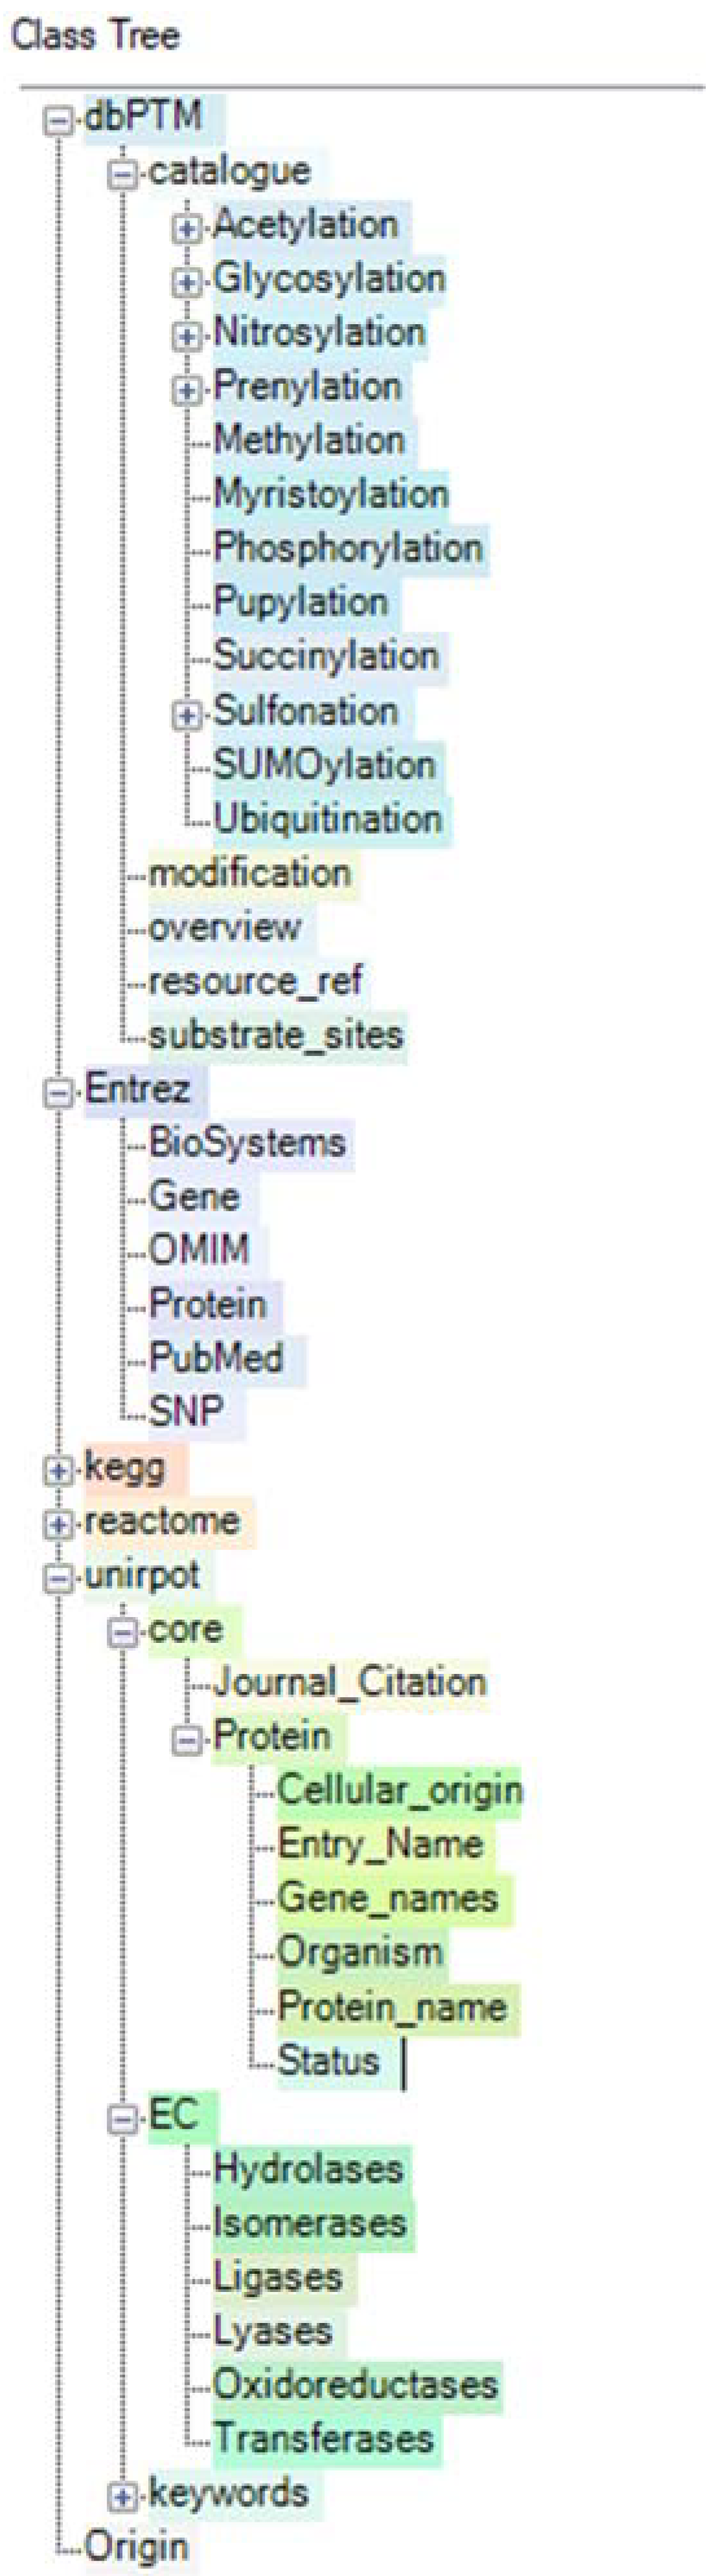
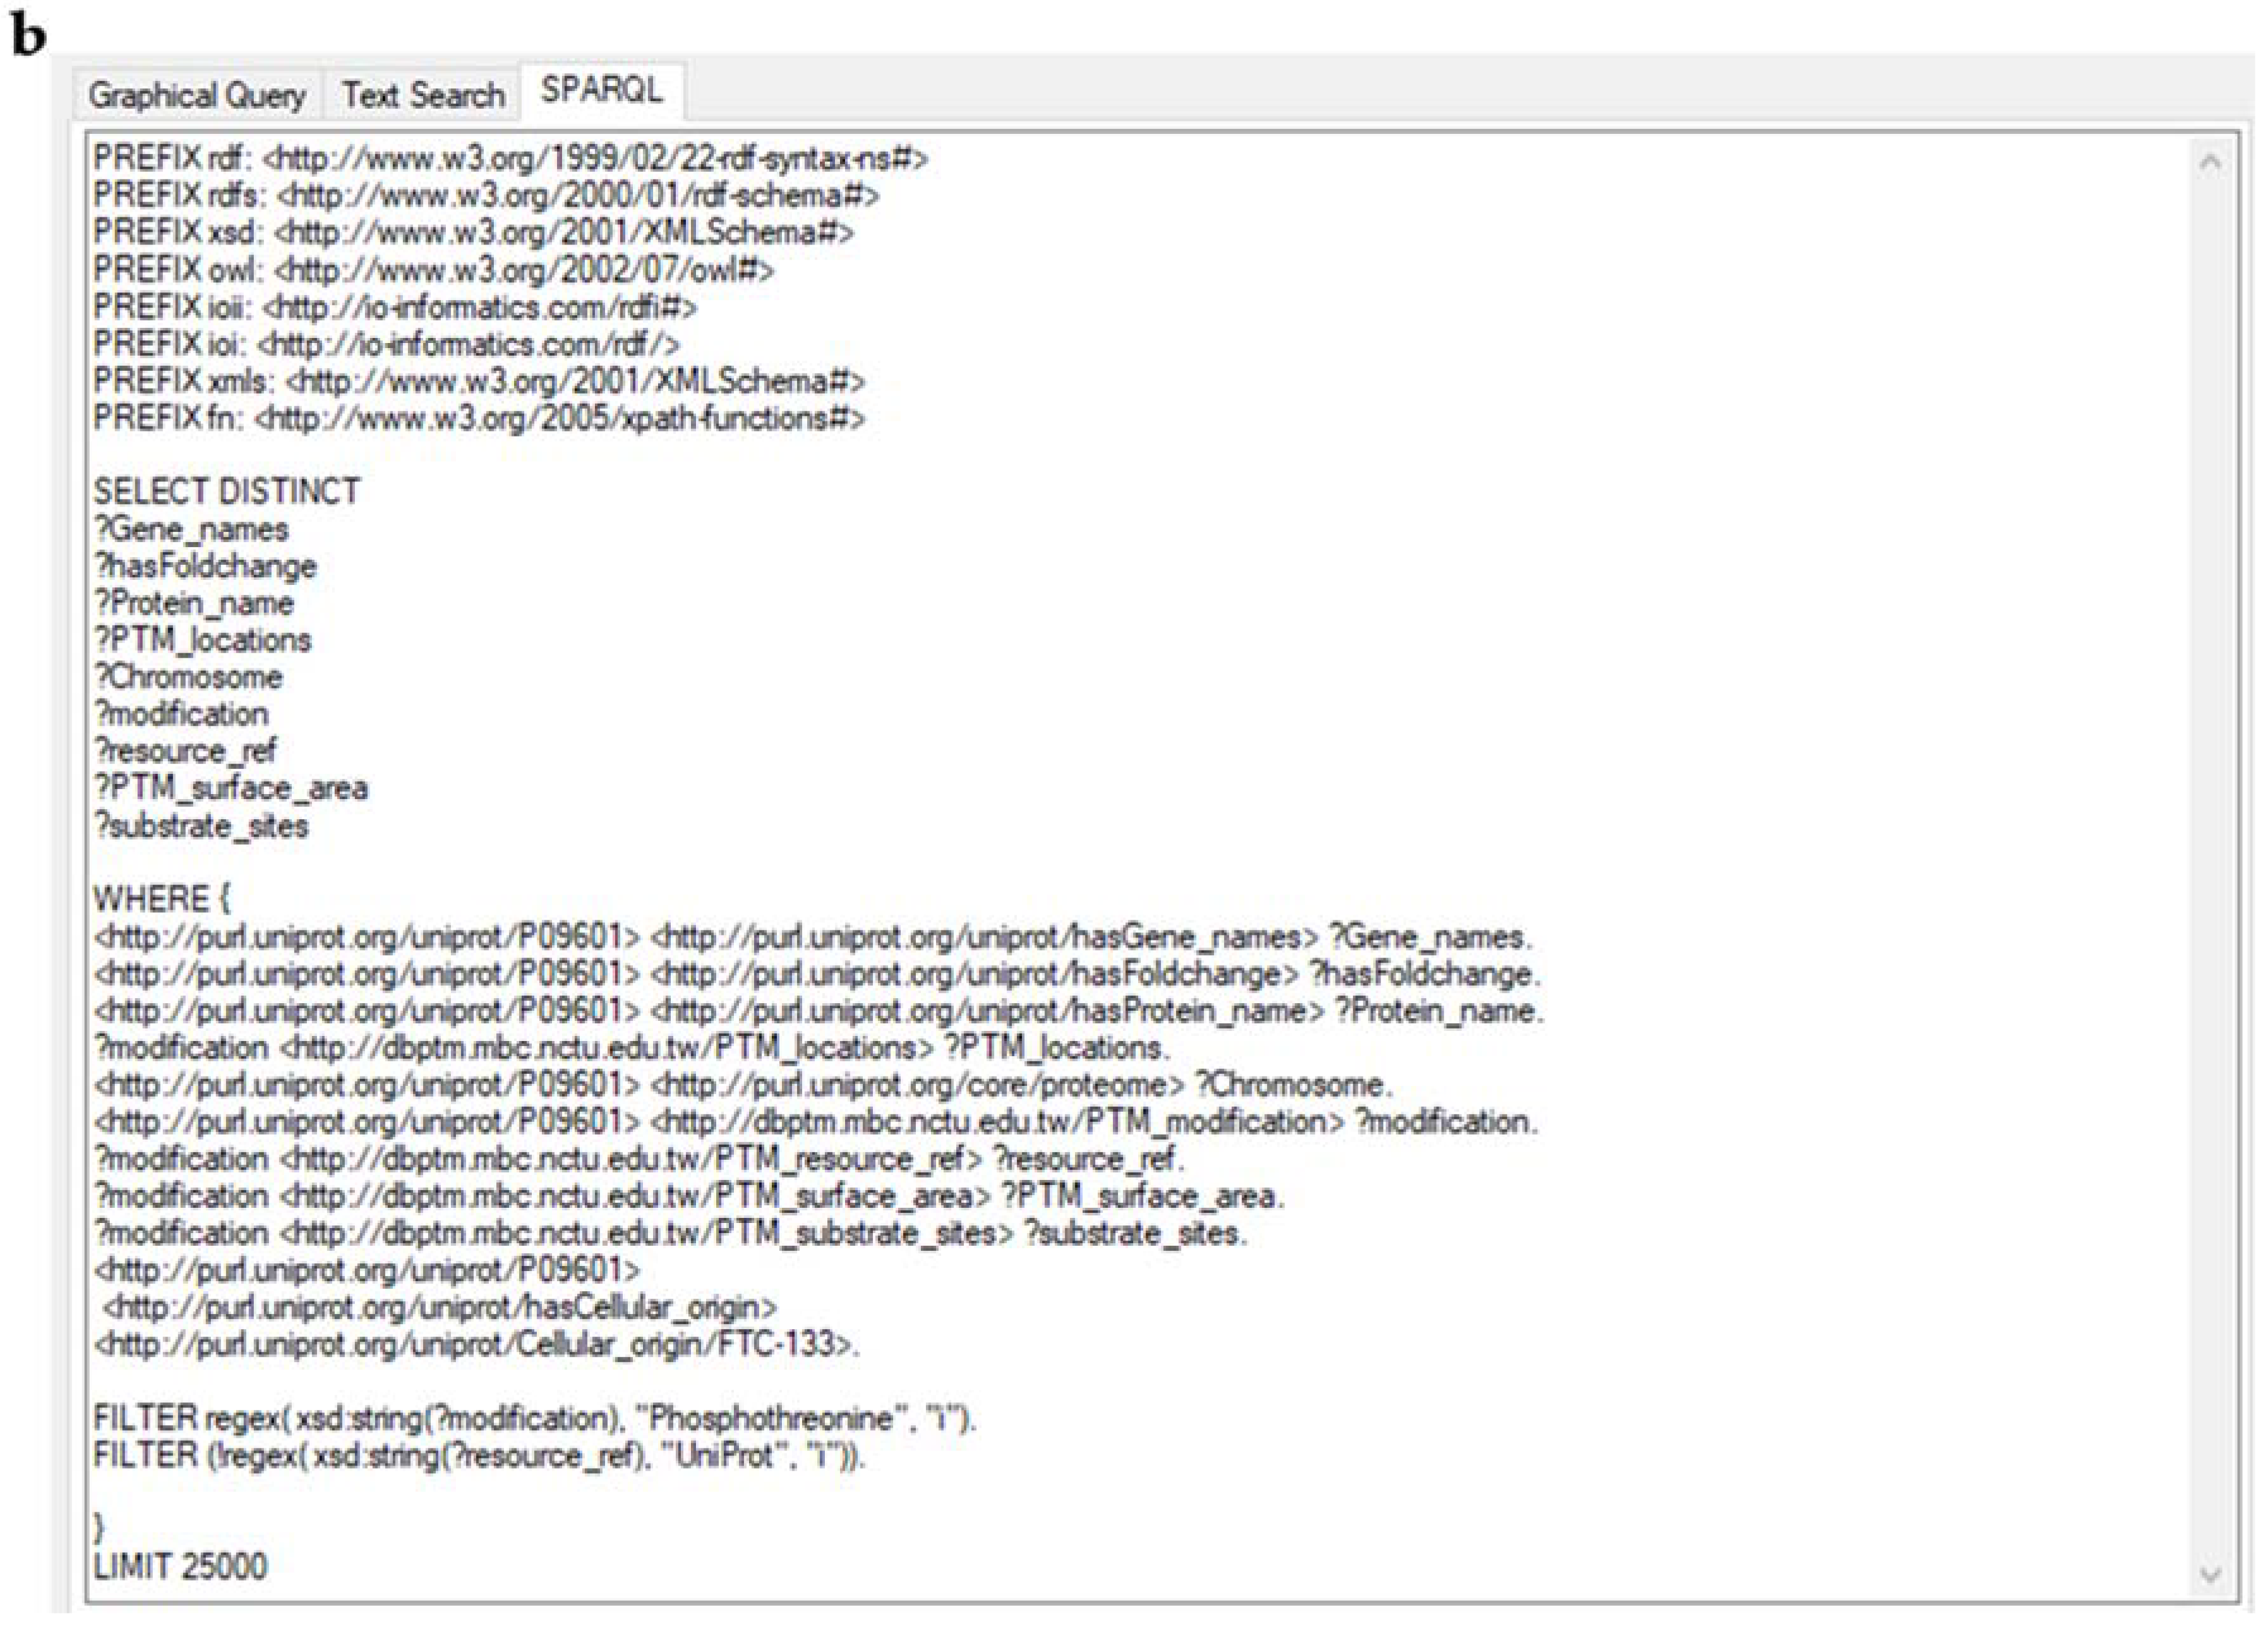
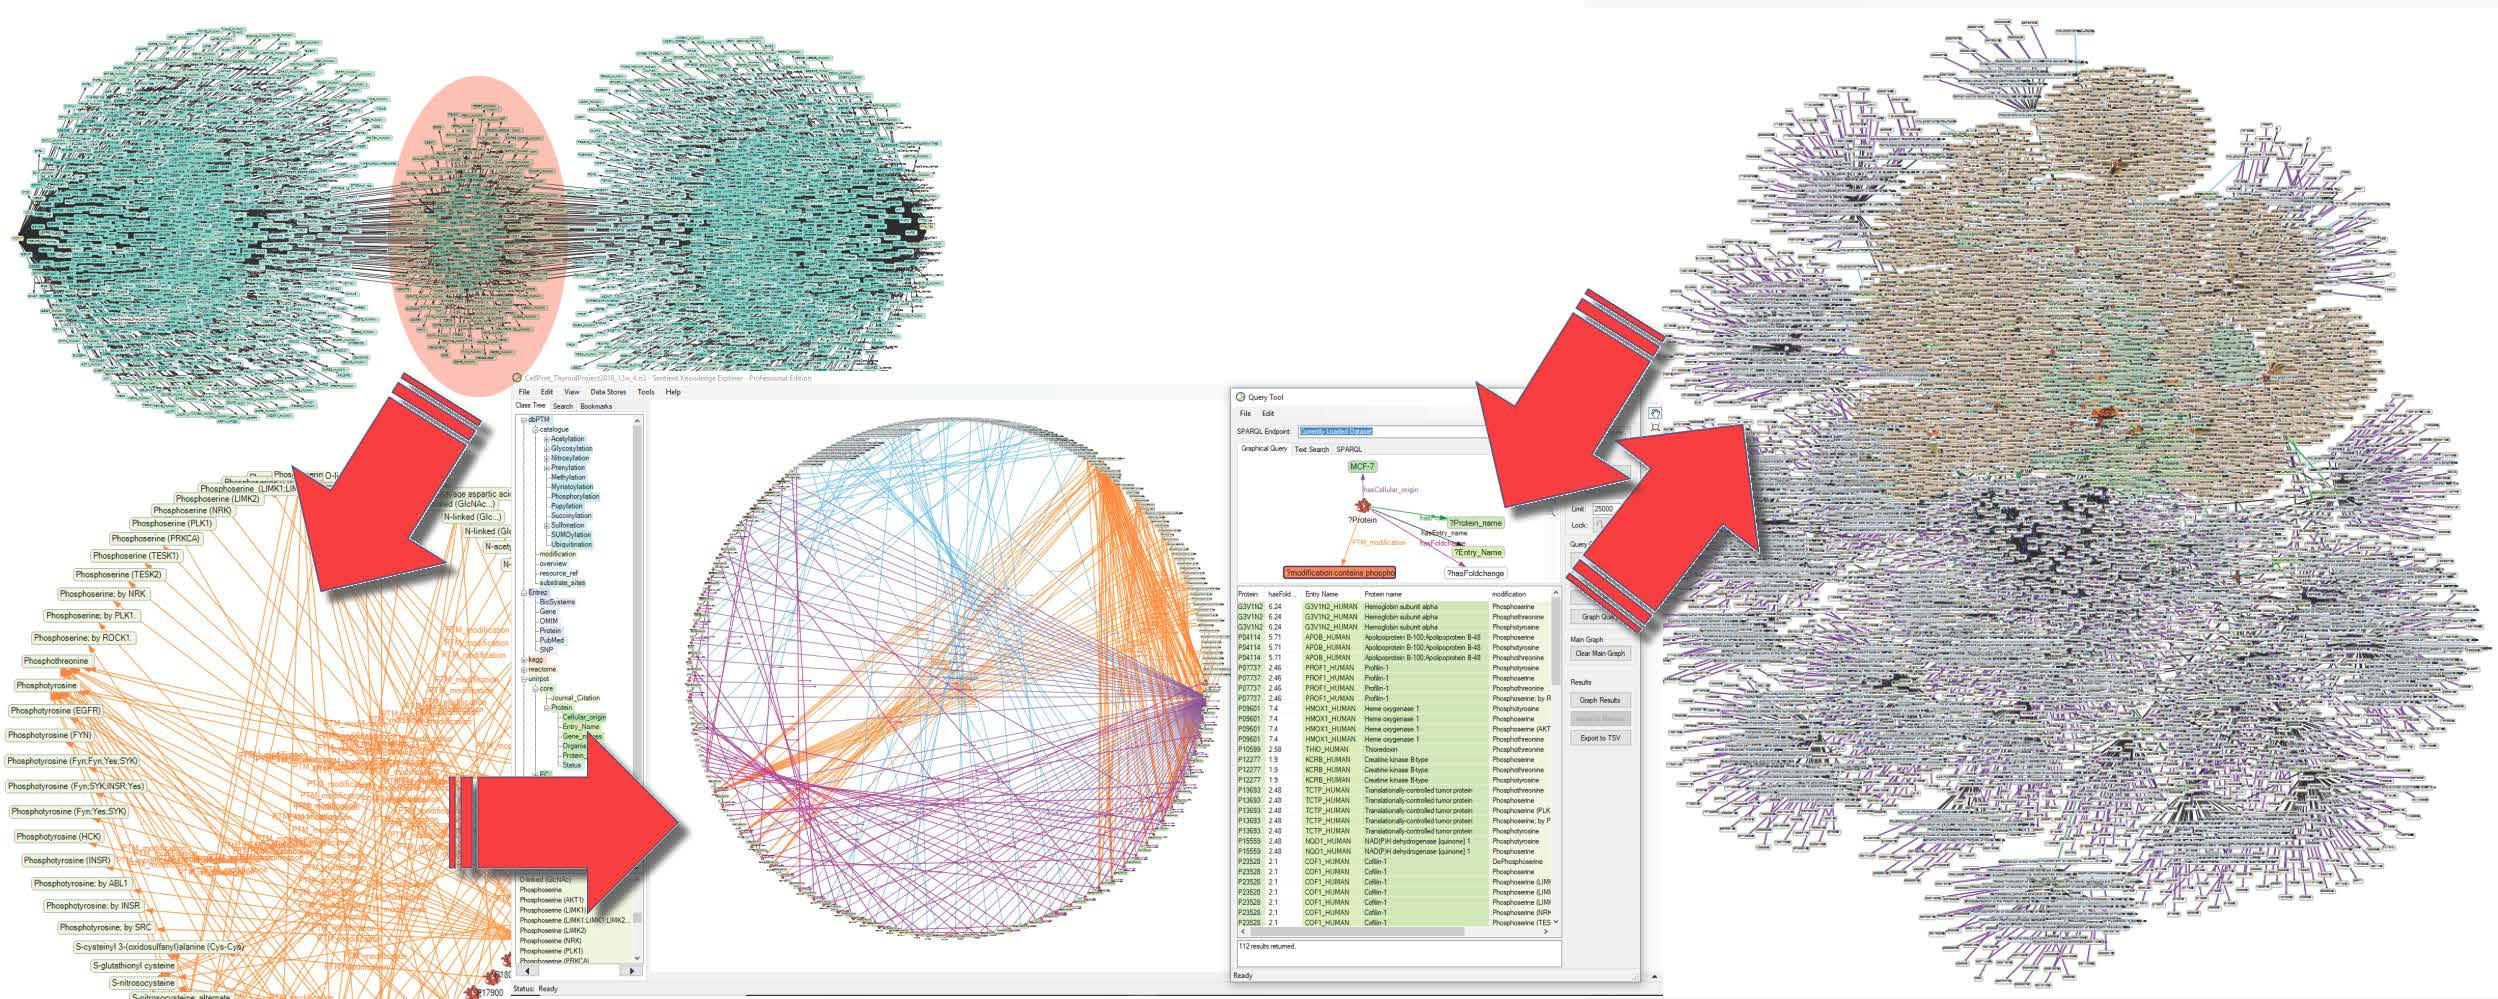
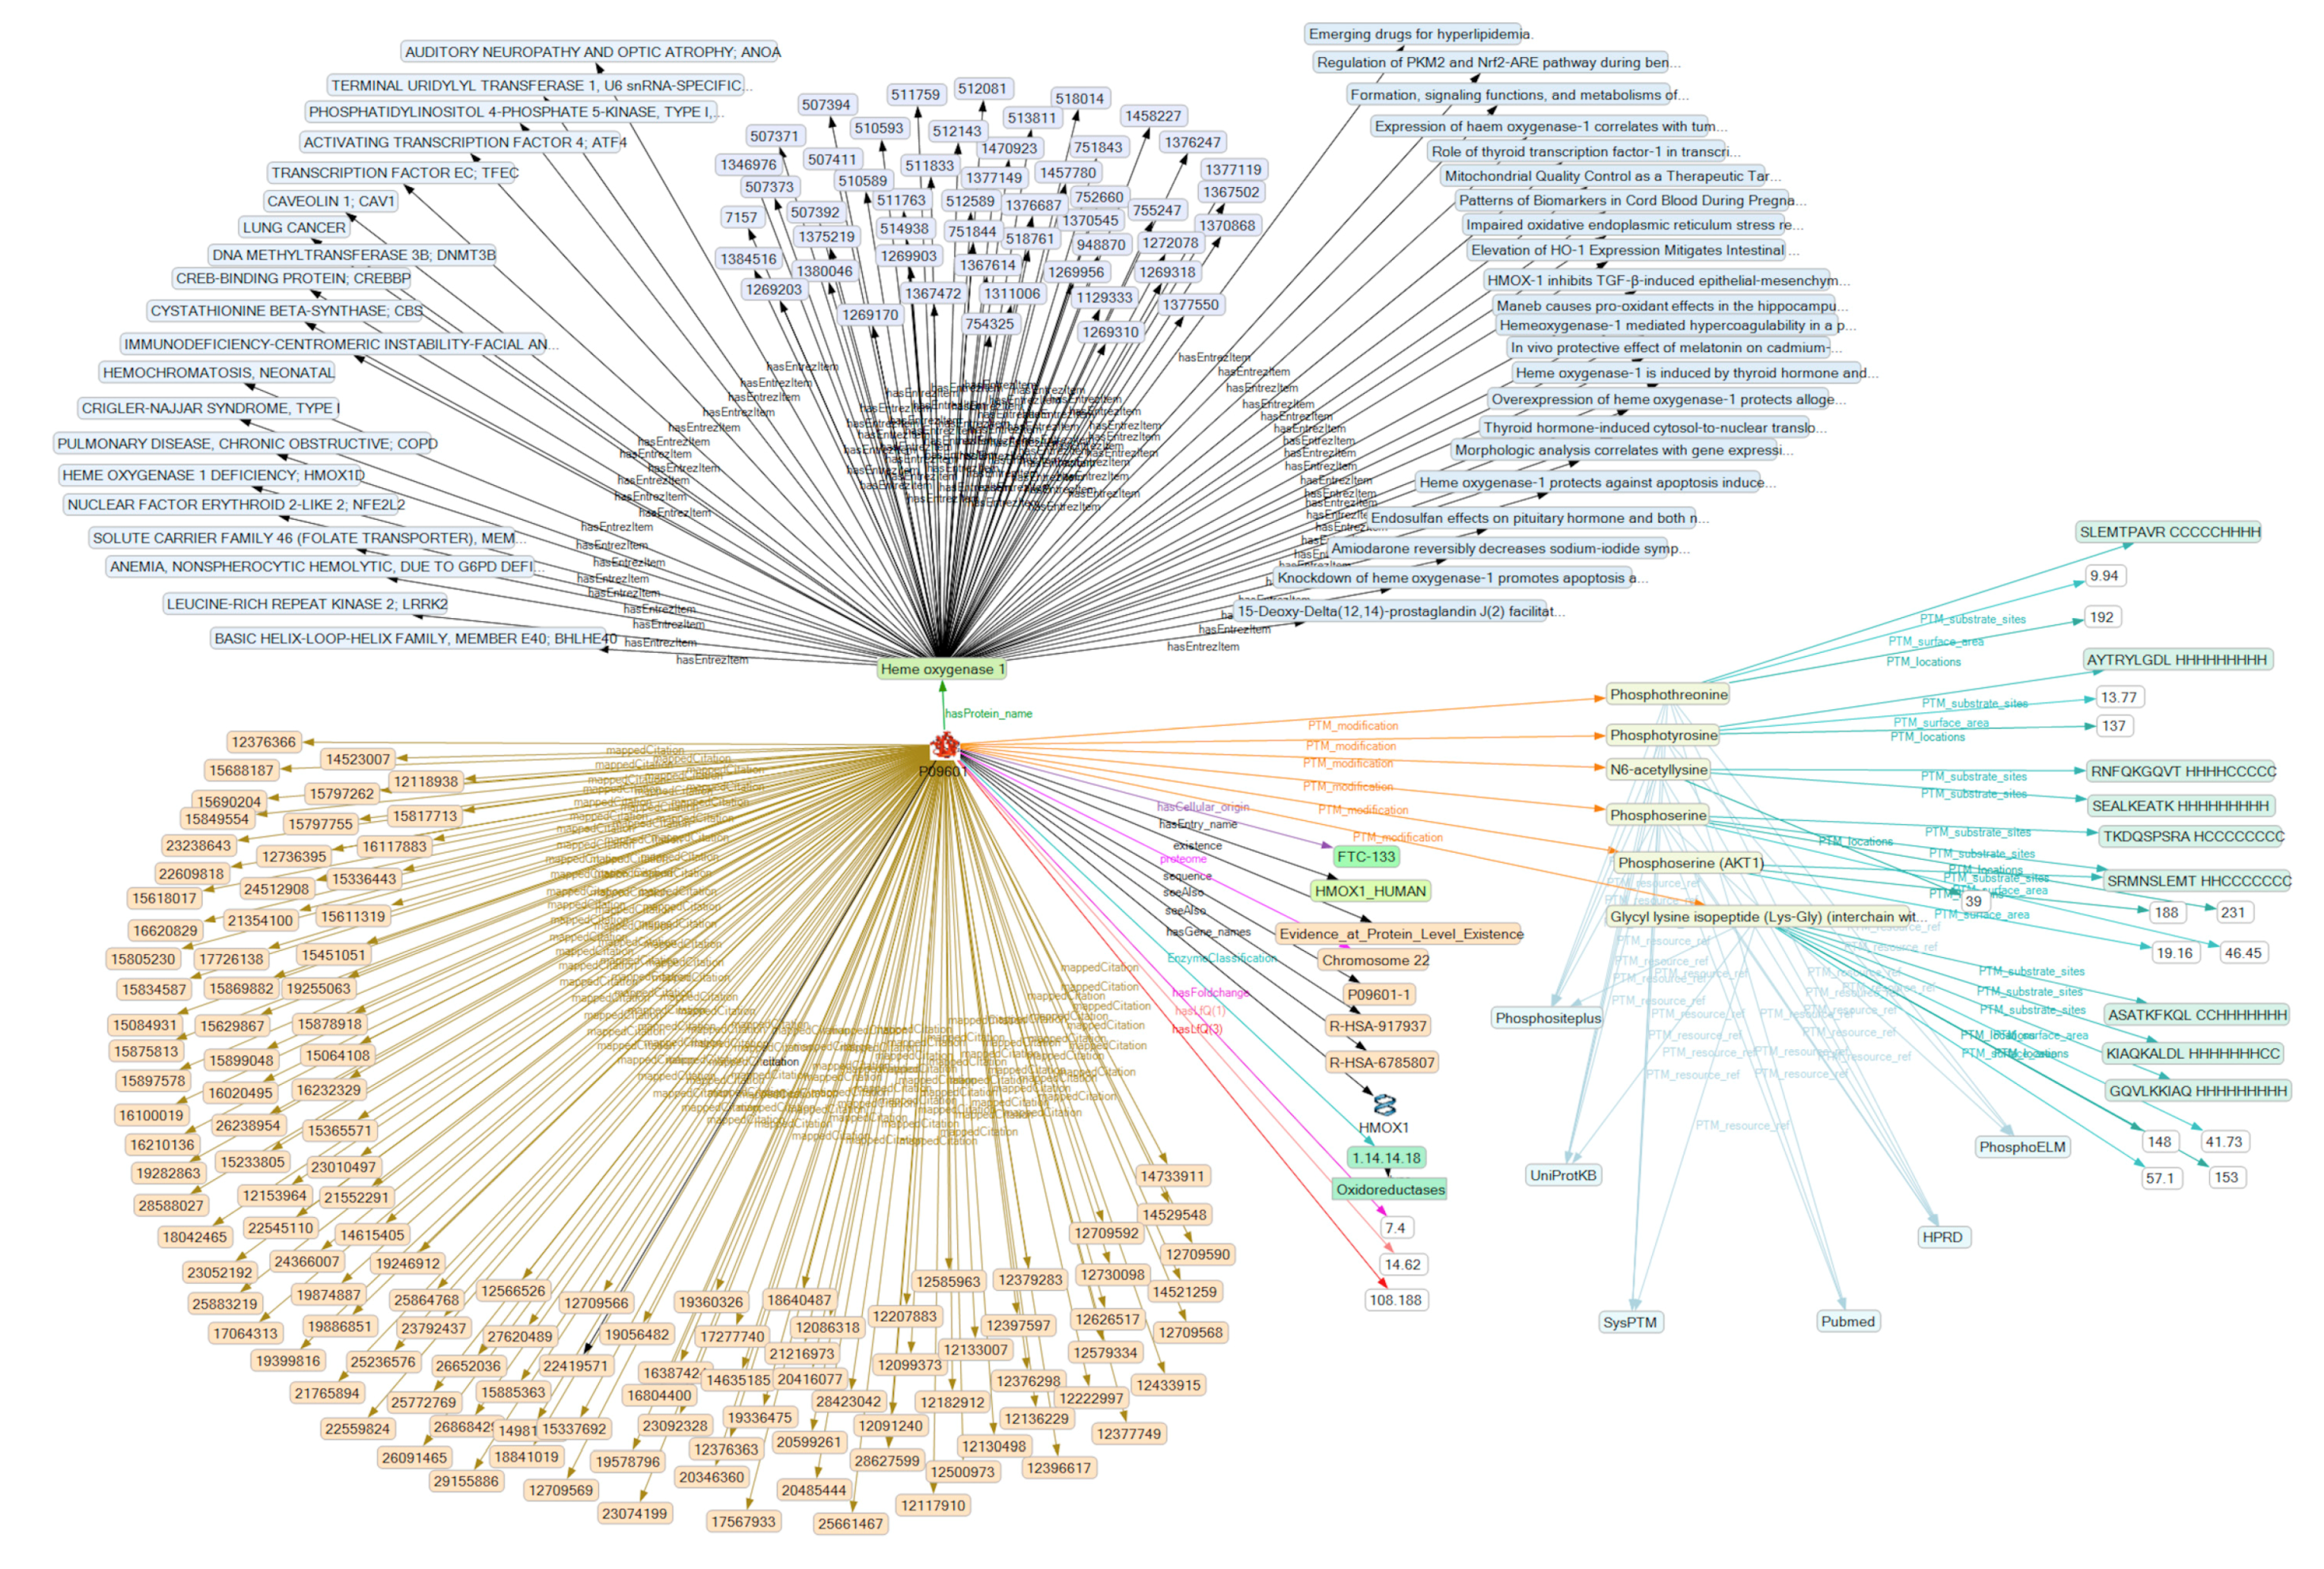
2.3. Creation of a Semantic Knowledge Base on PTM Modification
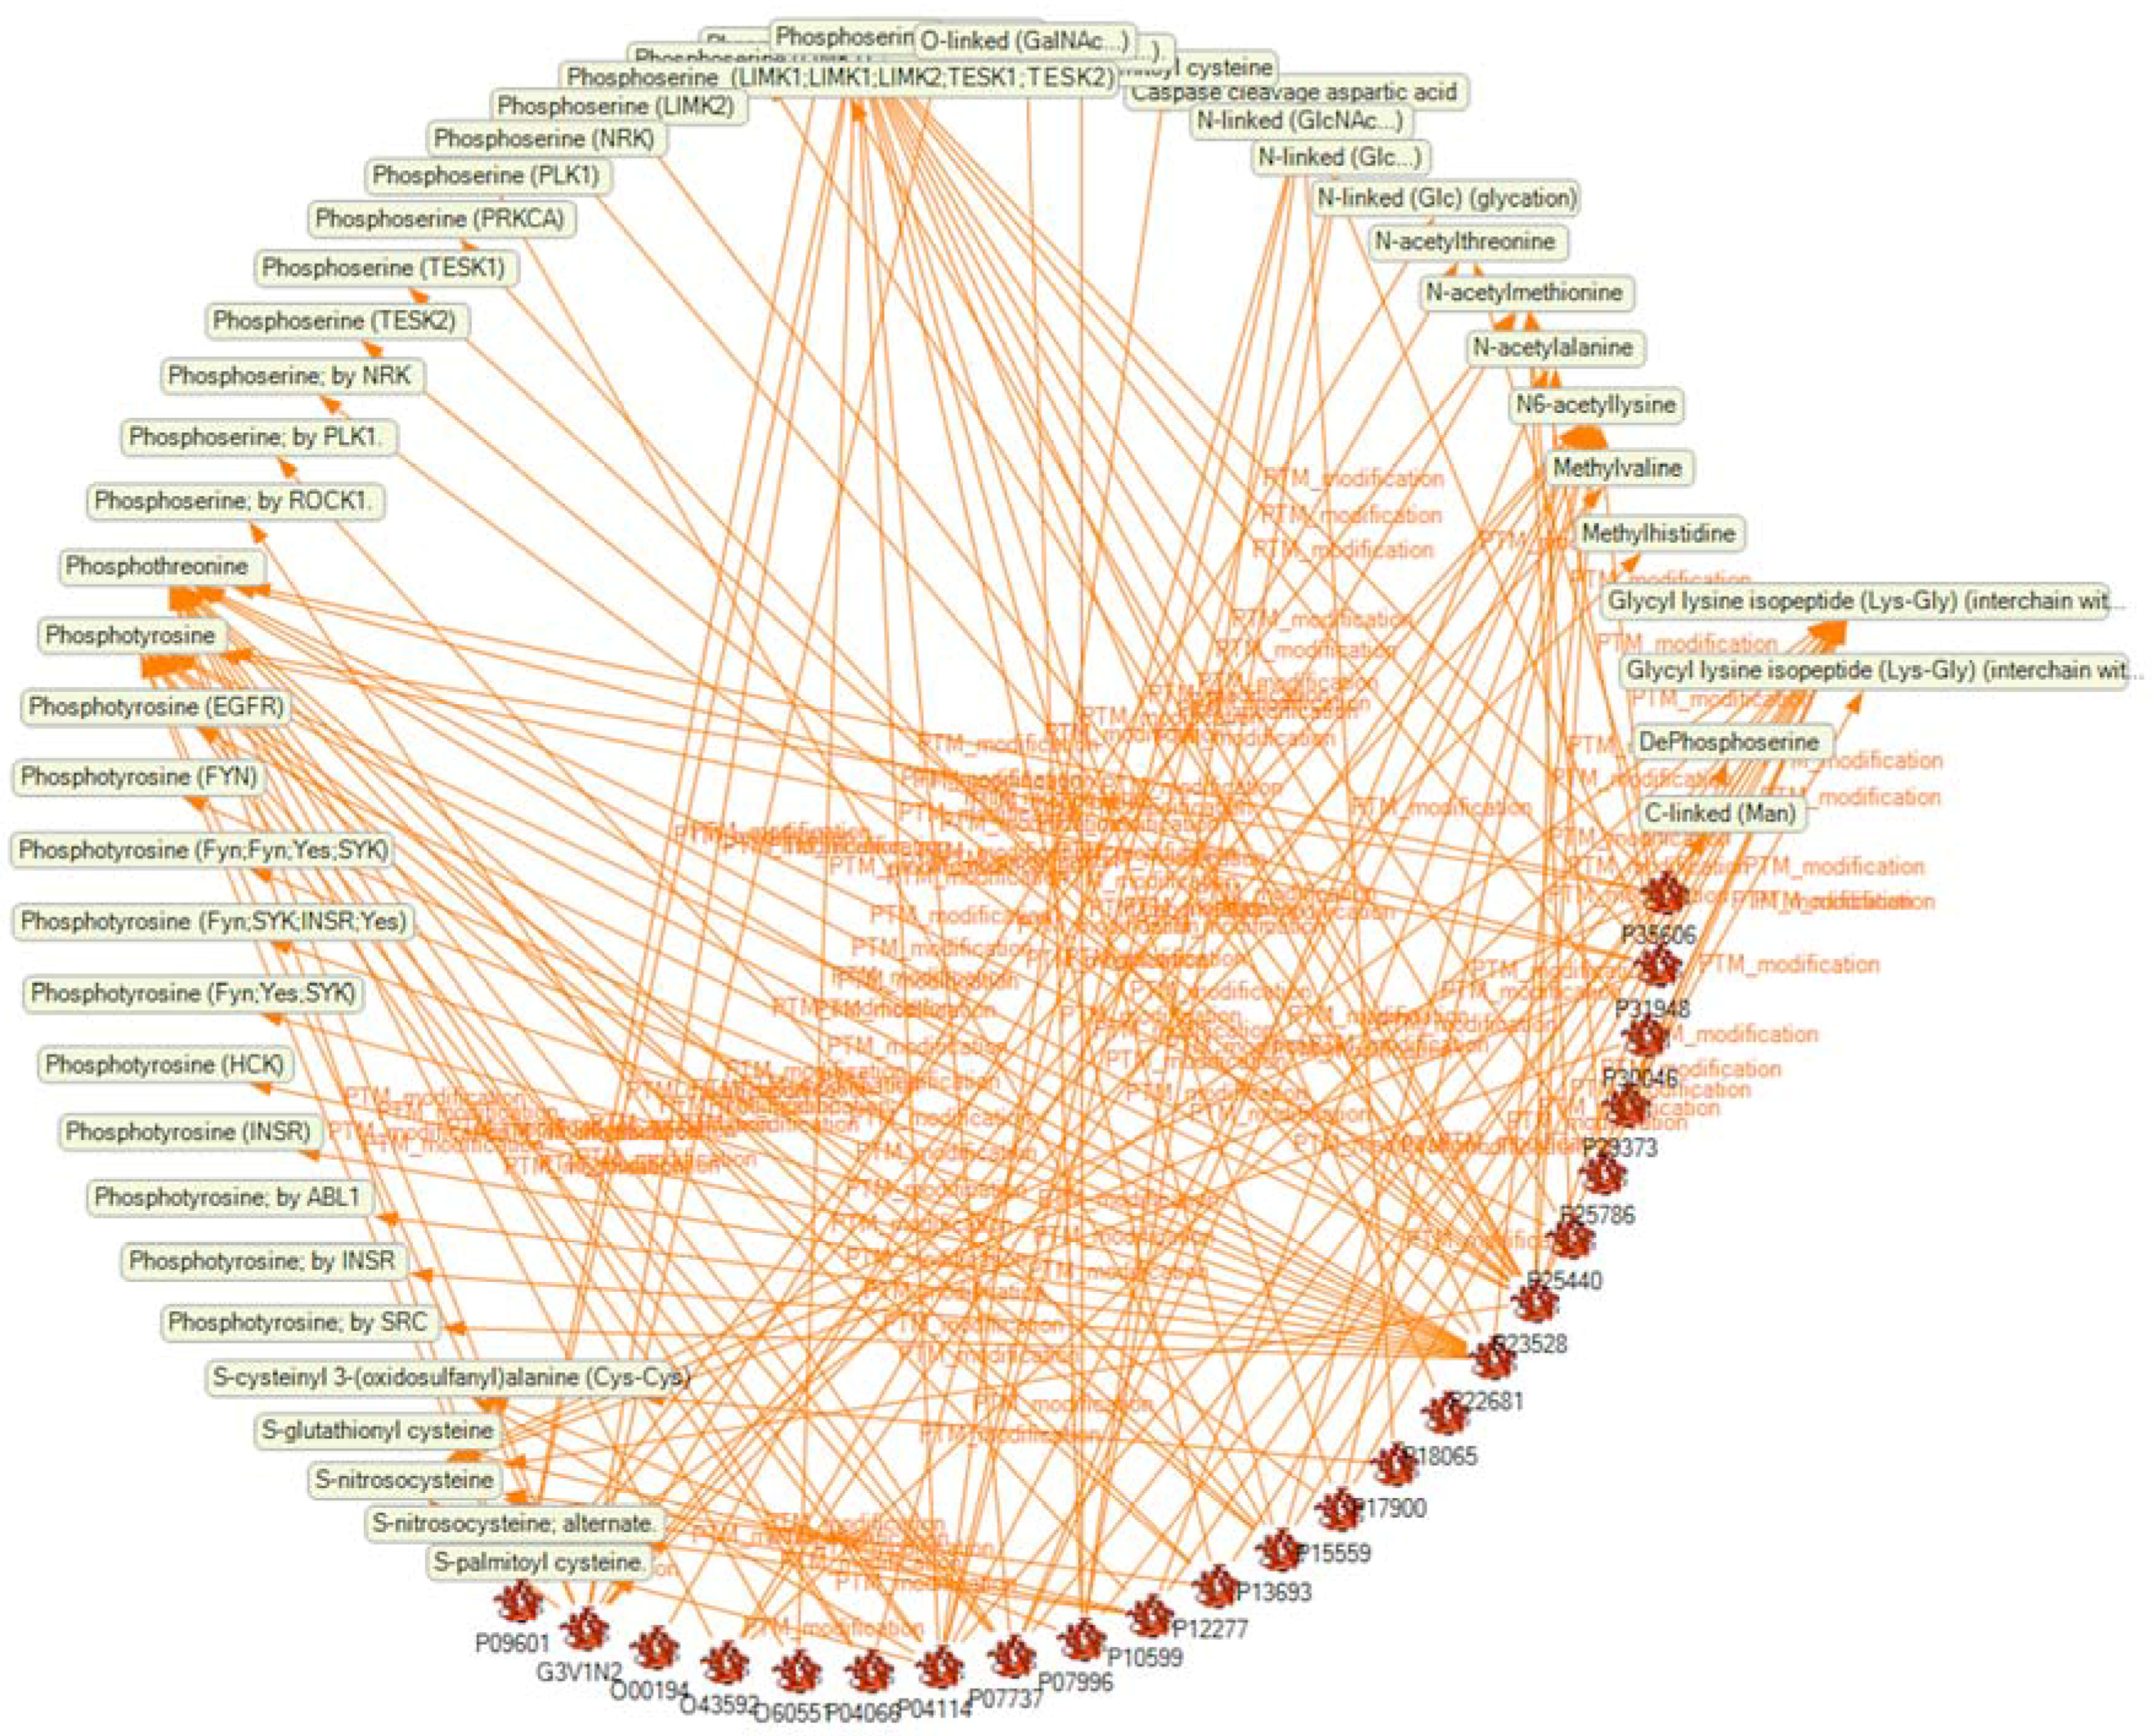
2.4. Analysis of the SKB on PTM Modification
3. Conclusions
4. Materials and Methods
4.1. Proteome Data Used
4.2. Pathway Analysis
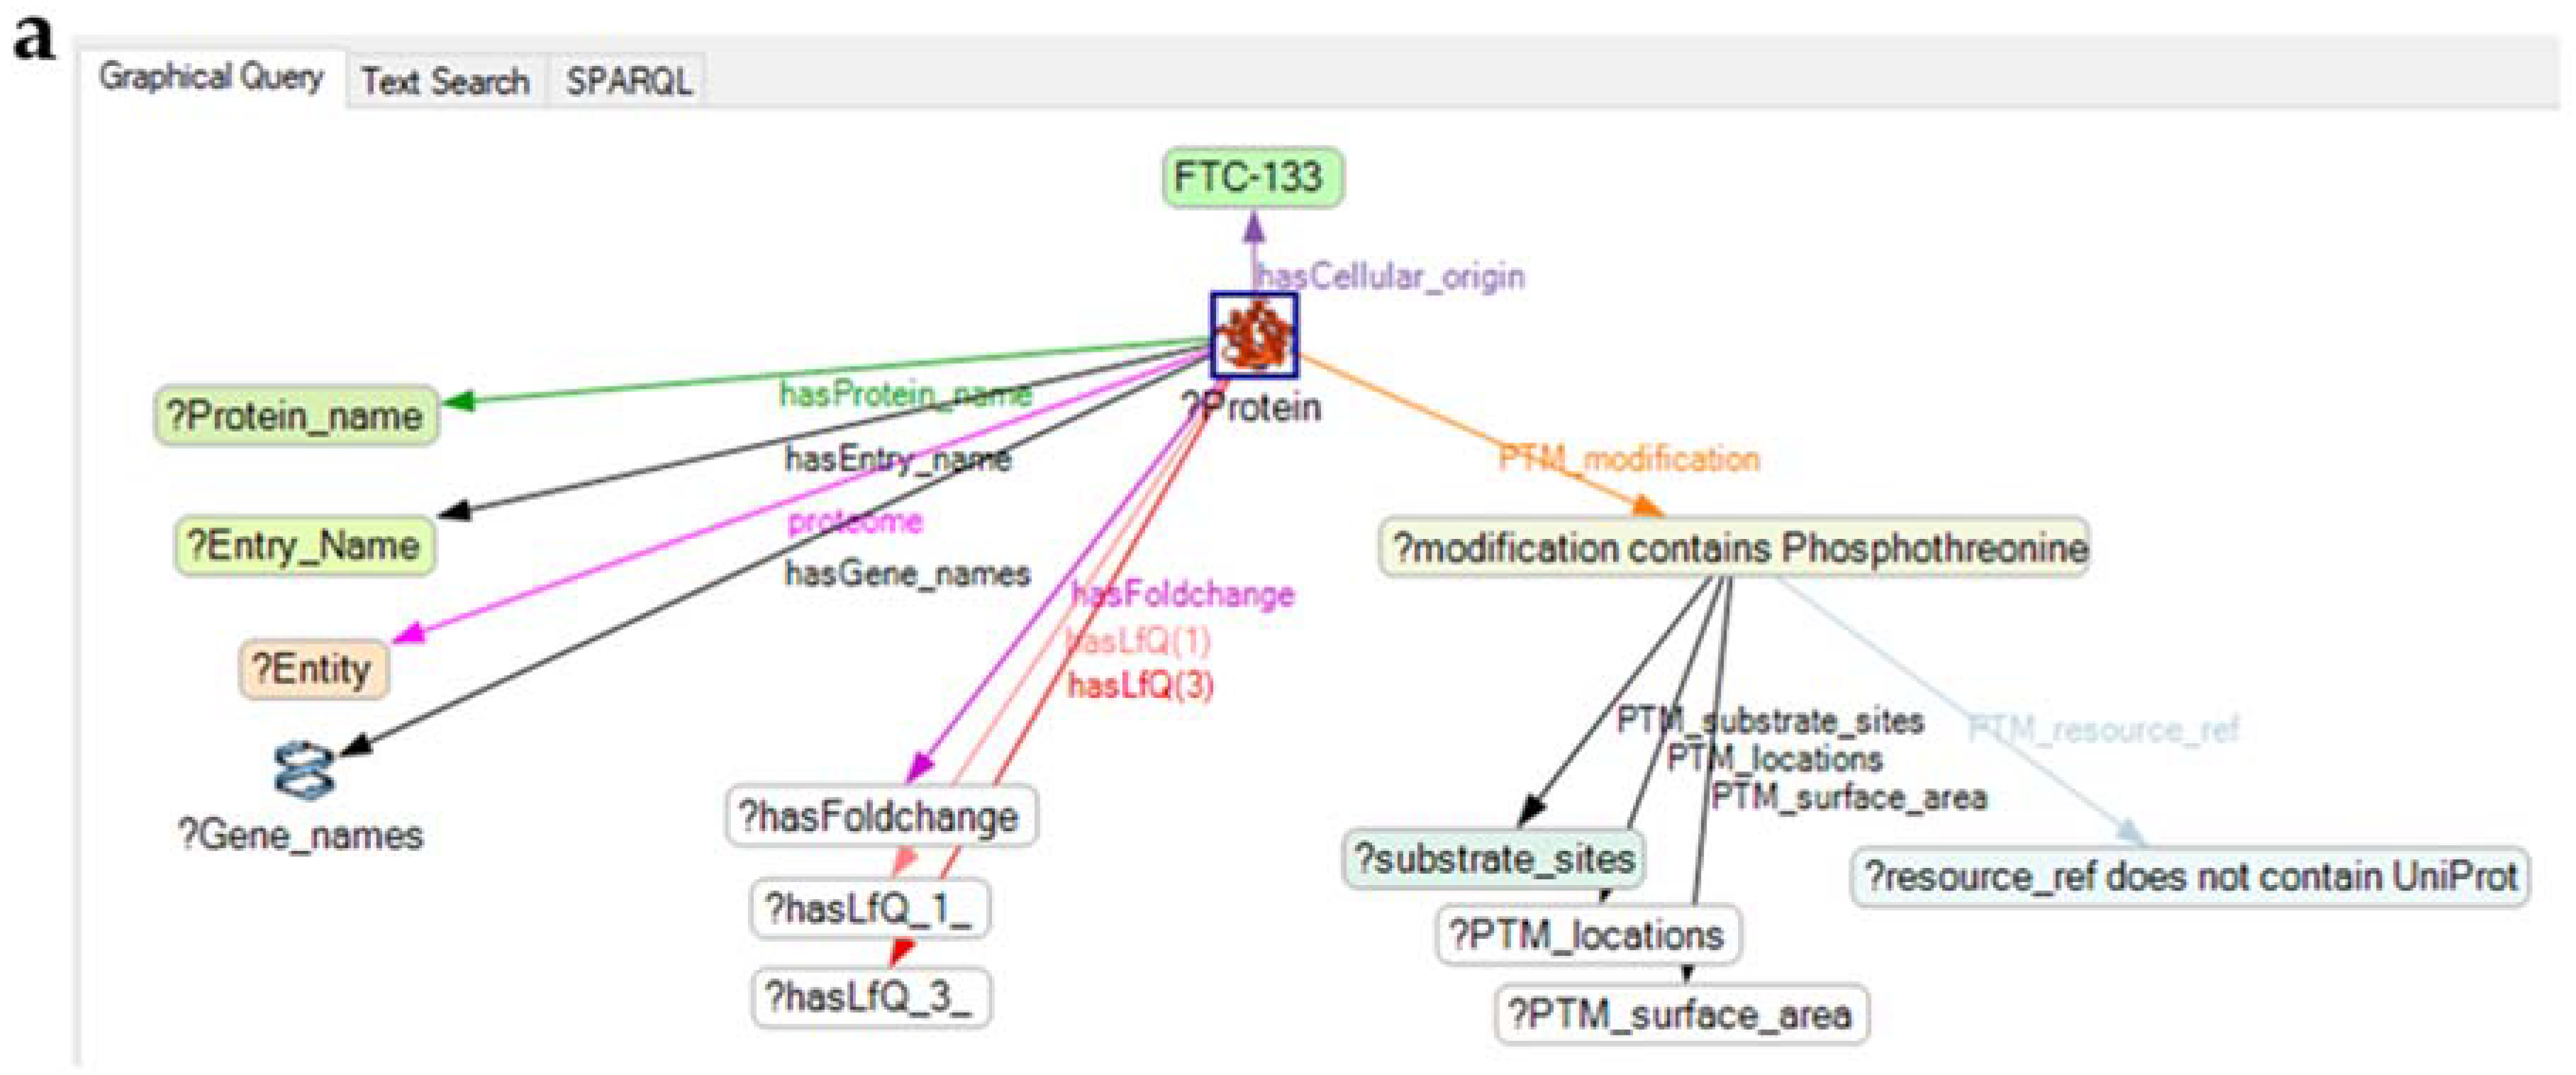
4.3. Application of the Knowledge Explorer
Supplementary Materials
Author Contributions
Funding
Acknowledgments
Conflicts of Interest
Abbreviations
| µg | Microgravity |
| PTM(s) | Posttranslational modification(s) |
| RPM | Random Positioning Machine |
| LfQ | label free quantitation |
| SKB | Semantic Knowledge Base |
| 2D | Two-dimensional |
| 3D | Three-dimensional |
| KE | Knowledge Explorer |
| RDF | Resource Description Framework |
| RPM | Random positioning machine |
| SPARQL | Semantic Protocol and RDF Query Language |
References
- American Cancer Society. Global Cancer Facts & Figures, 3rd ed.; American Cancer Society: Atlanta, GA, USA, 2015; Available online: http://www.cancer.org/content/dam/cancer-org/research/cancer-facts-and-statistics/global-cancer-facts-and-figures/global-cancer-facts-and-figures-3rd-edition.pdf (accessed on 17 July 2017).
- Cabanillas, M.E.; McFadden, D.G.; Durante, C. Thyroid cancer. Lancet 2016, 388, 2783–2795. [Google Scholar] [CrossRef]
- Schmidbauer, B.; Menhart, K.; Hellwig, D.; Grosse, J. Differentiated thyroid cancer-treatment: State of the art. Int. J. Mol. Sci. 2017, 18. [Google Scholar] [CrossRef] [PubMed]
- Ancker, O.V.; Wehland, M.; Bauer, J.; Infanger, M.; Grimm, D. The adverse effect of hypertension in the treatment of thyroid cancer with multi-kinase inhibitors. Int. J. Mol. Sci. 2017, 18. [Google Scholar] [CrossRef] [PubMed]
- Sanders, E.M., Jr.; LiVolsi, V.A.; Brierley, J.; Shin, J.; Randolph, G.W. An evidence-based review of poorly differentiated thyroid cancer. World J. Surg. 2007, 31, 934–945. [Google Scholar] [PubMed]
- Xing, M. Braf mutation in papillary thyroid cancer: Pathogenic role, molecular bases, and clinical implications. Endocr. Rev. 2007, 28, 742–762. [Google Scholar] [CrossRef] [PubMed]
- Are, C.; Shaha, A.R. Anaplastic thyroid carcinoma: Biology, pathogenesis, prognostic factors, and treatment approaches. Ann. Surg. Oncol. 2006, 13, 453–464. [Google Scholar] [CrossRef] [PubMed]
- Schönberger, J.; Bauer, J.; Spruss, T.; Weber, G.; Chahoud, I.; Eilles, C.; Grimm, D. Establishment and characterization of the follicular thyroid carcinoma cell line ML-1. J. Mol. Med. 2000, 78, 102–110. [Google Scholar] [CrossRef] [PubMed]
- Pietsch, J.; Bauer, J.; Egli, M.; Infanger, M.; Wise, P.; Ulbrich, C.; Grimm, D. The effects of weightlessness on the human organism and mammalian cells. Curr. Mol. Med. 2011, 11, 350–364. [Google Scholar] [CrossRef] [PubMed]
- Warnke, E.; Kopp, S.; Wehland, M.; Hemmersbach, R.; Bauer, J.; Pietsch, J.; Infanger, M.; Grimm, D. Thyroid cells exposed to simulated microgravity conditions—Comparison of the fast rotating clinostat and the random positioning machine. Microgravity Sci. Technol. 2016, 28, 247–260. [Google Scholar] [CrossRef]
- Pietsch, J.; Ma, X.; Wehland, M.; Aleshcheva, G.; Schwarzwälder, A.; Segerer, J.; Birlem, M.; Horn, A.; Bauer, J.; Infanger, M.; et al. Spheroid formation of human thyroid cancer cells in an automated culturing system during the shenzhou-8 space mission. Biomaterials 2013, 34, 7694–7705. [Google Scholar] [CrossRef] [PubMed]
- Borst, A.G.; van Loon, J.J.W.A. Technology and developments for the random positioning machine, rpm. Microgravity Sci. Technol. 2008, 21, 287–292. [Google Scholar] [CrossRef]
- Hauslage, J.; Cevik, V.; Hemmersbach, R. Pyrocystis noctiluca represents an excellent bioassay for shear forces induced in ground-based microgravity simulators (clinostat and random positioning machine). NPJ Microgravity 2017, 3. [Google Scholar] [CrossRef] [PubMed]
- Wuest, S.L.; Richard, S.; Kopp, S.; Grimm, D.; Egli, M. Simulated microgravity: Critical review on the use of random positioning machines for mammalian cell culture. Biomed Res. Int. 2015, 2015. [Google Scholar] [CrossRef] [PubMed]
- Infanger, M.; Kossmehl, P.; Shakibaei, M.; Bauer, J.; Kossmehl-Zorn, S.; Cogoli, A.; Curcio, F.; Oksche, A.; Wehland, M.; Kreutz, R.; et al. Simulated weightlessness changes the cytoskeleton and extracellular matrix proteins in papillary thyroid carcinoma cells. Cell Tissue Res. 2006, 324, 267–277. [Google Scholar] [CrossRef] [PubMed]
- Ma, X.; Pietsch, J.; Wehland, M.; Schulz, H.; Saar, K.; Hubner, N.; Bauer, J.; Braun, M.; Schwarzwälder, A.; Segerer, J.; et al. Differential gene expression profile and altered cytokine secretion of thyroid cancer cells in space. FASEB J. 2014, 28, 813–835. [Google Scholar] [CrossRef] [PubMed] [Green Version]
- Bauer, J.; Kopp, S.; Schlagberger, E.M.; Grosse, J.; Sahana, J.; Riwaldt, S.; Wehland, M.; Luetzenberg, R.; Infanger, M.; Grimm, D. Proteome analysis of human follicular thyroid cancer cells exposed to the random positioning machine. Int. J. Mol. Sci. 2017, 18. [Google Scholar] [CrossRef] [PubMed]
- Campbell, J.J.; Husmann, A.; Hume, R.D.; Watson, C.J.; Cameron, R.E. Development of three-dimensional collagen scaffolds with controlled architecture for cell migration studies using breast cancer cell lines. Biomaterials 2017, 114, 34–43. [Google Scholar] [CrossRef] [PubMed]
- Aebersold, R.; Mann, M. Mass-spectrometric exploration of proteome structure and function. Nature 2016, 537, 347–355. [Google Scholar] [CrossRef] [PubMed]
- Pietsch, J.; Kussian, R.; Sickmann, A.; Bauer, J.; Weber, G.; Nissum, M.; Westphal, K.; Egli, M.; Grosse, J.; Schönberger, J.; et al. Application of free-flow IEF to identify protein candidates changing under microgravity conditions. Proteomics 2010, 10, 904–913. [Google Scholar] [CrossRef] [PubMed]
- Kononikhin, A.S.; Starodubtseva, N.L.; Pastushkova, L.K.; Kashirina, D.N.; Fedorchenko, K.Y.; Brhozovsky, A.G.; Popov, I.A.; Larina, I.M.; Nikolaev, E.N. Spaceflight induced changes in the human proteome. Expert Rev. Proteom. 2017, 14, 15–29. [Google Scholar] [CrossRef] [PubMed]
- La Barbera, G.; Capriotti, A.L.; Michelini, E.; Piovesana, S.; Calabretta, M.M.; Zenezini Chiozzi, R.; Roda, A.; Lagana, A. Proteomic analysis and bioluminescent reporter gene assays to investigate effects of simulated microgravity on caco-2 cells. Proteomics 2017, 17. [Google Scholar] [CrossRef] [PubMed]
- Sahana, J.; Nassef, M.Z.; Wehland, M.; Kopp, S.; Krüger, M.; Corydon, T.J.; Infanger, M.; Bauer, J.; Grimm, D. Decreased e-cadherin in mcf7 human breast cancer cells forming multicellular spheroids exposed to simulated microgravity. Proteomics 2018, 18. [Google Scholar] [CrossRef] [PubMed]
- Riwaldt, S.; Pietsch, J.; Sickmann, A.; Bauer, J.; Braun, M.; Segerer, J.; Schwarzwälder, A.; Aleshcheva, G.; Corydon, T.J.; Infanger, M.; et al. Identification of proteins involved in inhibition of spheroid formation under microgravity. Proteomics 2015, 15, 2945–2952. [Google Scholar] [CrossRef] [PubMed]
- Grosse, J.; Wehland, M.; Pietsch, J.; Schulz, H.; Saar, K.; Hübner, N.; Eilles, C.; Bauer, J.; Abou-El-Ardat, K.; Baatout, S.; et al. Gravity-sensitive signaling drives 3-dimensional formation of multicellular thyroid cancer spheroids. FASEB J. 2012, 26, 5124–5140. [Google Scholar] [CrossRef] [PubMed]
- Bauer, J.; Wehland, M.; Pietsch, J.; Sickmann, A.; Weber, G.; Grimm, D. Annotated gene and proteome data support recognition of interconnections between the results of different experiments in space research. Microgravity Sci. Technol. 2016, 28, 357–365. [Google Scholar] [CrossRef]
- Paulsen, K.; Thiel, C.; Timm, J.; Schmidt, P.M.; Huber, K.; Tauber, S.; Hemmersbach, R.; Seibt, D.; Kroll, H.; Grote, K.-H.; et al. Microgravity-induced alterations in signal transduction in cells of the immune system. Acta Astronaut. 2010, 67, 1116–1125. [Google Scholar] [CrossRef]
- Xu, H.; Wu, F.; Zhang, H.; Yang, C.; Li, K.; Wang, H.; Yang, H.; Liu, Y.; Ding, B.; Tan, Y.; et al. Actin cytoskeleton mediates BMP2-Smad signaling via calponin 1 in preosteoblast under simulated microgravity. Biochimie 2017, 138, 184–193. [Google Scholar] [CrossRef] [PubMed]
- Krishna, R.G.; Wold, F. Post-translational modifications of proteins. In Methods in Protein Sequence Analysis; Imahori, K., Sakiyama, F., Eds.; Springer: Boston, MA, USA, 1993; pp. 167–172. [Google Scholar]
- Kessler, B.M.; Edelmann, M.J. PTMs in conversation: Activity and function of deubiquitinating enzymes regulated via post-translational modifications. Cell Biochem. Biophys. 2011, 60, 21–38. [Google Scholar] [CrossRef] [PubMed]
- Khoury, G.A.; Baliban, R.C.; Floudas, C.A. Proteome-wide post-translational modification statistics: Frequency analysis and curation of the swiss-prot database. Sci. Rep. 2011, 1. [Google Scholar] [CrossRef] [PubMed]
- Csizmok, V.; Forman-Kay, J.D. Complex regulatory mechanisms mediated by the interplay of multiple post-translational modifications. Curr. Opin. Struct. Biol. 2018, 48, 58–67. [Google Scholar] [CrossRef] [PubMed]
- Huang, K.Y.; Su, M.G.; Kao, H.J.; Hsieh, Y.C.; Jhong, J.H.; Cheng, K.H.; Huang, H.D.; Lee, T.Y. dbPTM 2016: 10-year anniversary of a resource for post-translational modification of proteins. Nucleic Acids Res. 2016, 44, D435–D446. [Google Scholar] [CrossRef] [PubMed]
- Gombocz, E.A.; Stanley, R.A.; Rockey, C.; Nishimura, T. Data integration framework for discovery and validation: Smart merging of experimental and public data across ontologies and taxonomies. In Proceedings of the Bio-IT World, Boston, MA, USA, 15–17 May 2008; Available online: http://www. io-informatics.com/news/pdfs/CHI_BioIT2008_poster1.pdf (accessed on 17 July 2017).
- Bauer, J.; Grimm, D.; Gombocz, E. Semantic analysis of thyroid cancer cell proteins obtained from rare research opportunities. J. Biomed. Inform. 2017, 76, 138–153. [Google Scholar] [CrossRef] [PubMed]
- Guo, Y.; Zhang, Y.; Wen, D.; Duan, W.; An, T.; Shi, P.; Wang, J.; Li, Z.; Chen, X.; Li, C. The modest impact of transcription factor Nrf2 on the course of disease in an ALS animal model. Lab. Investig. 2013, 93, 825–833. [Google Scholar] [CrossRef] [PubMed] [Green Version]
- Kopp, S.; Sahana, J.; Islam, T.; Petersen, A.G.; Bauer, J.; Corydon, T.J.; Schulz, H.; Saar, K.; Huebner, N.; Slumstrup, L.; et al. The role of nfkappab in spheroid formation of human breast cancer cells cultured on the random positioning machine. Sci. Rep. 2018, 8. [Google Scholar] [CrossRef] [PubMed]
- Warnke, E.; Pietsch, J.; Wehland, M.; Bauer, J.; Infanger, M.; Görög, M.; Hemmersbach, R.; Braun, M.; Ma, X.; Sahana, J.; et al. Spheroid formation of human thyroid cancer cells under simulated microgravity: A possible role of CTGF and CAV1. Cell Commun. Signal. 2014, 12. [Google Scholar] [CrossRef] [PubMed]
- Dittrich, A.; Grimm, D.; Sahana, J.; Bauer, J.; Krüger, M.; Infanger, M.; Magnusson, N.E. Key proteins involved in spheroid formation and angiogenesis in endothelial cells after long-term exposure to simulated microgravity. Cell Physiol. Biochem. 2018, 45, 429–445. [Google Scholar] [CrossRef] [PubMed]
- Harris, S.; Seaborne, A.; Prud’hommeaux, E. W3c Recommendation 21 March 2013. SPARQL 1.1 Query Language 2013. Available online: http://www.w3.org/TR/2013/REC-sparql11-query-20130321/ (accessed on 17 July 2017).
- Boutet, E.; Lieberherr, D.; Tognolli, M.; Schneider, M.; Bansal, P.; Bridge, A.J.; Poux, S.; Bougueleret, L.; Xenarios, I. Uniprotkb/swiss-prot, the manually annotated section of the uniprot knowledgebase: How to use the entry view. Methods Mol. Biol. 2016, 1374, 23–54. [Google Scholar] [PubMed]
- Lindberg, D.A. Internet access to the national library of medicine. Eff. Clin. Pract. 2000, 3, 256–260. [Google Scholar] [PubMed]
- Hassanzadeh, O.; Miller, R.J. Automatic Curation of Clinical Trials Data in Linkedct CT; Springer International Publishing: Cham, Switzerland, 2015; pp. 270–278. [Google Scholar]
- Milacic, M.; Haw, R.; Rothfels, K.; Wu, G.; Croft, D.; Hermjakob, H.; D’Eustachio, P.; Stein, L. Annotating cancer variants and anti-cancer therapeutics in reactome. Cancers 2012, 4, 1180–1211. [Google Scholar] [CrossRef] [PubMed]
- Romero-Chapman, N.; Lee, J.; Tinker, D.; Uriu-Hare, J.Y.; Keen, C.L.; Rucker, R.R. Purification, properties and influence of dietary copper on accumulation and functional activity of lysyl oxidase in rat skin. Biochem. J. 1991, 275 Pt 3, 657–662. [Google Scholar] [CrossRef] [PubMed] [Green Version]
- Bekker-Jensen, D.B.; Kelstrup, C.D.; Batth, T.S.; Larsen, S.C.; Haldrup, C.; Bramsen, J.B.; Sørensen, K.D.; Høyer, S.; Ørntoft, T.F.; Andersen, C.L.; et al. An optimized shotgun strategy for the rapid generation of comprehensive human proteomes. Cell Syst. 2017, 4, 587–599.e4. [Google Scholar] [CrossRef] [PubMed]
- Rappsilber, J.; Mann, M.; Ishihama, Y. Protocol for micro-purification, enrichment, pre-fractionation and storage of peptides for proteomics using stagetips. Nat. Protoc. 2007, 2, 1896–1906. [Google Scholar] [CrossRef] [PubMed]
- Nagaraj, N.; Kulak, N.A.; Cox, J.; Neuhauser, N.; Mayr, K.; Hoerning, O.; Vorm, O.; Mann, M. System-wide perturbation analysis with nearly complete coverage of the yeast proteome by single-shot ultra hplc runs on a bench top orbitrap. Mol. Cell. Proteom. 2012, 11. [Google Scholar] [CrossRef] [PubMed]
- Cox, J.; Mann, M. Maxquant enables high peptide identification rates, individualized p.P.B.-range mass accuracies and proteome-wide protein quantification. Nat. Biotechnol. 2008, 26, 1367–1372. [Google Scholar] [CrossRef] [PubMed]
- Cox, J.; Hein, M.Y.; Luber, C.A.; Paron, I.; Nagaraj, N.; Mann, M. Accurate proteome-wide label-free quantification by delayed normalization and maximal peptide ratio extraction, termed maxlfq. Mol. Cell. Proteom. 2014, 13, 2513–2526. [Google Scholar] [CrossRef] [PubMed]
- National Center for Biotechnology Information. Available online: https://www.ncbi.nlm.nih.gov/ (accessed on 1 August 2018).
- dbPTM. Available online: http://dbptm.mbc.nctu.edu.tw/ (accessed on 1 August 2018).
- Breitwieser, F.P.; Colinge, J. IsobarPTM: A software tool for the quantitative analysis of post-translationally modified proteins. J. Proteom. 2013, 90, 77–84. [Google Scholar] [CrossRef] [PubMed]
- Li, J.; Jia, J.; Li, H.; Yu, J.; Sun, H.; He, Y.; Lv, D.; Yang, X.; Glocker, M.O.; Ma, L.; et al. Sysptm 2.0: An updated systematic resource for post-translational modification. Database 2014, 2014. [Google Scholar] [CrossRef] [PubMed]
- Chen, Y.J.; Lu, C.T.; Su, M.G.; Huang, K.Y.; Ching, W.C.; Yang, H.H.; Liao, Y.C.; Chen, Y.J.; Lee, T.Y. Dbsno 2.0: A resource for exploring structural environment, functional and disease association and regulatory network of protein s-nitrosylation. Nucleic Acids Res. 2015, 43, D503–D511. [Google Scholar] [CrossRef] [PubMed]
- Spasić, I.; Dunn, W.B.; Velarde, G.; Tseng, A.; Jenkins, H.; Hardy, N.; Oliver, S.G.; Kell, D.B. Memo: A hybrid sql/xml approach to metabolomic data management for functional genomics. BMC Bioinform. 2006, 7. [Google Scholar] [CrossRef] [PubMed] [Green Version]


| Gene Name | Protein Name with Swiss Prot Accession Number | FTC-133 | MCF-7 | ||
|---|---|---|---|---|---|
| LfQ * [1g] | LfQ * [µg] | LfQ * [1g] | LfQ * [µg] | ||
| RAB27B | Ras-related protein Rab-27B (O00194) | 0 | 1.11 | 7.24 | 22.81 |
| XPOT | Exportin-T (O43592) | 0 | 1.75 | 6.62 | 12.92 |
| NMT2 | Glycylpeptide N-tetradecanoyltransferase 2 (O60551) | 0 | 0.31 | 0.39 | 0.72 |
| FUCA1 | Tissue alpha-l-fucosidase (P04066) | 0 | 1.02 | 5.32 | 9.95 |
| THBS1 | Thrombospondin-1 (P07996) | 0 | 3.96 | 3.89 | 11.1 |
| IGFBP2 | Insulin-like growth factor-binding protein 2 (P18065) | 0 | 7.25 | 0.92 | 1.85 |
| CBL | E3 ubiquitin-protein ligase CBL (P22681) | 0 | 0.74 | 0.12 | 0.23 |
| UBE2D1 | Ubiquitin-conjugating enzyme E2 D1 (P51668) | 0 | 0.49 | 0 | 1.14 |
| USP11 | Ubiquitin carboxyl-terminal hydrolase 11 (P51784) | 0 | 0.98 | 0.27 | 0.56 |
| BLOC1S1 | Biogenesis of lysosome-related organelles complex 1 subunit 1 (P78537) | 0 | 0.6 | 0.82 | 2.45 |
| GALK2 | N-acetylgalactosamine kinase (Q01415) | 0 | 0.61 | 2.1 | 4.82 |
| TP53I3 | Quinone oxidoreductase PIG3 (Q53FA7) | 0 | 1.52 | 0.41 | 0.77 |
| ZFYVE26 | Zinc finger FYVE domain-containing protein 26 (Q68DK2) | 0 | 0.22 | 0.05 | 0.16 |
| C3orf17 | Uncharacterized protein C3orf17 (Q6NW34) | 0 | 1.01 | 0.05 | 0.25 |
| FASTKD5 | FAST kinase domain-containing protein 5 (Q7L8L6) | 0 | 1.02 | 0 | 0.46 |
| HS2ST1 | Heparan sulfate 2-O-sulfotransferase 1 (Q7LGA3) | 0 | 3.13 | 0 | 0.37 |
| SZRD1 | SUZ domain-containing protein 1 (Q7Z422) | 0 | 3.52 | 0 | 0.24 |
| UBE2Q1 | Ubiquitin-conjugating enzyme E2 Q1 (Q7Z7E8) | 0 | 1.64 | 1.21 | 2.94 |
| SYVN1 | E3 ubiquitin-protein ligase synoviolin (Q86TM6) | 0 | 0.69 | 1.09 | 4.39 |
| SLC35B2 | Adenosine 3-phospho 5-phosphosulfate transporter 1 (Q8TB61) | 0 | 6.82 | 3.97 | 7.42 |
| NEK9 | Serine/threonine-protein kinase Nek9 (Q8TD19) | 0 | 1.38 | 0.86 | 1.75 |
| CHMP7 | Charged multivesicular body protein 7 (Q8WUX9) | 0 | 0.98 | 0.99 | 1.92 |
| GTF3C6 | General transcription factor 3C polypeptide 6 (Q969F1) | 0 | 0.97 | 1.37 | 2.79 |
| AIDA | Axin interactor. dorsalization-associated protein (Q96BJ3) | 0 | 1.91 | 0 | 0.17 |
| GPATCH1 | G patch domain-containing protein 1 (Q9BRR8) | 0 | 0.77 | 0 | 0.13 |
| ADI1 | 1.2-dihydroxy-3-keto-5-methylthiopentene dioxygenase (Q9BV57) | 0 | 1.32 | 16.08 | 29.15 |
| DUSP23 | Dual specificity protein phosphatase 23 (Q9BVJ7) | 0 | 1.75 | 2.76 | 5.02 |
| C20orf27 | UPF0687 protein C20orf27 (Q9GZN8) | 0 | 1.05 | 2.55 | 5.08 |
| DNAJC5 | DnaJ homolog subfamily C member 5 (Q9H3Z4) | 0 | 1.84 | 7.88 | 14.6 |
| CBX8 | Chromobox protein homolog 8 (Q9HC52) | 0 | 3.35 | 1.79 | 3.86 |
| BIN3 | Bridging integrator 3 (Q9NQY0) | 0 | 1.34 | 0 | 0.27 |
| TBC1D13 | TBC1 domain family member 13 (Q9NVG8) | 0 | 1.6 | 1.59 | 2.98 |
| IGBP1 | Immunoglobulin-binding protein 1 (P78318) | 0.7 | 1.32 | 1.14 | 2.33 |
| ANKRD52 | Serine/threonine-protein phosphatase 6 regulatory ankyrin repeat subunit C (Q8NB46) | 0.73 | 1.37 | 0 | 0.18 |
| THOP1 | Thimet oligopeptidase (P52888) | 1.04 | 2.05 | 1.58 | 3.49 |
| AGPAT9 | Glycerol-3-phosphate acyltransferase 3 (Q53EU6) | 1.25 | 2.46 | 0 | 0.13 |
| HBA2 | Hemoglobin subunit alpha (G3V1N2) | 1.43 | 8.92 | 2.05 | 5.25 |
| UBE2D3 | Ubiquitin-conjugating enzyme E2 D3 (P61077) | 1.6 | 4.05 | 0 | 2.26 |
| GM2A | Ganglioside GM2 activator (P48637) | 1.75 | 3.34 | 1.12 | 2.45 |
| KDM2A | Lysine-specific demethylase 2A (Q9Y2K7) | 1.87 | 5.59 | 1.47 | 4.13 |
| GSS | Glutathione synthetase (P48637) | 1.89 | 5.08 | 2.14 | 4.99 |
| TMEM263 | Transmembrane protein 263 (Q8WUH6) | 2.29 | 4.19 | 3.66 | 9.68 |
| BRD2 | Bromodomain-containing protein 2 (P25440) | 2.33 | 4.43 | 5.15 | 9.39 |
| GCLM | Glutamate-cysteine ligase regulatory subunit (P48507) | 3.91 | 9.31 | 0.30 | 1.93 |
| PPP5C | Serine/threonine-protein phosphatase 5 (P53041) | 3.99 | 9.22 | 3.96 | 7.77 |
| PTGR1 | Prostaglandin reductase 1 (Q14914) | 5.25 | 11.92 | 1.21 | 5.62 |
| PIN4 | Peptidyl-prolyl cis-trans isomerase NIMA-interacting 4 (Q9Y237) | 5.59 | 12.75 | 5.64 | 10.88 |
| TXNDC17 | Thioredoxin domain-containing protein 17 (Q9BRA2) | 5.88 | 14.58 | 14.38 | 52.39 |
| PSMB3 | Proteasome subunit beta type-3 (P49720) | 5.92 | 10.72 | 1.05 | 2.5 |
| HSP90AB2P | Putative heat shock protein HSP 90-beta 2 (Q58FF8) | 6.19 | 13.49 | 9.79 | 36.46 |
| DDT | D-dopachrome decarboxylase (P30046) | 6.46 | 13.31 | 1.35 | 5.21 |
| OSTF1 | Osteoclast-stimulating factor 1 (Q92882) | 7.47 | 19.57 | 2.97 | 7.56 |
| UFM1 | Ubiquitin-fold modifier 1 (P61960) | 7.89 | 15.94 | 12.82 | 25.55 |
| APOB | Apolipoprotein B-100 (P04114) | 8.67 | 49.51 | 0.10 | 10.18 |
| CRABP2 | Cellular retinoic acid-binding protein 2 (P29373) | 8.88 | 17.32 | 13.46 | 65.46 |
| PSMA1 | Proteasome subunit alpha type-1 (P25786) | 13.84 | 27.82 | 5.4 | 10.7 |
| HMOX1 | Heme oxygenase 1 (P09601) | 14.62 | 108.19 | 0.58 | 1.39 |
| COPB1 | Coatomer subunit beta (P53618) | 16.3 | 37 | 83.81 | 122.1 |
| CKB | Creatine kinase B-type (P12277) | 21.21 | 40.3 | 0.72 | 1.35 |
| NQO1 | NAD(P)H dehydrogenase [quinone] 1 (P15559) | 22.76 | 56.44 | 65.66 | 183.6 |
| PSMA6 | Proteasome subunit alpha type-6 (P60900) | 23.4 | 47.27 | 2.53 | 8.56 |
| TPT1 | Translationally-controlled tumor protein (P13693) | 26.04 | 64.58 | 13.01 | 35.49 |
| DSTN | Destrin (P60981) | 27.1 | 79.13 | 7.27 | 34.58 |
| TXN | Thioredoxin (P10599) | 34.2 | 88.24 | 209.2 | 431.8 |
| COPB2 | Coatomer subunit beta (P35606) | 55.33 | 102.36 | 57.34 | 107.4 |
| STIP1 | Stress-induced-phosphoprotein 1 (P31948) | 80.66 | 186.81 | 123 | 208.2 |
| PFN1 | Profilin-1 (P07737) | 89.96 | 221.3 | 126.1 | 265.1 |
| NSF | Vesicle-fusing ATPase (P46459) | 93.46 | 206.55 | 41.33 | 76.3 |
| CFL1 | Cofilin-1 (P23528) | 150.6 | 316.26 | 238.9 | 628.9 |
| Gene Name | Modification | Location | Substrate Site |
|---|---|---|---|
| RAB27B (O00194) | N-acetylthreonine | 2 | MTDGDY |
| XPOT (O43592) | N-acetylmelthionine | 1 | MDEQA |
| Glycyl lysine isopeptide (Lys-Gly) (interchain with G-Cter in ubiquitin) | 557 | KSLNKQMNP | |
| N6-acetyllysine | 627 | PLMEKFKIL | |
| Glycyl lysine isopeptide (Lys-Gly) (interchain with G-Cter in ubiquitin) | 629 | MEKFKILLE | |
| Glycyl lysine isopeptide (Lys-Gly) (interchain with G-Cter in ubiquitin) | 634 | ILLEKLMLA | |
| N6-acetyllysine | 634 | ILLEKLMLA | |
| Phosphothreonine | 661 | FASRTSKAF | |
| GM2A (P17900) | S-cysteinyl 3-(oxidosulfanyl)alanine (Cys-Cys) | 39 | SWDNCDEGK |
| N-linked (GlcNAc) | 63 | IVPGNVTLS | |
| S-cysteinyl 3-(oxidosulfanyl)alanine (Cys-Cys) | 99 | IKIPCTDYI | |
| S-cysteinyl 3-(oxidosulfanyl)alanine (Cys-Cys) | 106 | YIGSCTFEH | |
| S-cysteinyl 3-(oxidosulfanyl)alanine (Cys-Cys) | 112 | FEHFCDVLD | |
| S-cysteinyl 3-(oxidosulfanyl)alanine (Cys-Cys) | 125 | TGEPCPEPL | |
| S-cysteinyl 3-(oxidosulfanyl)alanine (Cys-Cys) | 136 | YGLPCHCPF | |
| S-cysteinyl 3-(oxidosulfanyl)alanine (Cys-Cys) | 138 | LPCHCPFKE | |
| S-cysteinyl 3-(oxidosulfanyl)alanine (Cys-Cys) | 183 | KRLGCIKIA | |
| THBS1 (P07996) | N-linked (GlcNAc) | 248 | NNVVNGSSP |
| C-linked (Man) | 385 | GWSPWSEWT | |
| O-linked (Fuc) | 394 | SCSTSCGNG | |
| O-linked (GalNAc) | 394 | SCSTSCGNG | |
| C-linked (Man) | 438 | QDGGWSHWS | |
| C-linked (Man) | 441 | GWSHWSPWS | |
| S-cysteinyl 3-(oxidosulfanyl)alanine (Cys-Cys) | 447 | PWSSCSVTC | |
| O-linked (Fuc) | 450 | SCSVTCGDG | |
| O-linked (GalNAc) | 450 | SCSVTCGDG | |
| S-cysteinyl 3-(oxidosulfanyl)alanine (Cys-Cys) | 451 | CSVTCGDGV | |
| S-cysteinyl 3-(oxidosulfanyl)alanine (Cys-Cys) | 462 | RIRLCNSPS | |
| S-cysteinyl 3-(oxidosulfanyl)alanine (Cys-Cys) | 474 | NGKPCEGEA | |
| S-cysteinyl 3-(oxidosulfanyl)alanine (Cys-Cys) | 484 | ETKACKKDA | |
| S-cysteinyl 3-(oxidosulfanyl)alanine (Cys-Cys) | 489 | KKDACPING | |
| C-linked (Man) | 498 | GWGPWSPWD | |
| O-linked (Fuc) | 507 | ICSVTCGGG | |
| N-linked (GlcNAc) | 1067 | VKVVNSTTG | |
| PSMA1 (P25786) | N-acetylmethionine | 1 | MFRNQ |
| Phosphoserine | 14 | VTVWSPQGR | |
| Glycyl lysine isopeptide (Lys-Gly) (interchain with G-Cter in ubiquitin) | 30 | MEAVKQGSA | |
| Glycyl lysine isopeptide (Lys-Gly) (interchain with G-Cter in ubiquitin) | 39 | YTVGLKSKTH | |
| Glycyl lysine isopeptide (Lys-Gly) (interchain with G-Cter in ubiquitin) | 51 | GLKSKTHAV | |
| Phosphoserine | 54 | KRAQSELAA | |
| Glycyl lysine isopeptide (Lys-Gly) (interchain with G-Cter in ubiquitin) | 61 | AAHQKKILH | |
| Glycyl lysine isopeptide (Lys-Gly) (interchain with G-Cter in ubiquitin) | 115 | LIGSKTQIP | |
| Glycyl lysine isopeptide (Lys-Gly) (interchain with G-Cter in ubiquitin) | 208 | DLTTKNVSI | |
| Phosphoserine | 211 | TKNVSIGIV | |
| Glycyl lysine isopeptide (Lys-Gly) (interchain with G-Cter in ubiquitin) | 243 | RPQRKAQPA | |
| Glycyl lysine isopeptide (Lys-Gly) (interchain with G-Cter in ubiquitin) | 256 | EPAEKADEP |
© 2018 by the authors. Licensee MDPI, Basel, Switzerland. This article is an open access article distributed under the terms and conditions of the Creative Commons Attribution (CC BY) license (http://creativecommons.org/licenses/by/4.0/).
Share and Cite
Bauer, J.; Wehland, M.; Infanger, M.; Grimm, D.; Gombocz, E. Semantic Analysis of Posttranslational Modification of Proteins Accumulated in Thyroid Cancer Cells Exposed to Simulated Microgravity. Int. J. Mol. Sci. 2018, 19, 2257. https://doi.org/10.3390/ijms19082257
Bauer J, Wehland M, Infanger M, Grimm D, Gombocz E. Semantic Analysis of Posttranslational Modification of Proteins Accumulated in Thyroid Cancer Cells Exposed to Simulated Microgravity. International Journal of Molecular Sciences. 2018; 19(8):2257. https://doi.org/10.3390/ijms19082257
Chicago/Turabian StyleBauer, Johann, Markus Wehland, Manfred Infanger, Daniela Grimm, and Erich Gombocz. 2018. "Semantic Analysis of Posttranslational Modification of Proteins Accumulated in Thyroid Cancer Cells Exposed to Simulated Microgravity" International Journal of Molecular Sciences 19, no. 8: 2257. https://doi.org/10.3390/ijms19082257