Article

Nitrogen Source Dependent Changes in Central Sugar Metabolism Maintain Cell Wall Assembly in Mitochondrial Complex I-Defective frostbite1 and Secondarily Affect Programmed Cell Death

1
Institute of Experimental Plant Biology and Biotechnology, Faculty of Biology, University of Warsaw, I. Miecznikowa 1, 02-096 Warsaw, Poland
2
Umeå Plant Science Centre, Department of Plant Physiology, Umeå University, SE-90187 Umeå, Sweden, [email protected]
*
Author to whom correspondence should be addressed.
Int. J. Mol. Sci. 2018, 19(8), 2206; https://doi.org/10.3390/ijms19082206
Submission received: 11 June 2018 / Revised: 20 July 2018 / Accepted: 24 July 2018 / Published: 28 July 2018
(This article belongs to the Special Issue Plant Mitochondria)

Abstract

:
For optimal plant growth, carbon and nitrogen availability needs to be tightly coordinated. Mitochondrial perturbations related to a defect in complex I in the Arabidopsis thaliana frostbite1 (fro1) mutant, carrying a point mutation in the 8-kD Fe-S subunit of NDUFS4 protein, alter aspects of fundamental carbon metabolism, which is manifested as stunted growth. During nitrate nutrition, fro1 plants showed a dominant sugar flux toward nitrogen assimilation and energy production, whereas cellulose integration in the cell wall was restricted. However, when cultured on NH4+ as the sole nitrogen source, which typically induces developmental disorders in plants (i.e., the ammonium toxicity syndrome), fro1 showed improved growth as compared to NO3 nourishing. Higher energy availability in fro1 plants was correlated with restored cell wall assembly during NH4+ growth. To determine the relationship between mitochondrial complex I disassembly and cell wall-related processes, aspects of cell wall integrity and sugar and reactive oxygen species signaling were analyzed in fro1 plants. The responses of fro1 plants to NH4+ treatment were consistent with the inhibition of a form of programmed cell death. Resistance of fro1 plants to NH4+ toxicity coincided with an absence of necrotic lesion in plant leaves.

Graphical Abstract

1. Introduction

Plants are autotrophic organisms that use assimilated nitrogen and carbon for the biosynthesis of proteins and other organic compounds in order to fulfil the developmental needs of their organs. It must be noted that the assimilation of nitrogen is one of the most energy-consuming cellular processes for plants. Indeed, the reduction of nitrate (NO3) to ammonium (NH4+) and its incorporation into amino acids consumes the equivalent of 12 ATP molecules [1,2]. Like all living organisms, plants require energy (in the form of ATP) and reductants (mainly NADH and NADPH) for their maintenance. Plant mitochondria carry out the final step of respiration to integrate sugar catabolism with ATP production. Therefore, mitochondria drive metabolism throughout the cell, since they can regulate energy and redox balance [3,4,5]. Furthermore, the central metabolic position of mitochondria, and their key roles in bioenergetics, mean that they are ideally placed to act as sensors and integrators of the biochemical status of the cell. On the other hand, a close and active communication between mitochondria and other organelles and the nucleus (retrograde signaling) exists to adjust correct metabolic function of plants in response to different environmental conditions [6,7]. Additionally, a significant role in the response of mitochondria to stress conditions has been proposed for reactive oxygen species (ROS), which can be very effective signaling molecules [8,9]. Thus, mitochondrial retrograde signals can mediate diverse developmental processes, from growth regulation to programmed cell death (PCD).
The classical mitochondrial electron-transport chain (mtETC) is composed of four respiratory oxidoreductases (complexes I–IV), which couple redox energy recycling with ATP synthesis catalyzed by the ATP synthase complex (complex V) [10]. The main entry point for electrons to the mtETC is complex I, which functions as an NADH dehydrogenase. Complex I oxidizes matrix NADH, which can be supplied primarily by the tricarboxylic acid (TCA) cycle, by glycine decarboxylation or cytosolic NADH generated mainly during glycolysis and further shuttled into mitochondria by the oxaloacetate (OAA)-malate valve. Loss of complex I activity in mutant plants lowers the efficiency of oxidative phosphorylation by more than 30% [11]. Nevertheless, the activity of specific plant type II dehydrogenases allows electrons from NAD(P)H to enter the mtETC, which enables mutants to survive without a functional complex I [12,13]. Complex I, which is composed of many subunits, is the largest transmembrane, proton-pumping complex in the mtETC. Mutations in any of these subunits can severely hinder or even inhibit complex I assembly or activity. To date, only four mutants in mitochondrially encoded subunits have been characterised—cytoplasmic male sterility in tobacco (Nicotiana sylvestris), CMSII, [14,15,16], non-chromosomal stripe in maize (Zea mays), NCS2, [17,18], mosaic phenotype (MSC16) in cucumber (Cucumis sativus) [19,20]. In addition, nuclear-gene encoded mutants having defects in complex I have been identified in Arabidopsis, e.g., ndufs4 and ndufv1 [11,21]. Moreover, there are several Arabidopsis thaliana complex I mutants that are defective in other complex I-connected subunits, including ca1ca2 [22] and atcib22 [23], or are connected to splicing factors such as otp43 [24], css1 [25], nMat2 [26], rug3 [27], mterf15 [28], and bir6 [29], as well as an N. sylvestris mutant, NMS1 [30,31]. In the last decade, several of these complex I mutants have been characterized (reviewed by [32,33]).
All mutants with dysfunction or loss of complex I exhibit reorganized respiratory metabolism, which may affect their redox and energy status. MSC16 plants showed lower NAD(P)H availability [34] and lower respiratory rates, which resulted in lower ATP contents [20,35]. Similarly, the NMS1 and NCS2 mutants showed reduced respiratory capacity but no data about their adenylate or nucleotide status is available [17,31]. Even though ndufs4 showed normal respiratory capacity, the mutant produced only limited amounts of ATP [11]. The exception is the CMSII mutant, which had a higher content of adenylates and NAD(P)H [34,36], concomitantly with unchanged respiratory fluxes [16,29]. Overall, research using complex I mutants indicates that complex I defects in plants are compensated by reorganization of respiration, although oxidative phosphorylation rates are not fully restored, and most mutant plants are energy deficient. Because of their altered metabolic status, most complex I mutants examined so far showed retarded growth and developmental disorders, in comparison to wild-type (WT) plants. Moreover, a defect in the mtETC often correlates with the occurrence of oxidative stress [11,36,37], and mitochondria were mainly highlighted in these mutants as a primary source of the observed higher rates of ROS generation [37]. Furthermore, a reduced complex I abundance was also found to affect mitochondrial biogenesis. Mutants plants were characterized by altered mitochondrial transcription, translation, and showed altered protein uptake capacities [27,28,38,39].
Interestingly, many complex I mutants apparently have high tolerance to stress conditions. In CMSII plants, higher tolerance to ozone and to the tobacco mosaic virus was detected [16,40,41,42]. The MSC16 mutant showed an increased resistance to chilling stress and high irradiance conditions [35,38]. In NCS2 plants, improved tolerance to oxidative stress was observed, which limited initiation of PCD [43,44]. In a study of several types of stress (drought, osmotic, chilling, freezing, paraquat, NaCl, H2O2), ndufs4 mutant plants showed improved resistance to abiotic stress conditions in comparison to the WT [11,45]. Similarly, the nMat22 mutant showed improved tolerance to ethanol treatment [23] and bir6 was resistant to salt and osmotic stress [29]. Another complex I mutant was discovered by chance when looking for genes involved in stress signal transduction in an ethyl methanesulfonate-mutagenized population under different stress conditions and was named frostbite1 (fro1), because of its susceptibility to chilling temperatures [46]. It was shown that fro1 plants had a single point mutation in the nuclear-encoded 18-kDa Fe–S subunit of complex I, which concerned a G-to-A change at an intron–exon junction at the start codon resulting in missplicing and a premature stop codon [46]. Consequently, the lack of NDUFS4 led to the disassembly of complex I [47]. Moreover, the fro1 mutation reduced the expression of stress-inducible genes during chilling conditions, which impaired cold acclimation, whereby mutants also became sensitive to other stress factors like NaCl and osmotic stress [46]. In contrast to these responses, in our recent study, fro1 plants showed improved resistance to ammonium nutrition [47].
Cultivation using NH4+ as the sole nitrogen source for many plants, including Arabidopsis, leads to severe toxicity symptoms known as the “ammonium syndrome” [48,49]. Ammonium regulates many physiological processes, ranging from mitosis and cell elongation to senescence and death; hence, ammonium availability may act as a major determinant of plant morphogenesis [50,51]. During NH4+ nutrition, nitrate reduction reactions catalyzed by nitrate reductase (NR) and nitrite reductase (NiR) are bypassed, resulting in a surplus of reductants in the cytosol and chloroplasts. Therefore, in terms of energy economy, NH4+ would seem to be a better source of nitrogen for plants, as its assimilation requires less energy than that for NO3 [1,2]. However, plants cultured on NH4+ as a sole nitrogen source often exhibit serious growth disorders; still, despite many years of research concerning this phenomenon, the cause is still not well understood [52,53]. Plant mitochondria are a source of metabolites needed during NH4+ assimilation, particularly the TCA cycle, which is the origin of the necessary 2-oxoglutarate (2-OG) for amino acid synthesis [2,52,54]. Elevated activity of the TCA cycle during NH4+ nutrition increases mitochondrial matrix NADH production, which must be oxidized by the mtETC [55,56]. Therefore, ammonium nutrition may primarily affect plant mitochondria, since the increased load of redox equivalents to the mtETC and the consequent high respiratory capacity leads to elevated ROS levels in mitochondria [57].
Furthermore, use of the fro1 mutant revealed that the combined effect of an impairment of complex I and NH4+ treatment not only affects mitochondrial functioning in plants, but also changes their extracellular metabolism [47]. It is known that higher cell wall stiffness in response to NH4+ nutrition, resulting from altered cell wall modifying enzyme activities, can restrict expansion growth of plant cells [58]. Thus, the aim of this study was to investigate the interplay between mitochondrial functioning and cell wall-related processes in response to NH4+ nutrition. To understand changes in the growth rate of fro1 when cultured on NH4+, properties of cell walls and sugar metabolism were examined. Moreover, the role of plant mitochondria in retrograde signalling and PCD was analyzed.

2. Results

2.1. Characterization of fro1 Plants Cultured on Different Nitrogen Sources

The consequences of limited ability to oxidize cellular oxidants in mutants carrying a point mutation in NDUFS4 (AT5G67590), affecting complex I assembly—frostbite1 [46,47], on plant growth was observed under NH4+ and NO3 (control) nutrition. During NO3 assimilation, fro1 plants showed strong growth retardation, compared to WT plants (Arabidopsis thaliana, ecotype C24) (Figure 1). However, under NH4+ nutrition fro1 plants grew overall bigger rosettes than the same plants cultured in NO3 conditions, while WT plants displayed growth inhibition in response to the NH4+ treatment (Figure 1) (similarly to a previous report by [47]).

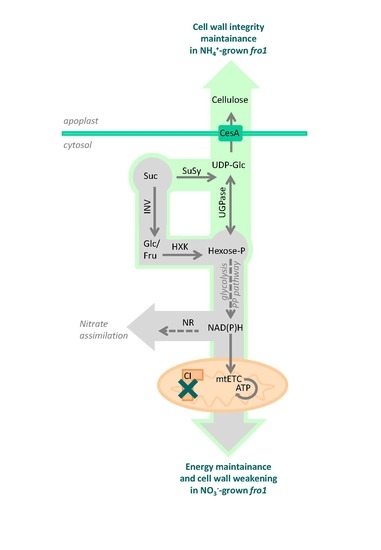
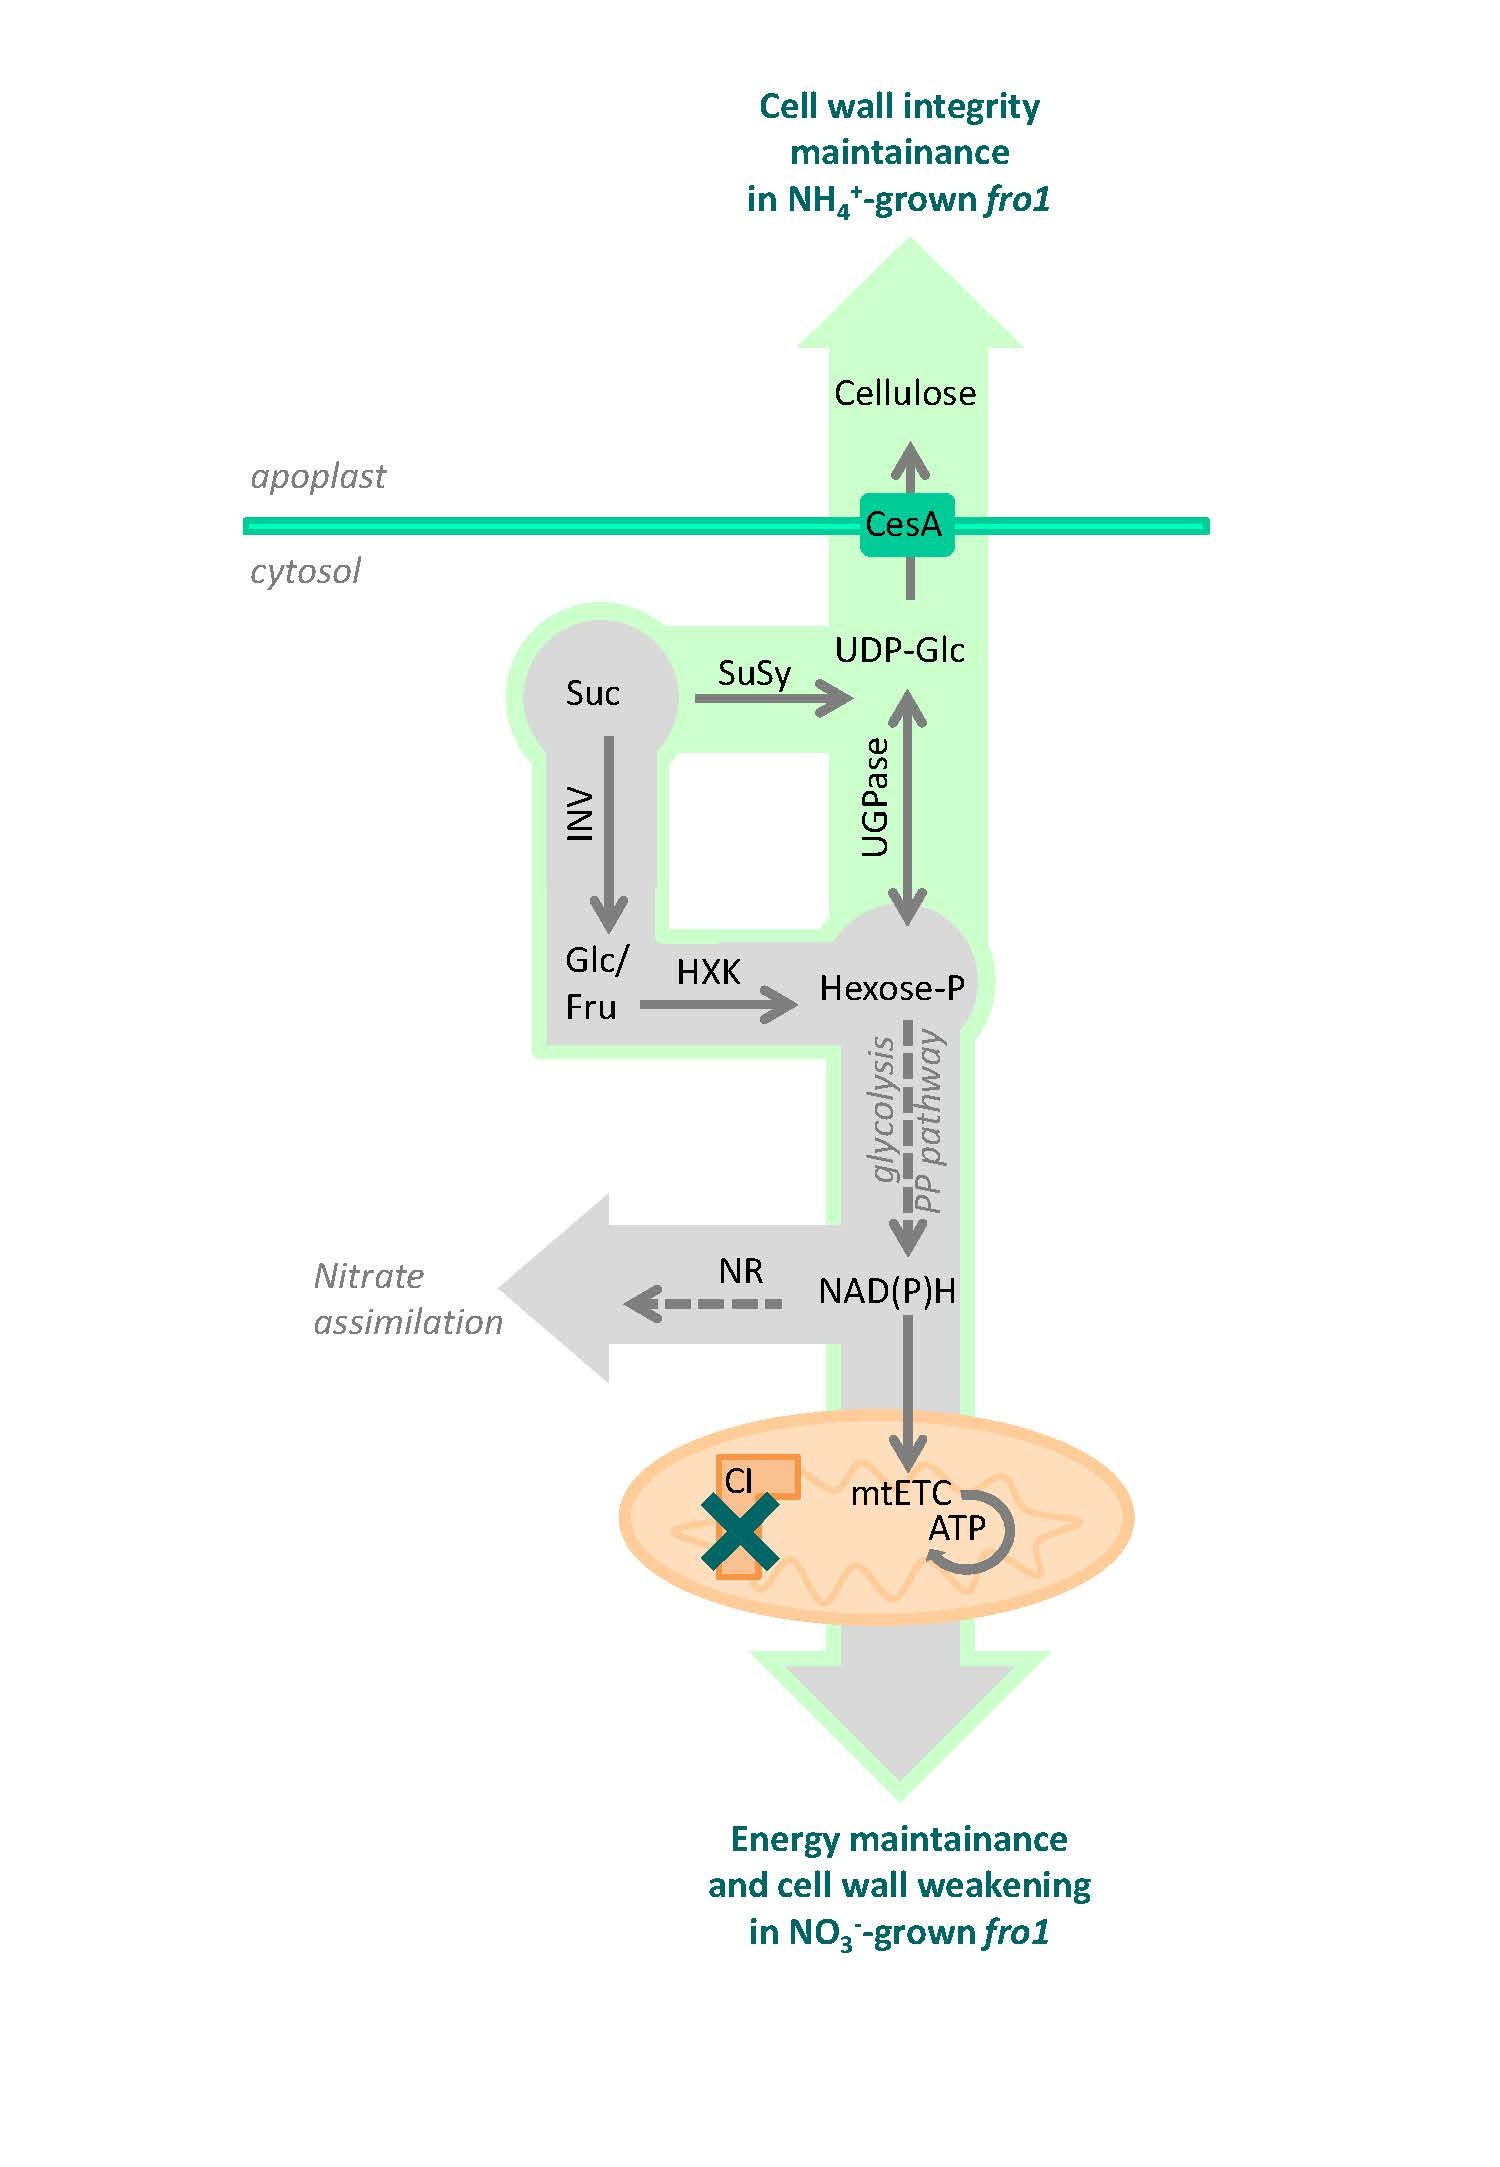
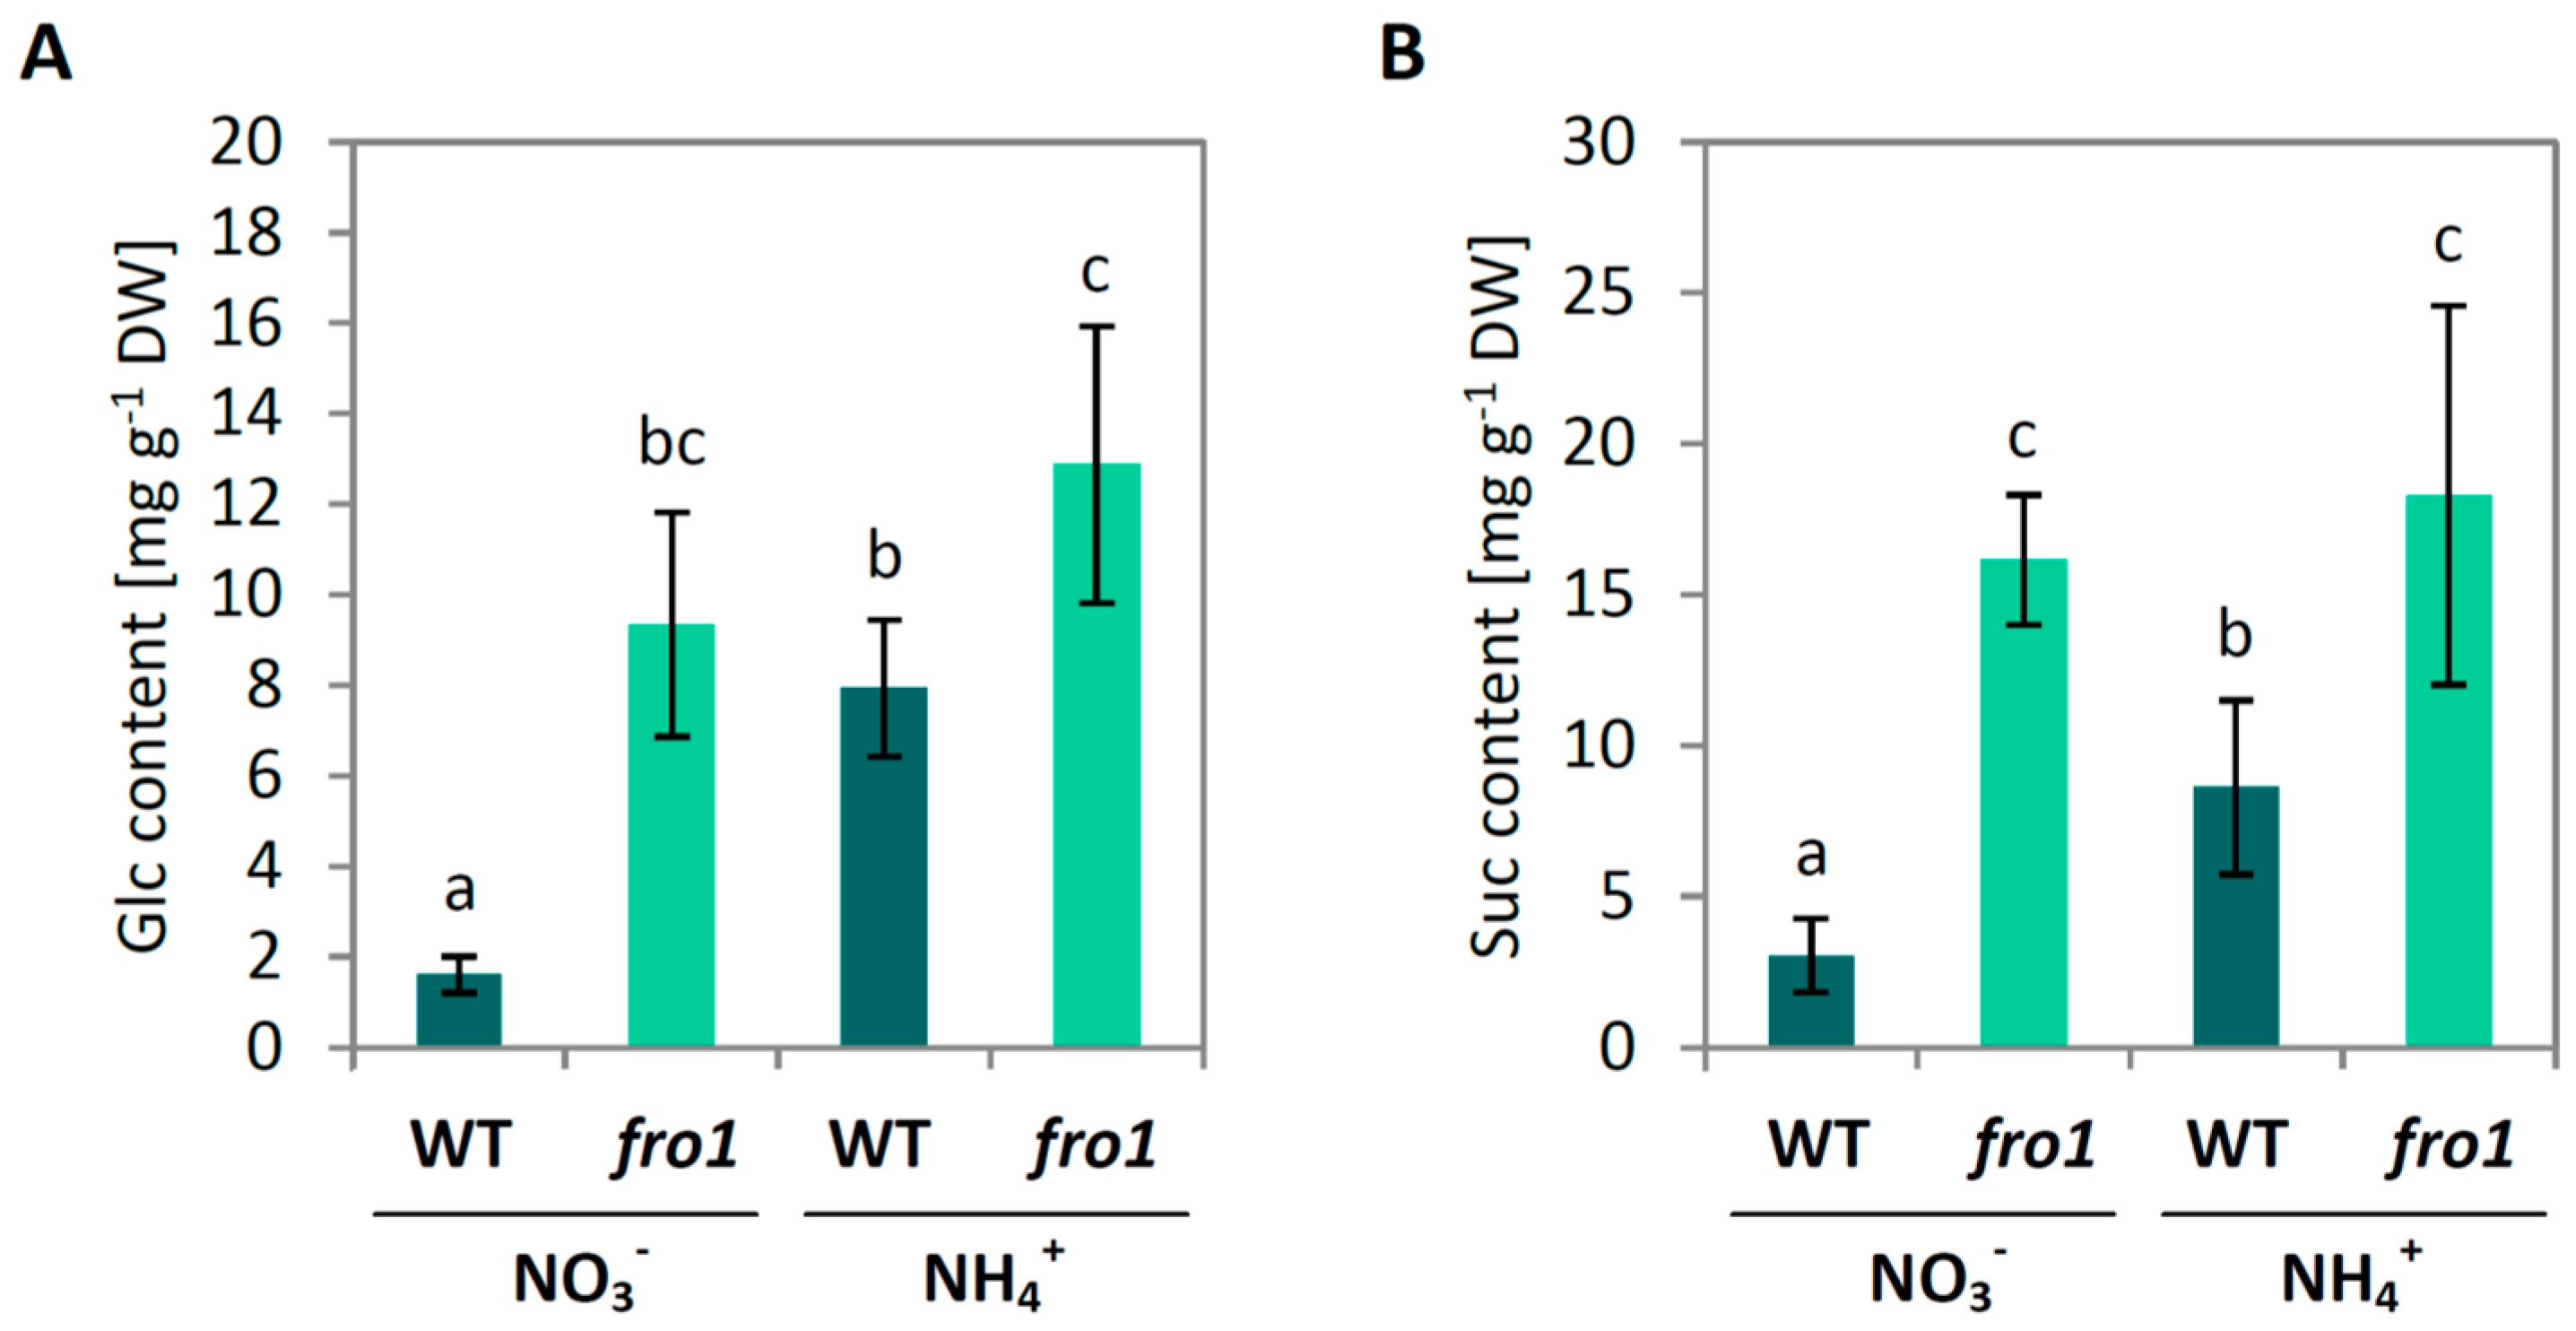
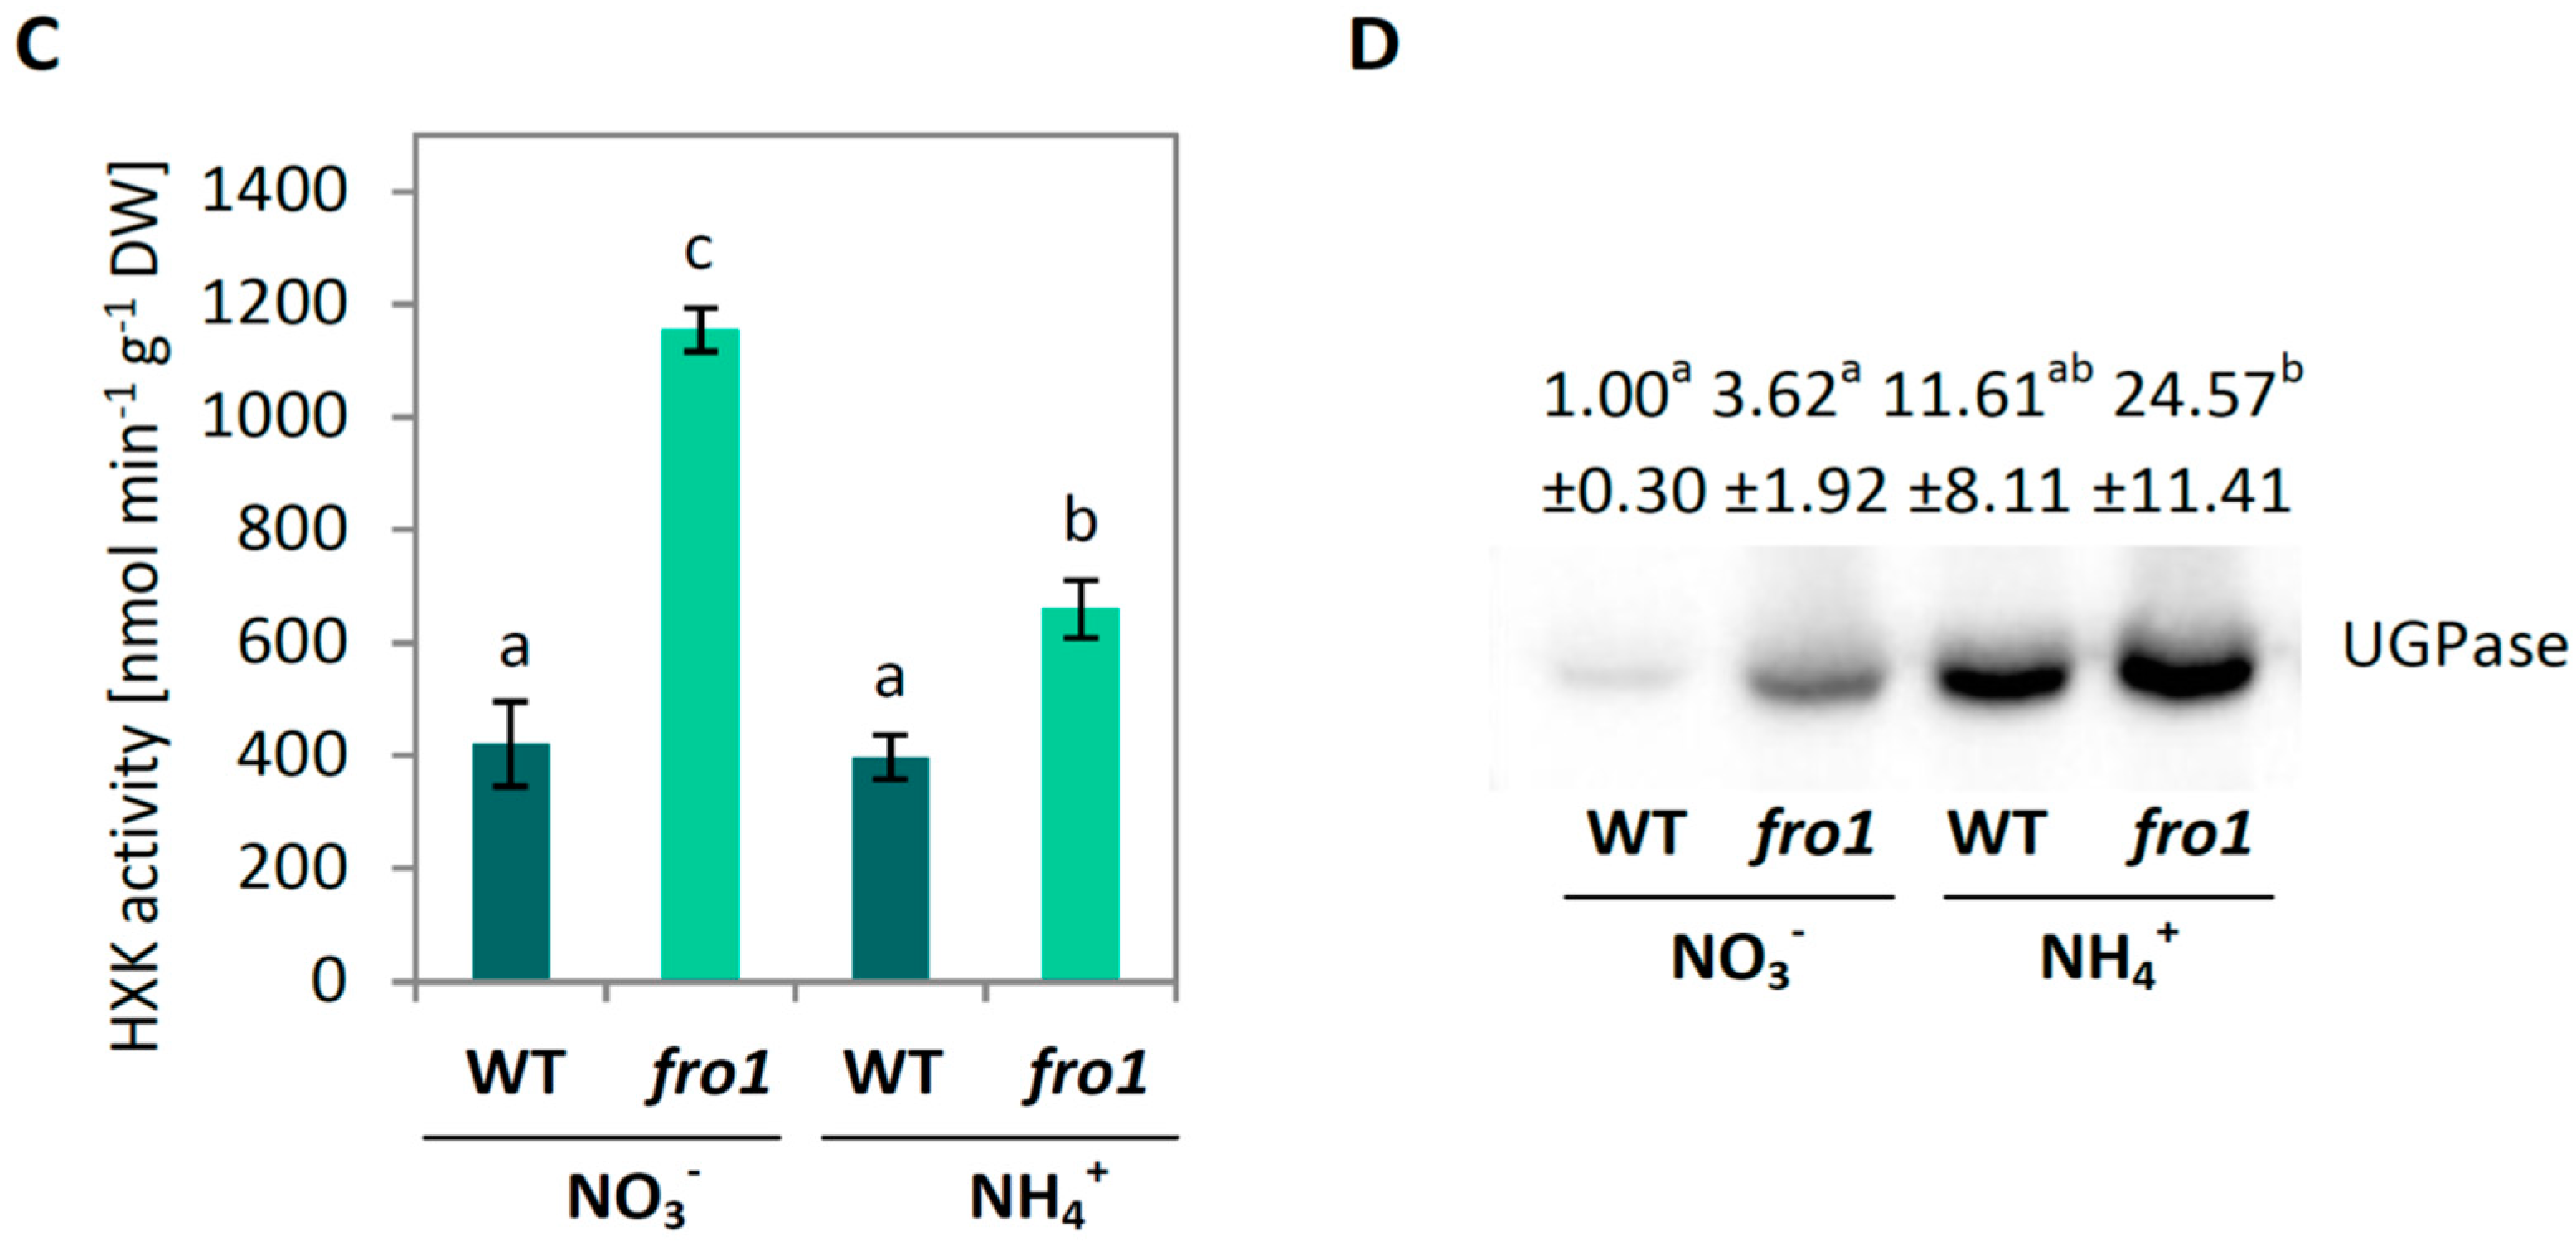
2.2. Sugar Metabolism in fro1

We investigated whether the changes brought about by disabled function of mtETC in fro1 are connected to changes in sugar metabolism. Fro1 plants showed higher sucrose (Suc) and glucose (Glc) contents in leaf tissue when cultured on NO3-containing medium as compared to WT plants. In contrast, growth on ammonium led to an increase in soluble sugar content in WT but not in fro1 plants (Figure 2A,B). Hexokinase (HXK) activity was almost 3 times higher in fro1 than in WT plants grown under NO3 conditions. On the other hand, it remained unchanged in WT plants under NH4+ treatment, while it decreased in fro1, although it was still higher than in WT plants (Figure 2C). Protein level of UDP-Glc pyrophosphorylase (UGPase) was not statistically different between fro1 and WT under control growth conditions but increased significantly more in fro1 as compared to WT plants under NH4+ treatment (Figure 2D and Figure S1).

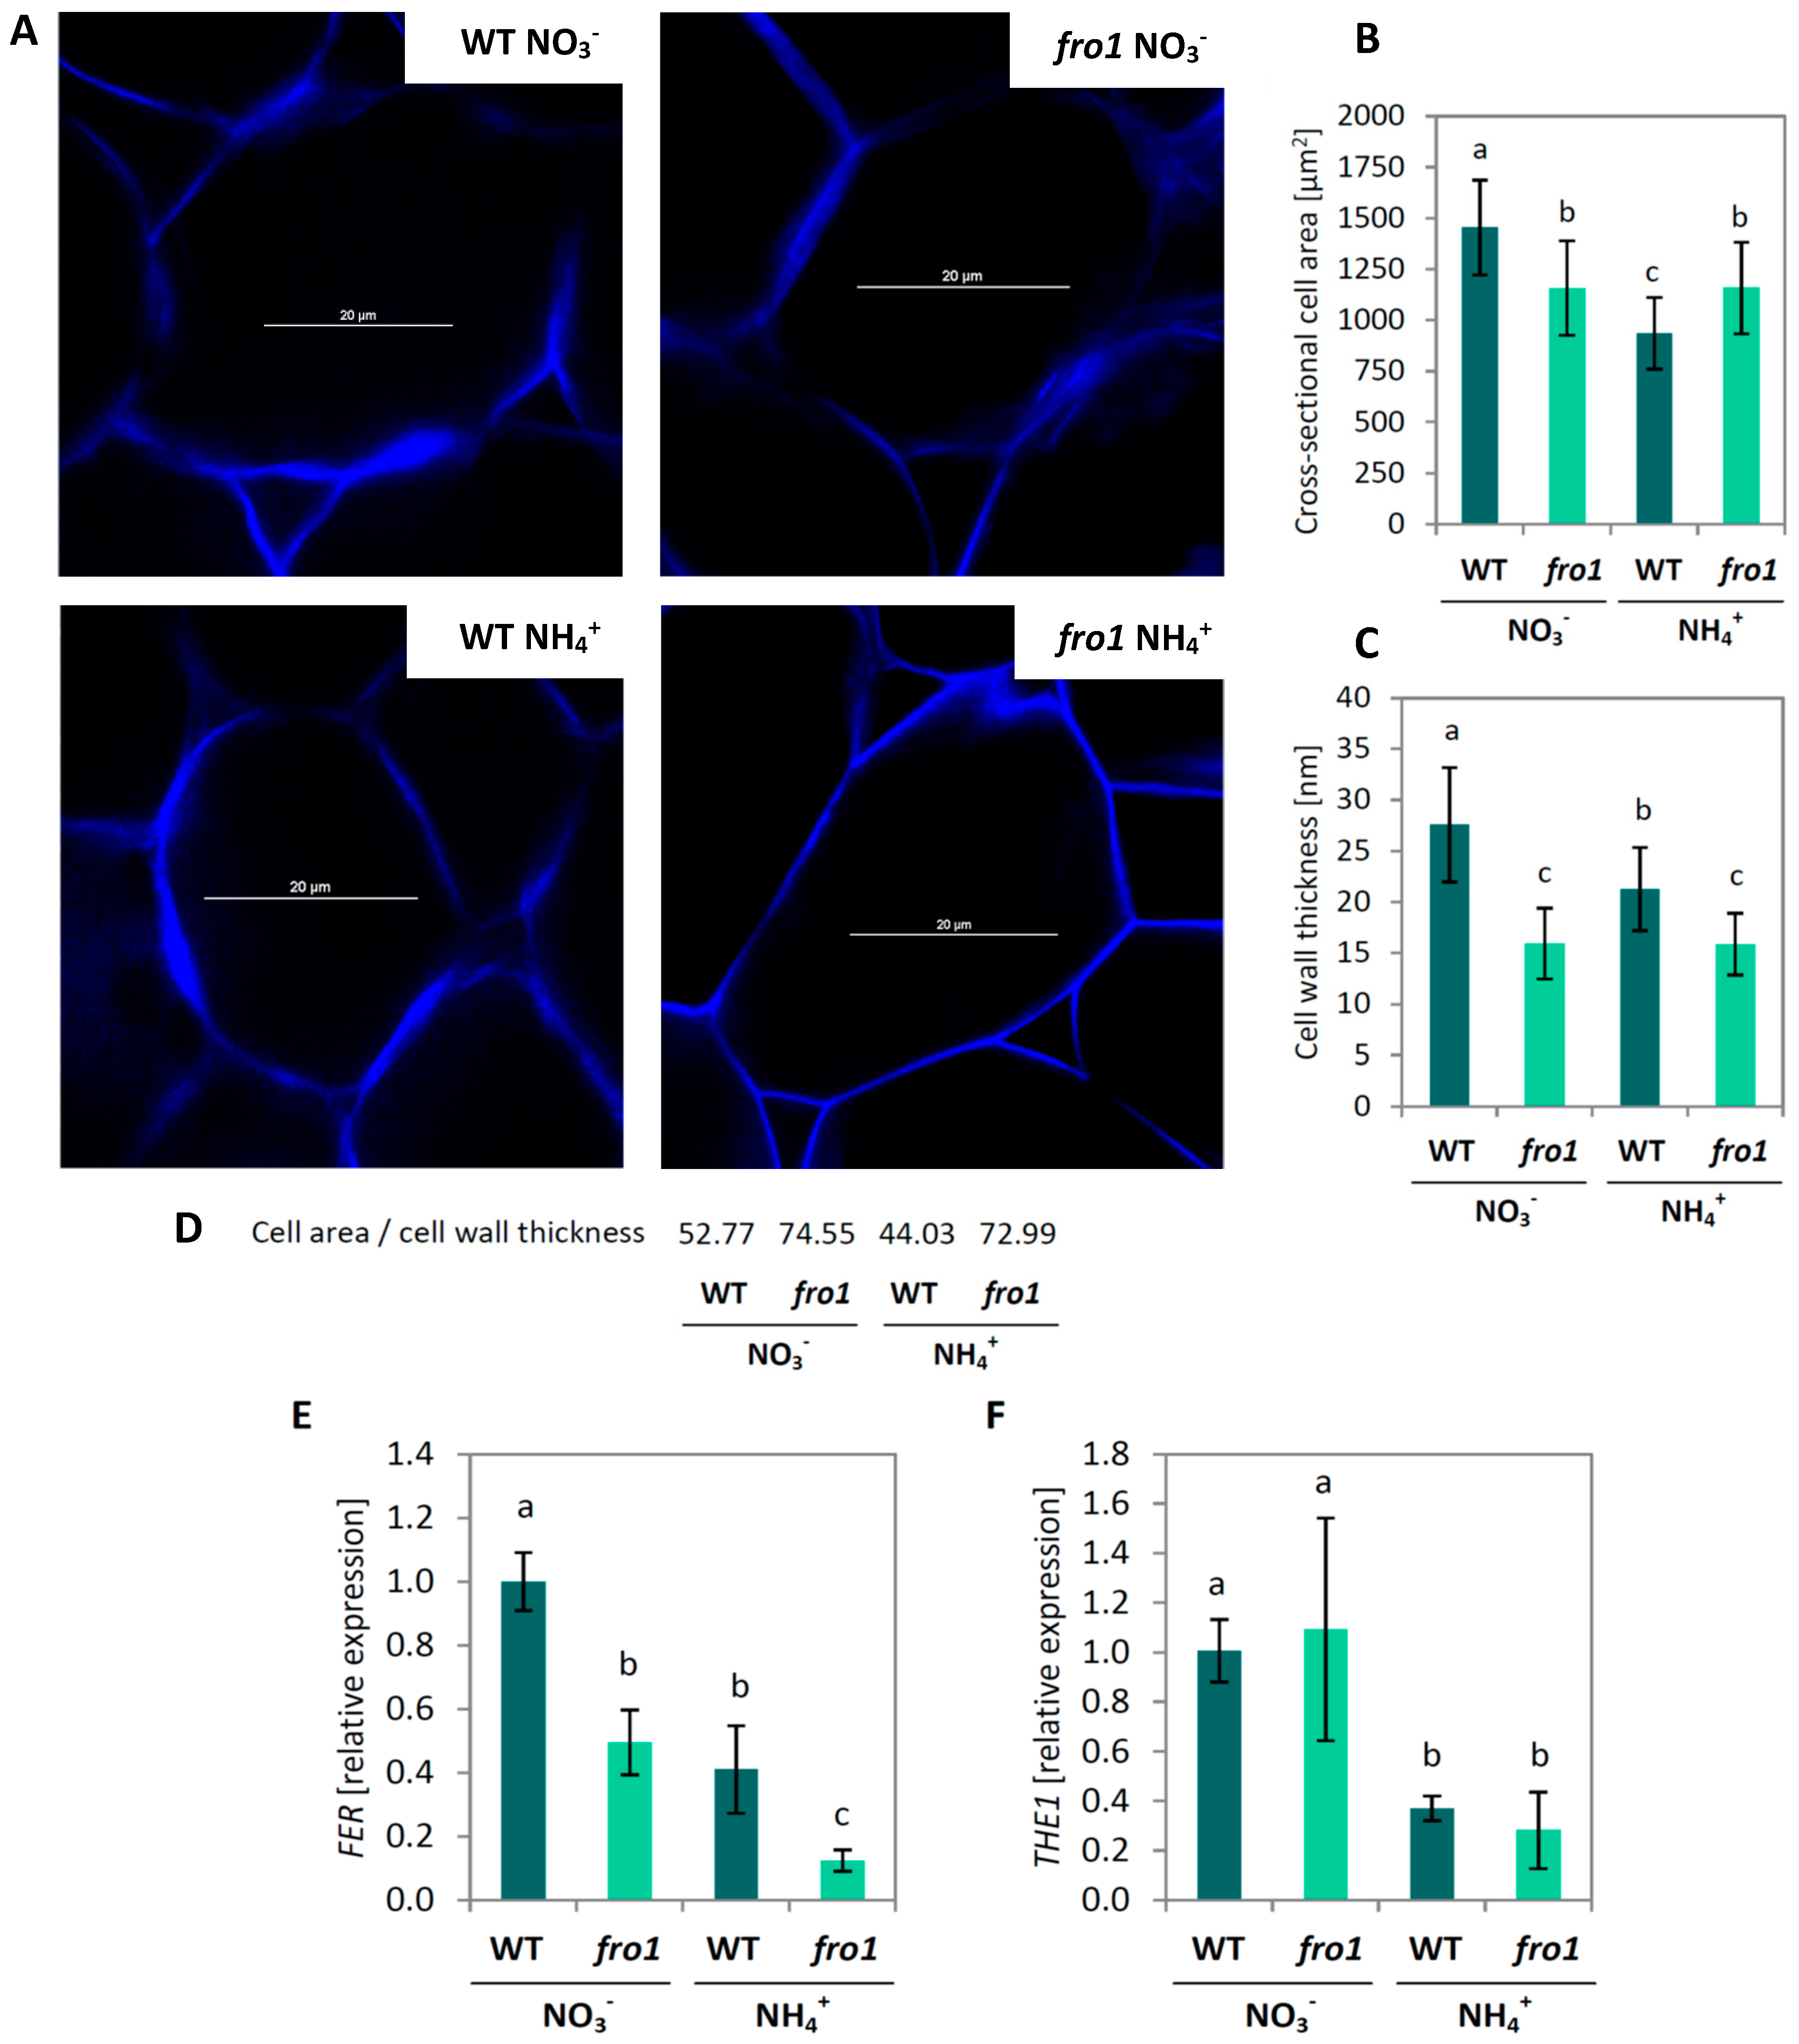
2.3. Analysis of Cell Size and Cell Wall Design in fro1

Cell wall in palisade cells was visualized using Calcofluor White staining (Figure 3A). As observed for changes in rosette size, fro1 showed a smaller cell size under NO3 nutrition than WT plants, as determined by the cross-sectional area of individual cells. Surprisingly, the cell area of fro1 plants remained unchanged under NH4+ nutrition, while in WT plants it decreased by 35% (Figure 3B). To better understand the growth rate of fro1 plants when cultured on NH4+, we analyzed cell wall properties. Cell wall thickness exhibited a similar trend as cell size (Figure 3C). However, the ratio of cell area to cell wall thickness was 40% higher in NO3-treated fro1 plants than in WT (Figure 3D). Ammonium nutrition led to its decrease only in WT plants, while in fro1, it was maintained at a similar level as under NO3 nutrition (Figure 3D). Further, the correlation of cell wall assembly and cell wall sensing receptor-like kinases was determined [59]. Expression of Feronia (FER, AT3G51550), which is thought to be associated with cell wall-dependent regulation of cell elongation, was lower in fro1 than in WT plants, while NH4+ treatment lowered the expression in both genotypes significantly (Figure 3E). The expression of Thesseus1 (THE1, AT5G54380), a cell wall integrity sensor-kinase, was similar in fro1, as compared to WT plants under NO3 nutrition, but it decreased about 70% during the NH4+ growth-regime in both genotypes (Figure 3F).

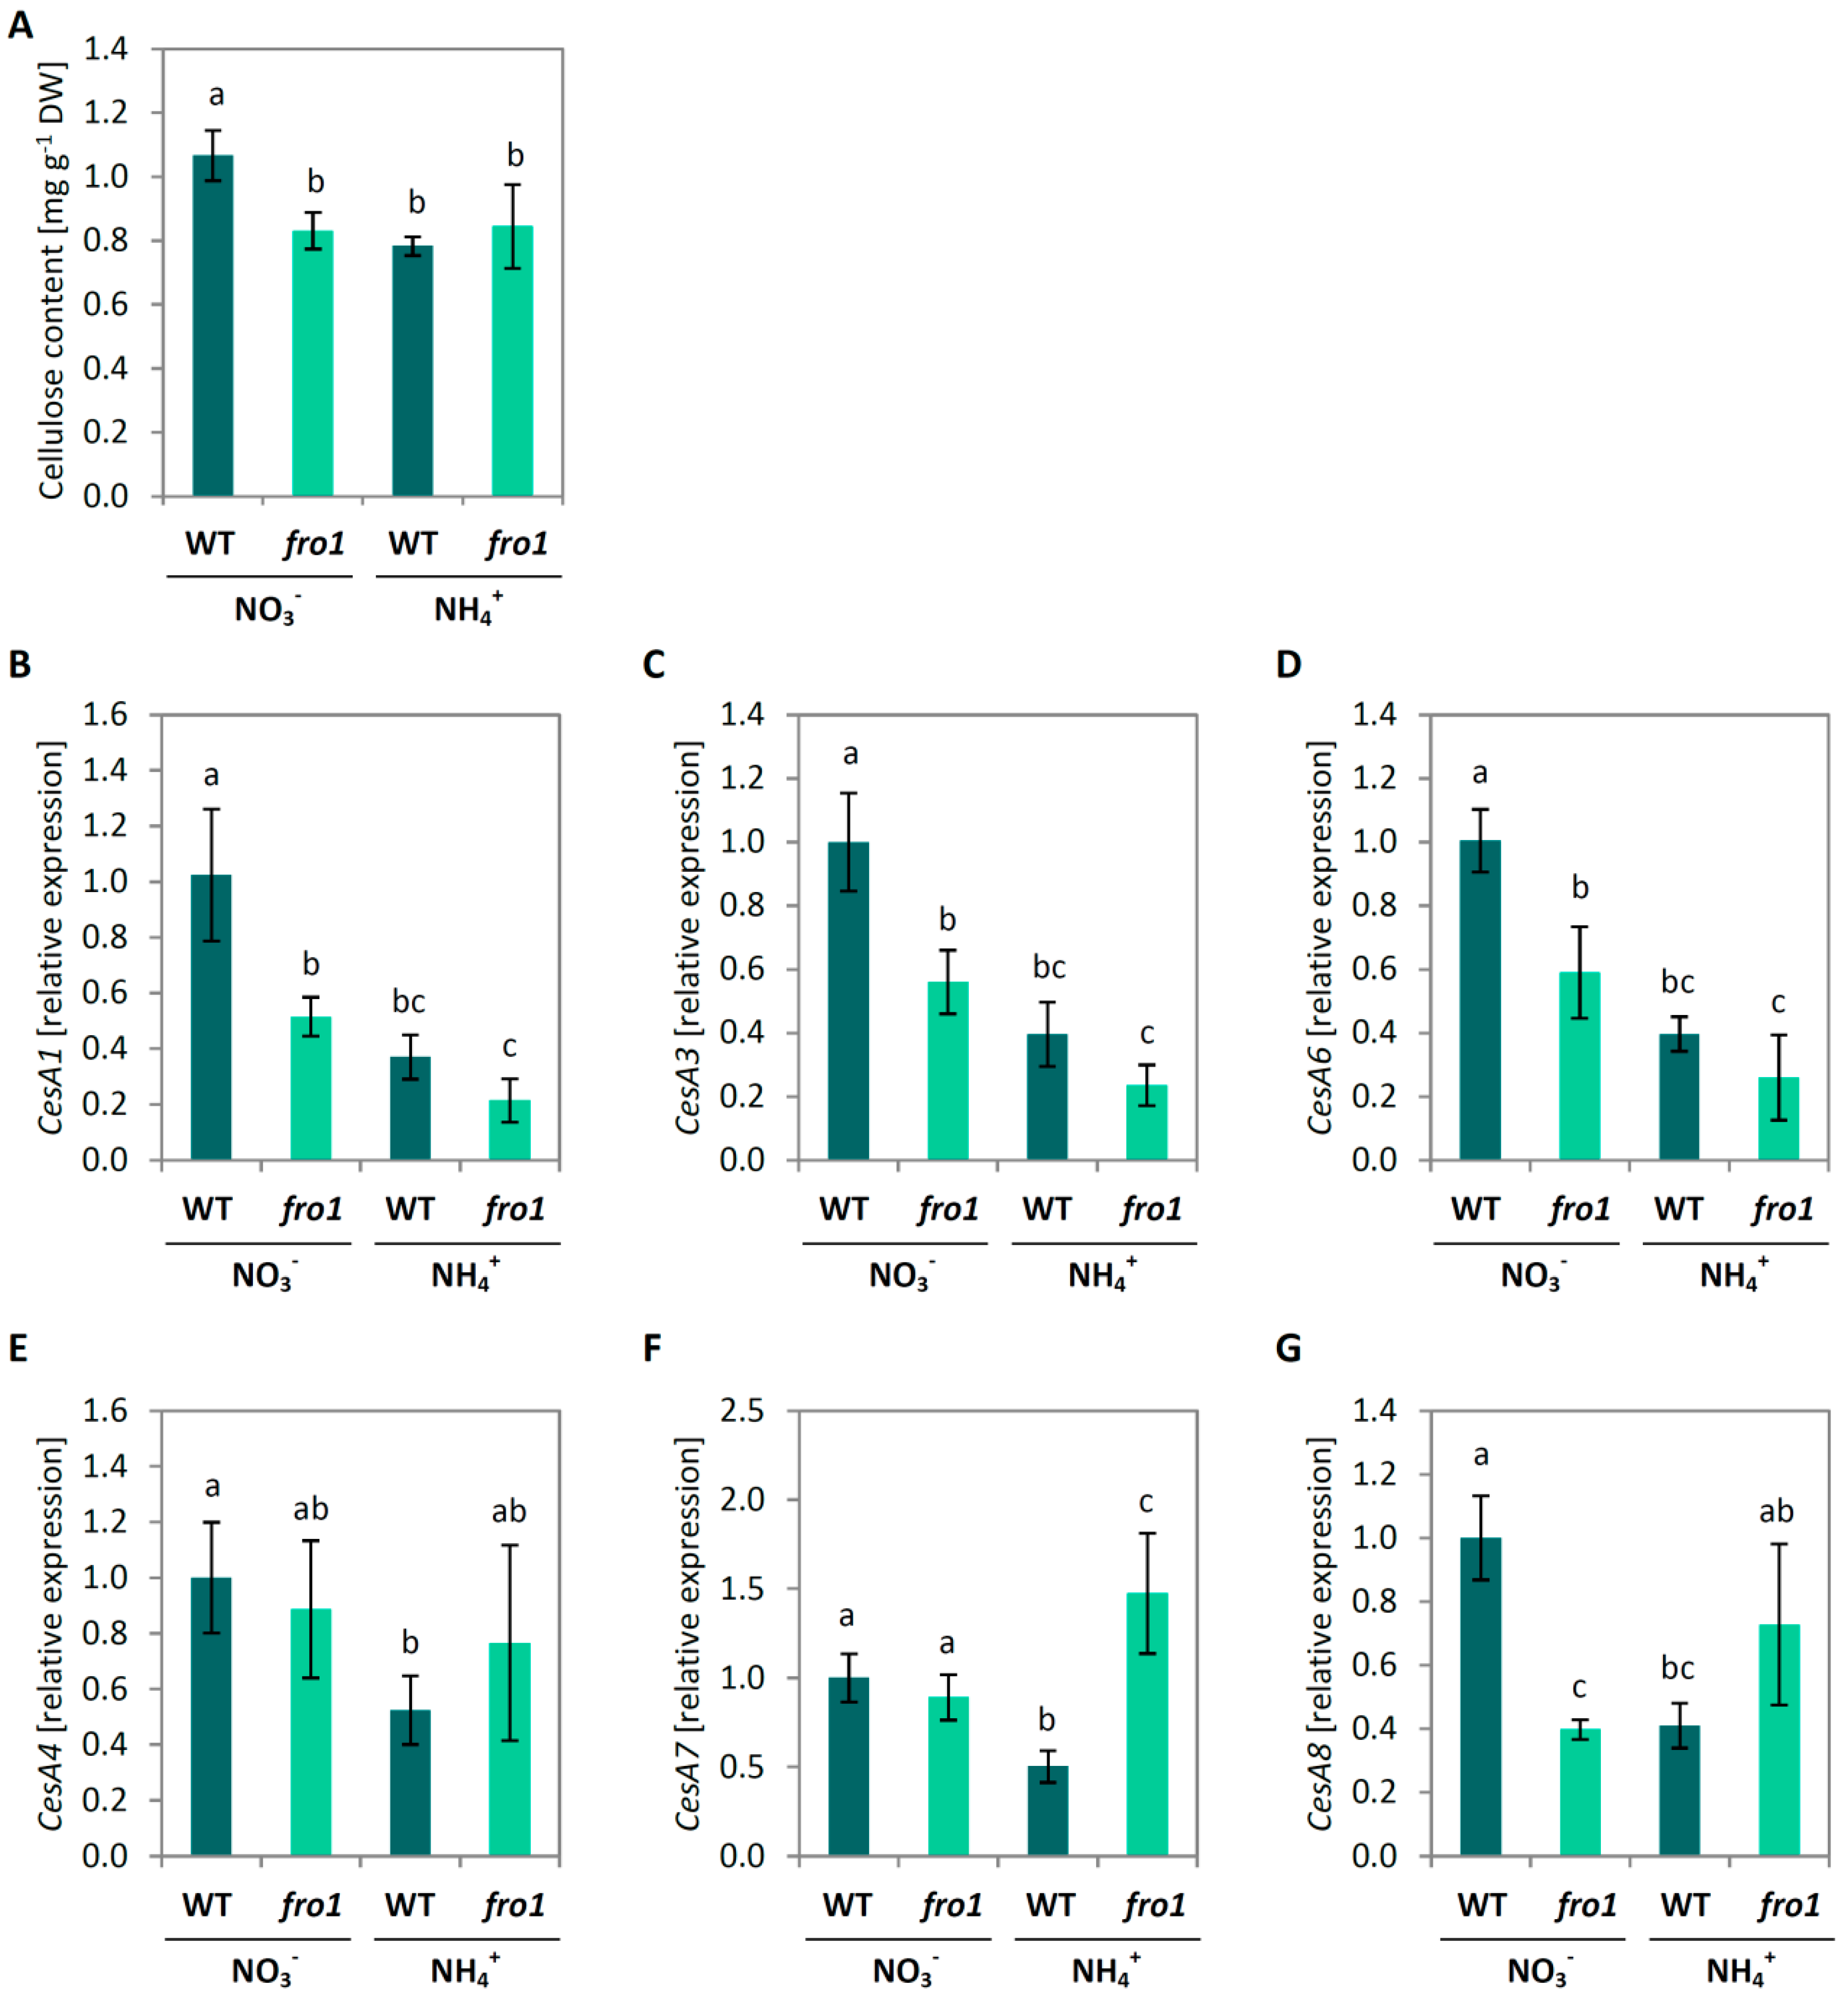
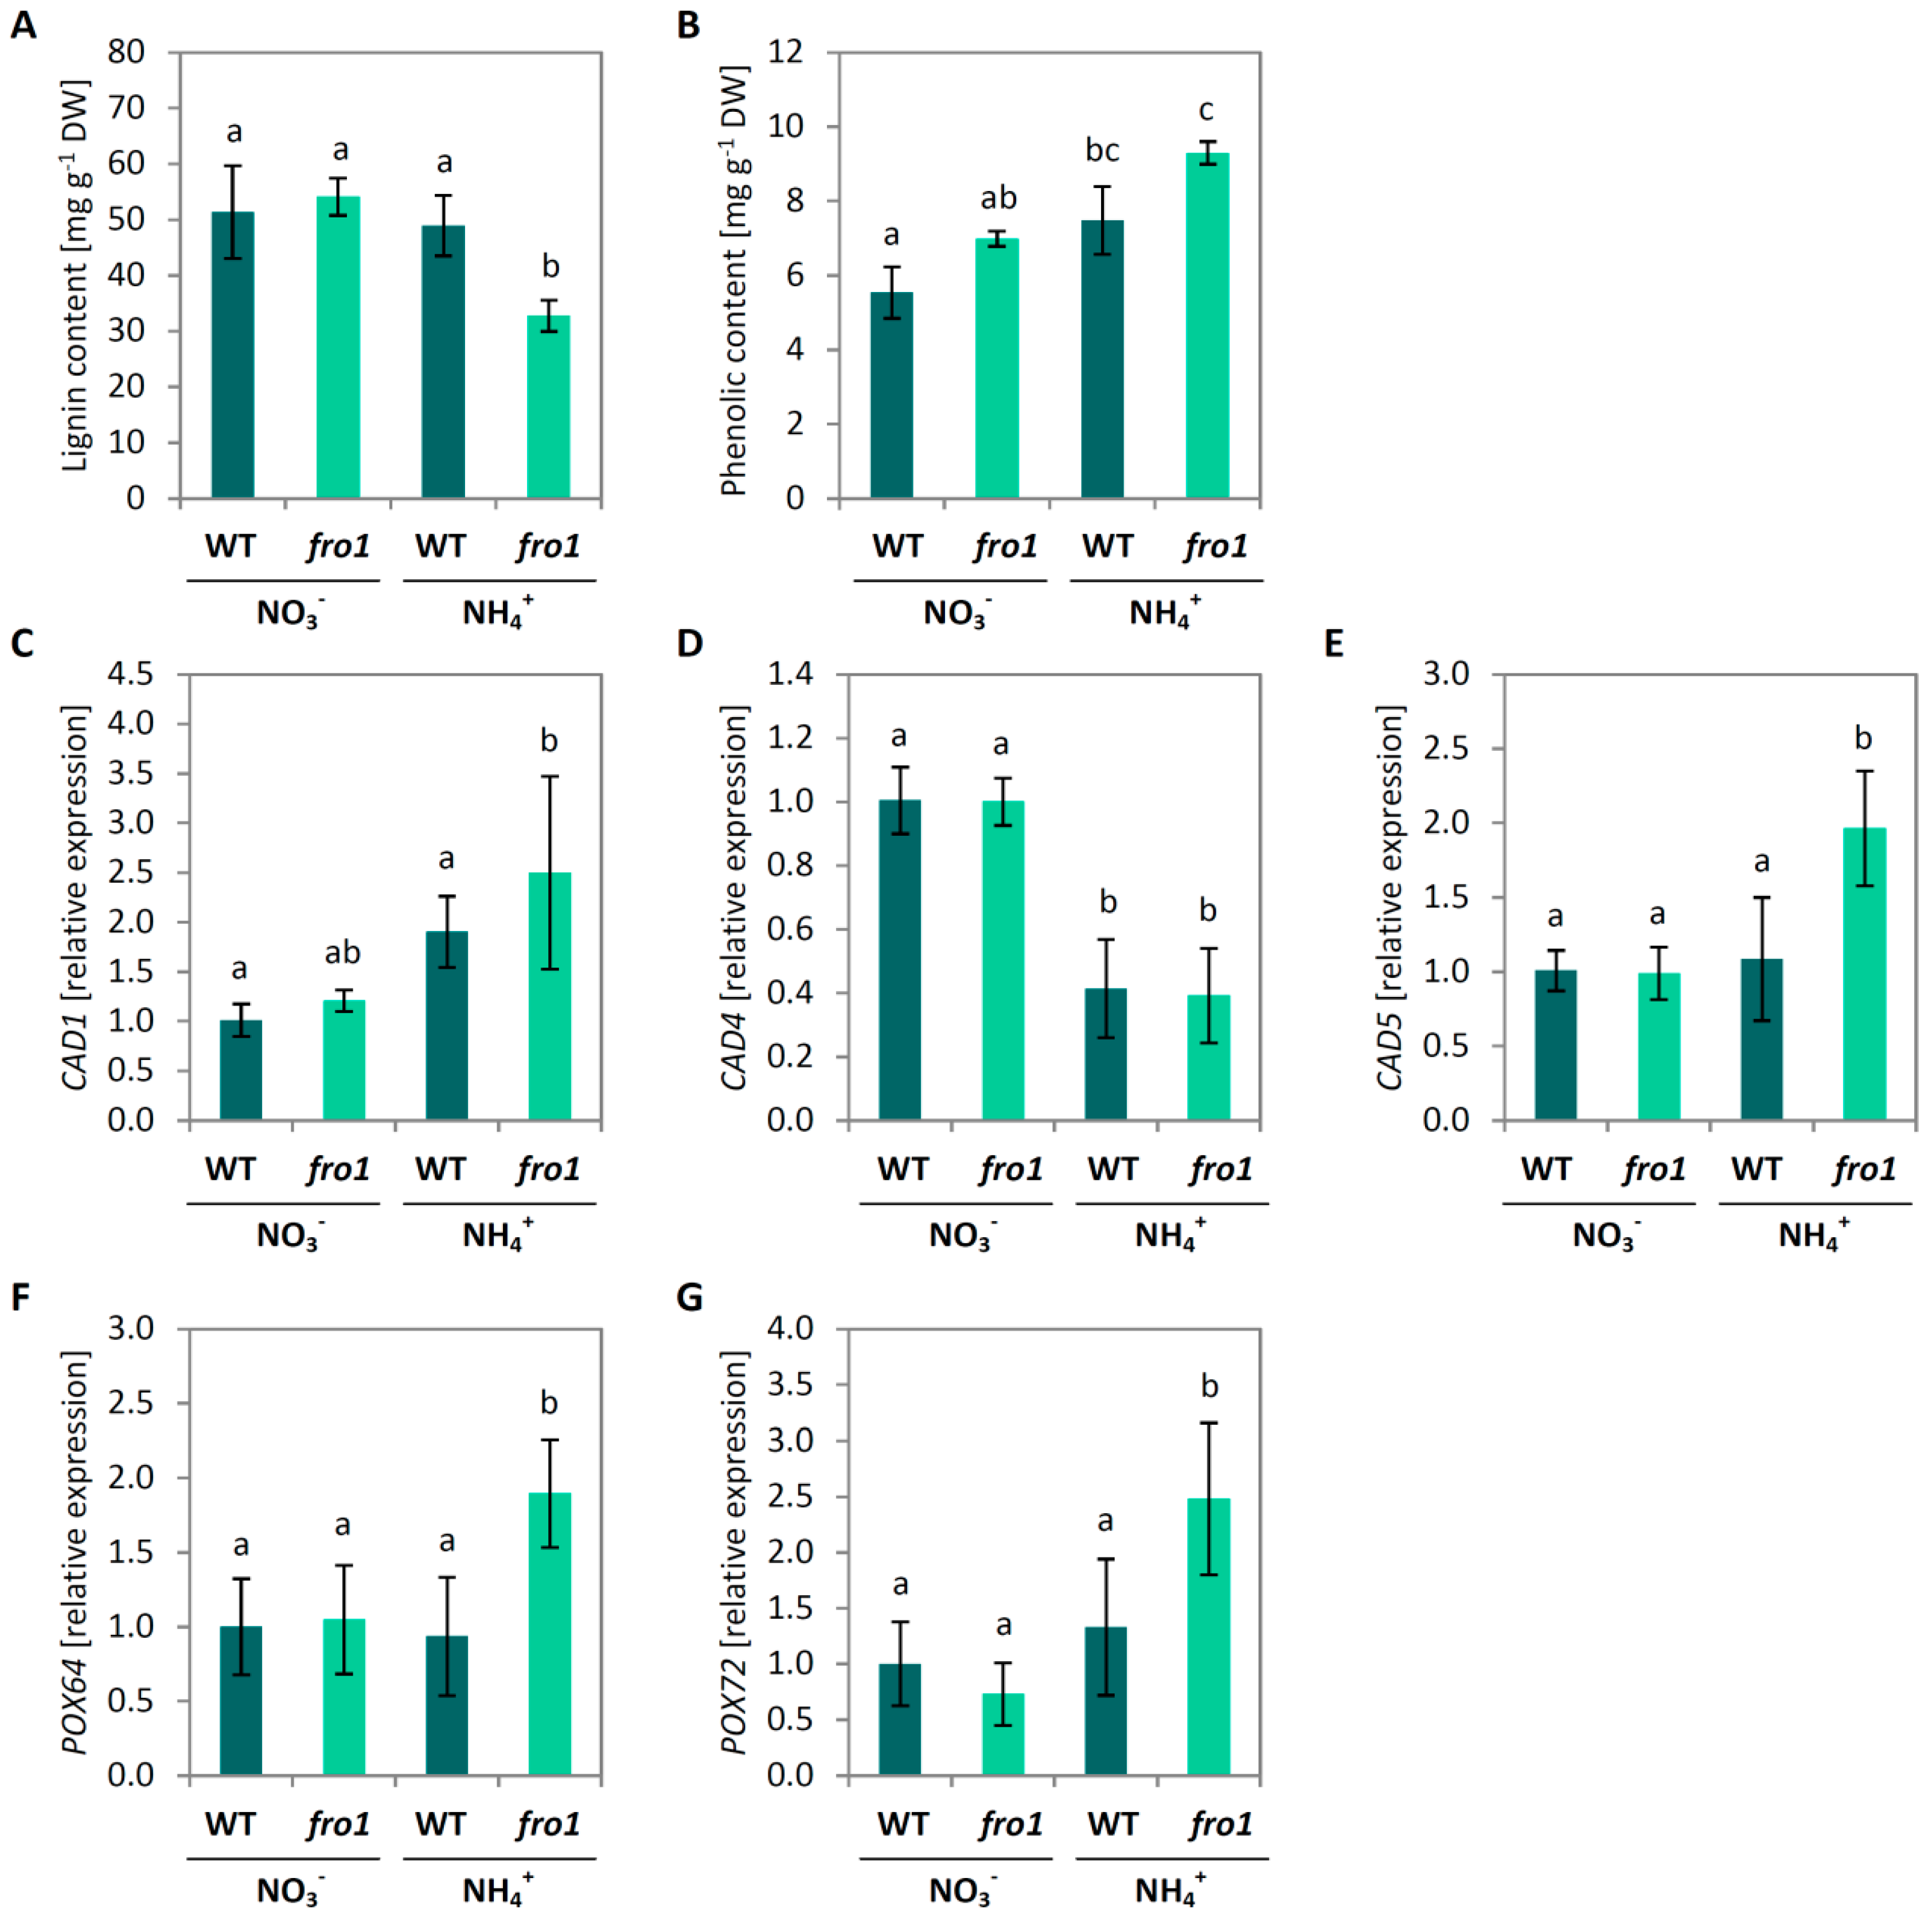
2.4. Cell Wall Composition in fro1

The analysis of cell wall building components showed decreased cellulose incorporation in cell walls of fro1, compared to WT plants during NO3 feeding (Figure 4A). However, NH4+ nutrition did not affect the cellulose content in fro1 in contrast to WT plants, which exhibited a decrease in its level (Figure 4A). To explain those differences between genotypes, the expression of selected cellulose synthase (CesA) genes was examined. The genes CesA1 (AT4G32410), CesA3 (AT5G05170), and CesA6 (AT5G64740) are specifically involved in cellulose synthesis during primary wall formation, while CesA4 (AT5G44030), CesA7 (AT5G17420), and CesA8 (AT4G18780) are involved in cellulose synthesis during secondary cell wall assembly [60]. The expression of all analyzed genes associated with cellulose synthesis in primary cell walls exhibited a similar pattern. CesA1, CesA3, and CesA6 relative transcript level was about 50% lower in fro1 than in WT plants under NO3 nutrition; further, the treatment of plants with NH4+ led to decreases (by approx. 50%) in expression of these genes in both genotypes (Figure 4B–D). Transcript level of CesA4 and CesA7 was similar in fro1 plants, while CesA8 was about 60% lower than in WT plants during NO3 nutrition (Figure 4E–G). All genes were down-regulated in WT plants in response to NH4+ nutrition, in contrast to NH4+-treated fro1, in which their expression was up-regulated, except for the gene CesA4 whose expression remained similar to that under NO3 growth conditions (Figure 4B–D).
Lignin, a highly cross-linked polymer, is formed to support the structure of the secondary cell wall in plants. The content of lignin in cell walls was similar in fro1 and WT plants. Ammonium nutrition lowered lignification of cell walls in fro1 plants but it did not influence lignin level in WT plants (Figure 5A). As lignin is composed of phenolic polymers, we analyzed total content of phenolics in the cell wall, and found it was higher in fro1, compared to WT plants under NO3 nutrition. Ammonium nutrition caused further increase in phenolic levels in plants (Figure 5B). Primary genes involved in lignin biosynthesis are cinnamyl alcohol dehydrogenase genes (CAD) CAD1 (AT1G72680), CAD4 (AT3G19450), and CAD5 (AT4G34230) [61]. The fro1 mutant did not show significant changes in the expression of any of the analyzed CAD genes as compared to WT under the NO3 growth regime (Figure 6C–E). In response to NH4+ nutrition, CAD4 expression was inhibited by more than 50% in both genotypes, while CAD1 and CAD5 was up-regulated only in fro1 plants (Figure 5C–E). Further, we analyzed the expression patterns of cell wall peroxidases (POX) related to cell wall lignification. The transcript level of POX64 (AT5G42180) and POX72 (AT5G66390) was unchanged between fro1 and WT plants during NO3 nutrition, but it showed an increase in fro1 in response to NH4+ treatment (Figure 5F,G).

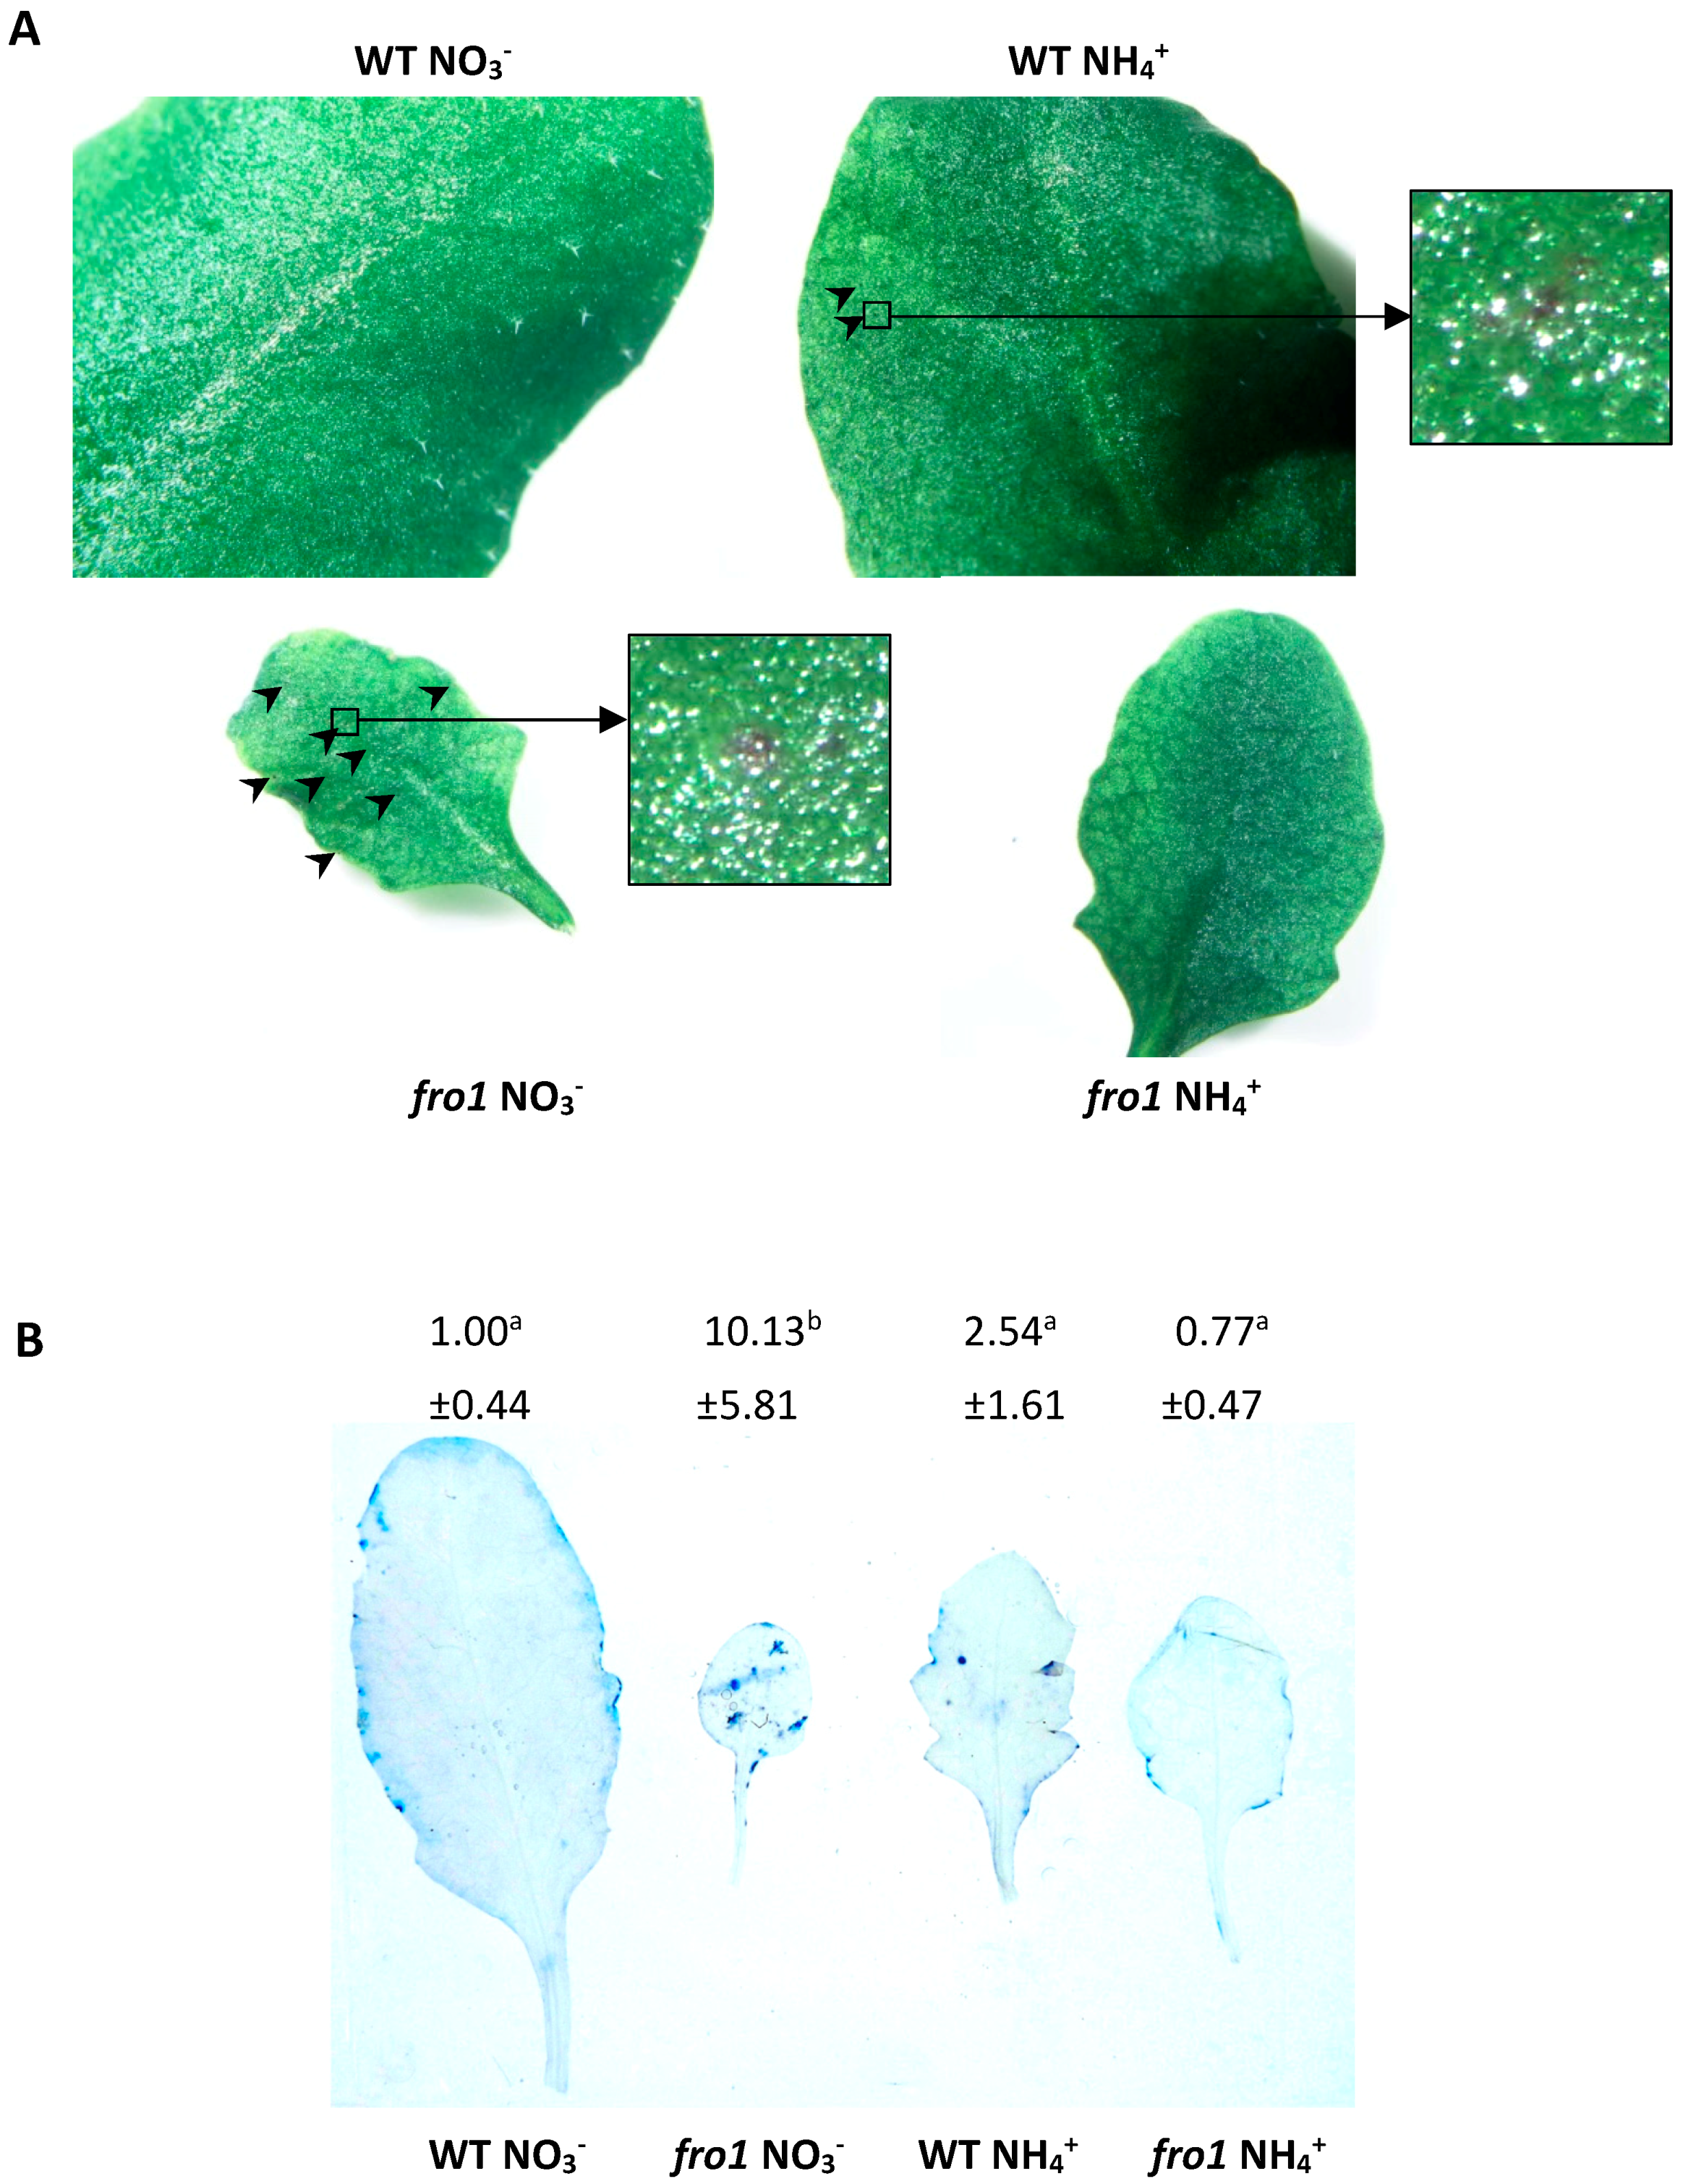
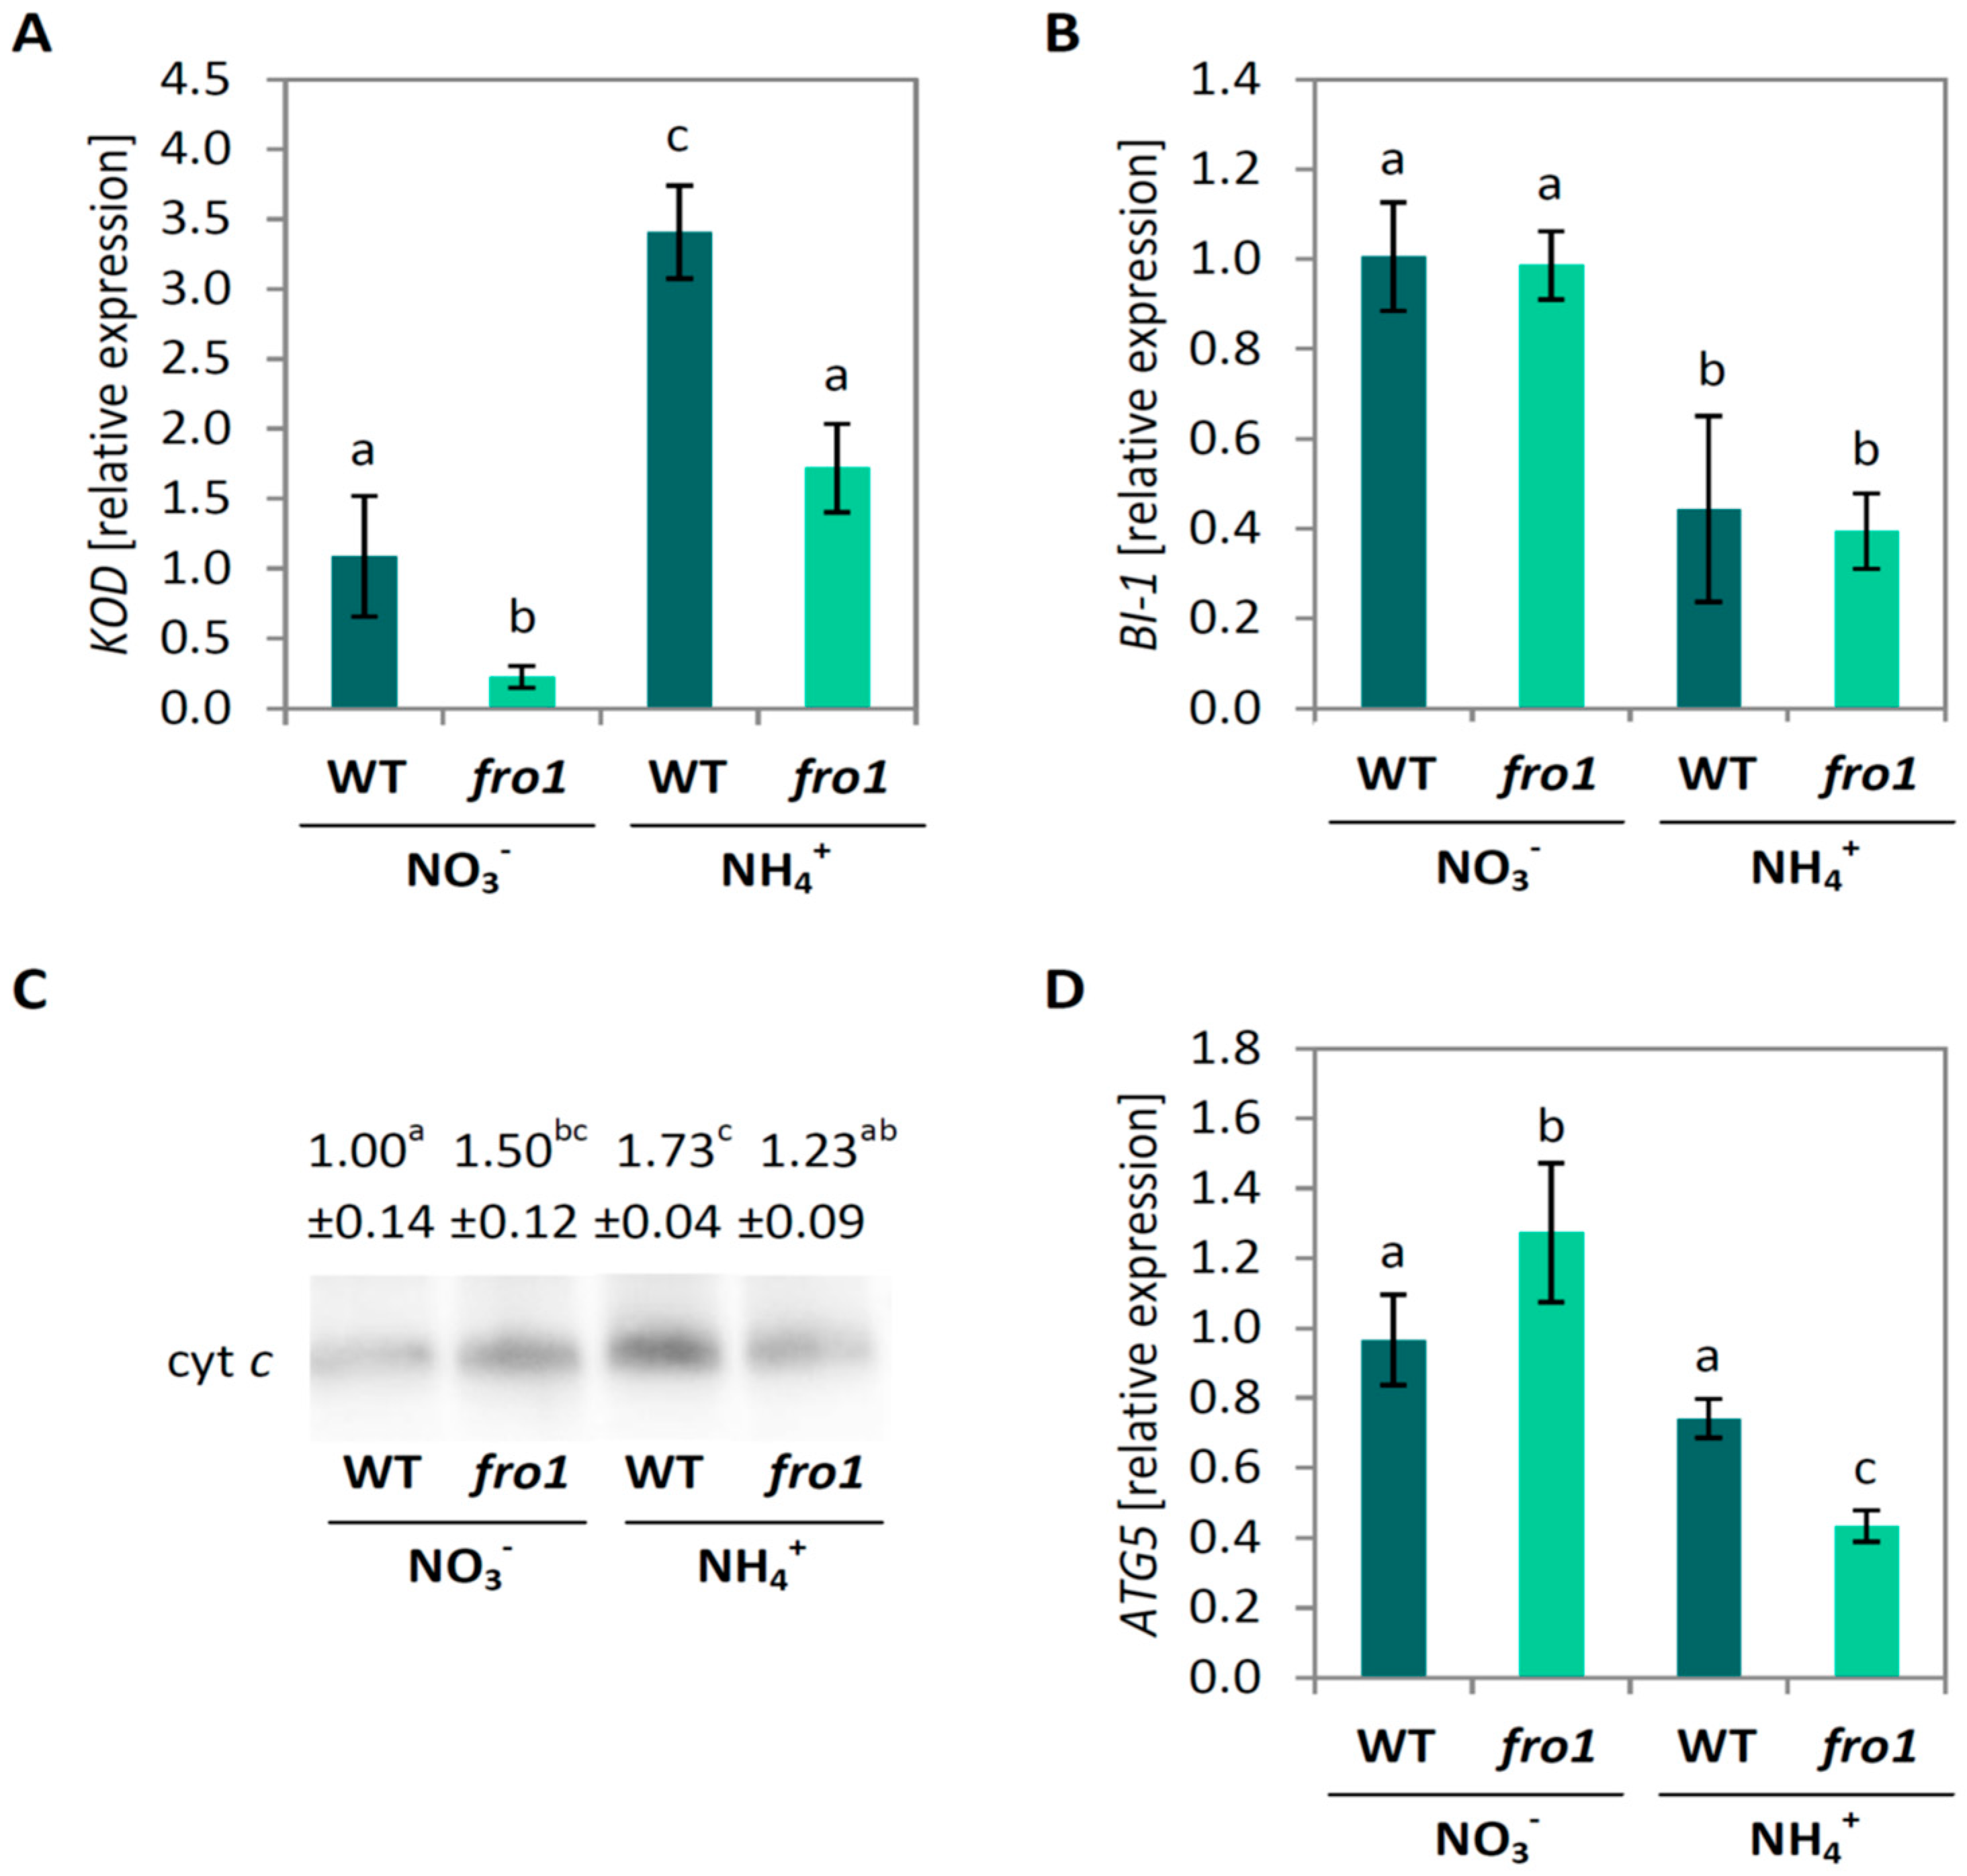
2.5. Analysis of Programmed Cell Death Markers in fro1

Visual examination of leaf blades of fro1 or WT plants revealed the N source-dependent presence of lesions. In WT plants, ammonium caused emergence of few lesions. Conversely, in the case of fro1 plants, lesions appeared in NO3-supplied mutants and were absent in NH4+-treated plants (Figure 6A and Figure S3). Furthermore, trypan blue staining of leaves was performed to specifically indicate necrotic areas. Characteristic blue spot appearance on leaves revealed strong development of necrotic areas on leaves of fro1 when grown on NO3 (Figure 6B and Figure S4), while NH4+ nutrition induced the occurrence of some necrotic areas in WT plants, which could mostly not be identified in NH4+-grown fro1.
The marker gene for PCD called Kiss-of-death (KOD) [62] showed a lower expression in fro1 plants under NO3 nutrition and was up-regulated by NH4+ treatment in both genotypes (Figure 7A). At the same time, down-regulation of expression of Bax inhibitor 1 (BI-1) (AT5G47120) under NH4+ nutrition was observed in both genotypes. The expression of BI-1 was not changed in response to mtETC dysfunction (Figure 7B). Expression of the autophagy-related gene ATG5 was induced in fro1 during NO3 nutrition as compared to WT. While the expression was unchanged in response to the NH4+ treatment in WT plants, in fro1 the transcript level was approximately 60% lower (Figure 7D). Additionally, fro1 plants showed 50% higher cytochrome c (cyt c) levels than WT under NO3 conditions. Similar to previous observations in WT Arabidopsis thaliana [63], NH4+ nutrition led to approximately 70% higher cyt c level. The NH4+ treatment had no influence on cyt c level in fro1 plants in our experiments (Figure 7C and Figure S2).

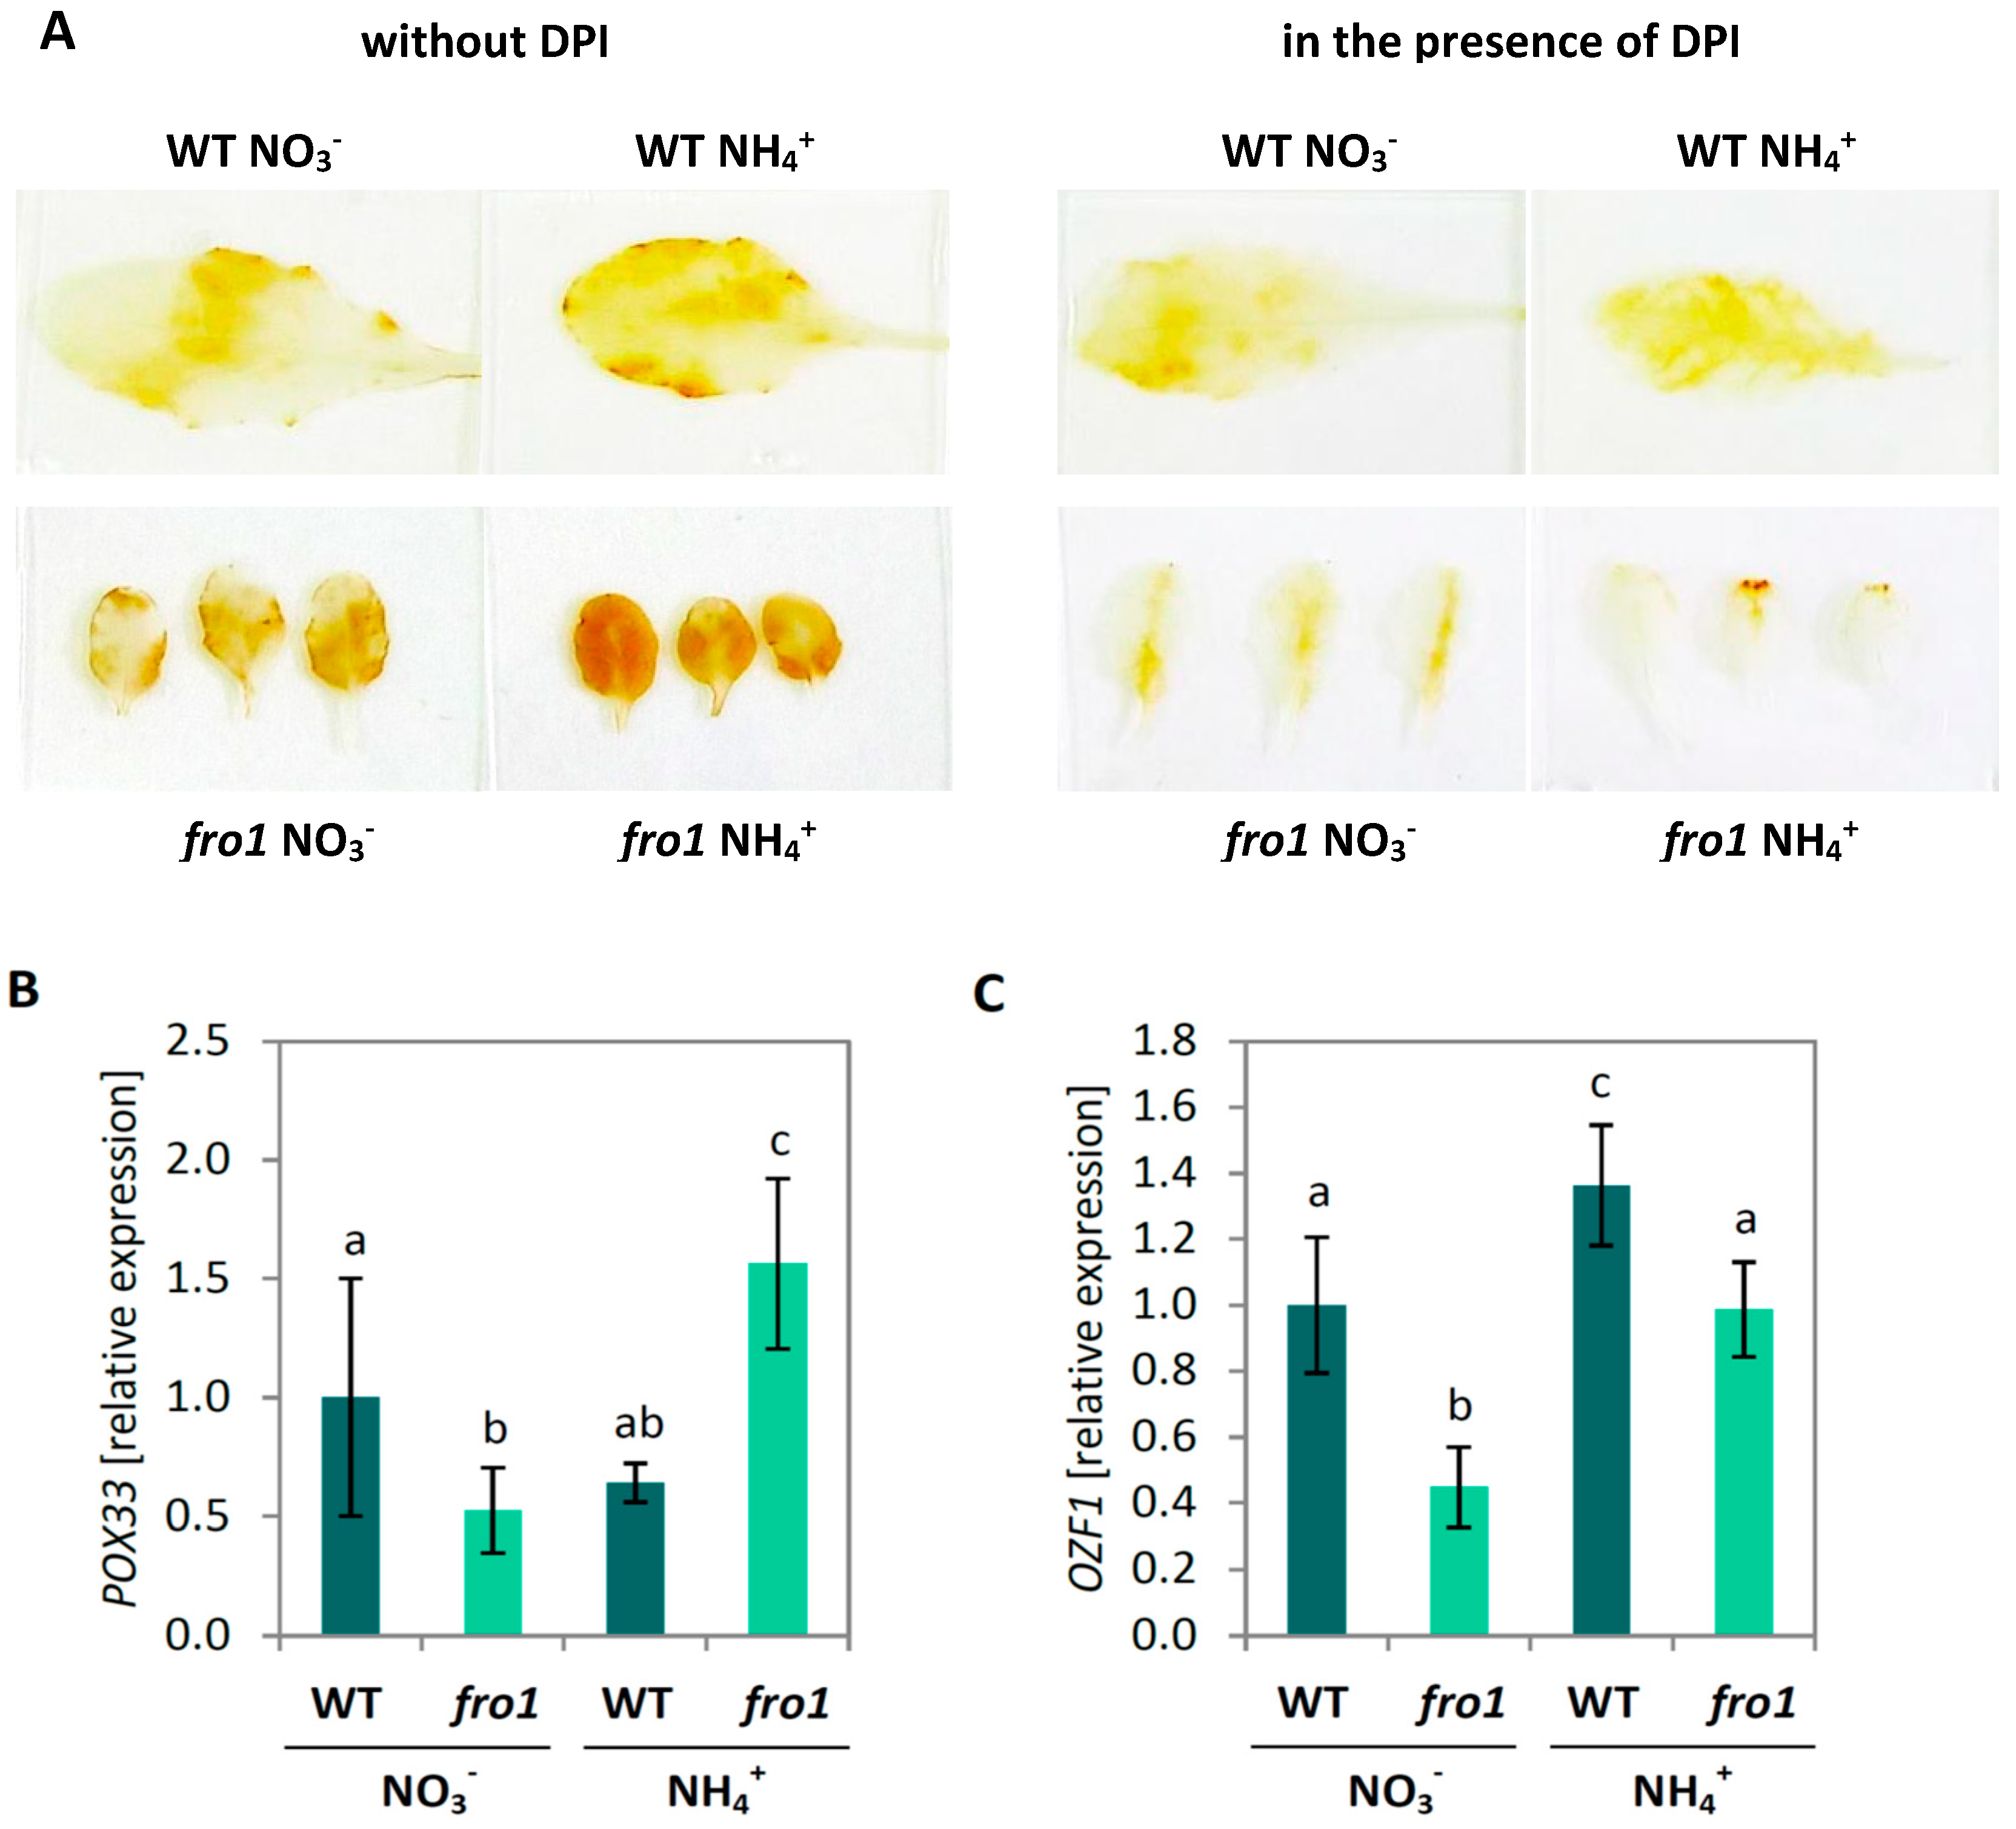
2.6. Reactive Oxygen Species Localization in fro1

Hydrogen peroxide (H2O2) levels in plant tissues were visualized in situ via 3,3′-diaminobenzidine (DAB) staining. Brownish yellow color development in leaves of fro1 was slightly more intense than in WT when grown on NO3 as nitrogen source (Figure 8A). WT plants showed stronger coloration under NH4+ treatment, but fro1 developed the most intense staining among all the analyzed leaves. The acute staining intensity implies that these plants had the highest H2O2 level in leaf tissues. Analysis of the presence of H2O2 in leaf tissues by DAB staining was performed simultaneously with a respiratory burst oxidase homolog (RBOH) and POX inhibitor diphenylene iodonium chloride (DPI) to eliminate apoplastic-generated ROS contents during the staining procedure. Color development in fro1 leaves incubated with DPI was less intense than in WT plants under NO3 nutrition (Figure 8A). On the other hand, under NH4+ nutrition, DAB staining in DPI-treated WT plants showed slightly reduced coloring, while the least coloration by DPI treatment was found in fro1. The difference in DAB staining with and without DPI enables the estimation of the amount of ROS accumulated in the apoplastic space. Results indicated that significant H2O2 accumulation in the apoplast was associated with NH4+ treatment, especially in fro1 leaf cells (Figure 8A).
Next, we examined the expression of genes related to extracellular ROS metabolism. The expression of peroxidase 33 (POX33, AT3G49110), one of the POXs responsible for apoplastic ROS production, was slightly down-regulated in fro1 plants, as compared to NO3-treated WT plants. Ammonium nutrition induced POX33 expression only in fro1 plants (Figure 8B). Further, transcript level of oxidation-related zinc finger 1 (OZF1, AT2G19810), a plasma membrane protein involved in oxidative stress [64], was lower in fro1 plants compared to WT under NO3 treatment, but was stimulated in both genotypes under NH4+ supply (Figure 8C).

2.7. Changes in Mitochondria-Related Signaling in fro1

We determined transcript levels for marker genes of sugar signaling and retrograde signaling. First, we analyzed the expression of hexokinase 1 (HXK1), which is associated with the mitochondria, acts as a sugar sensor, and may regulate Glc-dependent gene expression [65]. Expression of HXK1 in fro1 mutants was similar to that in NO3-supplied WT plants, regardless of the nitrogen source on which the mutants were grown (Figure 9A). Transcript level of HXK1 decreased in WT plants when grown on NH4+. The expression of sucrose non-fermenting 1–related kinase 1 (SnRK1.1, AT3G01090), involved in sugar signaling pathways that responds to the availability of carbohydrates [66] was lower in fro1 plants compared to WT under NO3 conditions. Ammonium nutrition led to a decrease in SnRK1.1 transcript level in both genotypes (Figure 9B).

3. Discussion

A major challenge for complex I mutant plants is to retain high energy levels required for maintenance and biosynthetic reactions. Accordingly, the complex I defect in fro1 is associated with decreased biomass production in plants (Figure 1). In order to prevent the stunted growth phenotype, fro1 plants strive to maintain constantly high ATP levels. In this regard, altered sugar catabolism might, to some extent, counteract the energy deficiency. The higher Suc and Glc (Figure 2A,B) contents in fro1 plants may be used to produce energy in substrate-level phosphorylation, which confirms, for example, increased HXK activity (Figure 2C). In addition, NAD(P)H produced in the glycolytic pathway is channeled toward up-regulated type II dehydrogenases [47] to generate ATP in oxidative phosphorylation. Nevertheless, the lower ratio of ATP to ADP in fro1 plants indicates that these plants cannot fully restore the energy-deficient status of cells [47].

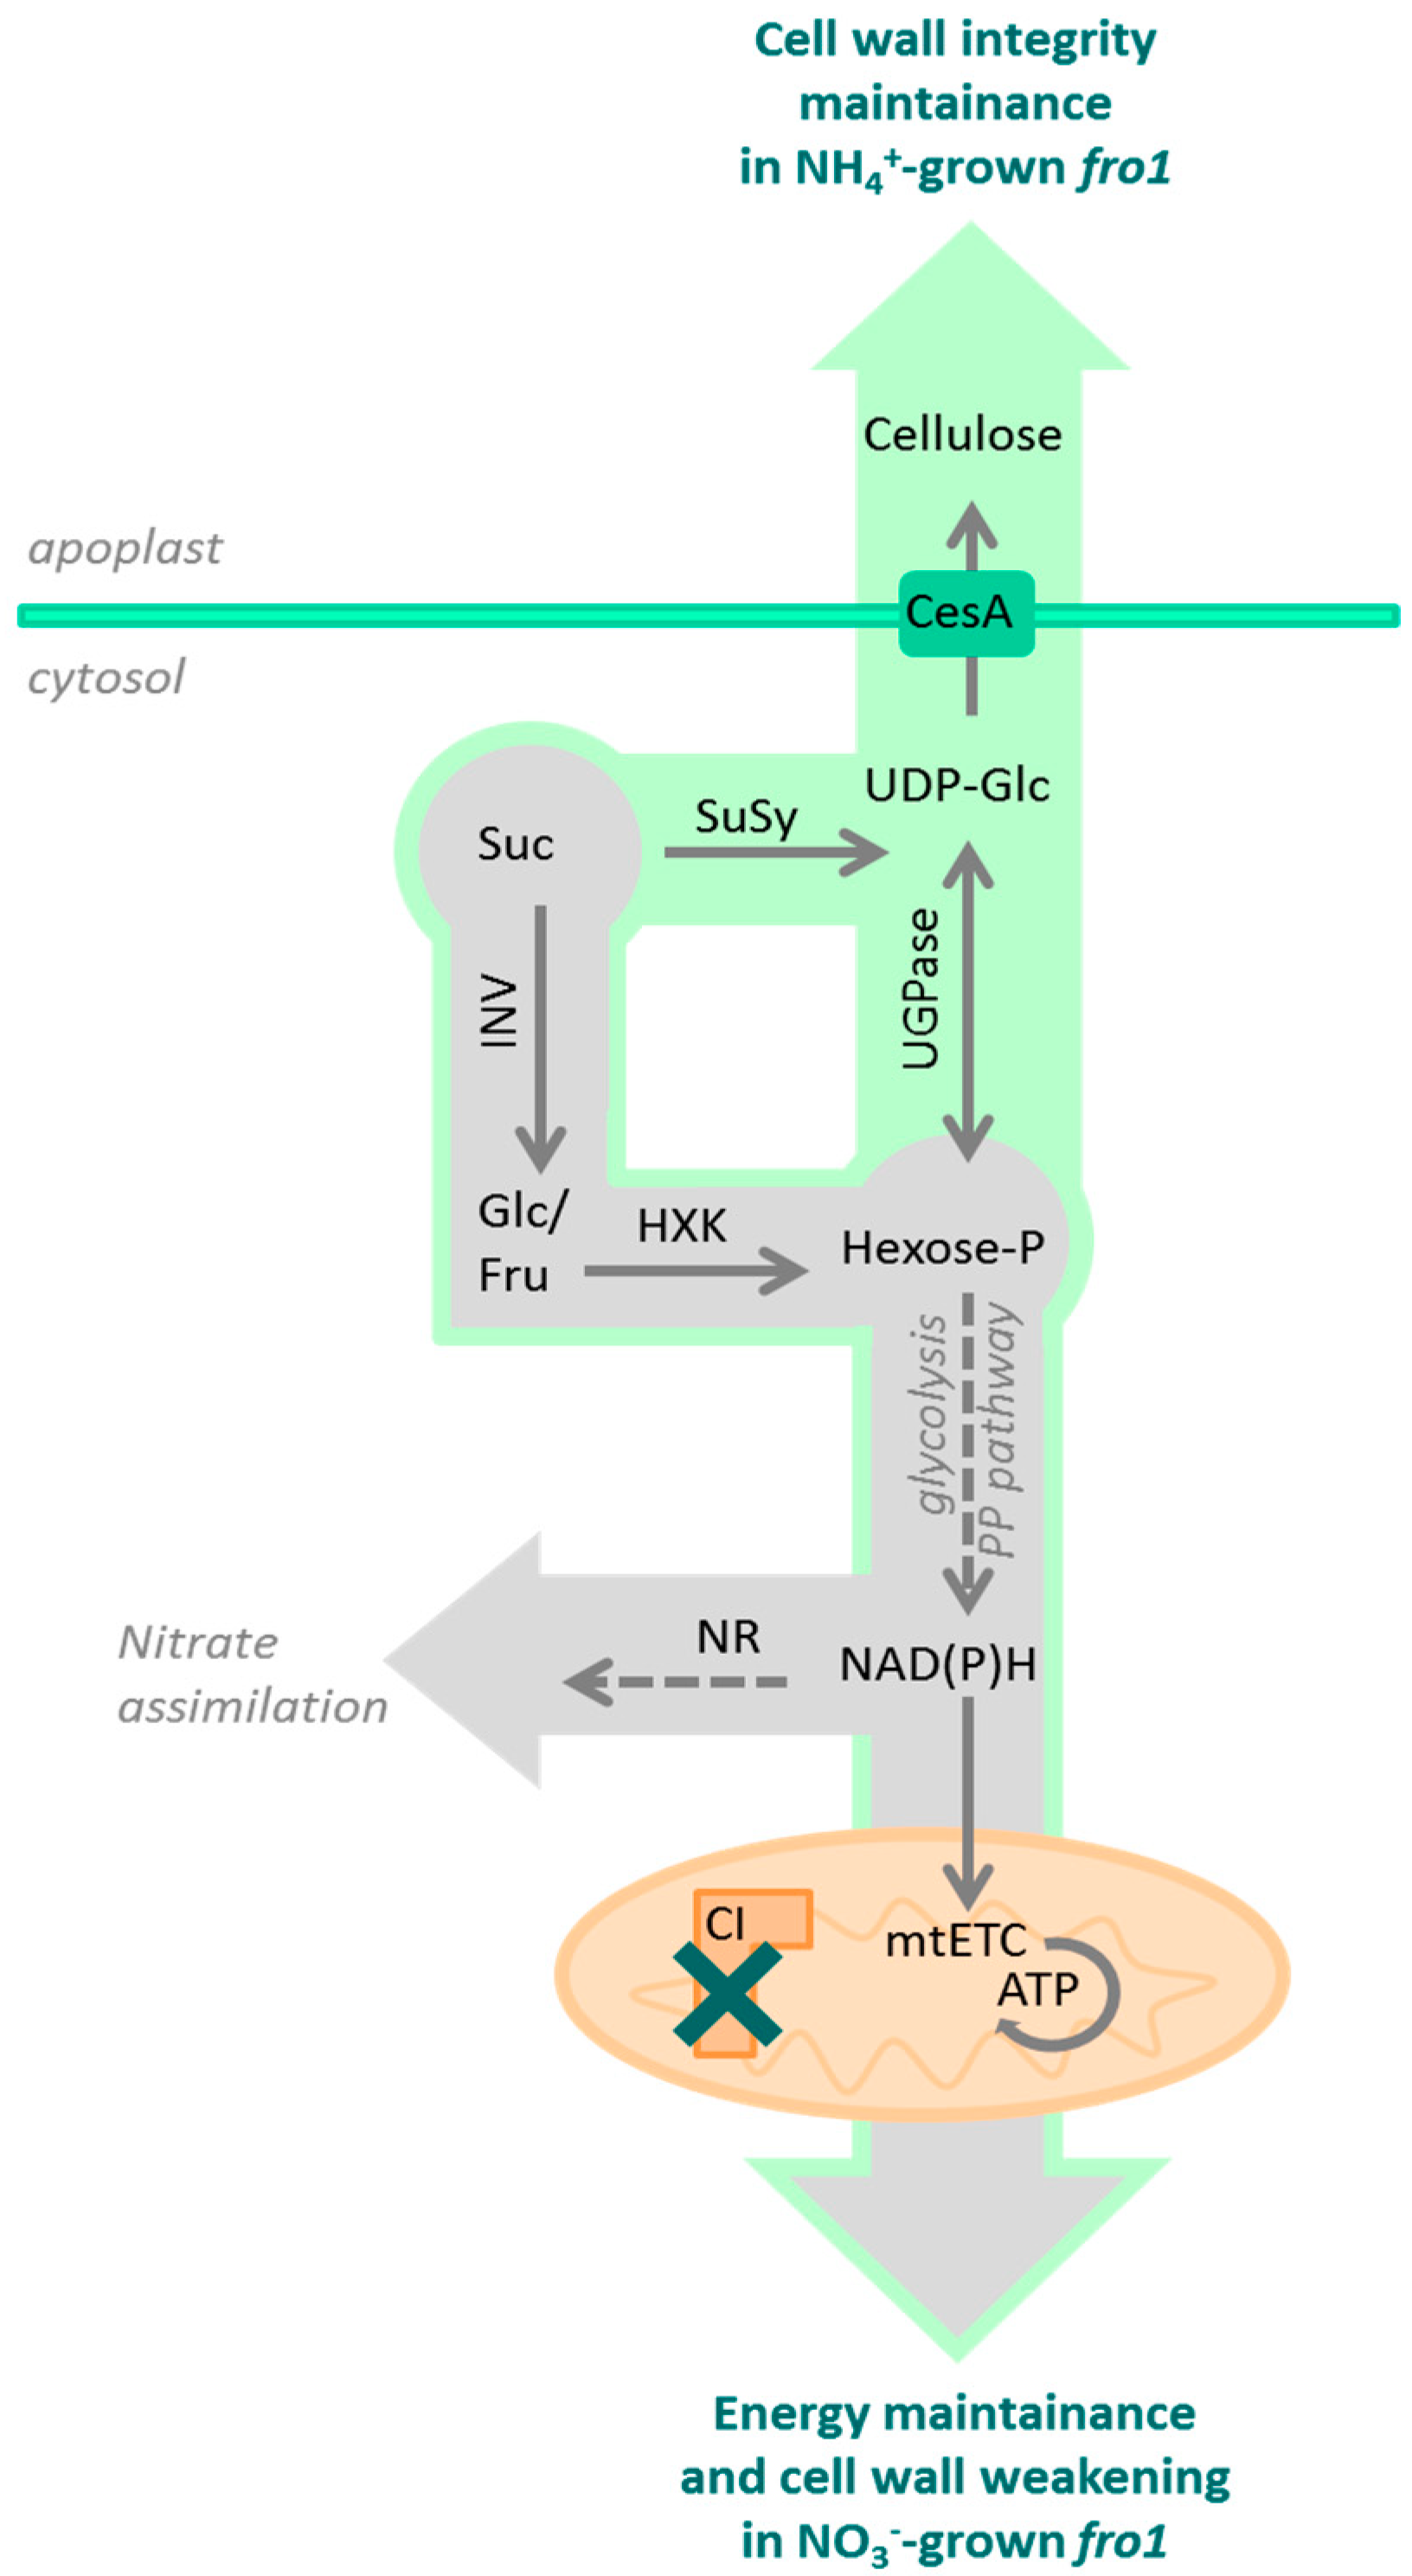
3.1. Sugar Availability under Ammonium Nutrition May Limit Cell Wall Synthesis in WT but not in fro1 Plants

Sugars are not only the ultimate source of energy and carbon skeletons for intracellular biomolecules but also provide the material used by plants to produce cell walls. While the plant cell is growing, an extensible primary cell wall is formed, the layers of which consist of cellulose microfibrils embedded in a matrix of cross-linked carbohydrates (hemicelluloses and pectin). Among the wall polysaccharides, cellulose, a polymer derived from β-1,4-linked Glc units, is the main load-bearing wall component [67,68]. The high input of sugars related to the energy-conserving phase in fro1 plants might limit sugar availability for cell wall synthesis (Figure 10). In the present study, we detected lower cellulose synthase gene expression and decreased cellulose content in fro1 plants, in particular, the expression of CesA1, CesA3, and CesA6 (Figure 4B–D), which have been proposed to be connected with primary cell wall biosynthesis [60,69]. Similarly, as observed by Lee [46], the low incorporation of cellulose results in the generally thinner cell walls of these mutants (Figure 3C). Disturbed cell wall assembly might be a universal response in mitochondrial complex I mutants. In a proteomics study—an analysis of the functional context of altered proteins in the ca1ca2 mutant line with impaired complex I—a major cell wall response was observed, although carbohydrate metabolism was affected to a lesser extent [22]. Alterations in sugar content have also been detected in another complex I mutant, css1, which was further characterized because of its lower cellulose synthesis [25]. Dysfunctional mitochondria of the css1 mutant were proposed to compete with cell wall synthesis reactions for carbon, highlighting the branched pathways at the level of sucrose synthase (SuSy). UGPase and SuSy are involved in the synthesis of UDP-Glc in source tissues for cellulose production, and an unchanged UGPase protein level in fro1 plants (Figure 2D) prevented restoration of the low cellulose synthesis in these mutants. It should be noted that UGPases have a dual function and might also promote the accumulation of free cytosolic UDP-Glc [70], and thus sugar breakdown instead of cell wall synthesis might be favored in fro1 plants. In general, a high cell area to cell wall thickness ratio (Figure 3D) indicates that the cell walls in fro1 plants might be weakened due to higher sugar flux towards catabolism. In fro1 plants, NH4+ nutrition has the opposite effect on cell wall plasticity compared with that observed under control conditions, that is, WT plants have a lower cell area to cell wall thickness ratio in response to NH4+ supply (Figure 3D). This is because NH4+-grown plants are characterized by smaller cells (Figure 3A,B), and therefore the thin cell walls are relatively stronger compared to those of the small cells. In Arabidopsis thaliana, NH4+ nutrition has been found to increase cell wall firmness [58]. Despite a lower total cellulose content and CesA expression in WT plants during NH4+ nutrition (Figure 4), the cell wall thickness is not appreciably decreased as in fro1 plants by the inactivation of complex I (Figure 3C). Substrate availability in the form of Suc and Glc, together with higher UGPase engagements (Figure 2A,B,D), might maintain cell wall synthesis at a level sufficient for small cells to grow. It can be assumed that NH4+-based changes in carbohydrate metabolism might compensate for the weak cell walls in fro1 plants, thereby promoting better growth of these plants in the presence of NH4+. Therefore, in NH4+-grown fro1 plants, a large proportion of soluble sugar (Glc and Suc, Figure 2A,B) might not be channeled to energy-producing processes (since HXK activity is decreased, Figure 2C), but rather toward cellulose synthesis due to higher UGPase engagement (Figure 2D). Consequently, in contrast to WT plants, the thickness of cell walls in fro1 plants is not decreased in response to NH4+ nutrition (Figure 3C).
On completion of expansion, the structure of plant cells need to be strengthened, which is facilitated by the generation of a secondary cell wall that is mainly composed of cellulose, hemicelluloses, and lignin. The expression of CesA4, CesA7, and CesA8, which are genes associated with cellulose synthesis for secondary cell wall formation [71,72], were induced in fro1 plants when grown on NH4+ and might be associated with a mechanism that compensates for the low cellulose deposition in these plants (Figure 4E–G). Plant growth is generally not directly related to cellulose availability but might be limited to some degree by cell wall rigidification. In the process of lignification, phenolic polymers are cross-linked to provide mechanical strength as a defense against different environmental stress conditions. In this regard, POXs have been found to catalyze the polymerization of a wide variety of small phenolic compounds [73]. For example, the cell wall-localized POX64 and POX72 isoforms have been shown to participate in this process [74,75], and we found that the expression of these two genes was increased in NH4+-grown fro1 plants (Figure 5). Consistent with the previously observed higher expression of major CAD isoforms related to phenolic synthesis [76], we found that the expression of CAD1 and CAD5 was correlated with higher phenolic resources in cell walls (Figure 5C,E). Interestingly, despite higher substrate availability for lignification in NH4+-grown fro1 plants, these plants had lower contents of lignin (Figure 5A) and showed lower POX activity [47]. Therefore, we did not expect the stiffening of the cell walls in fro1 plants when treated with NH4+, which may therefore favor cell expansion. It should also be noted that POX activity might be involved not only in cell wall stiffening but also in contrasting processes such as cell wall loosening. In the hydroxylic cycle, POX can produce HO from the superoxide anion and hydrogen peroxide [77,78]. In response to NH4+ treatment, the selected POX33 isoform showed an increased expression in fro1 plants (Figure 8B), indicating that POX may play a role in non-enzymatic cell wall loosening, thereby enabling growth. Cvetkowska et al. [8] have proposed a relationship between defective mitochondrial functioning and processes occurring in the extracellular space associated with ROS-triggered signaling. Consistent with this supposition, we detected higher H2O2 levels in fro1 plants, primarily within the apoplast (Figure 8A). The apoplastic ROS pool was even increased in fro1 plants when grown on NH4+ (Figure 8A). A ROS-related response associated with the plasmalemma was also indicated by the induced expression of the marker gene OZF1 in response to NH4+ in both fro1 and WT plants (Figure 8C). Thus, we speculate that the ROS burst in the apoplastic space in response to NH4+ might activate signaling events [79,80].
The plant cell wall is an active structure that can respond to environmental cues, integrate signaling pathways, and regulate cell physiology and growth [81,82]. Perception of the integrity of cell wall cellulose can be ensured by dedicated cell wall sensor receptors such as kinases [83,84,85]. Cell wall remodeling in response to either NH4+ nutrition or a defect in complex I is reflected in the decreased expression of FER and THE1 (Figure 3E,F). However, the effect of both sources of stress is to trigger a strong down-regulation of FER in fro1 plants when grown on NH4+. Although FER is essential for expansion growth of cells, the biomass production of fro1 plants is increased when cultivated on NH4+ (Figure 1). Mitochondrial dysfunction can in some cases induce tolerance against cellulose deficiency. In this regard, it has previously been shown that suppressed mitochondrial PPR-like protein induces retrograde signaling, resulting in a resistance to cellulose synthesis inhibition [86]. Accordingly, mutants can reconstruct weak cell walls and overcome growth suppression.

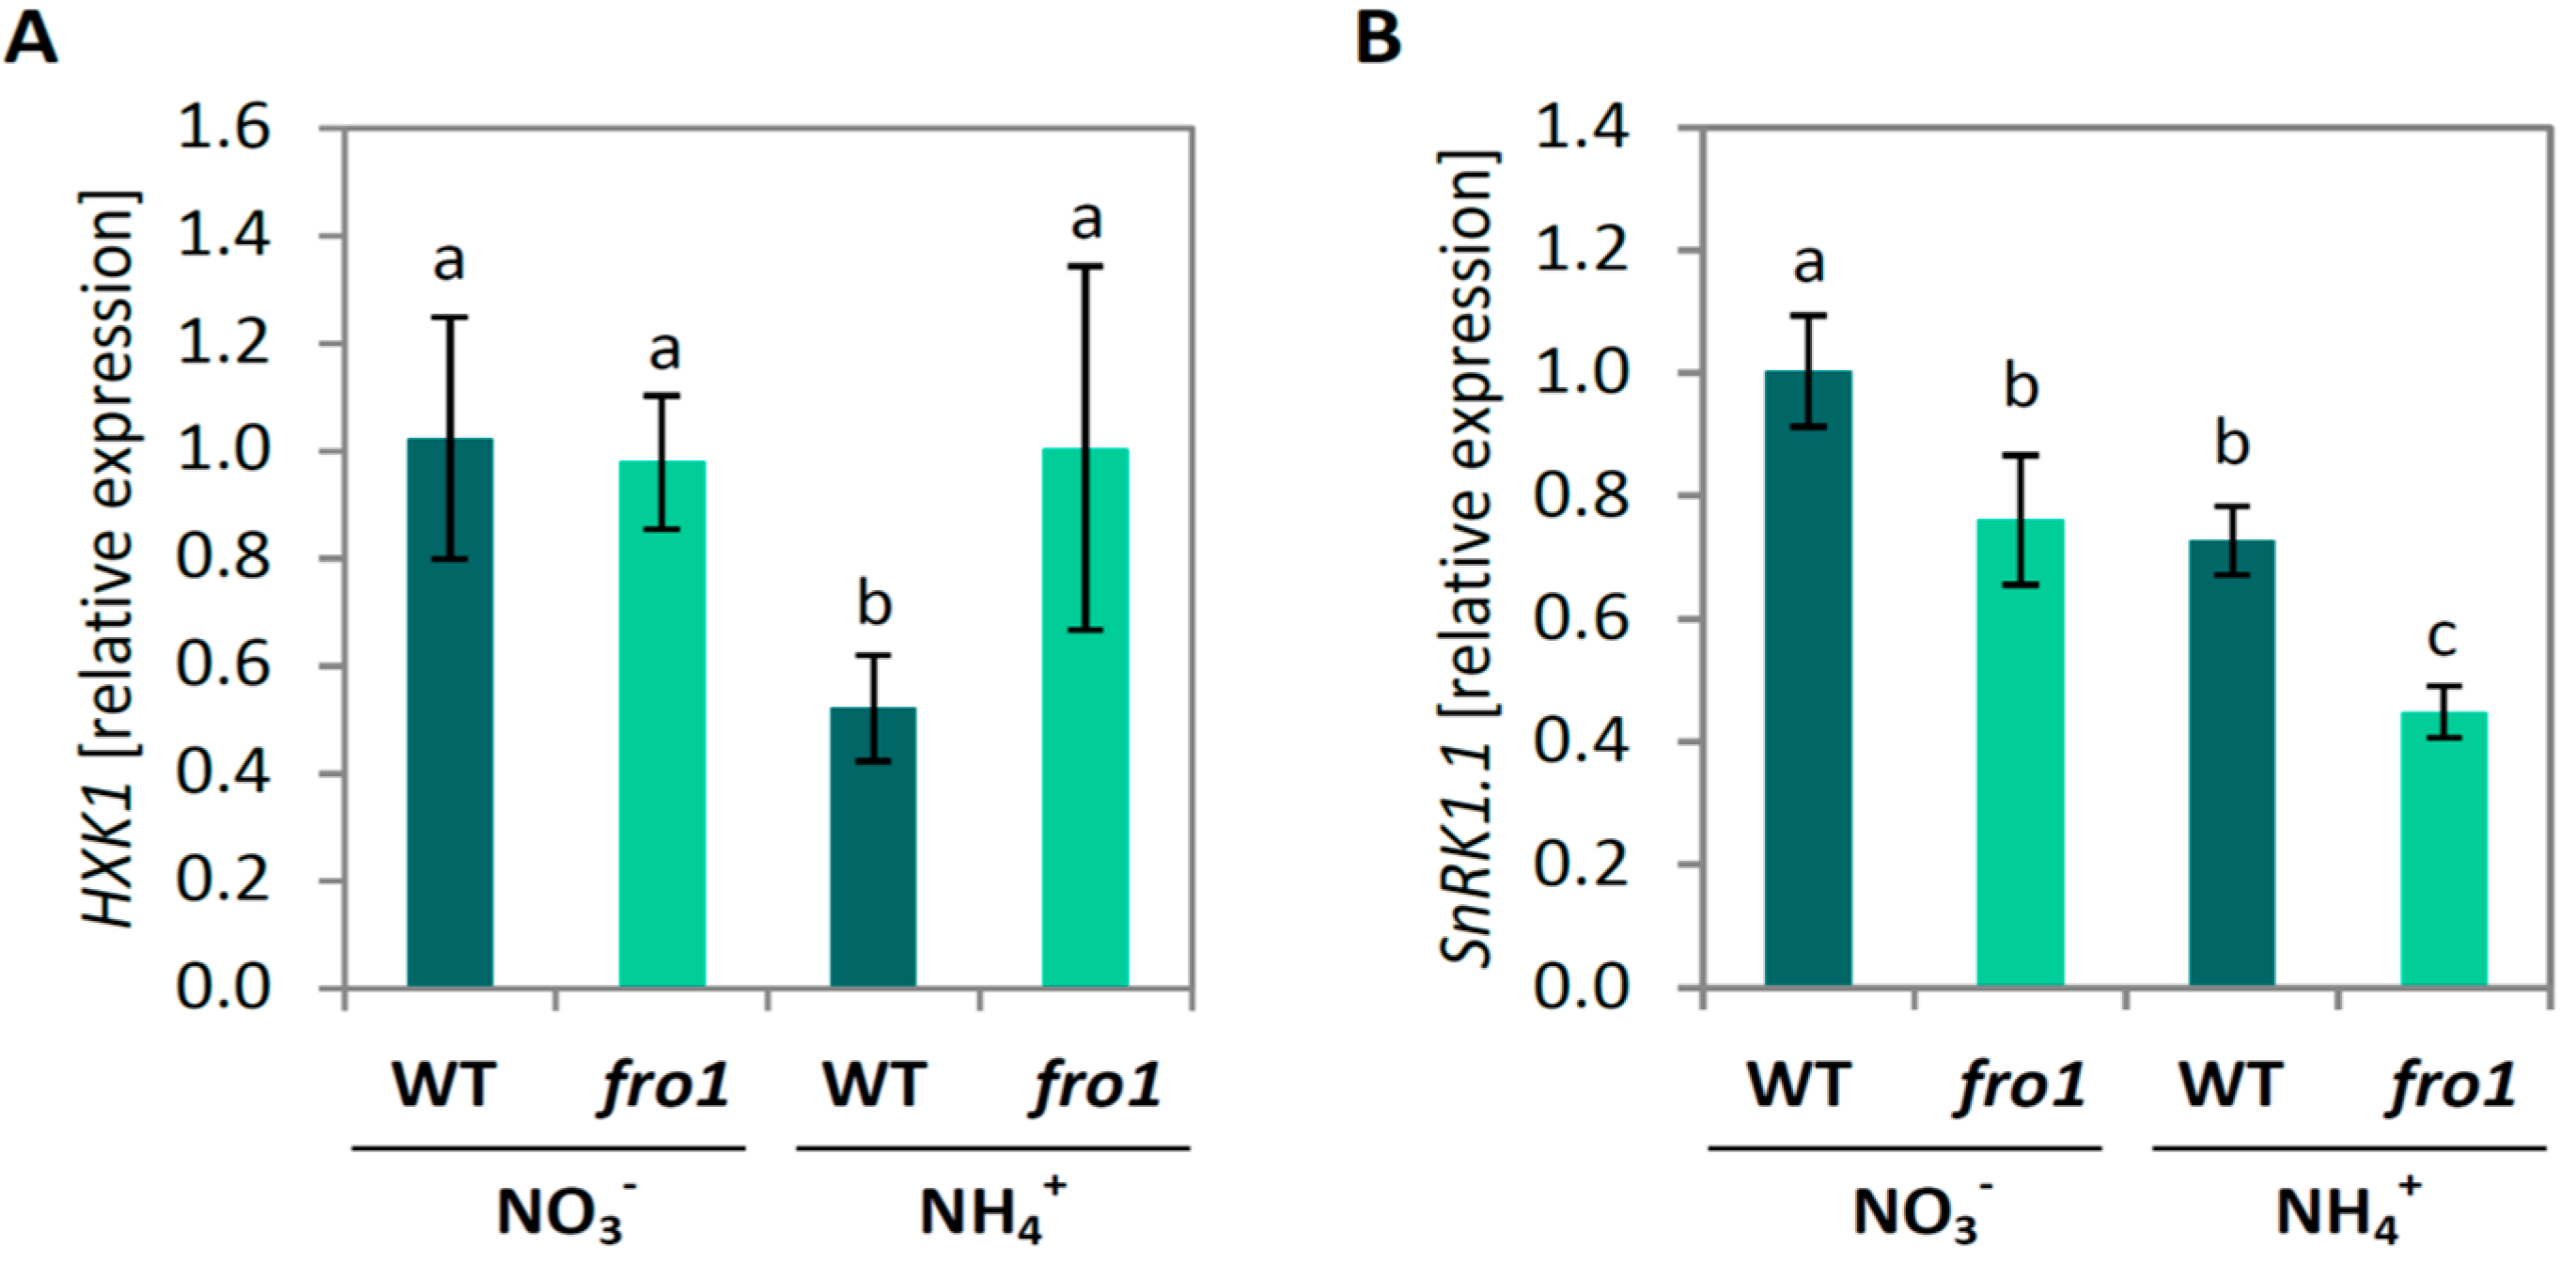
3.2. Fro1 Does not Show Significant Differences in the Pattern of Sugar Signaling

Sugars are probably the most important metabolites in the energy economy of living cells, and therefore cells need to have a precise system for monitoring sugar levels. Signalling pathways for sucrose, glucose, trehalose-6-phosphate, and fructose have previously been described [87,88,89]. HXK1 plays a dual role in cell metabolism, in addition to its enzymatic function of promoting hexose phosphorylation in glycolytic pathway, it can also act as a sugar sensor. Although Arabidopsis HXK1 is mostly associated with mitochondrial membranes, it is also expressed in the nucleus [87], where it forms a complex with specific subunits of other proteins and modulates the transcription of target genes. The expression level of HXK1 has been demonstrated to be positively correlated with sensitivity to Glc [90,91,92]. In the present study, we found that expression of the HXK1 gene in WT plants was decreased in response to NH4+ (Figure 9A). A lower expression of HXK1 may be a mechanism whereby WT plants grown on NH4+ show a reduced sensitivity to increased levels of Glc. Additionally, it should be noted that HXK1-dependent Glc sensing is modulated by nitrogen availability [91] and in ammonium-stressed plants, nitrogen content is substantially increased (results not published). Although HXK activity in leaves of WT plants was not altered under NH4+ nutrition, it was relatively high in fro1 plants under both growth conditions (Figure 2C). The energy metabolism of fro1 plants depends largely on substrate-level phosphorylation, and this necessitates an up-regulated glycolytic flux in these plants. Indeed, HXK activity (Figure 2C) and soluble sugar content were increased (Figure 2A,B) in fro1 plants. Furthermore, HXK1 transcript levels remained unchanged and were at similar levels to those in NO3-grown WT plants (Figure 9A), therefore the regulatory role of HXK1 in plants with dysfunction of the mtETC remains elusive.
The second well-described protein involved in sugar sensing in plant cells is the SnRK1 complex. This complex has kinase activity and is assumed to be regulated by sugar availability. However, recently, SnRK1.1 has been recognized as playing a role in sugar-signaling, hub-regulating metabolism in response to changes in cellular energy status [93,94]. Among SnRK1-activated (and sugar-repressed) genes are those associated with catabolic pathways (cell wall, starch, Suc, amino acids, and protein degradation), which provide substrates for generating energy [95,96,97]. According to Baena et al. [95], SnRK1 senses stress-associated energy deprivation and reprograms metabolism to restore homeostasis and promote plant stress tolerance. SnRK1.1 (also referred to as KIN10) is one of the catalytic subunits of the heterotrimeric SnRK1 complex in plants [98]. Surprisingly, we found that SnRK1.1 transcript levels appear to decrease in response to NH4+ stress and mitochondrial complex I dysfunction (Figure 9B) when there is a cellular energy deficit [47]. Furthermore, SnRK1 activity was recently shown to be redox state-dependent [99]. Since the redox state of Arabidopsis leaf cells is increased in response to both mtETC dysfunction and NH4+ nutrition [47,57], we cannot exclude the possibility that this may induce SnRK1 activity despite lower transcript/protein levels.

3.3. Ammonium Nutrition Mitigates PCD Occurrence in fro1 Plants

Abiotic stress signaling or the energy status of cells can activate processes leading to PCD in plant cells. KOD [62] induces depolarization of the mitochondrial membrane, and constitutes an early step in plant PCD. Simultaneously, KOD-promoted PCD can be suppressed by the highly conserved survival factor BI-1 which can delay the onset of PCD upon stress signaling [100,101]. Besides, a direct link between HXK1 activity and PCD has been proposed [91]. HXK1 inhibits PCD via binding to the voltage-dependent anion channel (VDAC) in plant mitochondrial membranes and inhibiting cyt c translocation from mitochondria in response to cellular stress [65]. In fro1 plants, cyt c level was higher than in WT plants, (Figure 7C) however, a lower KOD transcript level and no changes in HXK1 and BI-1 expression (Figure 7A,B and Figure 9A) indicate that cell death in fro1 plants under nitrate conditions (Figure 6) appears to be induced by other stimuli than the analysed genes. On the other hand, NH4+ nutrition has the opposite trend on marker gene expression, which correlates with unchanged cyt c abundance and the lack of lesion development (Figure 6 and Figure 7). Distinct differences in the molecular responses at the transcript and protein levels of fro1 plants indicate that multiple pathways may be involved in mediating the progression or inhibition of PCD due to functional changes in mtETC or varying nitrogen supply.
Recently, Van Doorn [102] postulated the occurrence of two morphological classes of PCD: necrosis and vacuolar cell death. Necrosis is typically found under conditions of abiotic stress. Although necrosis is no longer considered to be an un-programmed process, it remains poorly characterized at the biochemical and genetic levels, and yet no associated molecular markers have been identified. Mitochondrial changes related to necrotic cell death include respiratory decline, the production of ROS, a decrease in ATP levels, and mitochondrial membrane permeabilization, most of which have been observed in fro1 mitochondria [47]. Autophagy is an intracellular process involved in the vacuolar degradation of cytoplasmic components, and although it has yet to be determined whether autophagic pathways are required for the progression of vacuolar cell death, ATG5, one of the ATG genes that are essential for autophagosome formation, has recently been found to be involved in developmental vacuolar cell death of Arabidopsis [103]. In the present study, the induced expression of ATG5 in fro1 plants (Figure 7D) may thus indicate that lesions emerging on the leaf blades of fro1 plants under NO3 nutrition (Figure 6A) have the vacuolar cell death origin. Moreover, the decreased expression of ATG5 which correlates with lack of lesions and fewer areas of dead cells in the leaf blades of NH4+-grown fro1 plants, compared with those in plants grown under NO3 nutrition (Figure 6), indicates that two different mechanisms underlie the responses of fro1 plants to the nitrogen status. However, since the plants used in our experiments were long-term grown and PCD is a rapidly developing process, it is not possible to distinguish the exact morphological symptoms characteristic of both types of PCD.

4. Materials and Methods

4.1. Plant Material and Growth Conditions

Experiments were performed on Arabidopsis thaliana plants of ecotype C24 (WT) and frostbite1 mutants, which were derived through chemical mutagenesis as described by Lee et al. [46]. Plants were grown hydroponically using an Araponics system (Liège, Belgium) as described in Podgórska et al. [47]. The nutrient medium (according to [104]), containing 5 mM NO3 or 5 mM NH4+ as nitrogen source was renewed twice a week. NO3-treated WT plants were used as controls. Plants were grown for 8 weeks until they reached growth stage 5.10 according to [105]. The culture was conducted under an 8 h photoperiod at 150 μmol m−2 s−1 photosynthetically active radiation (PAR, daylight and warm white 1:1, LF-40W, Piła, Poland), day/night temperature of 21 °C/18 °C, and approximately 70% relative humidity.

4.2. Phenotype Analysis

Representative rosettes were photographed. Plant leaves were stained with 0.5 mg/mL Calcofluor White (Sigma Aldrich, Darmstadt, Germany) as previously described in Podgórska et al. [58]. The cross-section area of cells were determined using the Nikon A1R MP confocal laser scanning microscope (Nikon, Tokyo, Japan). Eight to 10 plants analyzed from each variant were randomly selected from 3 independent plant cultures. Cell size was calculated on micrographs using the Nis-Elements 3.22 imaging software (Nikon). The thickness of the cell walls was measured on micrographs obtained by transmission electron microscopy (TEM) (as previously described by [47]) according to Podgórska et al. [58]. The thickness of a double layer of cell walls was measured using the Image Processing and Analysis in Java software (ImageJ, v.1.51f, https://imagej.nih.gov/ij/).

4.3. Lesions Identification

Selected leaves were photographed using a binocular to show lesion spots. The occurrence of spots on leaves was counted. The precise location of necrosis within leaf blades was analyzed using trypan blue staining [106]. The trypan blue solution was composed of 10% phenol, 10% glycerol, 10% lactic acid in 60% ethanol and 0.02% trypan blue [107]. Whole leaves were immersed in the trypan blue solution for 5 min at 35 °C; next, leaves were cleared with a distaining solution (40% methanol, 10% acetic acid, 10% glycerol) at 60 °C, and photographed. The staining intensity of trypan blue on leaves was quantified using ImageJ software.

4.4. Cell Wall Preparations, Cellulose, Lignin, and Phenol Content Assay

Cell walls were prepared from around 2 g of frozen leaf tissue as described by Solecka et al. [108]. The resulting precipitate containing the cell wall was air dried and used for cellulose and lignin determination. Cellulose content was measured via the colorimetric Anthrone protocol according to Updegraff [109]. Lignin content was determined by the acetyl bromide method [110] as described in Hatfield et al. [111]. The amount of phenolics bound to cell walls was measured using a method described in Forrest and Bendall [112], as described earlier in Solecka et al. [113]. Phenolics were released from the cell wall preparations by alkaline hydrolysis and their content was determined spectrophotometrically using the Folin reagent.

4.5. Determination of Sugars and Protein Level

Soluble sugars were extracted as described in Szal et al. [114]. Glucose content was determined by the glucose oxidase-peroxidase reaction [115]. Sucrose concentration was determined after degradation to Glc and fructose. Protein level was measured as described by Bradford [116] using BSA as a standard.

4.6. Enzyme Activity Measurement and Protein Level Determination

Hexokinase activity was assayed according to the method described in Huber and Akazawa [117]. Protein extracts for enzyme activity determination and Western-blotting were prepared from 100 mg of leaf tissue which was homogenized with 2.5 volumes of extraction buffers.
Cytochrome c level determination in mitochondrial samples was done as described in Borysiuk et al. [63] and resulting bands were normalized on the basis of the mitochondrial marker protein voltage-dependent anion-selective channel protein 1 (VDAC1, Agrisera, Vännäs, Sweden, Figure S2). For other protein level analyses protein extracts (5 µL of protein extracts) (corresponding to 20 µg of protein) were separated in 10% sodium dodecyl sulfate-polyacrylamide gel electrophoresis (SDS-PAGE). Anti-UGPase [70], were used as primary antibodies (diluted 1:1000), and anti-rabbit antibodies (Bio-Rad, Hercules, CA, USA) were used as secondary antibodies. Immuno-blotting was performed according to standard protocols. Visualization was performed using a chemiluminescence kit (Clarity™ Western ECL, Bio-Rad, Hercules, CA, USA), and signals were detected using a Chemi-Doc imaging system (Bio-Ra). Bands (located at approximately 12 kDa for cyt c and 51 kDa for UGPase) were determined based on a pre-stained protein marker (Bio-Rad) as reference. Relative protein levels were quantified by densitometry analysis using Image-Lab 5.2. software (Bio-Rad).

4.7. Quantitative RT-PCR Analyses

Total RNA was extracted using a Syngen Plant RNA Mini kit (Syngen Biotech, Wrocław, Poland). DNAse digestion was performed using a RNase-free DNAse Set (Qiagen, Hilden, Germany). cDNA was synthesized using a RevertAid H minus first-strand cDNA synthesis kit (Thermo Fisher Scientific, Inc., Waltham, MA, USA) and RNAse H digestion was performed according to the procedure described in Escobar et al. [118]. The transcript levels were determined using iTaq Universal SYBR Green Supermix (Bio-Rad). Quantitative RT-PCR reactions were performed using a thermo cycler (CFX Content™, Bio-Rad) at 60 °C for annealing temperature. Reference protein phosphatase 2A (PP2A, AT1G13320, [119]) gene was used to normalize results. Transcript levels and qRT-PCR efficiency of genes were quantified as described in Pfaffl [120]. Results are expressed in relation to those in control plants. PCR primer pairs have been previously described for FER (AT3G51550), THE1 (AT5G54380) [58], and KOD (AT4G22970) [62]. New primers were designed for: OZF1 (AT2G19810), CesA1 (AT4G32410), CesA3 (AT5G05170), CesA4 (AT5G44030), CesA6 (AT5G64740), CesA7 (AT5G17420), CesA8 (AT4G18780), SnRK1.1 (AT3G01090), HXK1 (AT4G29130), CAD1 (AT1G72680), CAD4 (AT3G19450), CAD5 (AT4G34230), POX33 (AT3G49110), POX34 (AT3G49120), POX64 (AT5G42180), POX72 (AT5G66390), BI-1 (AT5G47120), and ATG5 (AT5G17290) (Supplementary Materials Table S1), in which one sequence spanned always an exon–exon border if the gene had at least one intron.

4.8. Statistical Analysis

Results were expressed as means and standard deviations (SD) from 3 to 10 measurements taken from at least three independent plant cultures. One-way analysis of variance (ANOVA) and Tukey’s post-hoc test at p-values ≤ 0.05 were performed to analyze statistical significance of observed differences, using the Statistica 13.1 software (StatSoft, Inc., Tulsa, OK, USA).

Supplementary Materials

Supplementary materials can be found at https://www.mdpi.com/1422-0067/19/8/2206/s1.

Author Contributions

A.P. and B.S. conceived and designed the experiments; A.P., A.T., K.B., and M.O.-B. carried out qRT-PCR analysis; A.T., B.S., and M.B. measured metabolites and enzyme activities; A.P. performed CLSM microscopy and cytochemical staining; B.S. and M.O.-B. performed immunoblotting; A.P., A.T., B.S., K.B., and M.O.-B. wrote the paper; P.G. revised the manuscript.

Funding

This work was partially supported by grant 2014/13/B/NZ3/00847 and 2014/14/E/NZ3/00155 from the National Science Centre (NCN, Kraków, Poland) given to Bożena Szal.

Acknowledgments

Seeds of WT and fro1 plants were kindly donated by Jian-Kang Zhu (Purdue University). Anti-UGPase antibodies were kindly provided by Leszek Kleczkowski (Umeå Plant Science Centre). The authors thank Bohdan Paterczyk from the Faculty of Biology (University of Warsaw) for support during CLSM analysis. We are grateful to Anna Książek from the Faculty of Biology (University of Warsaw) for assistance with qRT-PCR studies. Anna Podgórska and Monika Ostaszewska-Bugajska were the beneficiaries of a scholarship from the Polish Minister of Science and Higher Education.

Conflicts of Interest

The authors declare no conflict of interest.

Abbreviations

ATPadenosine triphosphate
cyt ccytochrome c
fro1frostbite1
Glcglucose
HXKhexokinase
mtETCmitochondrial electron transport chain
NADHnicotinamide adenine dinucleotide, reduced
NADPHnicotinamide adenine dinucleotide phosphate, reduced
PCDprogrammed cell death
POXperoxidase
ROSreactive oxygen species
Sucsucrose
TCAtricarboxylic acid
UGPaseUDP-glucose pyrophosphorylase
WTwild-type

References

  1. Bloom, A.J. Photorespiration and nitrate assimilation: A major intersection between plant carbon and nitrogen. Photosynth. Res. 2015, 123, 117–128. [Google Scholar] [CrossRef] [PubMed]
  2. Noctor, G.; Foyer, C.H. A re-evaluation of the ATP:NADPH budget during C3 photosynthesis: A contribution from nitrate assimilation and its associated respiratory activity? J. Exp. Bot. 1998, 49, 1895–1908. [Google Scholar] [CrossRef]
  3. Fernie, A.R.; Carrari, F.; Sweetlove, L.J. Respiratory metabolism: Glycolysis, the TCA cycle and mitochondrial electron transport. Curr. Opin. Plant Biol. 2004, 7, 254–261. [Google Scholar] [CrossRef] [PubMed]
  4. Sweetlove, L.J.; Fait, A.; Nunes-Nesi, A.; Williams, T.; Fernie, A.R. The mitochondrion: An integration point of cellular metabolism and signalling. CRC Crit. Rev. Plant Sci. 2007, 26, 17–43. [Google Scholar] [CrossRef]
  5. Gardeström, P.; Igamberdiev, A.U. The origin of cytosolic ATP in photosynthetic cells. Physiol. Plant. 2016, 157, 367–379. [Google Scholar] [CrossRef] [PubMed]
  6. Ng, S.; De Clercq, I.; Van Aken, O.; Law, S.R.; Ivanova, A.; Willems, P.; Giraud, E.; Van Breusegem, F.; Whelan, J. Anterograde and retrograde regulation of nuclear genes encoding mitochondrial proteins during growth, development, and stress. Mol. Plant 2014, 7, 1075–1093. [Google Scholar] [CrossRef] [PubMed]
  7. Crawford, T.; Lehotai, N.; Strand, Å. The role of retrograde signals during plant stress responses. J. Exp. Bot. 2017, 69, 2783–2795. [Google Scholar] [CrossRef] [PubMed]
  8. Cvetkovska, M.; Vanlerberghe, G.C. Alternative oxidase impacts the plant response to biotic stress by influencing the mitochondrial generation of reactive oxygen species. Plant Cell Environ. 2013, 36, 721–732. [Google Scholar] [CrossRef] [PubMed]
  9. Huang, S.; Van Aken, O.; Schwarzländer, M.; Belt, K.; Millar, A.H. The roles of mitochondrial reactive oxygen species in cellular signaling and stress response in plants. Plant Physiol. 2016, 171, 1551–1559. [Google Scholar] [CrossRef] [PubMed]
  10. Schertl, P.; Braun, H.P. Respiratory electron transfer pathways in plant mitochondria. Front. Plant Sci. 2014, 5, 163. [Google Scholar] [CrossRef] [PubMed] [Green Version]
  11. Meyer, E.H.; Tomaz, T.; Carroll, A.J.; Estavillo, G.; Delannoy, E.; Tanz, S.K.; Small, I.D.; Pogson, B.J.; Millar, A.H. Remodeled respiration in ndufs4 with low phosphorylation efficiency suppresses Arabidopsis germination and growth and alters control of metabolism at night. Plant Physiol. 2009, 151, 603–619. [Google Scholar] [CrossRef] [PubMed]
  12. Rasmusson, A.G.; Geisler, D.A.; Møller, I.M. The multiplicity of dehydrogenases in the electron transport chain of plant mitochondria. Mitochondrion 2008, 8, 47–60. [Google Scholar] [CrossRef] [PubMed]
  13. Klodmann, J.; Braun, H.P. Proteomic approach to characterize mitochondrial complex I from plants. Phytochemistry 2011, 72, 1071–1080. [Google Scholar] [CrossRef] [PubMed]
  14. Pla, M.; Mathieu, C.; De Paepe, R.; Chétrit, P.; Vedel, F. Deletion of the last two exons of the mitochondrial nad7 gene results in lack of the NAD7 polypeptide in a Nicotiana sylvestris CMS mutant. Mol. Gen. Genet. 1995, 248, 79–88. [Google Scholar] [CrossRef] [PubMed]
  15. Gutierres, S.; Sabar, M.; Lelandais, C.; Chetrit, P.; Diolez, P.; Degand, H.; Boutry, M.; Vedel, F.; de Kouchkovsky, Y.; De Paepe, R. Lack of mitochondrial and nuclear-encoded subunits of complex I and alteration of the respiratory chain in Nicotiana sylvestris mitochondrial deletion mutants. Proc. Natl. Acad. Sci. USA 1997, 94, 3436–3441. [Google Scholar] [CrossRef] [PubMed]
  16. Vidal, G.; Ribas-Carbó, M.; Garmier, M.; Dubertret, G.; Rasmusson, A.G.; Mathieu, C.; Foyer, C.H.; De Paepe, R. Lack of respiratory chain complex I impairs alternative oxidase engagement and modulates redox signaling during elicitor-induced cell death in Tobacco. Plant Cell 2007, 19, 640–655. [Google Scholar] [CrossRef] [PubMed]
  17. Marienfeld, J.R.; Newton, K.J. The maize NCS2 abnormal growth mutant has a chimeric nad4-nad7 mitochondrial gene and is associated with reduced complex I function. Genetics 1994, 138, 855–863. [Google Scholar] [CrossRef] [PubMed]
  18. Yamato, K.T.; Newton, K.J. Heteroplasmy and homoplasmy for maize mitochondrial mutants: A rare homoplasmic nad4 deletion mutant plant. J. Hered. 1999, 90, 369–373. [Google Scholar] [CrossRef]
  19. Lilly, J.W.; Bartoszewski, G.; Malepszy, S.; Havey, M.J. A major deletion in the cucumber mitochondrial genome sorts with the MSC phenotype. Curr. Genet. 2001, 40, 144–151. [Google Scholar] [CrossRef] [PubMed]
  20. Juszczuk, I.M.; Flexas, J.; Szal, B.; Dąbrowska, Z.; Ribas-Carbó, M.; Rychter, A.M. Effect of mitochondrial genome rearrangement on respiratory activity, photosynthesis, photorespiration and energy status of MSC16 cucumber (Cucumis sativus) mutant. Physiol. Plant. 2007, 131, 527–541. [Google Scholar] [CrossRef] [PubMed]
  21. Kühn, K.; Obata, T.; Feher, K.; Bock, R.; Fernie, A.R.; Meyer, E.H. Complete mitochondrial complex I deficiency induces an up-regulation of respiratory fluxes that is abolished by traces of functional complex I. Plant Physiol. 2015, 168, 1537–1549. [Google Scholar] [CrossRef] [PubMed]
  22. Fromm, S.; Senkler, J.; Eubel, H.; Peterhänsel, C.; Braun, H.P. Life without complex I: Proteome analyses of an Arabidopsis mutant lacking the mitochondrial NADH dehydrogenase complex. J. Exp. Bot. 2016, 67, 3079–3093. [Google Scholar] [CrossRef] [PubMed]
  23. Han, L.; Qin, G.; Kang, D.; Chen, Z.; Gu, H.; Qu, L.J. A nuclear-encoded mitochondrial gene AtCIB22 is essential for plant development in Arabidopsis. J. Genet. Genom. 2010, 37, 667–683. [Google Scholar] [CrossRef]
  24. de Longevialle, A.F.; Meyer, E.H.; Andrés, C.; Taylor, N.L.; Lurin, C.; Millar, A.H.; Small, I.D. The pentatricopeptide repeat gene OTP43 is required for trans-splicing of the mitochondrial nad1 intron 1 in Arabidopsis thaliana. Plant Cell 2007, 19, 3256–3265. [Google Scholar] [CrossRef] [PubMed]
  25. Nakagawa, N.; Sakurai, N. A mutation in At-nMat1a, which encodes a nuclear gene having high similarity to group II intron maturase, causes impaired splicing of mitochondrial NAD4 transcript and altered carbon metabolism in Arabidopsis thaliana. Plant Cell Physiol. 2006, 47, 772–783. [Google Scholar] [CrossRef] [PubMed]
  26. Keren, I.; Bezawork-Geleta, A.; Kolton, M.; Maayan, I.; Belausov, E.; Levy, M.; Mett, A.; Gidoni, D.; Shaya, F.; Ostersetzer-Biran, O. AtnMat2, a nuclear-encoded maturase required for splicing of group-II introns in Arabidopsis mitochondria. RNA 2009, 15, 2299–2311. [Google Scholar] [CrossRef] [PubMed]
  27. Kühn, K.; Carrie, C.; Giraud, E.; Wang, Y.; Meyer, E.H.; Narsai, R.; des Francs-Small, C.C.; Zhang, B.; Murcha, M.W.; Whelan, J. The RCC1 family protein RUG3 is required for splicing of nad2 and complex I biogenesis in mitochondria of Arabidopsis thaliana. Plant J. 2011, 67, 1067–1080. [Google Scholar] [CrossRef] [PubMed]
  28. Hsu, Y.W.; Wang, H.J.; Hsieh, M.H.; Hsieh, H.L.; Jauh, G.Y. Arabidopsis mTERF15 is required for mitochondrial nad2 intron 3 splicing and functional complex I activity. PLoS ONE. 2014, 9, e112360. [Google Scholar] [CrossRef] [PubMed] [Green Version]
  29. Koprivova, A.; des Francs-Small, C.C.; Calder, G.; Mugford, S.T.; Tanz, S.; Lee, B.-R.; Zechmann, B.; Small, I.; Kopriva, S. Identification of a pentatricopeptide repeat protein implicated in splicing of intron 1 of mitochondrial nad7 transcripts. J. Biol. Chem. 2010, 285, 32192–32199. [Google Scholar] [CrossRef] [PubMed]
  30. Brangeon, J.; Sabar, M.; Gutierres, S.; Combettes, B.; Bove, J.; Gendy, C.; Chetrit, P.; des Francs-Small, C.C.; Pla, M.; Vedel, F.; et al. Defective splicing of the first nad4 intron is associated with lack of several complex I subunits in the Nicotiana sylvestris NMS1 nuclear mutant. Plant J. 2000, 21, 269–280. [Google Scholar] [CrossRef] [PubMed]
  31. Sabar, M.; De Paepe, R.; de Kouchkovsky, Y. Complex I impairment, respiratory compensations, and photosynthetic decrease in nuclear and mitochondrial male sterile mutants of Nicotiana sylvestris. Plant Physiol. 2000, 124, 1239–1250. [Google Scholar] [CrossRef] [PubMed]
  32. Juszczuk, I.M.; Szal, B.; Rychter, A.M. Oxidation–reduction and reactive oxygen species homeostasis in mutant plants with respiratory chain complex I dysfunction. Plant Cell Environ. 2012, 35, 296–307. [Google Scholar] [CrossRef] [PubMed]
  33. Subrahmanian, N.; Remacle, C.; Hamel, P.P. Plant mitochondrial complex I composition and assembly: A review. Biochim. Biophys. Acta 2016, 1857, 1001–1014. [Google Scholar] [CrossRef] [PubMed]
  34. Szal, B.; Dąbrowska, Z.; Malmberg, G.; Gardeström, P.; Rychter, A.M. Changes in energy status of leaf cells as the consequence of mitochondrial genome rearrangement. Planta 2008, 227, 697–706. [Google Scholar] [CrossRef] [PubMed]
  35. Florez-Sarasa, I.; Ostaszewska, M.; Galle, A.; Flexas, J.; Rychter, A.M.; Ribas-Carbó, M. Changes of alternative oxidase activity, capacity and protein content in leaves of Cucumis sativus wild-type and MSC16 mutant grown under different light intensities. Physiol. Plant. 2009, 137, 419–426. [Google Scholar] [CrossRef] [PubMed]
  36. Dutilleul, C.; Lelarge, C.; Prioul, J.L.; De Paepe, R.; Foyer, C.H.; Noctor, G. Mitochondria-driven changes in leaf NAD status exert a crucial influence on the control of nitrate assimilation and the integration of carbon and nitrogen metabolism. Plant Physiol. 2005, 139, 64–78. [Google Scholar] [CrossRef] [PubMed]
  37. Szal, B.; Łukawska, K.; Zdolińska, I.; Rychter, A.M. Chilling stress and mitochondrial genome rearrangement in the MSC16 cucumber mutant affect the alternative oxidase and antioxidant defense system to a similar extent. Physiol. Plant. 2009, 137, 435–445. [Google Scholar] [CrossRef] [PubMed]
  38. Wang, Y.; Carrie, C.; Giraud, E.; Elhafez, D.; Narsai, R.; Duncan, O.; Whelan, J.; Murcha, M.W. Dual location of the mitochondrial preprotein transporters B14.7 and Tim23-2 in complex I and the TIM17:23 complex in Arabidopsis links mitochondrial activity and biogenesis. Plant Cell 2012, 24, 2675–2695. [Google Scholar] [CrossRef] [PubMed]
  39. Wang, Y.; Lyu, W.; Berkowitz, O.; Radomiljac, J.D.; Law, S.R.; Murcha, M.W.; Carrie, C.; Teixeira, P.F.; Kmiec, B.; Duncan, O.; et al. Inactivation of mitochondrial complex I induces the expression of a twin cysteine protein that targets and affects cytosolic, chloroplastidic and mitochondrial function. Mol. Plant 2016, 9, 696–710. [Google Scholar] [CrossRef] [PubMed]
  40. Garmier, M.; Dutilleul, C.; Mathieu, C.; Chétrit, P.; Boccara, M.; De Paepe, R. Changes in antioxidant expression and harpin-induced hypersensitive response in a Nicotiana sylvestris mitochondrial mutant. Plant Physiol. Biochem. 2002, 40, 561–566. [Google Scholar] [CrossRef]
  41. Dutilleul, C.; Garmier, M.; Noctor, G.; Mathieu, C.; Chétrit, P.; Foyer, C.H.; de Paepe, R. Leaf mitochondria modulate whole cell redox homeostasis, set antioxidant capacity, and determine stress resistance through altered signaling and diurnal regulation. Plant Cell 2003, 15, 1212–1226. [Google Scholar] [CrossRef] [PubMed]
  42. Liu, Y.J.; Norberg, F.E.B.; Szilágyi, A.; De Paepe, R.; Åkerlund, H.E.; Rasmusson, A.G. The mitochondrial external NADPH dehydrogenase modulates the leaf NADPH/NADP+ ratio in transgenic Nicotiana sylvestris. Plant Cell Physiol. 2008, 49, 251–263. [Google Scholar] [CrossRef] [PubMed]
  43. Karpova, O.V.; Kuzmin, E.V.; Elthon, T.E.; Newton, K.J. Differential expression of alternative oxidase genes in maize mitochondrial mutants. Plant Cell 2002, 14, 3271–3284. [Google Scholar] [CrossRef] [PubMed]
  44. Kuzmin, E.V.; Karpova, O.V.; Elthon, T.E.; Newton, K.J. Mitochondrial respiratory deficiencies signal up-regulation of genes for heat shock proteins. J. Biol. Chem. 2004, 279, 20672–20677. [Google Scholar] [CrossRef] [PubMed]
  45. Tarasenko, V.I.; Garnik, E.Y.; Konstantinov, Y.M. Characterization of Arabidopsis mutant with inactivated gene coding for Fe-S subunit of mitochondrial respiratory chain complex I. Russ. J. Plant Physiol. 2010, 57, 392–400. [Google Scholar] [CrossRef]
  46. Lee, B.H.; Lee, H.; Xiong, L.; Zhu, J.K. A mitochondrial complex I defect impairs cold-regulated nuclear gene expression. Plant Cell 2002, 14, 1235–1251. [Google Scholar] [CrossRef] [PubMed]
  47. Podgórska, A.; Ostaszewska, M.; Gardeström, P.; Rasmusson, A.G.; Szal, B. In comparison with nitrate nutrition, ammonium nutrition increases growth of the frostbite1 Arabidopsis mutant. Plant Cell Environ. 2015, 38, 224–237. [Google Scholar] [CrossRef] [PubMed]
  48. Britto, D.T.; Kronzucker, H.J. NH4+ toxicity in higher plants: A critical review. J. Plant Physiol. 2002, 159, 567–584. [Google Scholar] [CrossRef]
  49. Bittsánszky, A.; Pilinszky, K.; Gyulai, G.; Komives, T. Overcoming ammonium toxicity. Plant Sci. 2015, 231, 184–190. [Google Scholar] [CrossRef] [PubMed]
  50. Walch-Liu, P.; Neumann, G.; Bangerth, F.; Engels, C. Rapid effects of nitrogen form on leaf morphogenesis in tobacco. J. Exp. Bot. 2000, 51, 227–237. [Google Scholar] [CrossRef] [PubMed] [Green Version]
  51. Liu, Y.; von Wirén, N. Ammonium as a signal for physiological and morphological responses in plants. J. Exp. Bot. 2017, 68, 2581–2592. [Google Scholar] [CrossRef] [PubMed]
  52. Gerendás, J.; Zhu, Z.; Bendixen, R.; Ratcliffe, R.G.; Sattelmacher, B. Physiological and biochemical processes related to ammonium toxicity in higher plants. J. Plant Nutr. Soil Sci. 1997, 160, 239–251. [Google Scholar] [CrossRef]
  53. Britto, D.T.; Kronzucker, H.J. Ecological significance and complexity of N-source preference in plants. Ann. Bot. 2013, 112, 957–963. [Google Scholar] [CrossRef] [PubMed] [Green Version]
  54. Szal, B.; Podgórska, A. The role of mitochondria in leaf nitrogen metabolism. Plant Cell Environ. 2012, 35, 1756–1768. [Google Scholar] [CrossRef] [PubMed] [Green Version]
  55. Guo, S.; Schinner, K.; Sattelmacher, B.; Hansen, U.P. Different apparent CO2 compensation points in nitrate-and ammonium-grown Phaseolus vulgaris and the relationship to non-photorespiratory CO2 evolution. Physiol. Plant. 2005, 123, 288–301. [Google Scholar] [CrossRef]
  56. Escobar, M.A.; Geisler, D.A.; Rasmusson, A.G. Reorganization of the alternative pathways of the Arabidopsis respiratory chain by nitrogen supply: Opposing effects of ammonium and nitrate. Plant J. 2006, 45, 775–788. [Google Scholar] [CrossRef] [PubMed]
  57. Podgórska, A.; Gieczewska, K.; Łukawska-Kuźma, K.; Rasmusson, A.G.; Gardeström, P.; Szal, B. Long-term ammonium nutrition of Arabidopsis increases the extrachloroplastic NAD(P)H/NAD(P)+ ratio and mitochondrial reactive oxygen species level in leaves but does not impair photosynthetic capacity. Plant Cell Environ. 2013, 36, 2034–2045. [Google Scholar] [CrossRef] [PubMed]
  58. Podgórska, A.; Burian, M.; Gieczewska, K.; Ostaszewska-Bugajska, M.; Zebrowski, J.; Solecka, D.; Szal, B. Altered cell wall plasticity can restrict plant growth under ammonium nutrition. Front. Plant Sci. 2017, 8, 1344. [Google Scholar] [CrossRef] [PubMed]
  59. Cheung, A.Y.; Wu, H.M. THESEUS 1, FERONIA and relatives: A family of cell wall-sensing receptor kinases? Curr. Opin. Plant Biol. 2011, 14, 632–641. [Google Scholar] [CrossRef] [PubMed]
  60. Desprez, T.; Juraniec, M.; Crowell, E.F.; Jouy, H.; Pochylova, Z.; Parcy, F.; Hofte, H.; Gonneau, M.; Vernhettes, S. Organization of cellulose synthase complexes involved in primary cell wall synthesis in Arabidopsis thaliana. Proc. Natl. Acad. Sci. USA 2007, 104, 15572–15577. [Google Scholar] [CrossRef] [PubMed]
  61. Ma, Q.H. Functional analysis of a cinnamyl alcohol dehydrogenase involved in lignin biosynthesis in wheat. J. Exp. Bot. 2010, 61, 2735–2744. [Google Scholar] [CrossRef] [PubMed] [Green Version]
  62. Blanvillain, R.; Young, B.; Cai, Y.; Hecht, V.; Varoquaux, F.; Delorme, V.; Lancelin, J.-M.; Delseny, M.; Gallois, P. The Arabidopsis peptide kiss of death is an inducer of programmed cell death. EMBO J. 2011, 30, 1173–1183. [Google Scholar] [CrossRef] [PubMed]
  63. Borysiuk, K.; Ostaszewska-Bugajska, M.; Vaultier, M.N.; Hasenfratz-Sauder, M.P.; Szal, B. Enhanced formation of methylglyoxal-derived advanced glycation end products in Arabidopsis under ammonium nutrition. Front. Plant Sci. 2018, 9, 667. [Google Scholar] [CrossRef] [PubMed]
  64. Huang, P.; Chung, M.S.; Ju, H.W.; Na, H.S.; Lee, D.J.; Cheong, H.S.; Kim, C.S. Physiological characterization of the Arabidopsis thaliana oxidation-related zinc finger 1, a plasma membrane protein involved in oxidative stress. J. Plant Res. 2011, 124, 699–705. [Google Scholar] [CrossRef] [PubMed]
  65. Kim, M.; Lim, J.H.; Ahn, C.S.; Park, K.; Kim, G.T.; Kim, W.T.; Pai, H.S. Mitochondria-associated hexokinases play a role in the control of programmed cell death in Nicotiana benthamiana. Plant Cell 2006, 18, 2341–2355. [Google Scholar] [CrossRef] [PubMed]
  66. Jossier, M.; Bouly, J.-P.; Meimoun, P.; Arjmand, A.; Lessard, P.; Hawley, S.; Grahame Hardie, D.; Thomas, M. SnRK1 (SNF1-related kinase 1) has a central role in sugar and ABA signalling in Arabidopsis thaliana. Plant J. 2009, 59, 316–328. [Google Scholar] [CrossRef] [PubMed]
  67. Endler, A.; Persson, S. Cellulose synthases and synthesis in Arabidopsis. Mol. Plant 2011, 4, 199–211. [Google Scholar] [CrossRef] [PubMed]
  68. Verbančič, J.; Lunn, J.E.; Stitt, M.; Persson, S. Carbon supply and the regulation of cell wall synthesis. Mol. Plant 2018, 11, 75–94. [Google Scholar] [CrossRef] [PubMed]
  69. Persson, S.; Paredez, A.; Carroll, A.; Palsdottir, H.; Doblin, M.; Poindexter, P.; Khitrov, N.; Auer, M.; Somerville, C.R. Genetic evidence for three unique components in primary cell-wall cellulose synthase complexes in Arabidopsis. Proc. Natl. Acad. Sci. USA 2007, 104, 15566–15571. [Google Scholar] [CrossRef] [PubMed]
  70. Kleczkowski, L.A.; Geisler, M.; Ciereszko, I.; Johansson, H. UDP-glucose pyrophosphorylase. An old protein with new tricks. Plant Physiol. 2004, 134, 912–918. [Google Scholar] [CrossRef] [PubMed]
  71. Taylor, N.G. Cellulose biosynthesis and deposition in higher plants. New Phytol. 2008, 178, 239–252. [Google Scholar] [CrossRef] [PubMed] [Green Version]
  72. Timmers, J.; Vernhettes, S.; Desprez, T.; Vincken, J.P.; Visser, R.G.; Trindade, L.M. Interactions between membrane-bound cellulose synthases involved in the synthesis of the secondary cell wall. FEBS Lett. 2009, 583, 978–982. [Google Scholar] [CrossRef] [PubMed] [Green Version]
  73. Marjamaa, K.; Kukkola, E.M.; Fagerstedt, K.V. The role of xylem class III peroxidases in lignification. J. Exp. Bot. 2009, 60, 367–376. [Google Scholar] [CrossRef] [PubMed] [Green Version]
  74. Tokunaga, N.; Kaneta, T.; Sato, S.; Sato, Y. Analysis of expression profiles of three peroxidase genes associated with lignification in Arabidopsis thaliana. Physiol. Plant. 2009, 136, 237–249. [Google Scholar] [CrossRef] [PubMed]
  75. Fernández-Pérez, F.; Pomar, F.; Pedreño, M.A.; Novo-Uzal, E. Suppression of Arabidopsis peroxidase 72 alters cell wall and phenylpropanoid metabolism. Plant Sci. 2015, 239, 192–199. [Google Scholar] [CrossRef] [PubMed]
  76. Kim, S.J.; Kim, K.W.; Cho, M.H.; Franceschi, V.R.; Davin, L.B.; Lewis, N.G. Expression of cinnamyl alcohol dehydrogenases and their putative homologues during Arabidopsis thaliana growth and development: Lessons for database annotations? Phytochemistry 2007, 68, 1957–1974. [Google Scholar] [CrossRef] [PubMed]
  77. Liszkay, A.; Kenk, B.; Schopfer, P. Evidence for the involvement of cell wall peroxidase in the generation of hydroxyl radicals mediating extension growth. Planta 2003, 217, 658–667. [Google Scholar] [CrossRef] [PubMed]
  78. Passardi, F.; Penel, C.; Dunand, C. Performing the paradoxical: How plant peroxidases modify the cell wall. Trends Plant Sci. 2004, 9, 534–540. [Google Scholar] [CrossRef] [PubMed]
  79. Baxter, A.; Mittler, R.; Suzuki, N. ROS as key players in plant stress signalling. J. Exp. Bot. 2014, 65, 1229–1240. [Google Scholar] [CrossRef] [PubMed]
  80. Podgórska, A.; Burian, M.; Szal, B. Extra-cellular but extra-ordinarily important for cells: Apoplastic reactive oxygen species metabolism. Front. Plant Sci. 2017b, 8, 1353. [Google Scholar] [CrossRef] [PubMed]
  81. Seifert, G.J.; Blaukopf, C. Irritable walls: The plant extracellular matrix and signaling. Plant Physiol. 2010, 153, 467–478. [Google Scholar] [CrossRef] [PubMed]
  82. Tenhaken, R. Cell wall remodeling under abiotic stress. Front. Plant Sci. 2014, 5, 771. [Google Scholar] [CrossRef] [PubMed]
  83. Wolf, S.; Höfte, H. Growth control: A saga of cell walls, ROS, and peptide receptors. Plant Cell 2014, 26, 1848–1856. [Google Scholar] [CrossRef] [PubMed]
  84. Li, C.; Wu, H.-M.; Cheung, A.Y. FERONIA and her pals: Functions and mechanisms. Plant Physiol. 2016, 171, 2379–2392. [Google Scholar] [CrossRef] [PubMed]
  85. Nissen, K.S.; Willats, W.G.T.; Malinovsky, F.G. Understanding CrRLK1L function: Cell walls and growth control. Trends Plant Sci. 2016, 21, 516–527. [Google Scholar] [CrossRef] [PubMed]
  86. Hu, Z.; Vanderhaeghen, R.; Cools, T.; Wang, Y.; De Clercq, I.; Leroux, O.; Nguyen, L.; Belt, K.; Millar, A.H.; Audenaert, D.; et al. Mitochondrial defects confer tolerance against cellulose deficiency. Plant Cell 2016, 28, 2276–2290. [Google Scholar] [CrossRef] [PubMed]
  87. Harrington, G.N.; Bush, D.R. The bifunctional role of hexokinase in metabolism and glucose signaling. Plant Cell 2003, 15, 2493–2496. [Google Scholar] [CrossRef] [PubMed]
  88. Sheen, J. Master regulators in plant glucose signaling networks. J. Plant Biol. 2014, 57, 67–79. [Google Scholar] [CrossRef] [PubMed] [Green Version]
  89. Cho, Y.H.; Yoo, S.D.; Sheen, J. Regulatory functions of nuclear hexokinase1 complex in glucose signaling. Cell 2006, 127, 579–589. [Google Scholar] [CrossRef] [PubMed]
  90. Jang, J.C.; León, P.; Zhou, L.; Sheen, J. Hexokinase as a sugar sensor in higher plants. Plant Cell 1997, 9, 5–19. [Google Scholar] [CrossRef] [PubMed]
  91. Moore, B.; Zhou, L.; Rolland, F.; Hall, Q.; Cheng, W.H.; Liu, Y.X.; Hwang, I.; Jones, T.; Sheen, J. Role of the Arabidopsis glucose sensor HXK1 in nutrient, light, and hormonal signaling. Science 2003, 300, 332–336. [Google Scholar] [CrossRef] [PubMed]
  92. Kim, Y.; Heinzel, N.; Giese, J.; Koeber, J.; Melzer, M.; Rutten, T.; Von Wirén, N.; Sonnewald, U.; Hajirezaei, M. Dual function of hexokinases in tobacco plants. Plant Cell Environ. 2013, 36, 1311–1327. [Google Scholar] [CrossRef] [PubMed]
  93. Simon, N.M.L.; Kusakina, J.; Fernández-López, Á.; Chembath, A.; Belbin, F.E.; Dodd, A.N. The energy-signaling hub SnRK1 is important for sucrose-induced hypocotyl elongation. Plant Physiol. 2018, 176, 1299–1310. [Google Scholar] [CrossRef] [PubMed]
  94. Wurzinger, B.; Nukarinen, E.; Nägele, T.; Weckwerth, W.; Teige, M. The SnRK1 kinase as central mediator of energy signaling between different organelles. Plant Physiol. 2018, 176, 1085–1094. [Google Scholar] [CrossRef] [PubMed]
  95. Baena-González, E.; Rolland, F.; Thevelein, J.M.; Sheen, J. A central integrator of transcription networks in plant stress and energy signalling. Nature 2007, 448, 938–942. [Google Scholar] [CrossRef] [PubMed]
  96. Chen, L.; Su, Z.-Z.; Huang, L.; Xia, F.-N.; Qi, H.; Xie, L.-J.; Xiao, S.; Chen, Q.-F. The AMP-activated protein kinase KIN10 is involved in the regulation of autophagy in Arabidopsis. Front. Plant Sci. 2017, 8, 1201. [Google Scholar] [CrossRef] [PubMed]
  97. Pedrotti, L.; Weiste, C.; Nägele, T.; Wolf, E.; Lorenzin, F.; Dietrich, K.; Mair, A.; Weckwerth, W.; Teige, M.; Baena-González, E.; et al. Snf1-RELATED KINASE1-controlled C/S1-bZIP signaling activates alternative mitochondrial metabolic pathways to ensure plant survival in extended darkness. Plant Cell 2018, 30, 495–509. [Google Scholar] [CrossRef] [PubMed]
  98. Ghillebert, R.; Swinnen, E.; Wen, J.; Vandesteene, L.; Ramon, M.; Norga, K.; Rolland, F.; Winderickx, J. The AMPK/SNF1/SnRK1 fuel gauge and energy regulator: Structure, function and regulation. FEBS J. 2011, 278, 3978–3990. [Google Scholar] [CrossRef] [PubMed]
  99. Wurzinger, B.; Mair, A.; Fischer-Schrader, K.; Nukarinen, E.; Roustan, V.; Weckwerth, W.; Teige, M. Redox state-dependent modulation of plant SnRK1 kinase activity differs from AMPK regulation in animals. FEBS Lett. 2017, 591, 3625–3636. [Google Scholar] [CrossRef] [PubMed] [Green Version]
  100. Watanabe, N.; Lam, E. Arabidopsis Bax inhibitor-1 functions as an attenuator of biotic and abiotic types of cell death. Plant J. 2006, 45, 884–894. [Google Scholar] [CrossRef] [PubMed]
  101. Watanabe, N.; Lam, E. BAX inhibitor-1 modulates endoplasmic reticulum stress-mediated programmed cell death in Arabidopsis. J. Biol. Chem. 2008, 283, 3200–3210. [Google Scholar] [CrossRef] [PubMed]
  102. Van Doorn, W.G.; Beers, E.P.; Dangl, J.L.; Franklin-Tong, V.E.; Gallois, P.; Hara-Nishimura, I.; Jones, A.M.; Kawai-Yamada, M.; Lam, E.; Mundy, J.; et al. Morphological classification of plant cell deaths. Cell Death Differ. 2011, 18, 1241. [Google Scholar] [CrossRef] [PubMed]
  103. Kwon, S.I.; Cho, H.J.; Jung, J.H.; Yoshimoto, K.; Park, O.K. The RabGTPase RabG3b functions in autophagy and contributes to tracheary element differentiation in Arabidopsis. Plant J. 2010, 64, 151–164. [Google Scholar] [CrossRef] [PubMed]
  104. Lasa, B.; Frechilla, S.; Apricio-Tejo, P.M.; Lamsfus, C. Alternative pathway respiration is associated with ammonium ion sensitivity in spinach and pea plants. Plant Growth Regul. 2002, 37, 49–55. [Google Scholar] [CrossRef]
  105. Boyes, D.C.; Zayed, A.M.; Ascenzi, R.; McCaskill, A.J.; Hoffman, N.E.; Davis, K.R.; Görlach, J. Growth stage-based phenotypic analysis of Arabidopsis: A model for high throughput functional genomics in plants. Plant Cell 2002, 13, 1499–1510. [Google Scholar] [CrossRef]
  106. Pogány, M.; von Rad, U.; Grün, S.; Dongó, A.; Pintye, A.; Simoneau, P.; Bahnweg, G.; Kiss, L.; Barna, B.; Durner, J. Dual roles of reactive oxygen species and NADPH oxidase RBOHD in an Arabidopsis-Alternaria pathosystem. Plant Physiol. 2009, 151, 1459–1475. [Google Scholar] [CrossRef] [PubMed]
  107. Weremczuk, A.; Ruszczyńska, A.; Bulska, E.; Antosiewicz, D.M. NO-Dependent programmed cell death is involved in the formation of Zn-related lesions in tobacco leaves. Metallomics 2017, 19, 924–935. [Google Scholar] [CrossRef] [PubMed]
  108. Solecka, D.; Zebrowski, J.; Kacperska, A. Are pectins involved in cold acclimation and de-acclimation of winter oil-seed rape plants? Ann. Bot. 2008, 101, 521–530. [Google Scholar] [CrossRef] [PubMed]
  109. Updegraff, D. Semimicro determination of cellulose in biological materials. Anal. Biochem. 1969, 32, 420–424. [Google Scholar] [CrossRef]
  110. Johnson, D.B.; Moore, W.E.; Zank, L.C. The spectrophotometric determination of lignin in small wood samples. Tappi 1961, 44, 793–798. [Google Scholar] [CrossRef]
  111. Hatfield, R.D.; Grabber, J.; Ralph, J.; Brei, K. Using the acetylbromide assay to determine lignin concentrations in herbaceous plants: Some cautionarynotes. J. Agric. Food Chem. 1999, 47, 628–632. [Google Scholar] [CrossRef] [PubMed]
  112. Forrest, G.I.; Bendall, D.S. The distribution of polyphenols in the tea plant (Camellia sinensis L.). Biochem. J. 1969, 113, 741–755. [Google Scholar] [CrossRef] [PubMed]
  113. Solecka, D.; Boudet, A.M.; Kacperska, A. Phenylpropanoid and anthocyanin changes in low-temperature treated winter ilseed rape leaves. Plant Physiol. Biochem. 1999, 37, 491–496. [Google Scholar] [CrossRef]
  114. Szal, B.; Jastrzębska, A.; Kulka, M.; Leśniak, K.; Podgórska, A.; Pärnik, T.; Ivanova, H.; Keerberg, O.; Gardeström, P.; Rychter, A.M. Influence of mitochondrial genome rearrangement on cucumber leaf carbon and nitrogen metabolism. Planta 2010, 232, 1371–1382. [Google Scholar] [CrossRef] [PubMed] [Green Version]
  115. Kunst, A.; Draeger, B.; Ziegenhorn, J. Colorimertic methods with glucose oxidase and peroxidase. In Methods in Enzymatic Analysis, Metabolites: Carbohydrates; Bergmeyer, H.U., Bergmeyer, J., Grassl, M., Eds.; Verlag Chemie: Weinheim, Germany, 1985; pp. 178–185. [Google Scholar]
  116. Bradford, M.M. A rapid and sensitive method for quantification of microgram quantities of protein utilizing the principle of protein-dye binding. Anal. Biochem. 1976, 72, 248–254. [Google Scholar] [CrossRef]
  117. Huber, S.C.; Akazawa, T. A nove1 sucrose synthase pathway for sucrose degradation in cultured cells. Plant Physiol. 1986, 81, 1008–1013. [Google Scholar] [CrossRef] [PubMed]
  118. Escobar, M.A.; Franklin, K.A.; Svensson, A.S.; Salter, M.G.; Whitelam, G.C.; Rasmusson, A.G. Light regulation of the Arabidopsis respiratory chain. Multiple discrete photoreceptor responses contribute to induction of type II NAD(P)H dehydrogenase genes. Plant Physiol. 2004, 136, 2710–2721. [Google Scholar] [CrossRef] [PubMed]
  119. Czechowski, T.; Stitt, M.; Altmann, T.; Udvardi, MK.; Scheible, W.R. Genome-wide identification and testing of superior reference genes for transcript normalization in Arabidopsis. Plant Physiol. 2005, 139, 5–17. [Google Scholar] [CrossRef] [PubMed]
  120. Pfaffl, M.W. A new mathematical model for relative quantification in real-time RT-PCR. Nucleic Acids Res. 2001, 29, e45. [Google Scholar] [CrossRef] [PubMed]
Figure 1. Phenotype of frostbite1 (fro1) or wild-type (WT) Arabidopsis ecotype C24 plants cultured hydroponically for 8 weeks on nutrient medium containing either 5 mM nitrate (NO3) or 5 mM ammonium (NH4+) as the only nitrogen source.
Ijms 19 02206 g001
Figure 2. Polysaccharide metabolism in leaves of frostbite1 (fro1) or wild-type (WT) Arabidopsis ecotype C24 plants cultured on NH4+ and NO3 as the only nitrogen source. (A) Content of glucose (Glc) and (B) Sucrose (Suc); (C) activity of hexokinase (HXK); (D) protein level of UDP-glucose pyrophosphorylase (UGPase) in leaf tissue extracts. Representative blot is shown. Values are the mean ± standard deviation (SD) of three biological and two technical replicates. Means with different letters are significantly different (p < 0.05) by ANOVA followed by Tukey’s test.
Ijms 19 02206 g002aIjms 19 02206 g002b
Figure 3. Cell wall characterization of leaf cells of frostbite1 (fro1) or wild-type (WT) Arabidopsis ecotype C24 plants cultured on NH4+ and NO3 as the only nitrogen source. (A) Cell wall visualization of individual palisade cells by Calcofluor White staining in CLSM (representative images are shown; scale bar = 20 µm); (B) cross-sectional cell area measured from 8 independent biological replicates; (C) cell wall thickness calculated from 10 independent images; (D) ratio of cell area to cell wall thickness; (E) transcript levels for Feronia (FER) and (F) Thesseus1 (THE1) determined from three biological and two technical replicates. Values are the mean ± standard deviation (SD). Means with different letters are significantly different (p < 0.05) by ANOVA followed by Tukey’s test.
Ijms 19 02206 g003
Figure 4. Cellulose metasbolism in leaves of frostbite1 (fro1) or wild-type (WT) Arabidopsis ecotype C24 plants cultured on NH4+ and NO3 as the only nitrogen source. (A) Cellulose levels measured in dried cell walls. Transcript level for (B) cellulose synthase (Ces) A1, (C) CesA3, (D) CesA6, (E) CesA4, (F) CesA7, (G) CesA8. Values are the mean ± standard deviation (SD) of three biological and two technical replicates. Means with different letters are significantly different (p < 0.05) by ANOVA followed by Tukey’s test.
Ijms 19 02206 g004
Figure 5. Lignin metabolism in leaves of frostbite1 (fro1) or wild-type (WT) Arabidopsis ecotype C24 plants cultured on NH4+ and NO3 as the only nitrogen source. (A) Lignin and (B) phenolic content in cell walls. Transcript level for (C) cinnamyl alcohol dehydrogenase (CAD) 1, (D) CAD4, (E) CAD5, and peroxidases (POX) related to cell wall lignification: (F) POX64 and (G) POX72. Values are the mean ± standard deviation (SD) of three biological and two technical replicates. Means with different letters are significantly different (p < 0.05) by ANOVA followed by Tukey’s test.
Ijms 19 02206 g005
Figure 6. Visualization of lesions on leaves of frostbite1 (fro1) or wild-type (WT) Arabidopsis ecotype C24 plants cultured on NH4+ and NO3 as the only nitrogen source. (A) Appearance of necrosis on leaf blades indicated by arrows and (B) necrosis stained with trypan blue. Representative leaf blades from three independent plant cultures are shown. Means with different letters are significantly different (p < 0.05) by ANOVA followed by Tukey’s test.
Ijms 19 02206 g006
Figure 7. Programmed cell death markers in frostbite1 (fro1) or wild-type (WT) Arabidopsis ecotype C24 plants cultured on NH4+ and NO3 as the only nitrogen source. Transcript levels for (A) Kiss-of-death (KOD); (B) Bax inhibitor 1 (BI-1) genes; (C) Cytochrome c (cyt c) protein level in isolated mitochondria and (D) transcript level for autophagy 5 (ATG5) gene. Values are the mean ± standard deviation (SD) of three biological and two technical replicates. Means with different letters are significantly different (p < 0.05) by ANOVA followed by Tukey’s test. Representative blot is shown.
Ijms 19 02206 g007
Figure 8. Extracellular ROS metabolism in frostbite1 (fro1) or wild-type (WT) Arabidopsis ecotype C24 plants cultured on NH4+ and NO3 as the only nitrogen source. (A) Visualization of leaf H2O2 content by 3,3-diaminobenzidine (DAB) staining in the presence or without diphenylene iodonium chloride (DPI). Representative results are shown. Transcript level for (B) peroxidase 33 (POX33) and (C) oxidation-related zinc finger 1 (OZF1). Values are the mean ± standard deviation (SD) of three biological and two technical replicates. Means with different letters are significantly different (p < 0.05) by ANOVA followed by Tukey’s test.
Ijms 19 02206 g008
Figure 9. Marker genes for sugar signaling in frostbite1 (fro1) or wild-type (WT) Arabidopsis ecotype C24 plants cultured on NH4+ and NO3 as the only nitrogen source. (A) Transcript levels for hexokinase 1 (HXK1) and (B) sucrose non-fermenting 1–related kinase 1 (SnRK1.1). Values are the mean ± standard deviation (SD) of three biological and two technical replicates. Means with different letters are significantly different (p < 0.05) by ANOVA followed by Tukey’s test.
Ijms 19 02206 g009
Figure 10. Carbohydrate metabolism in frostbite1 (fro1) mutants lacking complex I (CI), when cultured on NH4+ or NO3 as the sole nitrogen source. Sucrose, the major fixed carbon in plants, is channeled toward sugar catabolism via hexokinase (HXK) activity to generate hexose-phosphates (Hexose-P). Further, the glycolytic or pentose phosphate (PP) pathways provide reductants that can be oxidized in the mitochondrial electron transport chain (mtETC) to produce ATP. Alternatively to dissipation of reductants in the mtETC, high NAD(P)H expenditure is necessary for NO3 assimilation catalyzed by nitrate reductase (NR). As indicated by grey arrows both energy fluxes are required to maintain the growth of fro1 plants on NO3. In contrast, when fro1 is grown on NH4+, the reaction catalyzed by NR is omitted, resulting in a surplus of reductants. Therefore, the lower energy flux towards energy synthesis in fro1 during NH4+ nutrition, allows sugars to be available for cell wall synthesis indicated as green arrow. Cytosolic sugars can provide a substrate for sucrose synthase (SuSy) or UDP-glucose phosphorylase (UGPase) to produce UDP-Glc, which is a precursor for cellulose synthesis. The cellulose synthetizing complex at the plasma membrane (containing cellulose synthase subunits, CesA) is responsible for the incorporation of carbohydrates into the cell wall.
Ijms 19 02206 g010

