Article

Transcriptome Analyses from Mutant Salvia miltiorrhiza Reveals Important Roles for SmGASA4 during Plant Development

College of Life Sciences, Nankai University, Tianjin 300071, China
*
Authors to whom correspondence should be addressed.
Int. J. Mol. Sci. 2018, 19(7), 2088; https://doi.org/10.3390/ijms19072088
Submission received: 22 June 2018 / Revised: 13 July 2018 / Accepted: 13 July 2018 / Published: 18 July 2018
(This article belongs to the Section Molecular Plant Sciences)

Abstract

:
Salvia miltiorrhiza (S. miltiorrhiza) is an important Chinese herb that is derived from the perennial plant of Lamiaceae, which has been used to treat neurasthenic insomnia and cardiovascular disease. We produced a mutant S. miltiorrhiza (MT), from breeding experiments, that possessed a large taproot, reduced lateral roots, and defective flowering. We performed transcriptome profiling of wild type (WT) and MT S. miltiorrhiza using second-generation Illumina sequencing to identify differentially expressed genes (DEGs) that could account for these phenotypical differences. Of the DEGs identified, we investigated the role of SmGASA4, the expression of which was down-regulated in MT plants. SmGASA4 was introduced into Arobidopsis and S. militiorrhiza under the control of a CaMV35S promoter to verify its influence on abiotic stress and S. miltiorrhiza secondary metabolism biosynthesis. SmGASA4 was found to promote flower and root development in Arobidopsis. SmGASA4 was also found to be positively regulated by Gibberellin (GA) and significantly enhanced plant resistance to salt, drought, and paclobutrazol (PBZ) stress. SmGASA4 also led to the up-regulation of the genes involved in salvianolic acid biosynthesis, but inhibited the expression of the genes involved in tanshinone biosynthesis. Taken together, our results reveal SmGASA4 as a promising candidate gene to promote S. miltiorrhiza development.

1. Introduction

S. miltiorrhiza is considered the model Chinese medicinal plant. The demand for S. miltiorrhiza in both Asia and Western countries is large due to its documented therapeutic benefits. The roots and rhizomes of S. miltiorrhiza are used to treat neurasthenic insomnia, cardiovascular disease, cerebrovascular disease, hyperlipidemia, and acute ischemic stroke [1,2]. The active ingredients of S. miltiorrhiza can be divided into two groups, namely: (1) lipid-soluble tanshinones including tanshinone I, tanshinone IIA and tanshinone IIB, cryptotanshinone, dihydrotanshinone I; (2) hydrophilic phenolic acids, including rosmarinic acid, salvianolic acid B, lithospermic acid and dihydroxyphenyllactic acid, phenolic acid that displays antibacterial, anti-oxidative, and antiviral activity [3,4]. The medical component of S. miltiorrhiza is primarily concentrated on the surface of its roots. The biosynthetic production of these therapeutic compounds has been extensively studied in S. miltiorrhiza, but few reports have focused specifically on the root development [5,6]. Improving the current protocols to maximize S. miltiorrhiza development is therefore important. Several external factors are known to influence S. miltiorrhiza root development, including the NH4+:NO3 ratio [7] and the inclusion of the fungus Alternaria sp. A13, which markedly enhances S. miltiorrhiza root growth [8]. However, the genetic requirements that regulate S. miltiorrhiza growth in vivo are less well understood. In this regard, we previously identified mutant plants (MT) produced during the breeding experiments that possessed large taproots (2.85 times of the wild type (WT)) reduced lateral roots (0.44 times lateral root number of the WT), the ratio of lateral root compare with taproot (MT 18.75%, WT 55.36%) and defective flowering, the MT with defect corolla and stamen, and can’t form normally. We reasoned that the identification of the genetic basis for this MT phenotype may reveal the genetic factors that contribute to root development which could be used to direct future S. miltiorrhiza breeding strategies [9,10].
Several transcriptome analyses have been performed in S. miltiorrhiza that were designed to identify the biosynthetic processes that regulate the production of bioactive compounds in a range of tissues, or in response to specific induction stimuli [11,12]. However, the transcriptome analysis that focuses on root development and root-specific compound production is less well understood.
GASA (Gibberellic Acid-Stimulated Arabidopsis) belongs to the family of cysteine-rich peptides (CRPs) [13]. GASA is widely distributed among plant species displaying organ specific tissue expression and temporal specificity. The subcellular localization of GASA varies amongst the different plant members, but it is thought to primarily distribute to the cell wall [14], and is regulated by GA [15]. GAST1 (GA-stimulated transcript 1) was the first identified gene; gib1 is a GA receptor loss mutant and its expression was induced by the application of exogenous gibberellin [11]. The GASA gene family has also been identified in Petunia hybrid [14], Arabidopsis thaliana [12,16], Solanum tuberosum [17,18], and Oryza sativa [19]. The GASA genes products play an important role in plant seed germination [20], lateral root formation [21], stem length [22,23], flowering [23,24], flower and fruit development [25], biotics [26,27], abiotic stress [12,28], and the ability to respond to and translate phytohormone signals [28].
The GASA genes contain conserved stretches of 12 cysteine residues [11,29], which are thought to be required for the generation of the structural elements that regulate protein–protein interactions [14]. In addition, up to five disulfide bridges can form across these cysteine rich regions [30], potentially regulating the redox status [30]. The loss of these cysteine stretches leads to a loss of GASA structural integrity and function [31,32]. The GASA promoter sequence includes 1–4 GARE (Gibberellin Acid Response Element) components and 1–5 ABRE (Abscisic Acid Response Element), which participate in the GA and ABA pathways, respectively. This implies that the GASA expression is regulated by both GA and ABA [12]. GA promotes plant growth and development, flowering, and capsule formation, and, in synergy with auxin, can regulate Populus root growth and development [29]. GASA is a downstream target of GA [33], which is regulated through the DELLA (GA Insensitive-GAI and RGA) protein dependent and independent mechanisms.
Analyses of the GASA1, GASA3, GASA4, GASA8, GASA10, and GASA14 promoters reveals their activity in root tissue and the vasculature, although through distinct spatial and temporal patterns. Roles in other tissues, including meristems, flowers, and seeds, have also been reported. AtGASA4 regulates the flower stem tissue [32], promotes lateral root formation [17,18], positively regulates seed size and products, and promotes seed germination through GA activation. The overexpression of AtGASA4 in Arobidopsis reduces ROS (reactive oxygen species) accumulation and promotes GA activity during the H2O2 response [31]. The overexpression of AtGASA14 in Arobidopsis also inhibits oxygen accumulation, and plants with gasa14 mutations show sensitivity to NaCl and ABA [14]. Using yeast hybrid screens, Ceserani et al. demonstrated the interaction of AtGASA4 and AtGASA14 with cytoplasmic structures, implicating their involvement during plant growth [34].
Approximately 12,824 CRP (cysteine rich peptides) genes have been identified in 33 species, and 445 of these genes code for GASA/Snakin proteins [11]. Despite this knowledge, in vivo studies on the functional relevance of these genes is lacking. Although the GASA family of genes are important to plants, their roles in S. miltiorrhiza remain poorly characterized. In this study, to reveal the mechanism of the MT phenotype and to identify new S. miltiorrhiza breeding genes, we employed RNA-seq to comparatively analyze the functional complexity of the S. miltiorrhiza transcriptome in WT vs. MT plants. We identified a GASA family gene termed SmGASA4, from the S. militiorrhiza transcriptome that encodes a 110-amino acid protein, the expression of which is inhibited in MT plants. Herein, we have introduced SmGASA4 into Arobidopsis and S. militiorrhiza under the control of a CaMV35S promoter, to verify its role during GA stimulation, drought, salt, and paclobutrazol (PBZ) stress, and as a secondary metabolism. We aimed to reveal the in vivo functions of SmGASA4 and its potential benefits to S. militiorrhiza breeding.

2. Results

2.1. Transcriptome Analysis of S. militiorrhiza

2.1.1. Illumina Sequencing and De Novo Assembly

To gain a comprehensive overview of the root development in S. miltiorrhiza, we performed a transcriptome analysis of WT and MT plants. To enhance the data stability, biological repeats of each of the samples were performed. The samples were sequenced using an Illumina HiSeq™ 2500 with the production of 100 bp paired-end reads. After stringent data filtering and quality assessment, 27,255,174 clean paired-end reads were produced from the MT, as well as 30,598,611 reads from the WT plants (Table S1). The Q30 (probability of incorrect base call <1‰) percentages and GC percentages are illustrated in Table S1, which showed Q30 percentages of 91.58% (MT) and 91.83% (WT) (Table S1). We acquired 11.69 GB of high quality clean-data from the two libraries, assessed 50,587 Unigenes through the Trinity program assemble, and achieved N50 lengths of 1540 bp (MT) and 1610 bp (WT). The mean lengths were 908.75 bp for the MT, and 901.36 bp for the WT plants (Figure S1, Table S2).
The matched sequences were analyzed using the unified Transcript or Unigenes library. We obtained 27,255,174 clean reads and 21,538,490 (79.02%) mapped reads from the MT plants, and 30,598,611 clean reads and 24,135,294 (78.87%) mapped reads from the WT plants (Table S3).

2.1.2. Unigene Annotation and Functional Classification

The unigenes from the MT and WT samples were aligned to the non-redundant (nr), Swiss-Prot, gene ontology (GO), Clusters of Orthologous Groups (COG), euKaryotic Orthologous Groups (KOG), and Kyoto Encyclopedia of Genes and Genomes (KEGG) databases. We used BLAST software with parameter E-values less than 10−5 and HMMER (Biosequence analysis using profile hidden Markov Models) parameter E-values less than 10−10 to investigate the function. Once complete, the Unigene amino acid predictions were performed using HMMER software to compare the Unigene sequences with the Pfam libraries to achieve the Unigene annotated information. Among the 50,587 unigenes, 30,000 (59.3%) were annotated and 20,587 were not-documented. This may be due to technical limitations, including read length and sequencing depth, or the specificity of the S. miltiorrhiza genes. Amongst the annotated unigenes, 10,115 (20%), 20,532 (40.6%), 6337 (12.5%), 17,343 (34.3%), 21,674 (42.8%), 21,304 (42.1%), and 29,805 (58.9%) were annotated in the COG, GO, KEGG, KOG, Pfam, Swiss-Prot, and nr databases, respectively (Table S4).
We analyzed the unigene expression in the WT and MT plants using DESeq software, by normalizing the values to Fragments Per Kilobase Million (FPKM). We used the Benjiamini–Hochberg method to verify and revise the p-values. Using FDR values of <0.01, the fold-changes (FC) ≥ 2 were classed as differentially expressed genes. The comparison of WT and MT plants revealed 3714 up-regulated genes and 1371 down-regulated genes (Table S5). Volcano plots were created to demonstrate the fold changes in the expression and statistical comparisons (Figure 1a). MA (Minus Average) plot was used to assess the gene expression abundance and the differences in the whole distributions between the samples (Figure 1b). There were 4761 differentially expressed genes (DEGs) that were annotated in the volcano plot and MA. When comparing the WT and MT plants, 3440 up-regulated as opposed to 1321 down-regulated genes were identified. The hierarchical clustering analysis was used to screen the DEGs and cluster them according to the expression behavior under different experimental conditions (Figure 2). From the comparison of the DEG categories, 3714 were down-regulated and 1371 were up-regulated after the WT mutated to MT (Table S5).
The global functional analysis of the DEGs was performed using GO annotation with Blast2GO, in order to derive ‘cellular components’, ‘molecular functions’, and ‘biological processes’. In the WT and MT comparisons, ‘cell parts’, ‘cell’, and ‘organelles’ were the top three categories involved in the ‘cellular components’; in the ‘molecular function’ category, ‘catalytic activity’, ‘binding’, and ‘transporter activity’ revealed the biggest differences; in the ‘biological processes’ category, the ‘metabolic processes’, ‘cellular processes’, and ‘single-organism processes’ showed the largest differences. (Figure 3).

2.1.3. COG Enrichment and KEGG Pathway Analysis of DEGs

The COG (Cluster of Orthologous Groups) of proteins database is based on bacteria and algae. The eukaryotic system evolutionary relationships built using the COG database can classify the orthologous gene products. The top four categories for DEGs are (1) general function prediction only; (2) signal transduction mechanisms; (3) transcription; and (4) replication, recombination, and repair (Figure S2). These can be used to indicate the differences in the transcription factors and/or metabolic activity.
When in vivo, the gene products perform their biological functions through a series of interactions. The DEGs identified were next assessed using the KEGG (Kyoto Encyclopedia of Genes and Genomes) libraries to determine their higher-level functions and utilities in the biological system. From the identified DEGs, the database included 38 terms for ‘plant hormone signal transduction’ and 35 terms for ‘plant-pathogen interactions’ (Figure 4), which indicate that plant hormones may represent a key difference between the WT and MT plants. Furthermore, the ‘phenylpropanoid, tyrosine, and tryptophan biosynthesis’, ‘flavinoid biosynthesis’, and ‘nitrogen metabolism’ pathways displayed a high KEGG enrichment (Figure S3).
From our analysis, we have speculated that phytohormone may contribute to the differential phenotypes of the WT and MT plants. Coincidently, a 10-fold increase in the CL13560contigle (SmGASA4) expression was observed in the WT, compared to the MT plants (WT =1759 vs. MT = 173) (Table S6). Using NCBI, SmGASA4 was found to possess a GASA conserved domain. GASA is an important GA regulated gene that contributes to root and flower development. This was the only DEG related to phytohormones that was identified from our analysis.

2.1.4. Validation of DEGs by qRT-PCR Analysis

To validate our expression profiling, 18 DEGs were randomly selected and their expression was assessed by qRT-PCR (real-time quantitative PCR). Our results indicated identical patterns of expression for all of the 18 DEGs validating the transcriptome datasets (Figures S4 and S5).

2.2. Investigating the Role of SmGASA4 in Arobidopsis and S. miltiorrhiza

2.2.1. Transgenes Expression in Arobidopsis and S. miltiorrhiza

To examine the role of SmGASA4, plasmids for its exogenous expression in Arobidopsis and S. miltiorrhiza were produced. Under the control of the constitutive CaMV35S promoter, p35S::SmGASA4 (Figure 5) were constructed. A total of four independent transgenic lines of Arobidopsis were obtained through the Basta-resistant screening and molecular identification (the SmGASA4 primers are shown in Table S7). Three trans-gene lines, termed SmGASA4-1, SmGASA4-3, and SmGASA4-4, showed high levels of expression (Figure S6a), and the T4 homozygous overexpression plants were produced through a three generation purify. Four independent Basta-resistance lines of S. militiorrhiza were identified (the SmGASA4 combination of primers are shown in Tables S7 and S8) and used to produce three further lines, termed SmGASA4-1, SmGASA4-3, SmGASA4-4. All were confirmed to be positive for the transgene (Figure S6b).

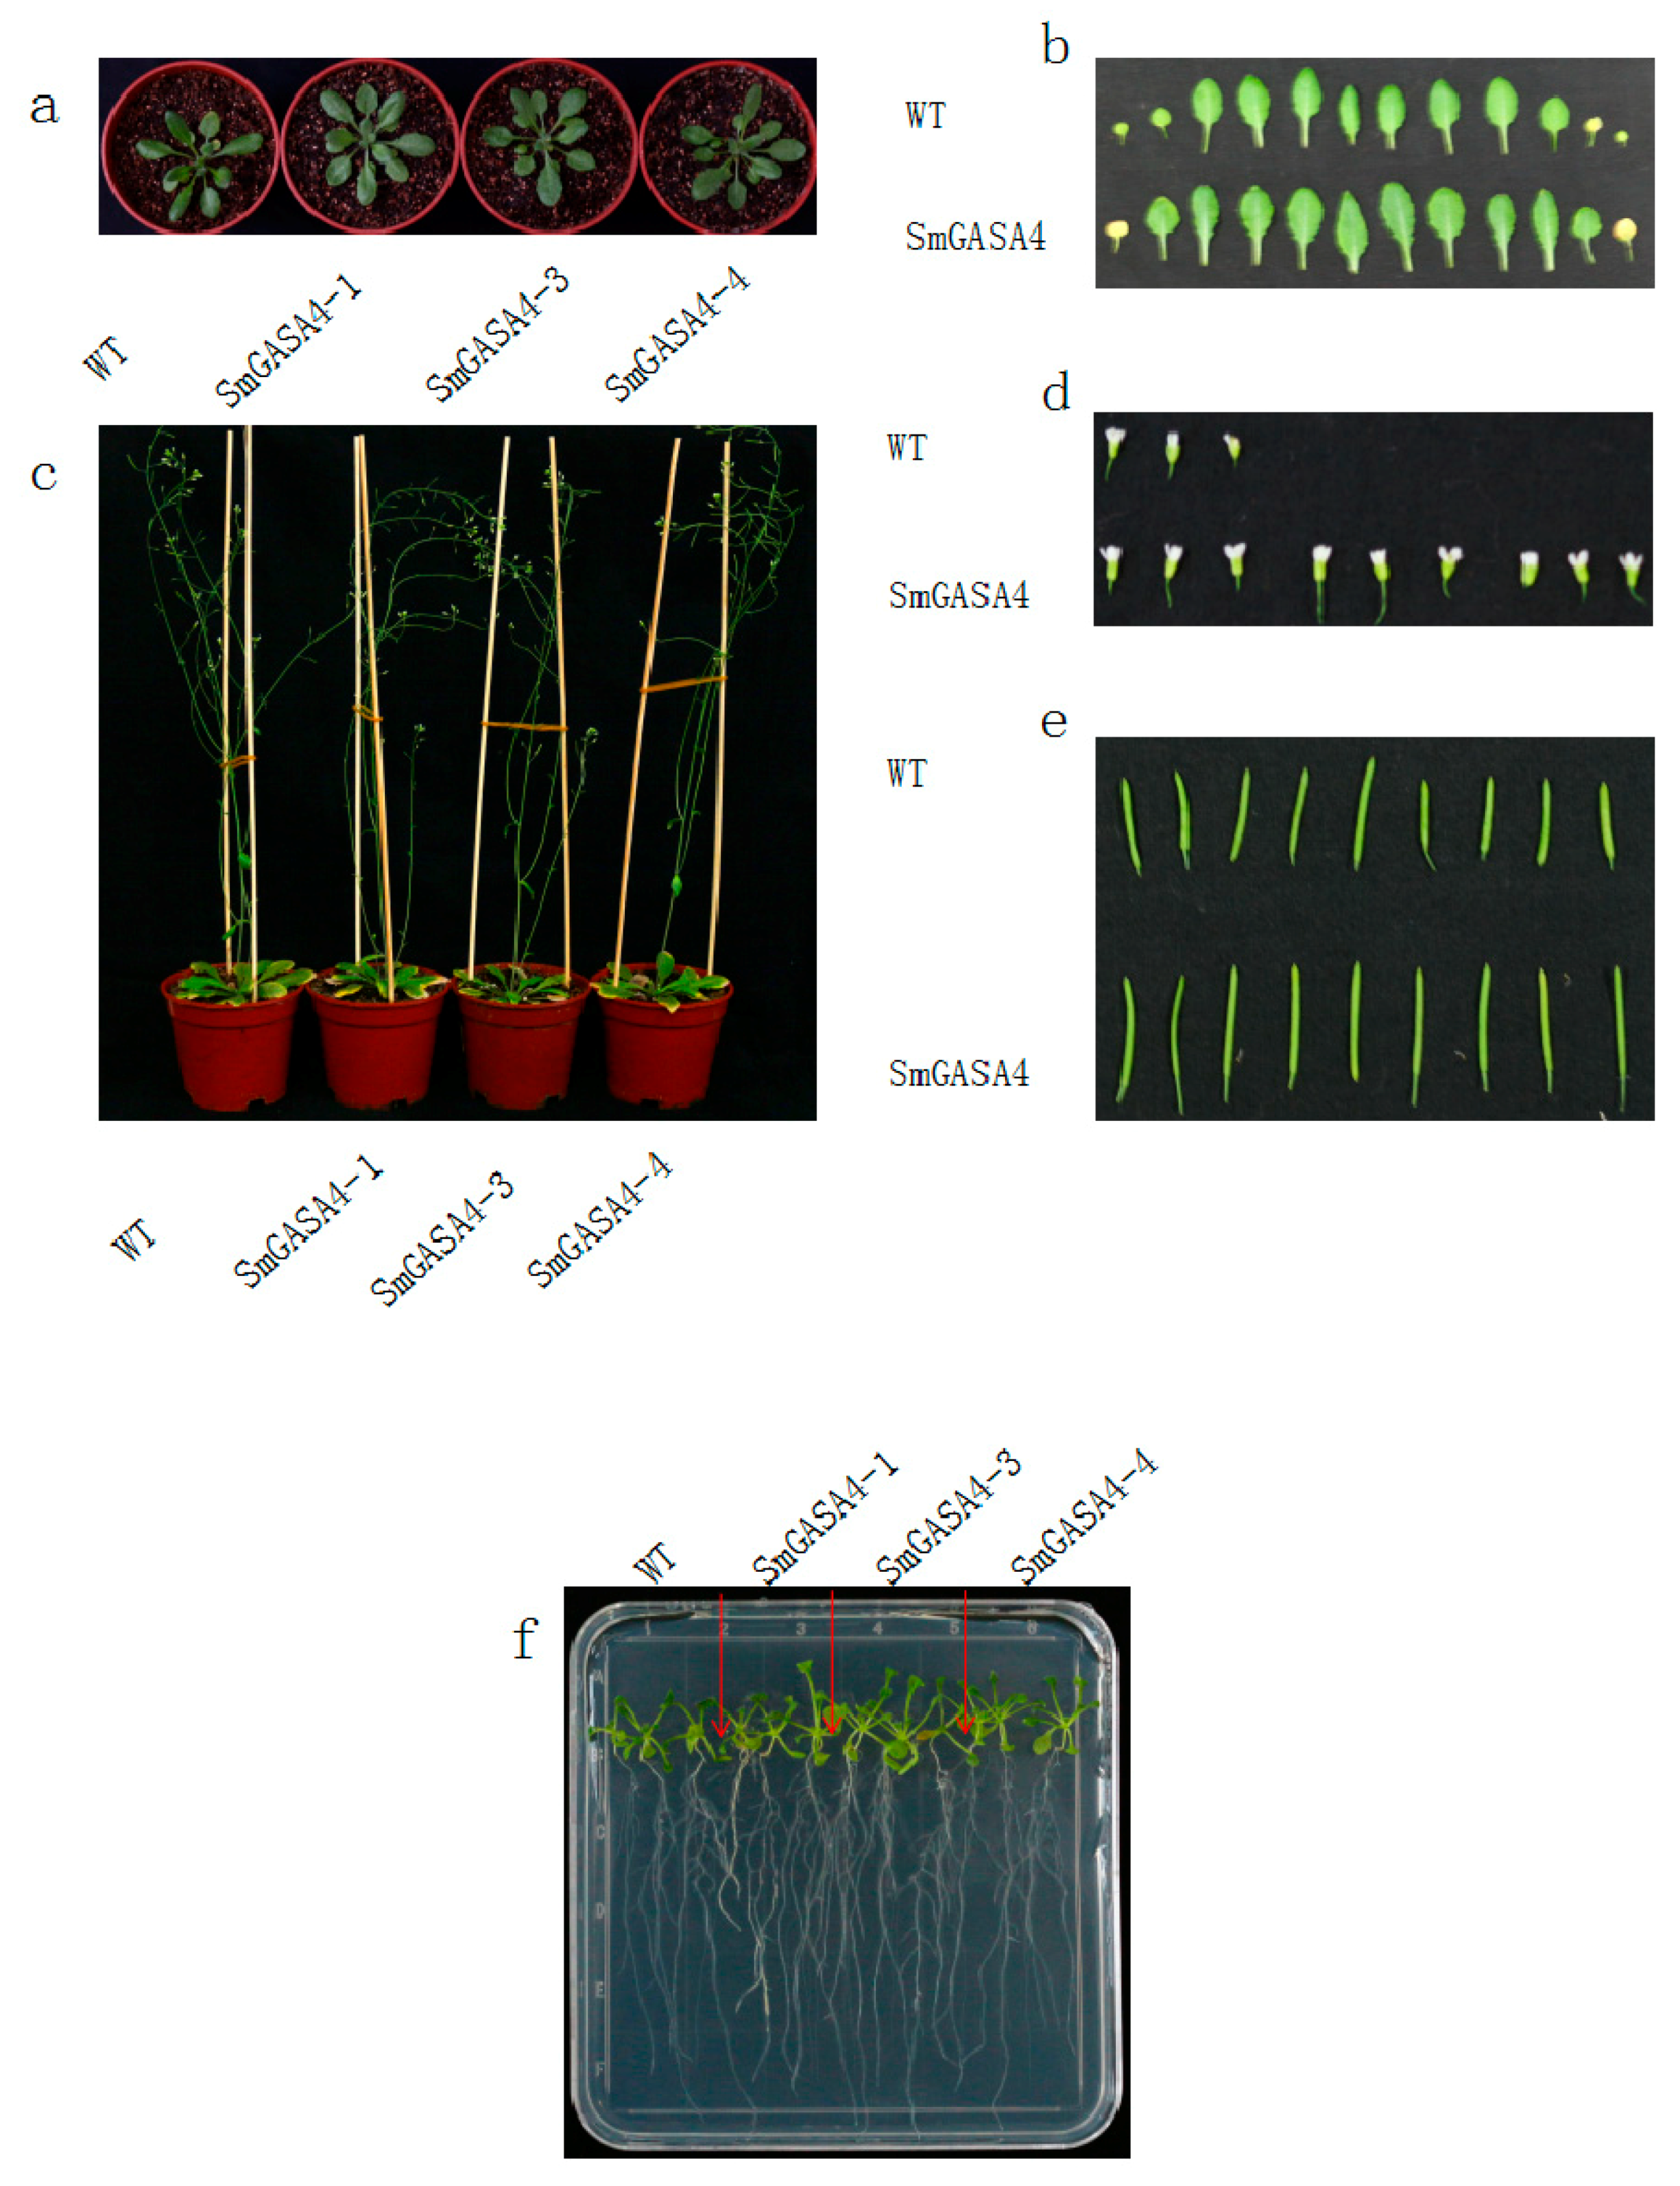
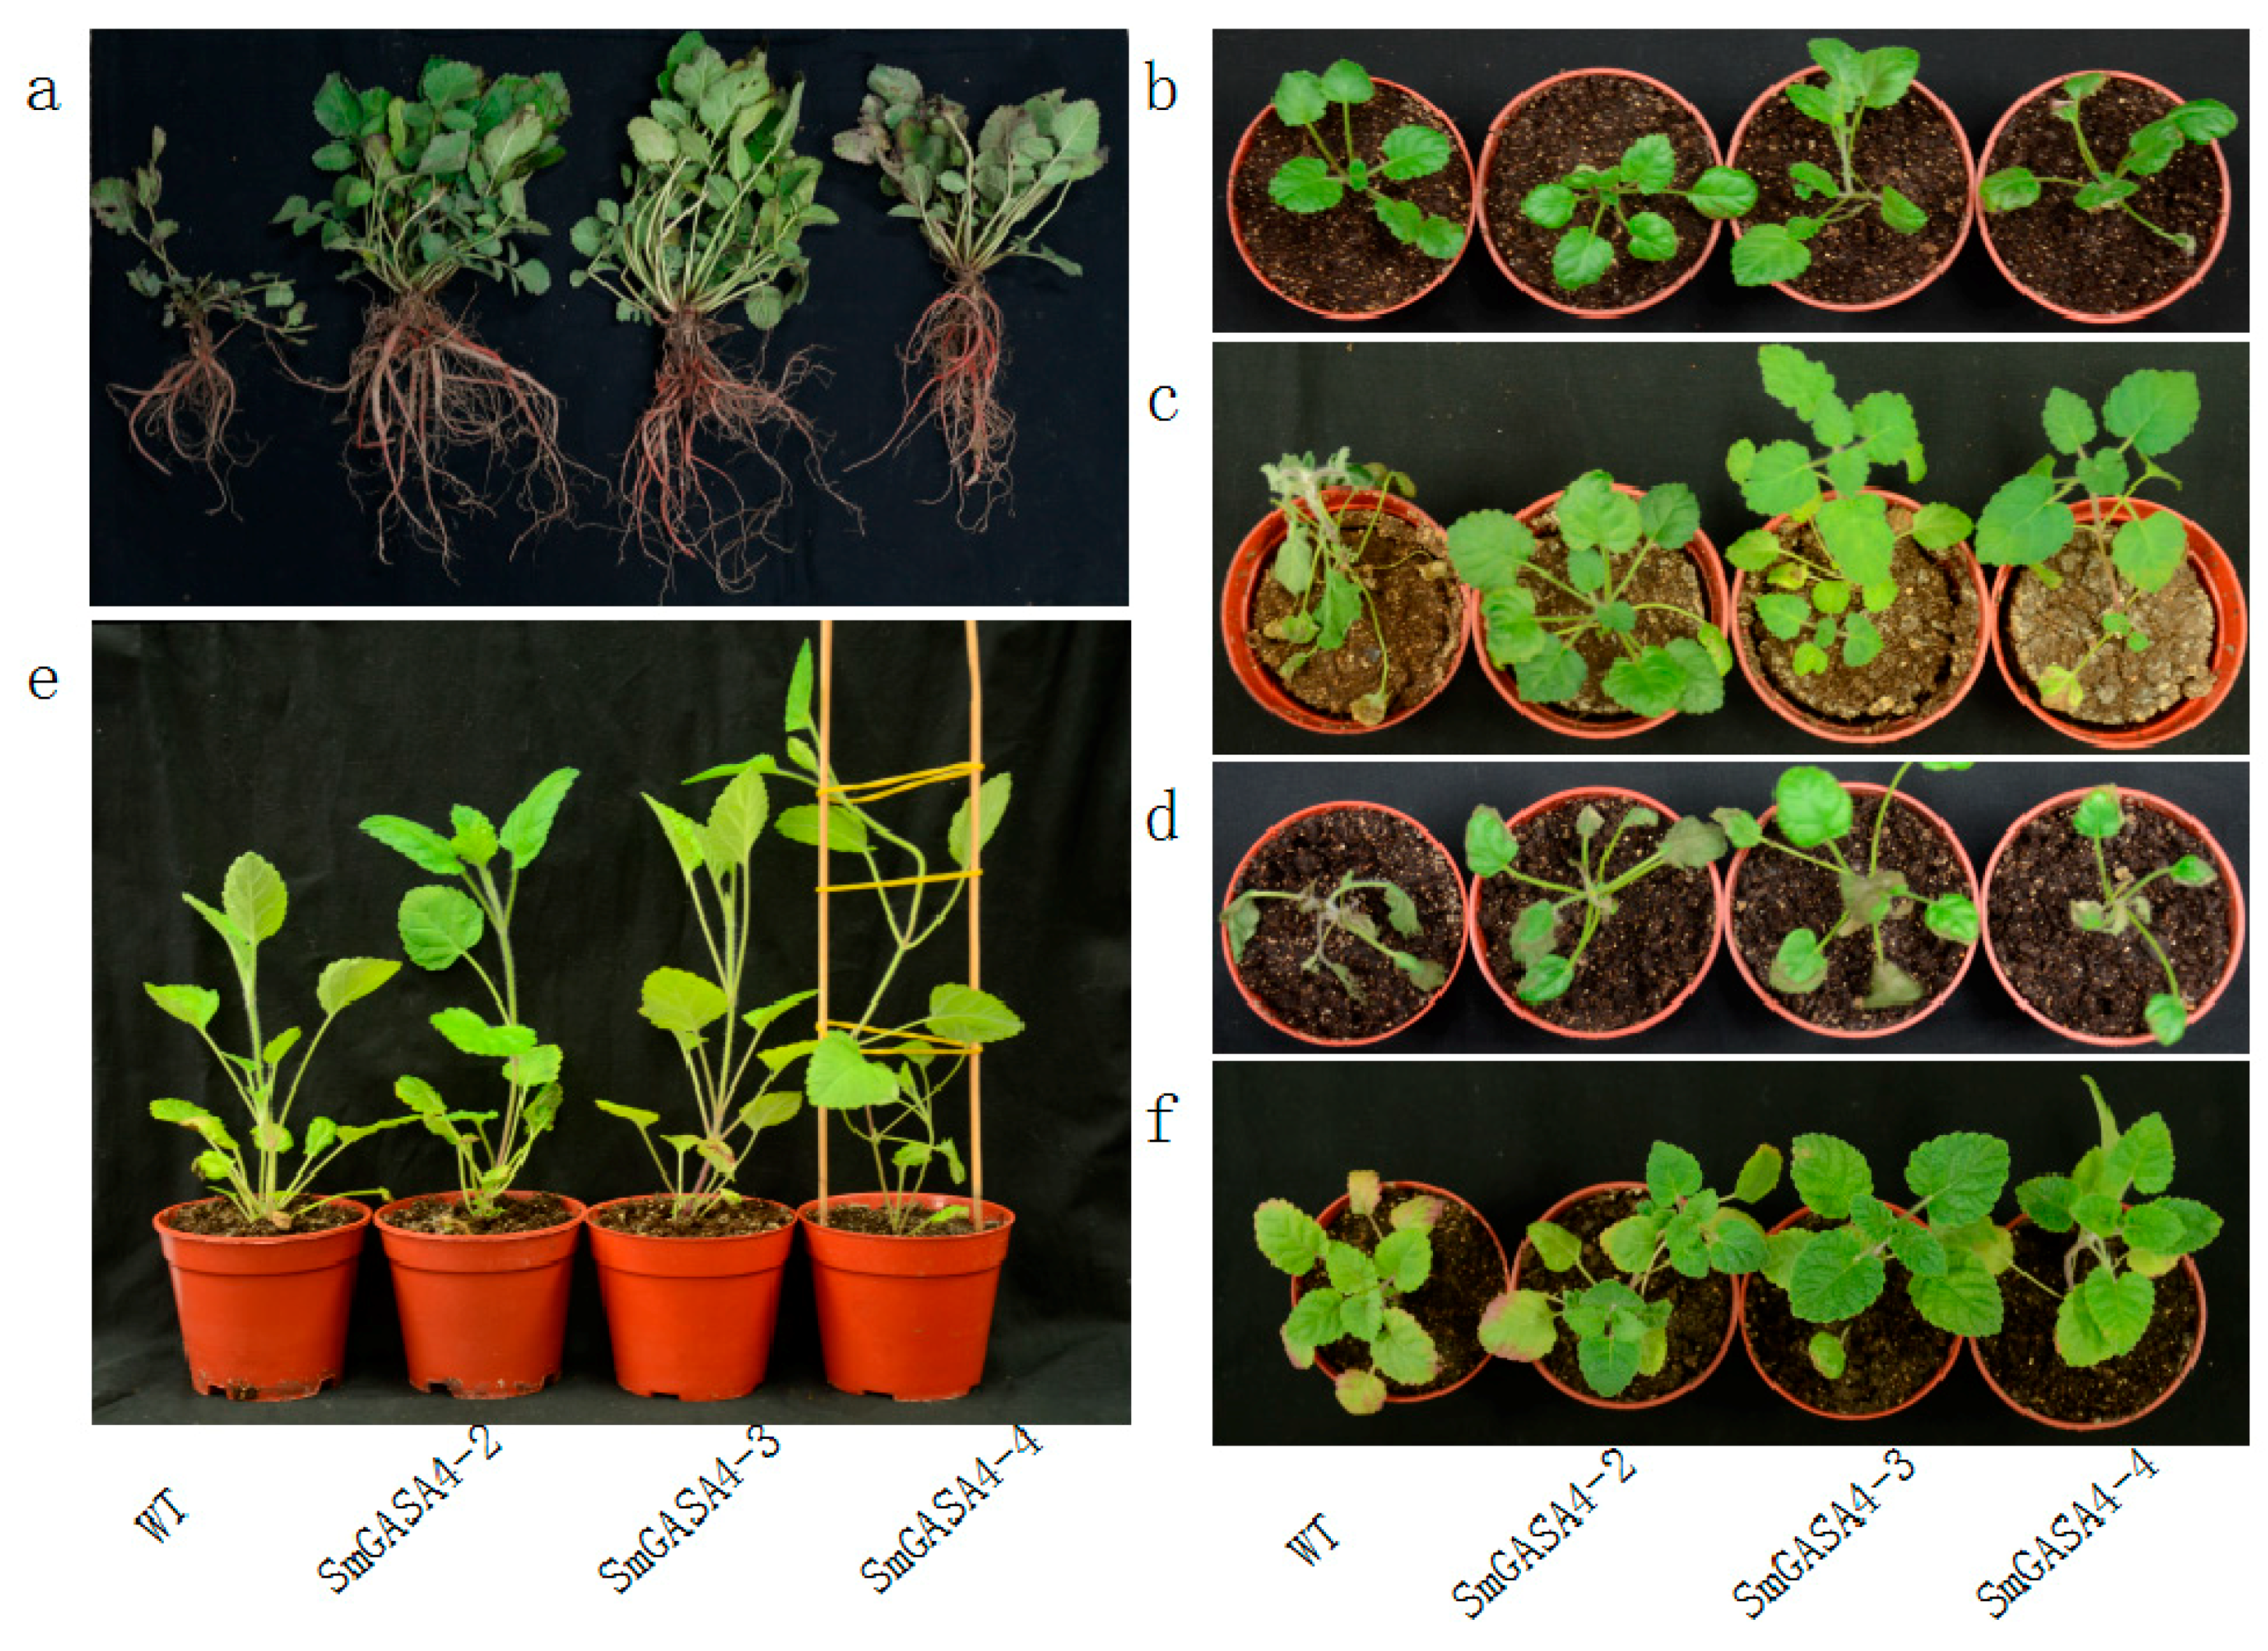
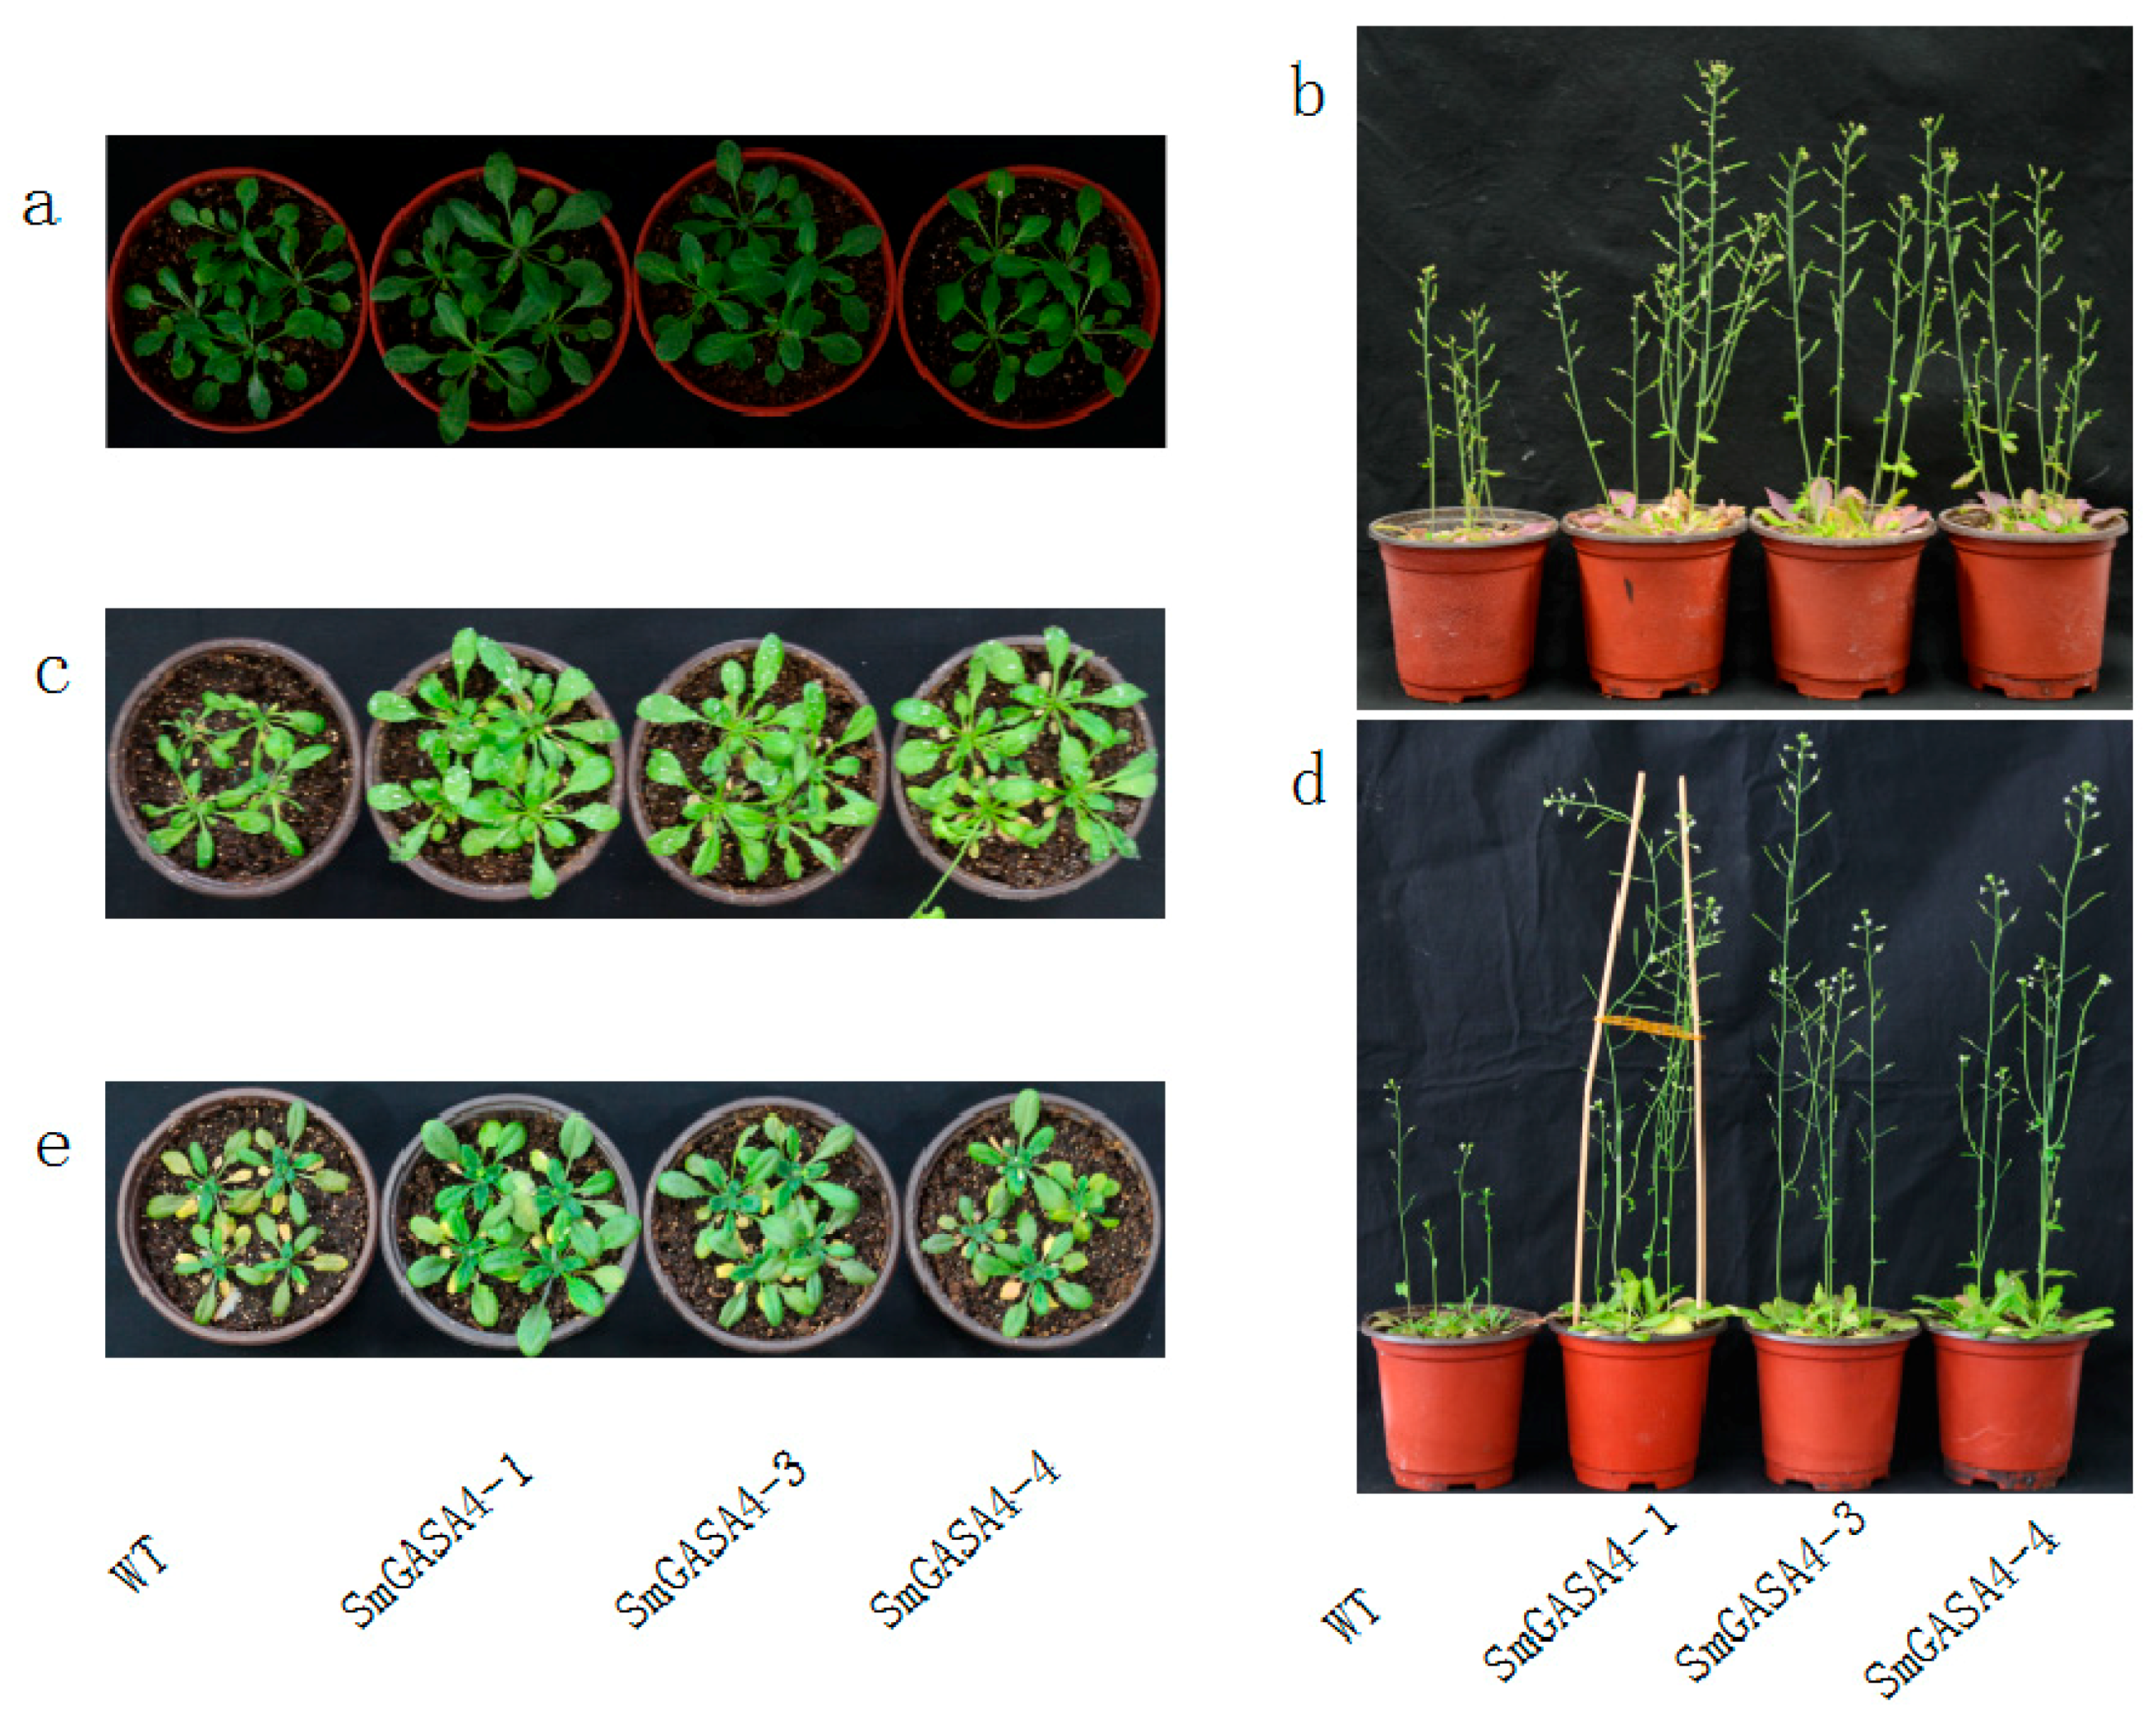
2.2.2. SmGASA4 Arobidopsis and S. miltiorrhiza Phenotypic Observations

Arobidopsis typically grow 12–14 leaflets before bolting (Figure 6a). These leaflets were larger in the SmGASA4-Arobidopsis plants compared to the WT plants (Figure 6b). This suggested that SmGASA4 promotes Arobidopsis growth during the seedling stage. No significant differences in either the plant height or leaflet size were observed between the WT and SmGASA4 plants when the Arobidopsis had matured (Figure 6c). When the blossom periods of the WT and SmGASA4 Arobidopsis flowers were compared (Figure 6d), the SmGASA4 flowers were larger (SmGASA4 Arobidopsis mature capsules were 1.25 times larger than the WT) (Figure 6e). In the MS (Murashige and Skoog) culture medium, the SmGASA4-Arobidopsis possessed larger lateral root densities than the WT (Figure 6f). The overexpression of SmGASA4 in S. miltiorrhiza led to larger taproots (fold increase over WT: 1.92), and the lateral root number and length were also larger in SmGASA4-S. miltiorrhiza (fold increase over WT: 1.76 and 2.13, respectively) (Figure 7a).

2.2.3. Overexpression of SmGASA4 and Its Effects on Plant Drought Stress

We next investigated whether the overexpression of SmGASA4 can promote Arobidopsis tolerance to drought. WT and SmGASA4-Arobidopsis plants were subjected to identical periods of drought stress, and the plant growth was assessed (Figure 8a). During drought-stress, the SmGASA4-Arobidopsis growth was largely unaffected, whist the WT growth and development were severely inhibited. After 30 day of drought stress, the overexpression of the SmGASA4 was found to complement the Arobidopsis life cycle, whilst the WT plants displayed a dwarf phenotype (Figure 8b). The overexpression of SmGASA4 also led to a 1.54-fold increase in the plant height compared with WT, and an increased capsule number was observed (2.46-fold increase over WT). When the plants were grown in a 400 mmol/L mannitol MS solid culture medium, both the WT and SmGASA4 growth and leaflet production were severely inhibited, but the root growths were prosperous (Figure S7a). The overexpression of SmGASA4 still produced plants with improved growth conditions and lager lateral root densities than the WT plants (root length is 1.68 times that of the WT), which tended to wither in these conditions.
Across an identical timeframe, when the WT and SmGASA4 S. miltiorrhiza where compared (Figure 7b), the WT plants began to wilt after 28 day of drought stress, which accelerated to complete wilting on day 30. In contrast, no obvious changes as well as a lack of wilting were observed in the SmGASA4 plants (Figure 7c). Following the water recovery, both the WT and SmGASA4 plants displayed a normal recovery. These data suggest that the effects of SmGASA4 overexpression during drought stress are similar between S. miltiorrhiza and Arobidopsis.

2.2.4. Overexpression of SmGASA4 and Its Effects on Plant Salt Stress

To investigate whether SmGASA4 can promote plant tolerance to salt, plants were sprayed with 200 mmol/L NaCl solution and the phenotypical differences in the growth characteristics of WT and SmGASA4-Arobidopsis were compared. After 10 day of salt stress, the WT plants displayed wilting, which was less apparent in the SmGASA4 plants (Figure 8c). When 100 mmol/L NaCl was included in the culture medium, both the WT and SmGASA4 plant leaflets narrowed and reduced lateral root lengths were observed (Figure S7b). These reductions were less apparent in the SmGASA4 plants, which were larger than their WT counterparts. After 3 day spray with 250 mmol/L NaCl, the WT plants began wilting (Figure 7d), and both the WT and SmGASA4 S. miltiorrhiza leaves were severely damaged. These data suggest that, in both S. miltiorrhiza and Arabidopsis, the SmGASA4 expression can improve the plants’ responses to salt stress.

2.2.5. Overexpression of SmGASA4 and Plant GA3 Responses

After 16 day of water and spraying with 200 μmol/L GA3 solution, the height of SmGASA4-Arobidopsis was 2.63-fold higher than the WT plants, and the capsule number increased by 9.17-fold, compared with the WT (Figure 8d). The overexpression of the SmGASA4 gene also led to an increased stem length and early blooming times. It should be noted that the WT stem length and height were increased by GA3, and the effects were not as pronounced as those of the SmGASA4 plants, consistent with the known effects of GA on SmGASA4. When 100 μmol/L GA3 was added to the culture medium, the SmGASA4 Arobidopsis plants displayed more leaflets and larger increases in lateral root density than the WT plants. The SmGASA4 plants also displayed flowering and bolting at earlier timepoints (Figure S7c). After 29 day of 200 μmol/L GA3 spraying, the overexpression of SmGASA4 in the S. miltiorrhiza plants led to increased plant heights and longer stems than the WT plants (Figure 7e). SmGASA4 S. miltiorrhiza displayed slight changes in leaf color, most likely attributed to their rapid growth characteristics. These results confirm constitutively that the expression SmGASA4 can promote plants’ responses to GA3 treatment in both S. miltiorrhiza and Arabidopsis.

2.2.6. Overexpression of SmGASA4 and Its Effects on PBZ Induced Stress

PBZ is a potent inhibitor of plant growth due to its ability to inhibit GA biosynthesis. After 10 day of water and spraying with 100 μmol/L PBZ, the growth of the WT and SmGASA4 Arobidopsis plants was severely inhibited (Figure 8e). The SmGASA4 Arobidopsis plants displayed reduced stem lengths and deep color changes within the leaflets, with lesser purple of leaf bottoms, which began to transition to yellowness. The WT plants, by comparison, had a tendency to die following PBZ treatment. When 100 μmol/L PBZ was included in the culture medium, the SmGASA4 Arobidopsis plants survived longer than their WT counterparts, and whilst some plant death was evident, several SmGASA4 Arobidopsis plants maintained their green leaflets and remained alive (Figure S7d). After 30 day of 300 μmol/L PBZ spraying, both the WT and SmGASA4 S. miltiorrhiza stem lengths were reduced, but the leaflet formation was normal and bolder leaf veins were evident in the SmGASA4 plants (these veins were more pronounced than the plants grown under normal conditions). The WT plants had more abundant purple/yellow transitions in the bottom leaflets, shorter stems, and a reduced plant height compared with the SmGASA4 plants. Taken together, these data suggest that resistance to PBZ-induced plant death is conferred by SmGASA4 overexpression (Figure 7f).

2.2.7. Effects of SmGASA4 Overexpression on Secondary Metabolism

We next assessed the effects of SmGASA4 overexpression on the key genes involved in the tanshinone and phenolic acid biosynthetic pathways. qRT-PCR was performed in the WT and SmGASA4 plants (Table S9), and the results were analyzed using iQ5 software (Figure S8). The qRT-PCR data revealed that the SmGASA4 expression led to a downregulation of AACT, HMGS, MK, PMK, MDS, DXS, DXR, MCT, and MCS; a modest upregulation of HMGR and CMK; and no significant differences to the HDS and HDR genes expression. Thus, it is apparent that SmGASA4 inhibits the tanshinone biosynthetic pathway. For the genes involved in the phenolic acid biosynthetic pathway, 4CL1, C4H1, CPR1, HPPR1, PAL1, RTGus, and TATA1 were all significantly up-regulated by the expression of SmGASA4, suggesting that it promotes phenolic acid synthesis. Taken together, these data indicate that the SmGASA4 expression can influence the secondary metabolism in S. miltiorrhiza, most notably enhancing the genes involved in phenolic acid biosynthesis.

3. Discussion

The medicinal benefits of S. miltiorrhiza mainly originate from the root surface. This has been well documented, with gene products that can alter metabolism, biosynthesis, and stress resistance reported [35,36]. Few studies have, however, focused on methods to improve root development, which would present obvious benefits to the biomass production of the medicinal components [7,8]. Here, we have performed transcriptome analyses in the MT plants that display one less lateral root as well as defects in flowering. After completing the sequencing of the genomes of the WT and MT, we obtained 11.69 GB of data (Table S1), 50,587 unigenes, WT 37,387 unigenes, and MT 34,416 unigenes (Figure S1, Table S2). Of these genes, 30,000 were taken for COG, GO, KEGG, KOG, Pfam, Swiss-Prot, and nr annotation (Table S4). The datasets revealed 5085 DEGs, 3714 of which were up regulated in the WT plants, and 1371 that were down regulated (Table S5). We annotated 3980 of these genes (Table S10). From the transcriptome analyses, volcano plots, MA, and hierarchical clustering analyses were performed to identify the key genes that led to the MT phenotype. From the KEGG analysis, we grouped the major changes into the ‘plant hormone signal transduction’ categories, and phytohormone was suspected to contribute to the mutant phenotype. Coincidently, a GA regulated DEG SmGASA4 was significantly downregulated in the MT plants, with no other DEGs of the five phytohormones affected. As a plethora of studies have demonstrated that the GA and GASA genes play important roles in plant roots [37], stems [38], and flowering [14,16], we reasoned that SmGASA4 may play a major role in the growth of S. miltiorrhiza and may contribute to the mutant phenotype.
The overexpression of SmGASA4 was found to promote Arobidopsis development in the seedling period (Figure 6a,b). When overexpressed in mature Arobidopsis, no significant differences in leaf size or plant height were observed (Figure 6c). Whilst the overexpression of AtGASA14 in Arobidopsis was found to promote plant rosette leaf development only during seedling [14], its overexpression in S. militiorrhiza promoted development for its entire lifecycle (Figure 7a). This effect may be due to genetic differences or the differential expression of SmGASA4 regulatory genes. The SmGASA4 expression was also shown to promote Arobidopsis flower and capsule development (Figure 6d,e), whilst its expression in S. militiorrhiza enhanced lateral root size and density compared to the WT plants (Figure 7a). Other genetic analyses revealed that the suppression of both GASA4 and GASA6 leads to late flowering, while the overexpression of GASA6 leads to early flowering in Arabidopsis, consistent with our findings [39]. In addition, the Arobidopsis seeds from GASA4–1, null mutant plants display significantly reduced seed weight, whilst the seeds from the 35S::GASA4-overexpressing lines have significantly increased seed weights [24]. AtGASA4 has been shown to regulate floral meristem identity and also positively affects both the seed size and total seed yield [16]. The previous characterization of AtGASA4 showed that its promoter is active in the shoot apex, developing flowers, and developing embryos [16]. The GASA genes promote the growth of plant roots, rosette leaves, florals, capsule development, and seed products, which may be due to their high tissue and temporal specificity. An immunoblot analysis has also confirmed the presence of the GASA4 gene product in flower buds, seedlings, and roots [32].
The meristem identity genes activate class A (AP1 and AP2), class B (AP3 and PI), and class C (AG) floral organ identity genes in pattern discrete regions of the flower. LEAFY (LFY), AP1, and UFO genes promote the Arobidopsis floral meristem identity, and the increased branching phenotype of plants with reduced GASA4 expression are similar to those observed in LFY mutants [40]. LFY and AP1 represent the key floral meristem identity genes, which specify lateral meristems to form flowers, but axillary inflorescent shoots [41,42]. LFY is a key integrator of signals that promote flowering, including the gibberellin pathway [43]. AP2 regulates the flower meristem and organ identity, and development in Arabidopsis. What is more, AP2 can also determine seed development, such as seed size, weight, and the accumulation of oil and protein in seeds, to a large extent [44]. The expression of GASA4 and GASA6 is dysregulated in plants with altered LFY [45] or AP3/PI activity. GASA4 is involved in the regulation of hypocotyl elongation and flowering, in response to the integration of light signaling [46] and GA [47], which may suggest that these GASA genes regulate flower meristem and flower organ development.
GASA5 is a negative regulator of GA-induced flowering and stem growth, and is known to delay flowering through enhancing the expression of the flowering locus C (FLC), and repressing the expression of the key flowering genes, including flowering locus T (FT) and LFY [38]. However, GASA4, GASA6, and GASA14 are known to promote plant development [32,48]. The GASA gene expression displays species, tissue, and period specificity, and GASA may function through its regulation of transcription factors, including the GA receptor DIG1 [49], and GAI [48]. GASA is also regulated by other phytohormones, including Auxin [50] and ABA [12], amongst others. Further work is required to fully dissect the relationship between GASA and LYF, AP1, AP2, AP3, PI, AG, UFO, FLC, FT, DIG1, GAI.
Drought is one of the greatest environmental constraints to agriculture worldwide [51,52], The AtDREB1 gene families can significantly promote S. miltiorrhiza drought tolerance [35,36]. Snakin/GASA proteins play an important role in plant resistance to abiotic stress, for example, the upregulation of PagGASA in poplar provides a high tolerance to drought stress [53]. In this study, the overexpression of SmGASA4 promoted the Arobidopsis resistance to drought (Figure 8b and Figure S7a), an effect that was conserved in S. miltiorrhiza (Figure 7c). This represents the first example of the contribution of GASA genes to drought resistance in S. miltiorrhiza, demonstrating that the effects of SmGASA4 on Arobidopsis are translatable to this system. SmGASA4 contains a single CRP domain that can inhibit ROS accumulation, but the interactions that mediate its resistance to drought stress are still not fully characterized [32]. GASA contains 1–5 ABRE components, meaning that the enhancement of plant resistance to drought could be mediated by the ABA (abscisis acid) pathway or through the modulation of SA (salicylic acid) levels [54,55]. However, the relationship between SmGASA4 and Ca2+, IP3, DAG, PA, SOS, CBF/DREB1, DREB2, and ARF/AREB remains unclear [56,57].
In Arobidopsis, the overexpression of AtGASA14 can promote salt stress resistance [14]. OsGASR1 expression is induced by salt or ABA treatment, and the ectopic expression of OsGASR1 enhances salt resistance via the inhibition of ROS [58]. In this study, SmGASA4 overexpression also promoted the salt resistance of Arobidopsis (Figure 8c and Figure S7b), and reduced plant wilting in salt stress conditions in both Arobidopsis and S. miltiorrhiza (Figure 7d). The overexpression of AtGASA14 was also found to suppress reactive oxygen species (ROS) accumulation, a function that is required for its GASA domain [32]. The overexpression of the GA-responsive gene, FsGASA4, also enhances salt, oxidative stress, and heat stress tolerance during seed germination by means of increasing the SA biosynthesis. GA may thus play a crucial role during early plant responses to adverse environmental conditions by modulating the SA levels [54,55]. It is currently unclear whether SmGASA4 enhances salt resistance through a similar mechanism.
The Snakin/GASA genes are involved in plant growth and stress tolerance by regulating DELLA expression [38,59]. DELLA is a negative regulator of GA signaling [33] and components of the GA signaling pathway influence plant growth [60]. GA regulates the expression of GASA1, GASA4, GASA6 and GASA9 through DELLA expression [33], with GASA2, GASA3, and GASA4 upregulated in response to exogenous GA3 [32,61]. In this study, SmGASA4 had a positive response to the GA3 treatment (Figure 8d and Figure S7c) in Arobidopsis, as it promoted plant root, leaflet, stem, flower, and capsule development. Similar results occurred in S. miltiorrhiza following GA3 treatment, however slight leaf color changes were observed, most likely due to the enhancement of growth (Figure 7e). The GASA gene family contains a stretch of 12 conserved cysteines, and its promoter sequences include 1–4 GARE components, which facilitate its participation in the GA response. GASA2, GASA3, and GASA4 are upregulated in response to GA3 [32,61]; GASA5 is inhibited by GA3, but induced by ABA; GASA9 is inhibited both by GA3 and ABA [33]; and the SN1, GASA10, GASA12, GASA14, and GASA15 expression are unaffected by GA3 [12,17]. In Arobidopsis, GASA4 and GASA6 expression are most likely mediated through the GA unresponsive, GA INSENSITIVE (GAI) protein [48]. Gibberellin regulates the GASA-like gene, GEG; putative secretion; and the expression levels, which can also regulate cell wall division and extension [14,30]. GA, ABA, and Auxin may also interaction regulate SmGASA4; OsGSR1 are downregulated by brassinosteroids (BR) [33,62]; and the interaction between SmGASA4 and BR, GAI, and RGA should be further researched [32].
PBZ is an inhibitor of GA biosynthesis and thus is a potent inhibitor of plant growth. During Arobidopsis seed germination, GASA14–1 plants showed an enhanced sensitivity to PBZ compared with the WT plants [14]. In this study, the overexpression of SmGASA4 in Arobidopsis strongly promoted plant resistance to PBZ (Figure 8e and Figure S7d), whilst the WT plants displayed leaf discoloration and a tendency for plant death. The WT plants also displayed shorter stem lengths, reduced height, and more pronounced yellow and purple leaflets (Figure 7f). S. miltiorrhiza displayed a stronger resistance to PBZ in the culture medium than Arobidopsis seedlings (Figure S7d). PBZ severely inhibited Arobidopsis stem elongation, but did not influence the leaflet formation. In Arobidopsis, the expression of the GASA4 gene, regulated by gibberellin, is tissue-specific. Indeed, it is up-regulated in the meristematic region, but inhibited in cotyledons and leaves [29]. Interesting, GASA4 is up-regulated in meristematic region, but it is down-regulated in cotyledons and leaves by gibberellin. So, GASA4 may be participate in cell division. It indicates that it is highly expressed in meristematic tissues with higher cell division rate, but is less expressed in differentiated tissues [29]. GASA genes display tissue specific expression and interactions with Auxin, ABA, and other phytohormone [48]. The ability of SmGASA4 to promote plant resistance to PBZ may therefore be mediated through DELLA and ROS.
GASA has been shown to participate in secondary metabolism. In this study, we demonstrated that the SmGASA4 expression in S. miltiorrhiza downregulates the key genes of the tanshinone biosynthetic pathway, whilst significantly upregulating phenolic acid biosynthetic genes (Figure S8). Tanshinone is a diterpenoid quinone compound that possesses a similar cyclizing theory in the initial geranylgeranyl diphosphate (GGPP) process with GA. Tanshinone biosynthesis may therefore compete with GA biosynthesis, meaning that the down-regulation of its biosynthetic genes by SmGASA4 would increase the GA levels. This mechanism and the role of SmGASA4 in S. miltiorrhiza secondary metabolism biosynthesis requires further investigation.
Taken together, our experiments partially reveal the phenotype of the MT mutation. GA may interact with Auxin, ABA, and BR [33,62], and so regulate GASA and plant development. It is unclear whether there is a potential interaction with TFs, such as AtTZF1 [63], GAI [48], and RST-1 [50]. GASA4 elevates heat tolerance [28,64]; GsGASA1 can response to chronic cold stress [59]; snakin-1 activity is induced by temperature changes and wounding [65]; gid1 is involved in the tolerance to cold stress and resistance to blast fungus [66]; and GASA5 negatively responses to heat stress through an inhibition of SA signaling, and reduces the antioxidant capacity and accumulation of heat shock proteins in Arobidopsis [38,67]. In S. miltiorrhiza, many GASA gene family members are unexpressed and their in vivo functions now require further investigation.

4. Materials and Methods

4.1. RNA-Seq and Library Construction

The total RNA was isolated from the plant roots using RNA extraction Kits (Eastep Super, Promega, Shanghai, China) and treated with RNase Free DNase I (New England BioLabs, Beverly, MA, USA). RNA quality/purity was assessed using the Nanodrop 1000 spectrophotometer (Thermo Fisher Scientific, Wilmington, DE, USA), and the RNA concentration and integrity assessed using a Qubit 2.0 Fluorimeter (Life Technologies, Carlsbad, CA, USA), and Agilent Bioanalyzer 2100 system (Agilent Technologies, Santa Clara, CA, USA). The mRNA was purified with Oligo (dT) magnetic beads. The fragmentation was randomly performed in an IIIlumina proprietary fragmentation Buffer. Using the mRNA as a template, random oligonucleotides synthesized the first-strand of cDNA, and the addition of dNTPs, RNase H, and DNA polymerase I synthesized the second-strand of cDNA, which was purified with AMPure XP beads. The purified double-stranded cDNA were enzymatically repaired, polyadenylated, and ligated to adapters. The fragment size selection was performed with AMPure XP beads and the cDNA libraries constructed through PCR amplification.
Qubit 2.0 tests were used to assess the library concentration and the Agilent 2100 test was used to assess insert sizes. Q-PCR was used to assay the concentration of the libraries, to ensure quality. The cDNA library was sequenced using Illumina HiSeqTM2500 (Vancouver, BC, Canada) with PE100.

4.2. De Novo Transcriptome Assembly and Functional Annotation

The raw data was filtered by removing the adapter sequence and low quality reads to produce high quality clean data. The sequence assemble of the clean data was assessed to produce Unigene libraries, most of the basic group quality score more than Q30, using the Trinity [16] software to assemble the clean data into Unigene.

4.3. Unigene Functional Annotation

BLAST software (available online: http://genome.ucsc.edu/cgi-bin/hgBlat) was used to compare the Unigene sequences with the non-redundant (nr) protein databases (nr, available online: ftp://ftp.ncbi.nih.gov/blast/db/), Swiss-Prot (available online: http://www.uniprot.org/), gene ontology (GO, available online: http://www.geneontology.org/), Clusters of Orthologous Groups (COGs, available online: http://www.ncbi.nlm.nih.gov/COG), euKaryotic Orthologous Groups (KOG, available online: http://www.ncbi.nlm.nih.gov/COG/), and Kyoto Encyclopedia of Genes and Genomes (KEGG, available online: http://www.genome.ad.jp/kegg/) libraries. Following prediction, the Unigene amino acid sequences were assessed using HMMER software (available online: http://hmmer.janelia.org/) for assignment into protein families (Pfam, available online: http://pfam.xfam.org/), to obtain Unigene annotation information.

4.4. Quantification of Gene Expression

The clean data were mapped to the unigene library using Bowtie [68]. The read count for each gene was then obtained from the mapping results using RSEM [31]. The Fragments Per Kilobase of transcript per Million mapped read (FPKM) [37] values or each unigene were calculated to determine their expression profiles. The differential expression analysis of the WT and MT were analyzed using DESeq [38], with Benjamini and Hochberg False Discovery Rate (FDR) [69] methods. The DEGs were identified with a threshold of FDR <0.01 and fold change (FC) ≥2 or ≤−2. A cluster analysis was performed according to the patterns of unigene differential expression across the samples [70].

4.5. Sequencing Data Verification and Secondary Metabolism Analysis

The total RNA was extracted from the S. miltiorrhiza roots and treated with RNase Free DNase I (TaKaRa, Dalian, China). The reverse transcription was performed using SuperScript III (RT kit; Invitrogen, Carlsbad, CA, USA), following the manufacturer’s recommendations. A total of 18 DEG genes were randomly chosen to verify the RNAseq data (Table S11), using primer 5 to design the 18 DEG specific primers (Table S12). A quantitative reverse-transcription PCR (qRT-PCR) analysis was performed on an iQ5.0 instrument (Bio-Rad, Hercules, CA, USA) with SYBR Green qPCR kits (Roche, Basel, Switzerland) by heating at 95 °C for 3 min, followed by 40 cycles at 95 °C for 30 s, and 60 °C for 30 s. The amplification reactions (20 μL) consisted of 10 μL 2× SYBR Green Mix, 1 μL cDNA, and 0.25 μM forward and reverse primers. The relative gene expression levels were calculated using the 2−ΔΔCT method and normalized against Actin (Table S8). All assays for a particular gene were performed in triplicate under identical conditions. Using primer 5 design, the 28 S. miltiorrhiza secondary metabolism biosynthesis genes (Table S9) were assessed using identical qRT-PCR methods.

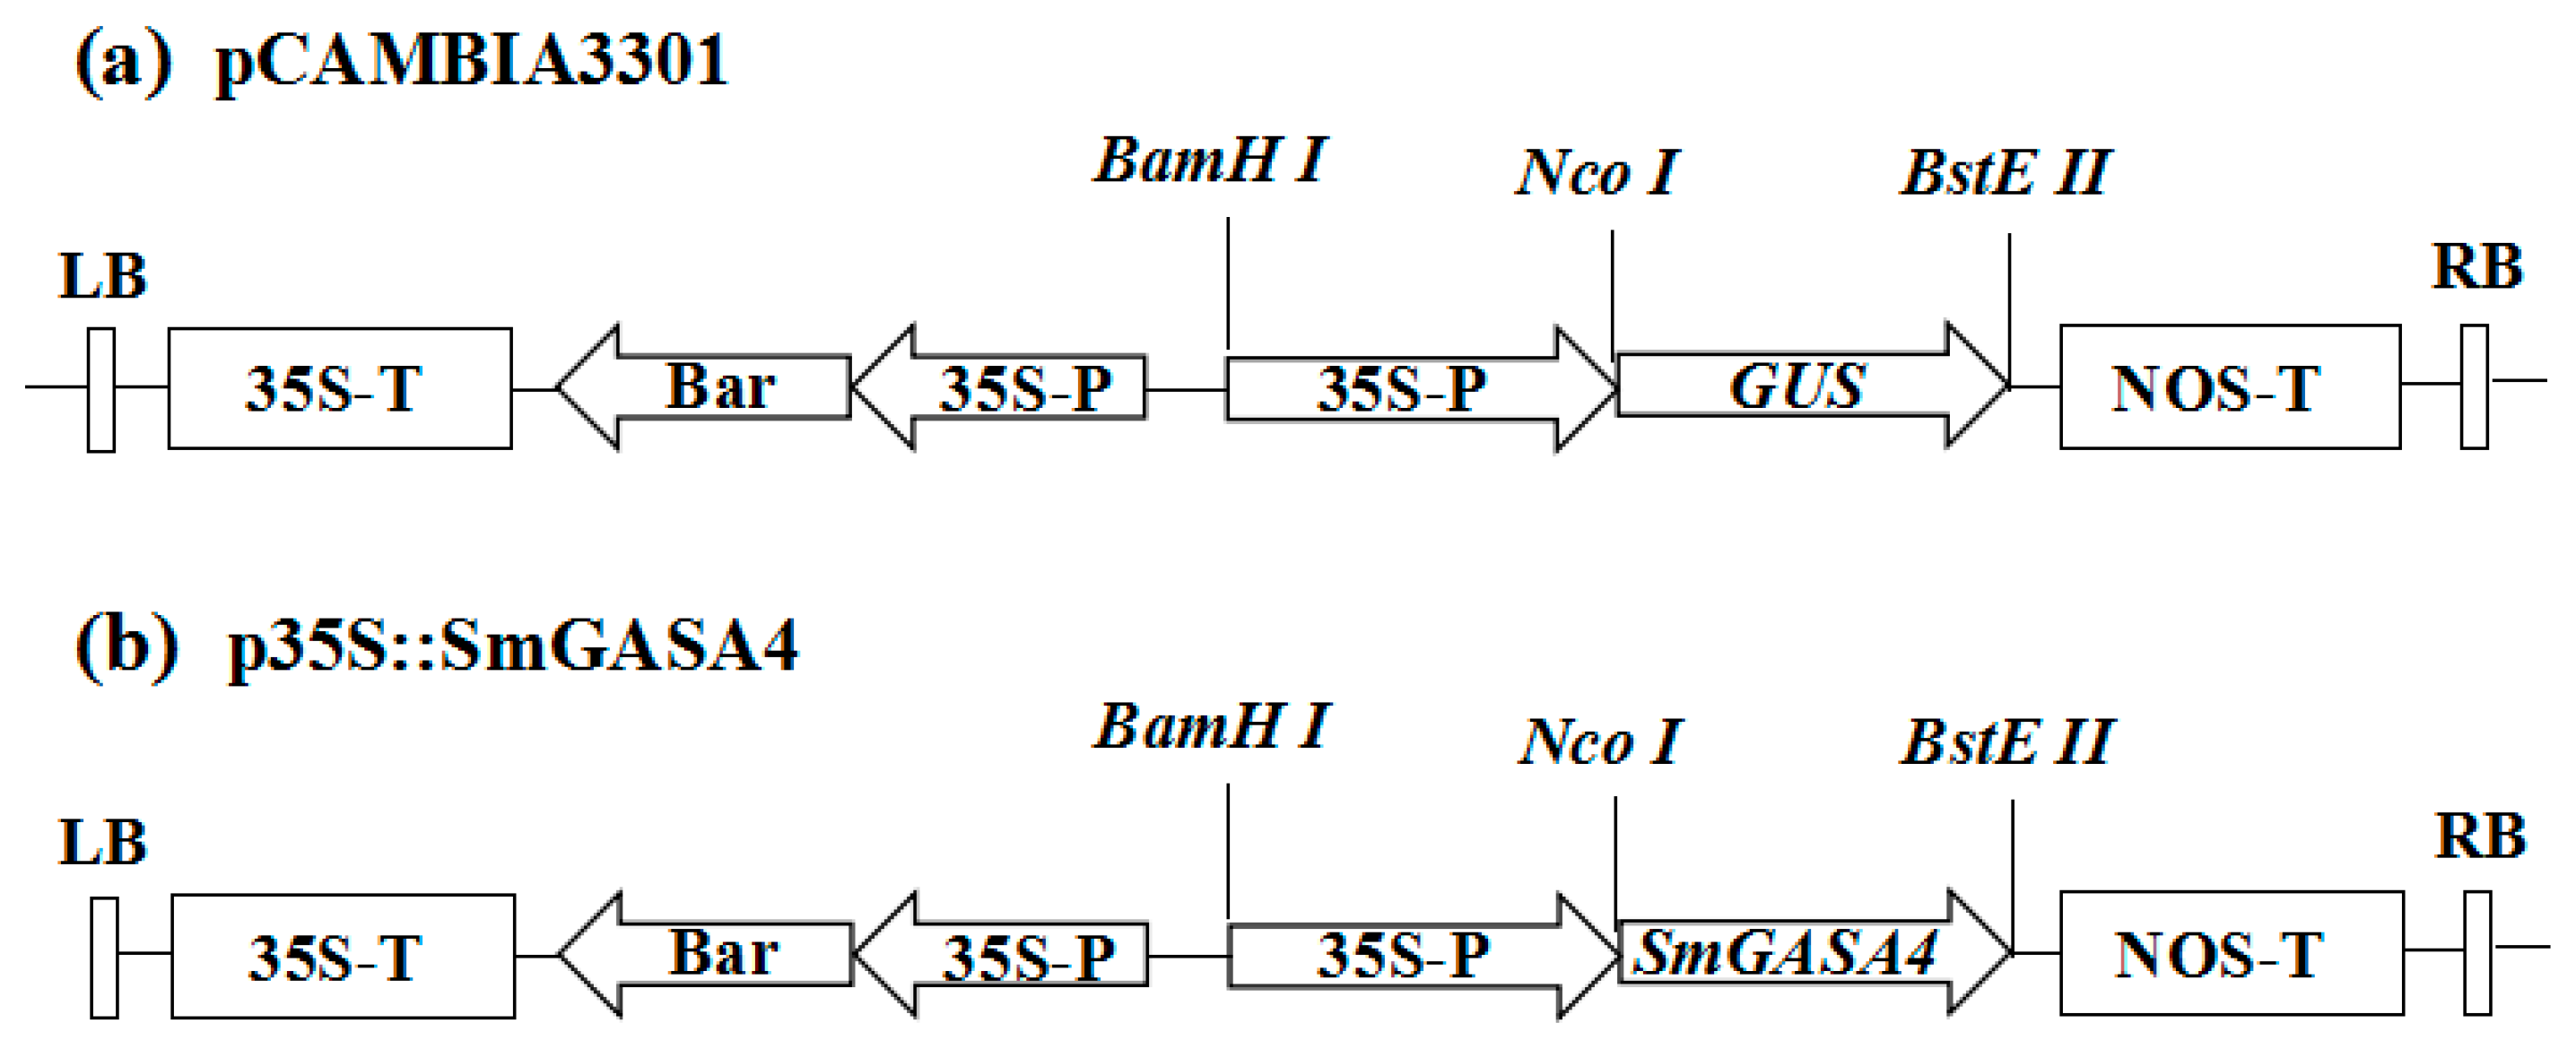
4.6. Plasmid Construction

The full-length SmGASA4 open reading frame was amplified using PCR (polymerase chain reaction) from Transcriptome cDNA, with primers containing the restriction sites NcoI/BstEII (Table S7). Both of the PCR products were cloned into the pEASY-T1 vector (TransGen Biotech, Beijing, China). Digestion was performed, and the SmGASA4 fragment was inserted into the binary plant vector pCAMBIA3301 containing the CaMV35S constitutive promoter (Figure 5). The Bar gene encodes glufosinate acetyltransferase (PAT), which is resistant to the herbicide glufosinate (PPT), so it is used to be considered as a screening marker (Figure 5). The constructed vector was transformed into Agrobacterium tumefaciens, strain LBA4404, by heat-shock methods.

4.7. Plant Materials and Genetic Transformation

Arabidopsis (Ecotype Columbia) transformation was carried out using the floral dip method [71]. We obtained transgenic line T4, which can stablely inherit using glufosinate resistance screening and molecular identification methods.
The leaves of the WT and MT plants were cultured on MS (Murashige and Skoog) + 1.0 mg/L 6-BA + 1.0 mg/L NAA (Naphthaleneacetic acid) culture medium, containing 30 g/L sucrose and 6 g/L agar after surface sterilization with 0.1% HgCl2 [64]. After the Callus differentiation breed is translated into a MS + 1.0 mg/L 6-BA + 0.01 mg/L NAA culture medium, last translate into ½ MS + 0.2 mg/L IBA culture medium to induce root formation. The cultures were placed in a growth chamber under specific conditions, with temperature between 23 and 27 °C under a 16 h light/8 h dark photoperiod (light intensity = 150 μmol m−2 s−1). Each vector was transfered into Salvia miltiorrhiza by the leaf-disk method, mediated by Agrobacterium tumefaciens [64]. The A. tumefaciens, strain LBA4404, stored in 50% glycerol water, was transferred to a liquid yeast extract (YEB) medium for activation at 28 °C and cultured on a shaker (200 rpm) to mid-log phase (OD600 = 0.6). The excised leaves were pre-incubated on MS agar for 2 day at 25 ± 2 °C and 16-h-light/8-h-dark photoperiod.
The pre-cultured leaves were placed in the bacterial-containing liquid for 25 min, and the excess liquid was blotted on a sterile filter paper, and then placed the leaves on MS agar with 1.0 mg/L 6-BA + 0.01 mg/L NAA in the dark. The temperature was maintained at 25 ± 2 °C. After 2 day of co-cultivation, the leaves were placed on selective medium with 0.6 mg/L Basta and were cultured under specific conditions (25 ± 2 °C, 16 h light/8 h dark, and 150 μmol m−2 s−1). The leaf disks were sub-cultured every week. The shoots were generated after 35 day and subsequently were excised and transferred to selective rooting medium. Two weeks later, the rooted plantlets were cut into sections and then cultured on ½ MS basal medium for propagation. A half-month-old seedling can be used for PCR screening and gene expression evaluation. The transformed plants were grown in the soil for further observations and stress treatment.

4.8. Molecular Characterization of Transgenic Events

The CTAB method was used to extract the genomic DNA from the young leaves [67] of Arobidopsis. Positive p35S::SmGASA4 transgenic lines were detected based on the sequences of the SmGASA4 promoter (Table S7). S. miltiorrhiza RNAs were extracted from young leaves using the Eastep Super (Promega, Shanghai, China), following the manufacturer’s instructions, and were translated into cDNA. The primer sets for the p35S::SmGASA4 transgenic lines were verified using the 35S promoter sequence of pCAMBIA3301 (Table S8) for the forward primer, and SmGASA4-R in SmGASA4 sequence for the reverse primer (Table S7).

4.9. Stress Treatment

To analyze the Arobidopsis response to drought, NaCl, GA, and PBZ stress, as well as six-leaved plantlets and bolting date seedlings were individually transferred to sterile soil containing nutrients, after the seedling had adapted to the new environment. Prior to drought stress, both WT and transgene plants were saturated with water and left overnight to drain. Salt stress was performed using 200 mmol/L NaCl solution and sprayed onto the plant. GA stress was performed with 200 μmol/L GA3 solution, and PBZ stress with a 100 μmol/L PBZ solution sprayed onto the plants. Sterile Arobidopsis seeds were added to ½ MS medium, after the seedling four-leaved transform to the stress ½ MS culture medium. The drought culture medium contained 400 mmol/L mannitol, salt culture medium contained 100 mmol/L NaCl, GA culture medium contained 100 μmol/L GA3, and PBZ culture medium contained 50 μmol/L PBZ. All of the treatments were performed over a 16:8 h photoperiod (light intensity = 150 μmol m−2 s−1), 22 ± 2 °C.
To analyze the S. miltiorrhiza response to drought, NaCl, GA, and PBZ stress, as well as plantlets in solid sterile medium were transferred to sterile nutrient-containing soil, and then placed in a growth chamber for cultivation (25 ± 2 °C, 16 h light/8 h dark, light intensity = 150 μmol m−2 s−1). Once the plantlets had adapted to their new environment, the stress treatments were initiated. Prior to drought stress, both the WT and transgene plantlets were saturated with water and left overnight to drain. The pants were sprayed with 250 mmol/L NaCl (salt stress), 200 μmol/L GA3 (GA stress), or 300 μmol/L PBZ (PBZ stress). GA3 and PBZ were dissolved with ethyl alcohol prior to being dissolved in water.

5. Conclusions

Our laboratory produced a mutant plant that possessed a single huge taproot, reduced lateral roots, and defective flowering. By performing a transcriptome analysis, we found that phytohormone signaling may play an important role during WT plant growth. We identified a significant DEG, SmGASA4, which displayed a reduced expression in the MT plants. The overexpression of SmGASA4 was subsequently shown to promote root development and promote flower and capsule development in Arobidopsis. We further demonstrate that SmGASA4 is a GASA family member that is positively regulated by GA. SmGASA4 expression was also shown to improve plant resistance to drought, salt stress, and PBZ. Finally, we demonstrate that the overexpression of SmGASA4 in S. miltiorrhiza can upregulate the key genes of the salvianolic acid biosynthesis, but down regulates the genes involved in tanshinone biosynthesis.

Supplementary Materials

Supplementary materials can be found at https://www.mdpi.com/1422-0067/19/7/2088/s1.

Author Contributions

Conceptualization, W.S. and H.W. and T.W.; Methodology, H.W. and L.Z. and M.Y.; Formal analysis, X.W.; Resources, W.S. and L.C.; Writing-Review & Editing, H.W.; Project Administration, W.S. and C.W. and C.C.; Data curation, T.W.

Acknowledgments

This work was supported by the National science and technology major special project of transgenes (2018ZX08022001), Natural Science Foundation of China (No. 31470669) and National Key Research and Development Program of China (2017YFD01005050102).

Conflicts of Interest

The authors declare no conflict of interest.

Abbreviations

S. miltiorrhizaSalvia miltiorrhiza
WTWild type Arobidopsis/Salvia miltiorrhiza
MTMutant type Salvia miltiorrhiza
GASAGibberellic acid-stimulated Arabidopsis
GAGibberellin
PBZPaclobutrazol
PPTHerbicide phosphinothricin
PATPhosphinothricin acetyltransferase
GAREGibberellin Acid Response Element
ABREAbscisic Acid Response Element
DEGsDifferentially expressed genes
qRT-PCRReal-time quantitative PCR
MSMurashige and Skoog
SASalicylic acid

References

  1. Kang, D.G.; Oh, H.; Chung, H.T.; Lee, H.S. Inhibition of angiotensin converting enzyme by lithospermic acid B isolated from Radix Salviae miltiorrhiza Bunge. Phytother. Res. 2003, 17, 917–920. [Google Scholar] [CrossRef] [PubMed]
  2. Wang, L.; Ma, R.; Liu, C.; Liu, H.; Zhu, R.; Guo, S.; Tang, M.; Li, Y.; Niu, J.; Fu, M. Salvia miltiorrhiza: A potential red light to the development of cardiovascular diseases. Curr. Pharm. Des. 2016, 23, 1077–1097. [Google Scholar] [CrossRef] [PubMed]
  3. Zhou, L.; Zuo, Z.; Chow, M.S. Danshen: An overview of its chemistry, pharmacology, pharmacokinetics, and clinical use. J. Clin. Pharmacol. 2013, 53, 787–811. [Google Scholar] [CrossRef] [PubMed]
  4. Yang, H.; Han, L.; Sheng, T.; He, Q.; Liang, J. Effects of Replenishing Qi, Promoting Blood Circulation and Resolving Phlegmon Vascular Endothelial Function and Blood Coagulation Systemin Senile Patients with Hyperlipemia. J. Tradit. Chin. Med. 2006, 26, 120–124. [Google Scholar] [PubMed]
  5. Ge, X.; Wu, J. Tanshinone production and isoprenoid pathways in Salvia miltiorrhiza hairy roots induced by Ag + and yeast elicitor. Plant Sci. 2005, 168, 487–491. [Google Scholar] [CrossRef]
  6. Kai, G.; Liao, P.; Xu, H.; Wang, J.; Zhou, C.; Zhou, W.; Qi, Y.; Xiao, J.; Wang, Y.; Zhang, L. Molecular mechanism of elicitor-induced tanshinone accumulation in Salvia miltiorrhiza hairy root cultures. Acta Physiol. Plant. 2012, 34, 1421–1433. [Google Scholar] [CrossRef]
  7. He, C.E.; Lu, L.L.; Jin, Y.; Wei, J.H.; Christie, P. Effects of Nitrogen on Root Development and Contents of Bioactive Compounds in Salvia miltiorrhiza Bunge. Crop Sci. 2013, 53, 2028–2039. [Google Scholar] [CrossRef]
  8. Zhou, L.; Tang, K.; Guo, S. The Plant Growth-Promoting Fungus (PGPF) Alternariasp. A13 Markedly Enhances Salvia miltiorrhiza Root Growth and Active Ingredient Accumulation under Greenhouse and Field Conditions. Int. J. Mol. Sci. 2018, 19, 270. [Google Scholar] [CrossRef] [PubMed]
  9. Gorthy, S.; Mayandi, K.; Faldu, D.; Dalal, M. Molecular characterization of allelic variation in spontaneous Brown midrib mutants of Sorghum (Sorghum bicolor (L.) Moench). Mol. Breed. 2013, 31, 795–803. [Google Scholar] [CrossRef]
  10. Wang, L.Y.; Huang, Z.L.; Li, G.; Zhao, H.X.; Xing, X.H.; Sun, W.T.; Li, H.P.; Gou, Z.X.; Bao, C.Y. Novel mutation breeding method for Streptomyces avermitilis using an atmospheric pressure glow discharge plasma. J. Appl. Microbiol. 2010, 108, 851–858. [Google Scholar] [CrossRef] [PubMed] [Green Version]
  11. Silverstein, K.A.; Moskal, W.A., Jr.; Wu, H.C.; Underwood, B.A.; Graham, M.A.; Town, C.D.; Vandenbosch, K.A. Small cysteine-rich peptides resembling antimicrobial peptides have been under-predicted in plants. Plant J. 2007, 51, 262–280. [Google Scholar] [CrossRef] [PubMed] [Green Version]
  12. Zhang, S.C.; Wang, X.J. Expression pattern of GASA, downstream genes of DELLA, in Arabidopsis. Chin. Sci. Bull. 2008, 53, 3839–3846. [Google Scholar] [CrossRef]
  13. Hua, W.; Zhang, Y.; Song, J.; Zhao, L.; Wang, Z. De novo transcriptome sequencing in Salvia miltiorrhiza to identify genes involved in the biosynthesis of active ingredients. Genomics 2011, 98, 272–279. [Google Scholar]
  14. Ben-Nissan, G.; Lee, J.Y.; Borohov, A.; Weiss, D. GIP, a Petunia hybrida GA-induced cysteine-rich protein: A possible role in shoot elongation and transition to flowering. Plant J. 2004, 37, 229–238. [Google Scholar] [CrossRef] [PubMed]
  15. Luo, H.; Zhu, Y.; Song, J.; Xu, L.; Sun, C.; Zhang, X.; Xu, Y.; He, L.; Sun, W.; Xu, H. Transcriptional data mining of Salvia miltiorrhiza in response to methyl jasmonate to examine the mechanism of bioactive compound biosynthesis and regulation. Physiol. Plant. 2014, 152, 241–255. [Google Scholar] [CrossRef] [PubMed]
  16. Roxrud, I.; Lid, S.E.; Fletcher, J.C.; Schmidt, E.D.; Opsahl-Sorteberg, H.G. GASA4, one of the 14-member Arabidopsis GASA family of small polypeptides, regulates flowering and seed development. Plant Cell Physiol. 2007, 48, 471–483. [Google Scholar] [CrossRef] [PubMed]
  17. Segura, A.; Moreno, M.; Madueño, F.; Molina, A.; Garcíaolmedo, F. Snakin-1, a peptide from potato that is active against plant pathogens. Mol. Plant-Microbe Interact. 1999, 12, 16–23. [Google Scholar] [CrossRef] [PubMed]
  18. Berrocal-Lobo, M.; Segura, A.; Moreno, M.; López, G.; García-Olmedo, F.; Molina, A. Snakin-2, an antimicrobial peptide from potato whose gene is locally induced by wounding and responds to pathogen infection. Plant Physiol. 2002, 128, 951–961. [Google Scholar] [CrossRef] [PubMed] [Green Version]
  19. Srivastava, R.; Liu, J.X.; Guo, H.; Yin, Y.; Howell, S.H. Regulation and processing of a plant peptide hormone, AtRALF23, in Arabidopsis. Plant J. 2009, 59, 930–939. [Google Scholar] [CrossRef] [PubMed]
  20. Yu, F.; Qian, L.; Nibau, C.; Duan, Q.; Kita, D.; Levasseur, K.; Li, X.; Lu, C.; Li, H.; Hou, C. FERONIA receptor kinase pathway suppresses abscisic acid signaling in Arabidopsis by activating ABI2 phosphatase. Proc. Natl. Acad. Sci. USA 2012, 109, 14693–14698. [Google Scholar] [CrossRef] [PubMed]
  21. Yamada, M.; Sawa, S. The roles of peptide hormones during plant root development. Curr. Opin. Plant Biol. 2013, 16, 56–61. [Google Scholar] [CrossRef] [PubMed]
  22. Haruta, M.; Sabat, G.; Stecker, K.; Minkoff, B.B.; Sussman, M.R. A Peptide Hormone and Its Receptor Protein Kinase Regulate Plant Cell Expansion. Science 2014, 343, 408–411. [Google Scholar] [CrossRef] [PubMed]
  23. Miyakawa, T.; Hatano, K.; Miyauchi, Y.; Suwa, Y.; Sawano, Y.; Tanokura, M. A secreted protein with plant-specific cysteine-rich motif functions as a mannose-binding lectin that exhibits antifungal activity. Plant Physiol. 2014, 166, 766–778. [Google Scholar] [CrossRef] [PubMed]
  24. Wolf, S.; Van Der Does, D.; Ladwig, F.; Sticht, C.; Kolbeck, A.; Schürholz, A.K.; Augustin, S.; Keinath, N.; Rausch, T.; Greiner, S. A receptor-like protein mediates the response to pectin modification by activating brassinosteroid signaling. Proc. Natl. Acad. Sci. USA 2014, 111, 15261–15266. [Google Scholar] [CrossRef] [PubMed] [Green Version]
  25. Stes, E.; Gevaert, K.; De, S.I. Phosphoproteomics-based peptide ligand-receptor kinase pairing. Commentary on: “A peptide hormone and its receptor protein kinase regulate plant cell expansion”. Front. Plant Sci. 2015, 6, 224. [Google Scholar] [CrossRef] [PubMed] [Green Version]
  26. Almasia, N.I.; Bazzini, A.A.; Hopp, H.E.; Vazquez-Rovere, C. Overexpression of snakin-1 gene enhances resistance to Rhizoctonia solani and Erwinia carotovora in transgenic potato plants. Mol. Plant Pathol. 2010, 9, 329–338. [Google Scholar] [CrossRef] [PubMed]
  27. Shi, L.; Gast, R.T.; Gopalraj, M.; Olszewski, N.E. Characterization of a shoot-specific, GA3- and ABA-Regulated gene from tomato. Plant J. 1992, 2, 153–159. [Google Scholar] [PubMed]
  28. Herzog, M.; Dorne, A.M.; Grellet, F. GASA, a gibberellin-regulated gene family from Arabidopsis thaliana related to the tomato GAST1 gene. Plant Mol. Biol. 1995, 27, 743–752. [Google Scholar] [CrossRef] [PubMed]
  29. Aubert, D.; Chevillard, M.; Dorne, A.M.; Arlaud, G.; Herzog, M. Expression patterns of GASA genes in Arabidopsis thaliana: The GASA4 gene is up-regulated by gibberellins in meristematic regions. Plant Mol. Biol. 1998, 36, 871–883. [Google Scholar] [CrossRef] [PubMed]
  30. Wigoda, N.; Ben-Nissan, G.; Granot, D.; Schwartz, A.; Weiss, D. The gibberellin-induced, cysteine-rich protein GIP2 from Petunia hybrida exhibits in planta antioxidant activity. Plant J. 2006, 48, 796–805. [Google Scholar] [CrossRef] [PubMed] [Green Version]
  31. Rubinovich, L.; Weiss, D. The Arabidopsis cysteine-rich protein GASA4 promotes GA responses and exhibits redox activity in bacteria and in planta. Plant J. 2010, 64, 1018–1027. [Google Scholar] [CrossRef] [PubMed]
  32. Sun, S.; Wang, H.; Yu, H.; Zhong, C.; Zhang, X.; Peng, J.; Wang, X. GASA14 regulates leaf expansion and abiotic stress resistance by modulating reactive oxygen species accumulation. J. Exp. Bot. 2013, 64, 1637–1647. [Google Scholar] [CrossRef] [PubMed]
  33. Wang, L.; Wang, Z.; Xu, Y.; Joo, S.H.; Kim, S.K.; Xue, Z.; Xu, Z.; Wang, Z.; Chong, K. OsGSR1 is involved in crosstalk between gibberellins and brassinosteroids in rice. Plant J. 2009, 57, 498–510. [Google Scholar] [CrossRef] [PubMed]
  34. Furukawa, T.; Sakaguchi, N.; Shimada, H. Two OsGASR genes, rice GAST homologue genes that are abundant in proliferating tissues, show different expression patterns in developing panicles. Genes Genet. Syst. 2006, 81, 171–180. [Google Scholar] [CrossRef] [PubMed]
  35. Wei, T.; Deng, K.; Liu, D.; Gao, Y.; Liu, Y.; Yang, M.; Zhang, L.; Zheng, X.; Wang, C.; Song, W. Ectopic Expression of DREB Transcription Factor, AtDREB1A, Confers Tolerance to Drought in Transgenic Salvia miltiorrhiza. Plant Cell Physiol. 2016, 57, 1593–1609. [Google Scholar] [CrossRef] [PubMed]
  36. Wei, T.; Deng, K.; Gao, Y.; Liu, Y.; Yang, M.; Zhang, L.; Zheng, X.; Wang, C.; Song, W.; Chen, C. Arabidopsis DREB1B in transgenic Salvia miltiorrhiza increased tolerance to drought stress without stunting growth. Plant Physiol. Biochem. 2016, 104, 17–28. [Google Scholar] [CrossRef] [PubMed]
  37. Zimmermann, R.; Sakai, H.; Hochholdinger, F. The Gibberellic Acid Stimulated-like gene family in maize and its role in lateral root development. Plant Physiol. 2010, 152, 356–365. [Google Scholar] [CrossRef] [PubMed]
  38. Zhang, S.; Yang, C.; Peng, J.; Sun, S.; Wang, X. GASA5, a regulator of flowering time and stem growth in Arabidopsis thaliana. Plant Mol. Biol. 2009, 69, 745–759. [Google Scholar] [CrossRef] [PubMed]
  39. Ceserani, T.; Trofka, A.; Gandotra, N.; Nelson, T. VH1/BRL2 receptor-like kinase interacts with vascular-specific adaptor proteins VIT and VIK to influence leaf venation. Plant J. 2009, 57, 1000–1014. [Google Scholar] [CrossRef] [PubMed]
  40. Weigel, D.; Alvarez, J.; Smyth, D.R.; Yanofsky, M.F.; Meyerowitz, E.M. LEAFY controls floral meristem identity in Arabidopsis. Cell 1992, 69, 843–859. [Google Scholar] [CrossRef]
  41. Weigel, D.; Nilsson, O. A developmental switch sufficient for flower initiation in diverse plants. Nature 1995, 377, 495–500. [Google Scholar] [CrossRef] [PubMed]
  42. Mandel, M.A.; Yanofsky, M.F. A gene triggering flower formation in Arabidopsis. Nature 1995, 377, 522–524. [Google Scholar] [CrossRef] [PubMed]
  43. Blázquez, M.A.; Weigel, D. Integration of floral inductive signals in Arabidopsis. Nature 2000, 404, 889–892. [Google Scholar] [CrossRef] [PubMed]
  44. Jofuku, K.D.; Omidyar, P.K.; Gee, Z.; Okamuro, J.K. Control of seed mass and seed yield by the floral homeotic gene APETALA2. Proc. Natl. Acad. Sci. USA 2005, 102, 3117–3122. [Google Scholar] [CrossRef] [PubMed] [Green Version]
  45. Zik, M.; Irish, V.F. Flower development: Initiation, differentiation, and diversification. Annu. Rev. Cell Dev. Biol. 2003, 19, 119–140. [Google Scholar] [CrossRef] [PubMed]
  46. Trapnell, C.; Williams, B.A.; Pertea, G.; Mortazavi, A.; Kwan, G.; Van Baren, M.J.; Salzberg, S.L.; Wold, B.J.; Pachter, L. Transcript assembly and quantification by RNA-Seq reveals unannotated transcripts and isoform switching during cell differentiation. Nat. Biotechnol. 2010, 28, 511–515. [Google Scholar] [CrossRef] [PubMed] [Green Version]
  47. Chen, C.; Lee, S.C.; Pan, S.M.; Hsieh, H.L. GASA4, a GA-stimulated gene, participates in light signaling in Arabidopsis. Plant Sci. 2007, 172, 1062–1071. [Google Scholar] [CrossRef]
  48. Qu, J.; Kang, S.G.; Hah, C.; Jang, J.C. Molecular and cellular characterization of GA-Stimulated Transcripts GASA4 and GASA6 in Arabidopsis thaliana. Plant Sci. 2016, 246, 1–10. [Google Scholar] [CrossRef] [PubMed]
  49. Ueguchi-Tanaka, M.; Ashikari, M.; Nakajima, M.; Itoh, H.; Katoh, E.; Kobayashi, M.; Chow, T.Y.; Hsing, Y.-i.C.; Kitano, H.; Yamaguchi, I.; et al. GIBBERELLIN INSENSITIVE DWARF1 encodes a soluble receptor for gibberellin. Nature 2005, 437, 693–698. [Google Scholar] [CrossRef] [PubMed]
  50. Taylor, B.H.; Scheuring, C.F. A molecular marker for lateral root initiation: The RSI-1 gene of tomato (Lycopersicon esculentum Mill) is activated in early lateral root primordia. Mol. Gen. Genet. 1994, 243, 148–157. [Google Scholar] [PubMed]
  51. Bao, G.; Zhuo, C.; Qian, C.; Xiao, T.; Guo, Z.; Lu, S. Co-expression of NCED and ALO improves vitamin C level and tolerance to drought and chilling in transgenic tobacco and stylo plants. Plant Biotechnol. J. 2015, 14, 206–214. [Google Scholar] [CrossRef] [PubMed] [Green Version]
  52. Umezawa, T.; Fujita, M.; Fujita, Y.; Yamaguchi-Shinozaki, K.; Shinozaki, K. Engineering drought tolerance in plants: Discovering and tailoring genes to unlock the future. Curr. Opin. Biotechnol. 2006, 17, 113–122. [Google Scholar] [CrossRef] [PubMed]
  53. Grabherr, M.G.; Haas, B.J.; Yassour, M.; Levin, J.Z.; Thompson, D.A.; Amit, I.; Adiconis, X.; Fan, L.; Raychowdhury, R.; Zeng, Q. Full-length transcriptome assembly from RNA-Seq data without a reference genome. Nat. Biotechnol. 2011, 29, 644–652. [Google Scholar] [CrossRef] [PubMed] [Green Version]
  54. Alonsoramírez, A.; Rodríguez, D.; Reyes, D.; Jiménez, J.A.; Nicolás, G.; Lópezcliment, M.; Gómezcadenas, A.; Nicolás, C. Evidence for a Role of Gibberellins in Salicylic Acid-Modulated Early Plant Responses to Abiotic Stress in Arabidopsis Seeds. Plant Physiol. 2009, 150, 1335–1344. [Google Scholar] [CrossRef] [PubMed] [Green Version]
  55. Alonsoramírez, A.; Rodríguez, D.; Reyes, D.; Jiménez, J.A.; Nicolás, G.; Lópezcliment, M.; Gómezcadenas, A.; Nicolás, C. Cross-talk between gibberellins and salicylic acid in early stress responses in Arabidopsis thaliana seeds. Plant Signal. Behav. 2009, 4, 750–751. [Google Scholar] [CrossRef]
  56. Xiong, L.; Schumaker, K.S.; Zhu, J.-K. Cell Signaling during Cold, Drought, and Salt Stress. Plant Cell 2002, 14 (Suppl. 1), S165–S183. [Google Scholar] [CrossRef] [PubMed]
  57. Zhu, J.K. Salt and drought stress signal transduction in plants. Annu. Rev. Plant Biol. 2003, 53, 247–273. [Google Scholar] [CrossRef] [PubMed]
  58. Lee, S.C.; Han, S.K.; Kim, S.R. Salt- and ABA-inducible OsGASR1 is involved in salt tolerance. J. Plant Biol. 2015, 58, 96–101. [Google Scholar] [CrossRef]
  59. Li, K.L.; Bai, X.; Li, Y.; Cai, H.; Ji, W.; Tang, L.L.; Wen, Y.D.; Zhu, Y.M. GsGASA1 mediated root growth inhibition in response to chronic cold stress is marked by the accumulation of DELLAs. J. Plant Physiol. 2011, 168, 2153–2160. [Google Scholar] [CrossRef] [PubMed]
  60. Langmead, B.; Trapnell, C.; Pop, M.; Salzberg, S.L. Ultrafast and memory-efficient alignment of short DNA sequences to the human genome. Genome Biol. 2009, 10, R25. [Google Scholar] [CrossRef] [PubMed]
  61. Li, B.; Dewey, C.N. RSEM: Accurate transcript quantification from RNA-Seq data with or without a reference genome. BMC Bioinform. 2011, 12, 323. [Google Scholar] [CrossRef] [PubMed]
  62. Bouquin, T.; Meier, C.; Foster, R.; Nielsen, M.E.; Mundy, J. Control of specific gene expression by gibberellin and brassinosteroid. Plant Physiol. 2001, 127, 450–458. [Google Scholar] [CrossRef] [PubMed]
  63. Lin, P.C.; Pomeranz, M.C.; Jikumaru, Y.; Kang, S.G.; Hah, C.; Fujioka, S.; Kamiya, Y.; Jang, J.C. The Arabidopsis tandem zinc finger protein AtTZF1 affects ABA- and GA-mediated growth, stress and gene expression responses. Plant J. 2011, 65, 253–268. [Google Scholar] [CrossRef] [PubMed]
  64. Ko, C.B.; Woo, Y.M.; Lee, D.J.; Lee, M.C.; Kim, C.S. Enhanced tolerance to heat stress in transgenic plants expressing the GASA4 gene. Plant Physiol. Biochem. 2007, 45, 722–728. [Google Scholar] [CrossRef] [PubMed]
  65. Almasia, N.I.; Narhirñak, V.; Hopp, H.E.; Vazquezrovere, C. Isolation and characterization of the tissue and development-specific potato snakin-1 promoter inducible by temperature and wounding. Electron. J. Biotechnol. 2010, 13, 8–9. [Google Scholar] [CrossRef]
  66. Tanaka, N.; Matsuoka, M.; Kitano, H.; Asano, T.; Kaku, H.; Komatsu, S. gid1, a gibberellin-insensitive dwarf mutant, shows altered regulation of probenazole-inducible protein (PBZ1) in response to cold stress and pathogen attack. Plant Cell Environ. 2010, 29, 619–631. [Google Scholar] [CrossRef]
  67. Zhang, S.; Wang, X. Overexpression of GASA5 increases the sensitivity of Arabidopsis to heat stress. J. Plant Physiol. 2011, 168, 2093–2101. [Google Scholar] [CrossRef] [PubMed]
  68. Liu, Z.H.; Zhu, L.; Shi, H.Y.; Chen, Y.; Zhang, J.M.; Zheng, Y.; Li, X.B. Cotton GASL genes encoding putative gibberellin-regulated proteins are involved in response to GA signaling in fiber development. Mol. Biol. Rep. 2013, 40, 4561–4570. [Google Scholar] [CrossRef] [PubMed]
  69. Kotilainen, M.; Helariutta, Y.; Mehto, M.; Pöllänen, E.; Albert, V.A.; Elomaa, P.; Teeri, T.H. GEG participates in the regulation of cell and organ shape during corolla and carpel development in Gerbera hybrida. Plant Cell 1999, 11, 1093–1104. [Google Scholar] [CrossRef] [PubMed]
  70. Moyano-Cañete, E.; Bellido, M.L.; García-Caparrós, N.; Medina-Puche, L.; Amil-Ruiz, F.; González-Reyes, J.A.; Caballero, J.L.; Muñoz-Blanco, J.; Blanco-Portales, R. FaGAST2, a strawberry ripening-related gene, acts together with FaGAST1 to determine cell size of the fruit receptacle. Plant Cell Physiol. 2013, 54, 218–236. [Google Scholar] [CrossRef] [PubMed]
  71. Mao, Z.; Zheng, J.; Wang, Y.; Chen, G.; Yang, Y.; Feng, D.; Xie, B. The new CaSn gene belonging to the snakin family induces resistance against root-knot nematode infection in pepper. Phytoparasitica 2011, 39, 151–164. [Google Scholar] [CrossRef]
Figure 1. (a) Volcano plots of the differentially expressed genes (DEGs) in the comparisons of wild type (WT) and mutant type (MT) plants, (b) MA (Minus Average) plots of DEGs in the comparisons of WT and MT plants.
Ijms 19 02088 g001
Figure 2. Cluster analysis of DEGs in WT and MT plants, based on expression profiles measured by RNA-seq; the color scale in the heat map corresponds to log2 (Fragments Per Kilobase Million (FPKM)) values of genes in the different samples.
Ijms 19 02088 g002
Figure 3. Functional gene ontology (GO) term classifications of DEGs from comparisons of WT and MT plants.
Ijms 19 02088 g003
Figure 4. Kyoto Encyclopedia of Genes and Genomes (KEGG) classification of DEGs in the comparisons of WT and MT plants.
Ijms 19 02088 g004
Figure 5. T-DNA regions of the binary plasmids used for Agrobacterium tumefaciens-mediated transformation, as follows: (a) Construct of the binary vector pCAMBIA3301, and (b) p35S::SmGASA4 binary plasmid containing Bar and SmGASA4, driven by the 35S promoter, 35S-P; the cauliflower mosaic virus-CaMV35S RNA promoter, 35S-T; CaMV35S poly A; NOS-T, the 3′ terminator region of the nopaline synthase; Bar; phosphinothricin (R). RB—right border; LB, left border.
Ijms 19 02088 g005
Figure 6. SmGASA4 Arobidopsis phenotypic observations, as follows: (a) 12 leaflet old Arobidopsis, (b) WT and SmGASA4 leaves, (c) ripe period old Arobidopsis, (d) WT and SmGASA4 flowers, (e) WT and SmGASA4 capsules, (f) WT and SmGASA4 roots.
Ijms 19 02088 g006
Figure 7. Effects of SmGASA4 overexpression during S. militiorrhiza drought stress, as follows: (a) 90 day old S. miltiorrhiza phenotype, (b) S. miltiorrhiza before stress, (c) 30 day S. miltiorrhiza drought stress, (d) 4 day S. miltiorrhiza 250 mmol/L NaCl stress, (e) 29 day S. miltiorrhiza 200 μmol/L GA3 treatment, and (f) 29 day S. miltiorrhiza 300 μmol/L PBZ stress.
Ijms 19 02088 g007
Figure 8. Effects of SmGASA4 overexpression during Arobidopsis stress treatment, as follows: (a) Arobidoposis before stress, (b) 30 day drought stress, (c) 10 day 200 mmol/L NaCl stress, (d) 16 day 200 μmol/L GA3 treatment, and (e) 10 day 100 μmol/L paclobutrazol (PBZ) stress.
Ijms 19 02088 g008

