Evaluation of Two Liver Treatment Strategies in a Mouse Model of Niemann–Pick-Disease Type C1

 , ,
, ,
Abstract
:1. Introduction
2. Results
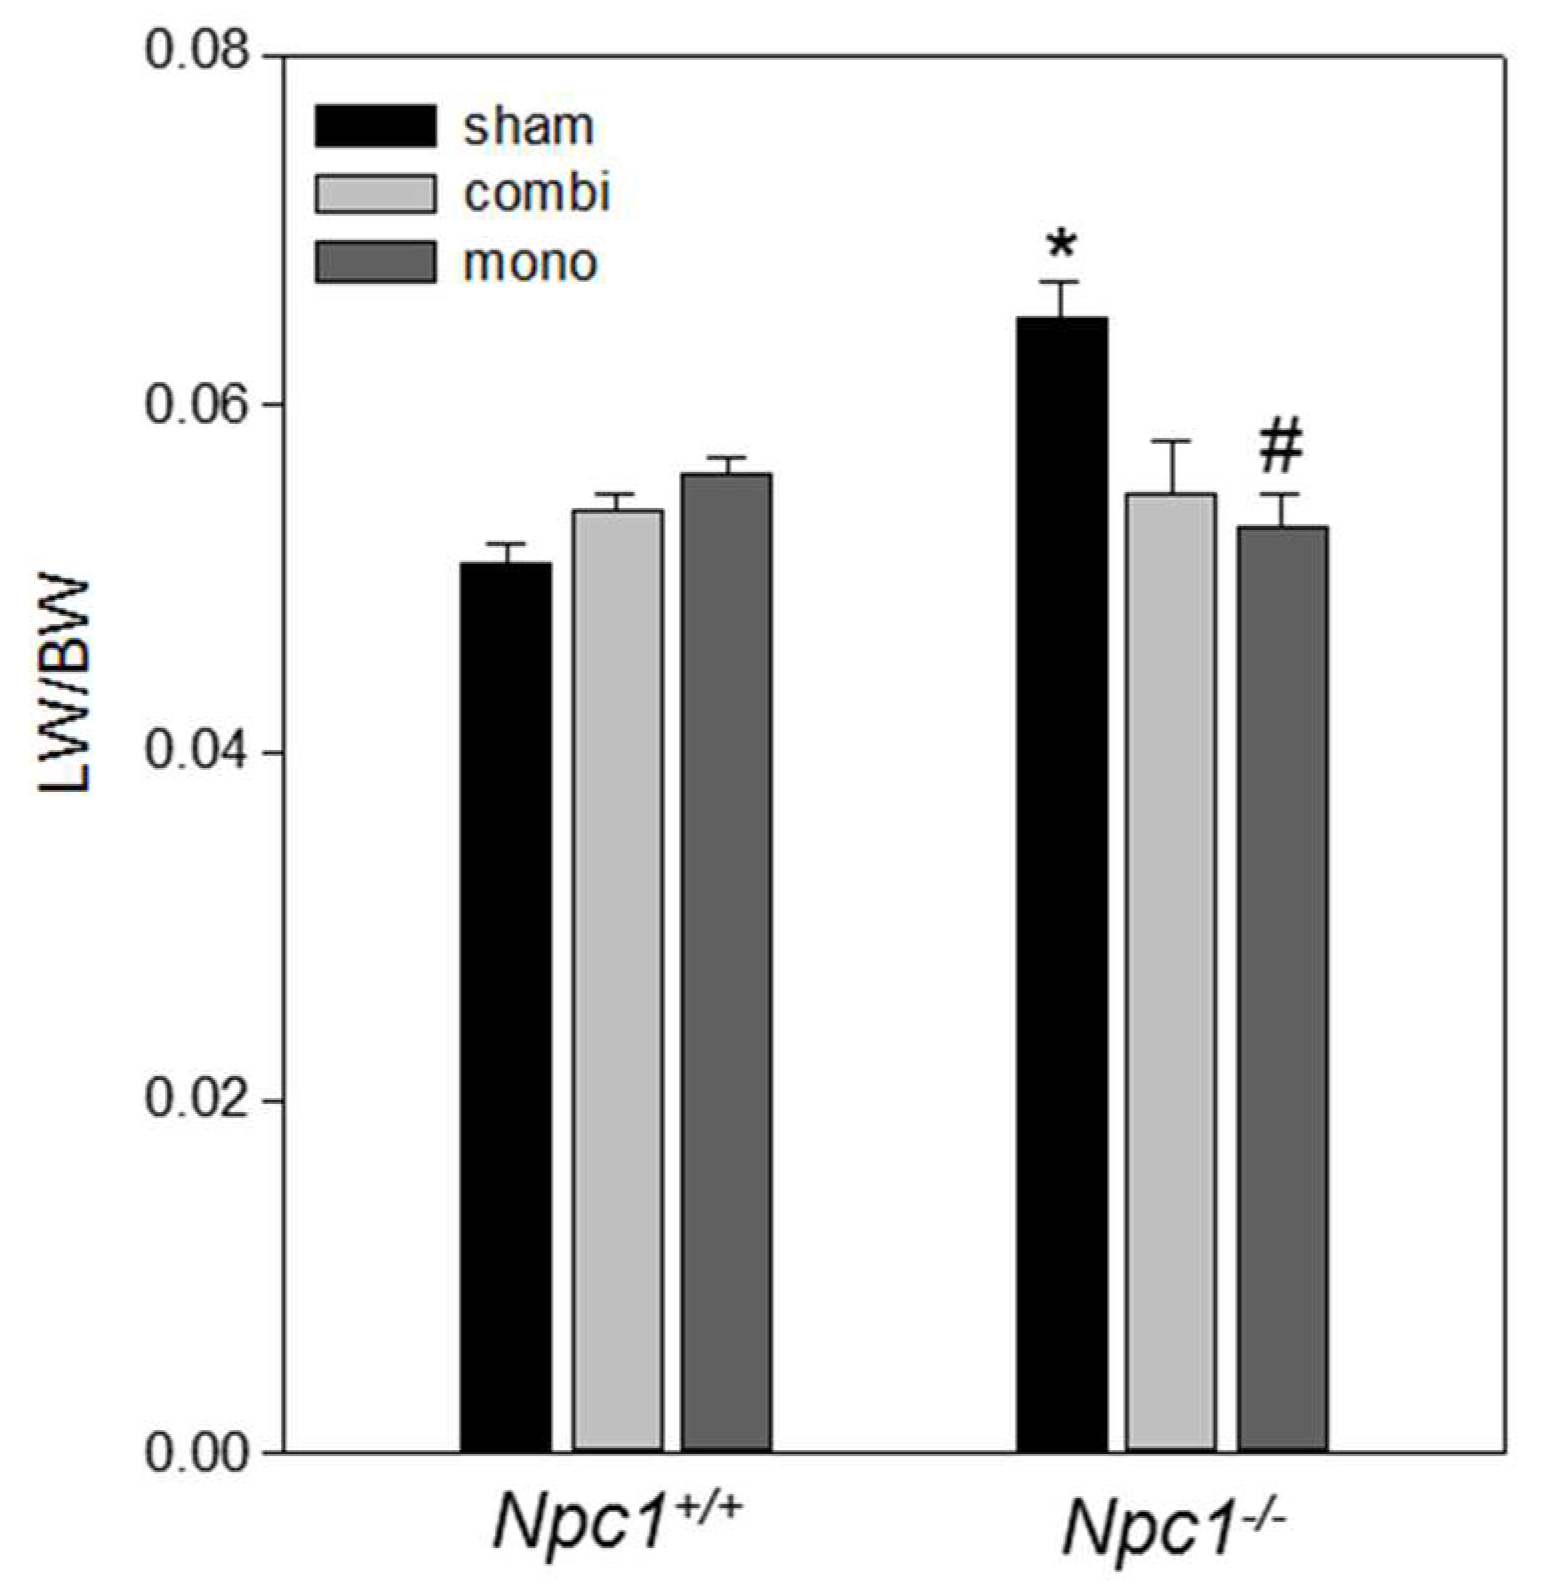
2.1. Body Weight
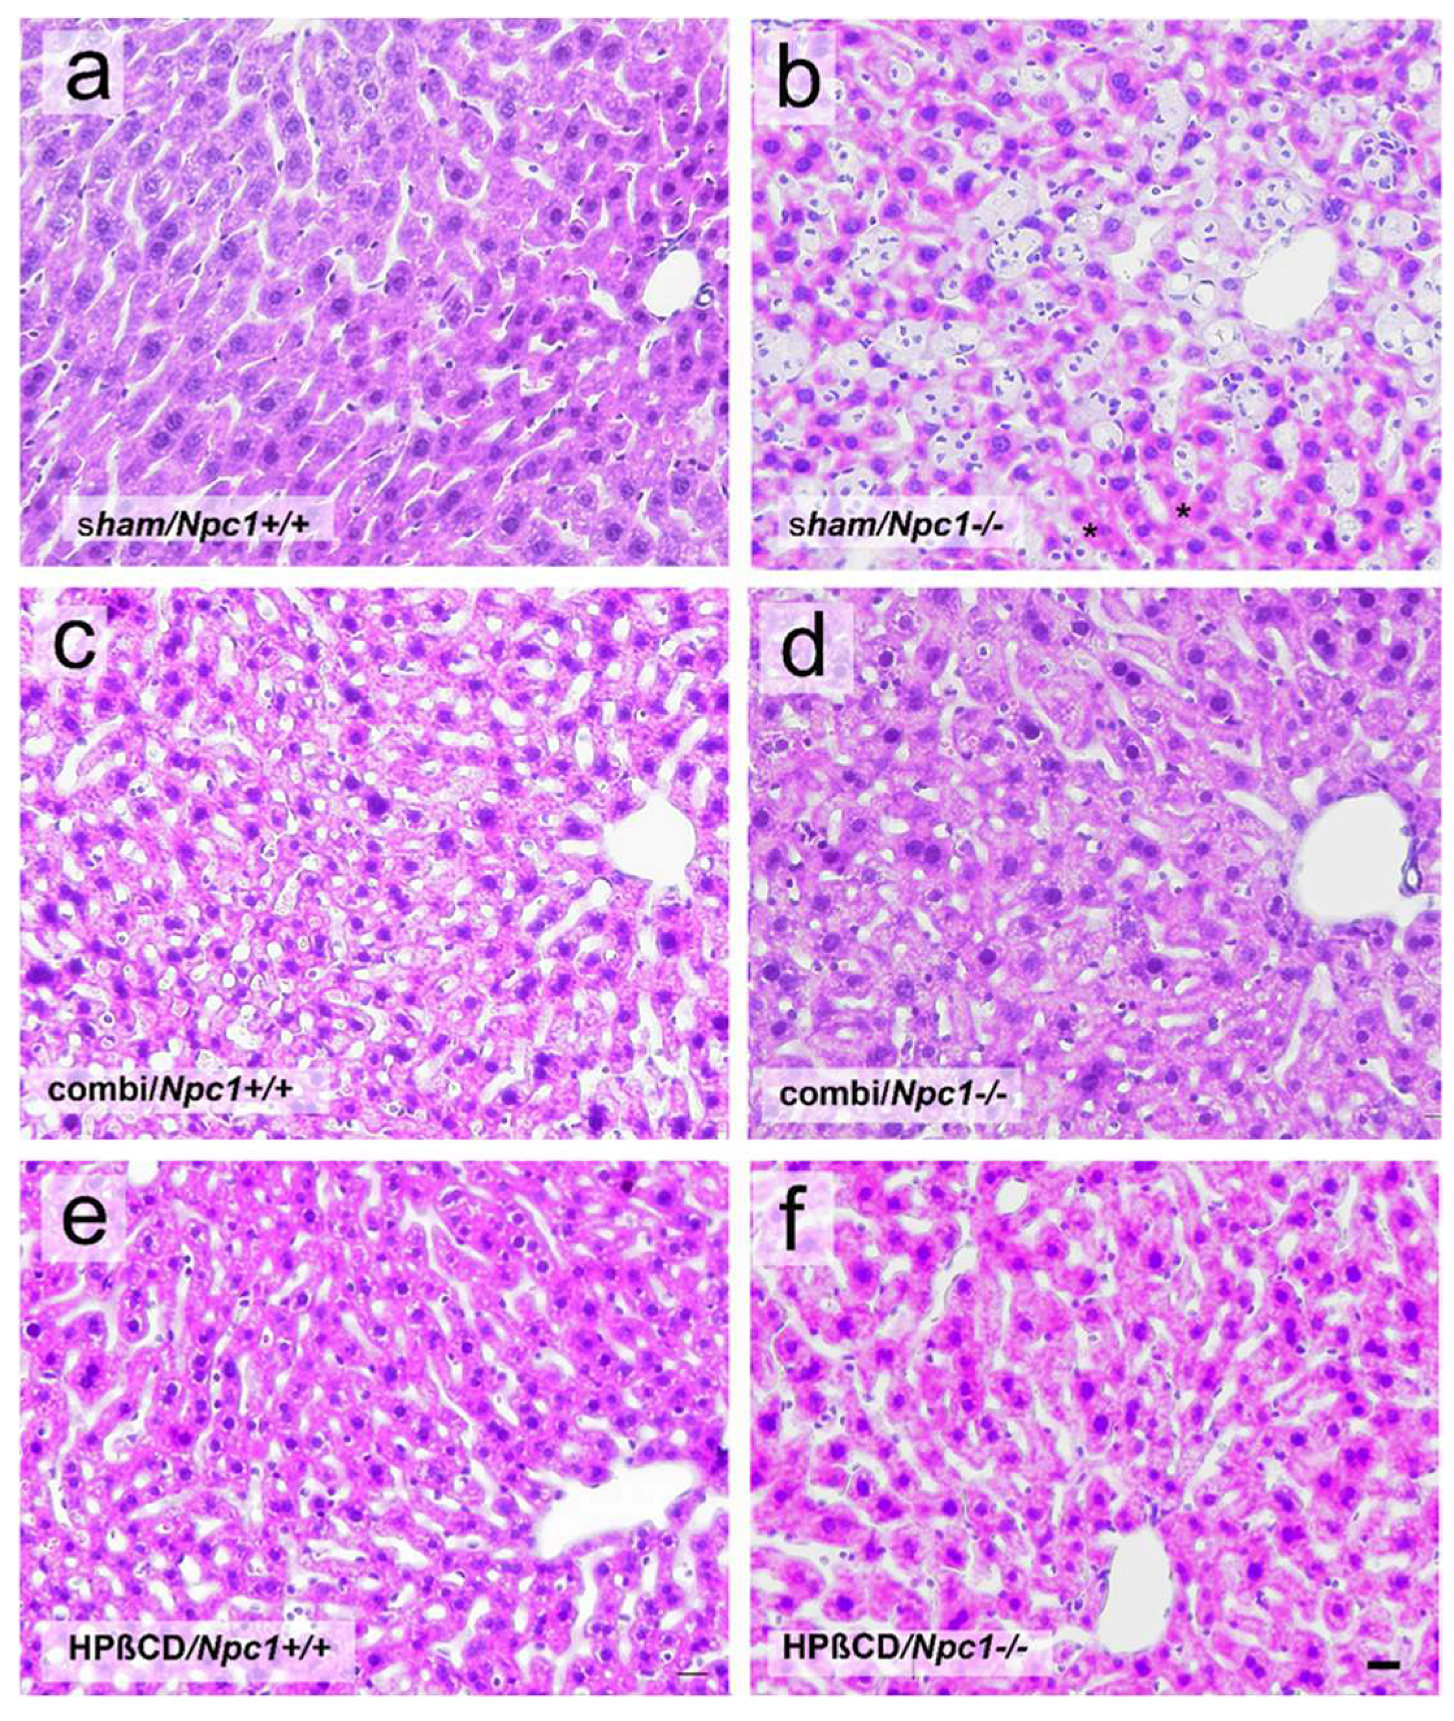
2.2. Histology
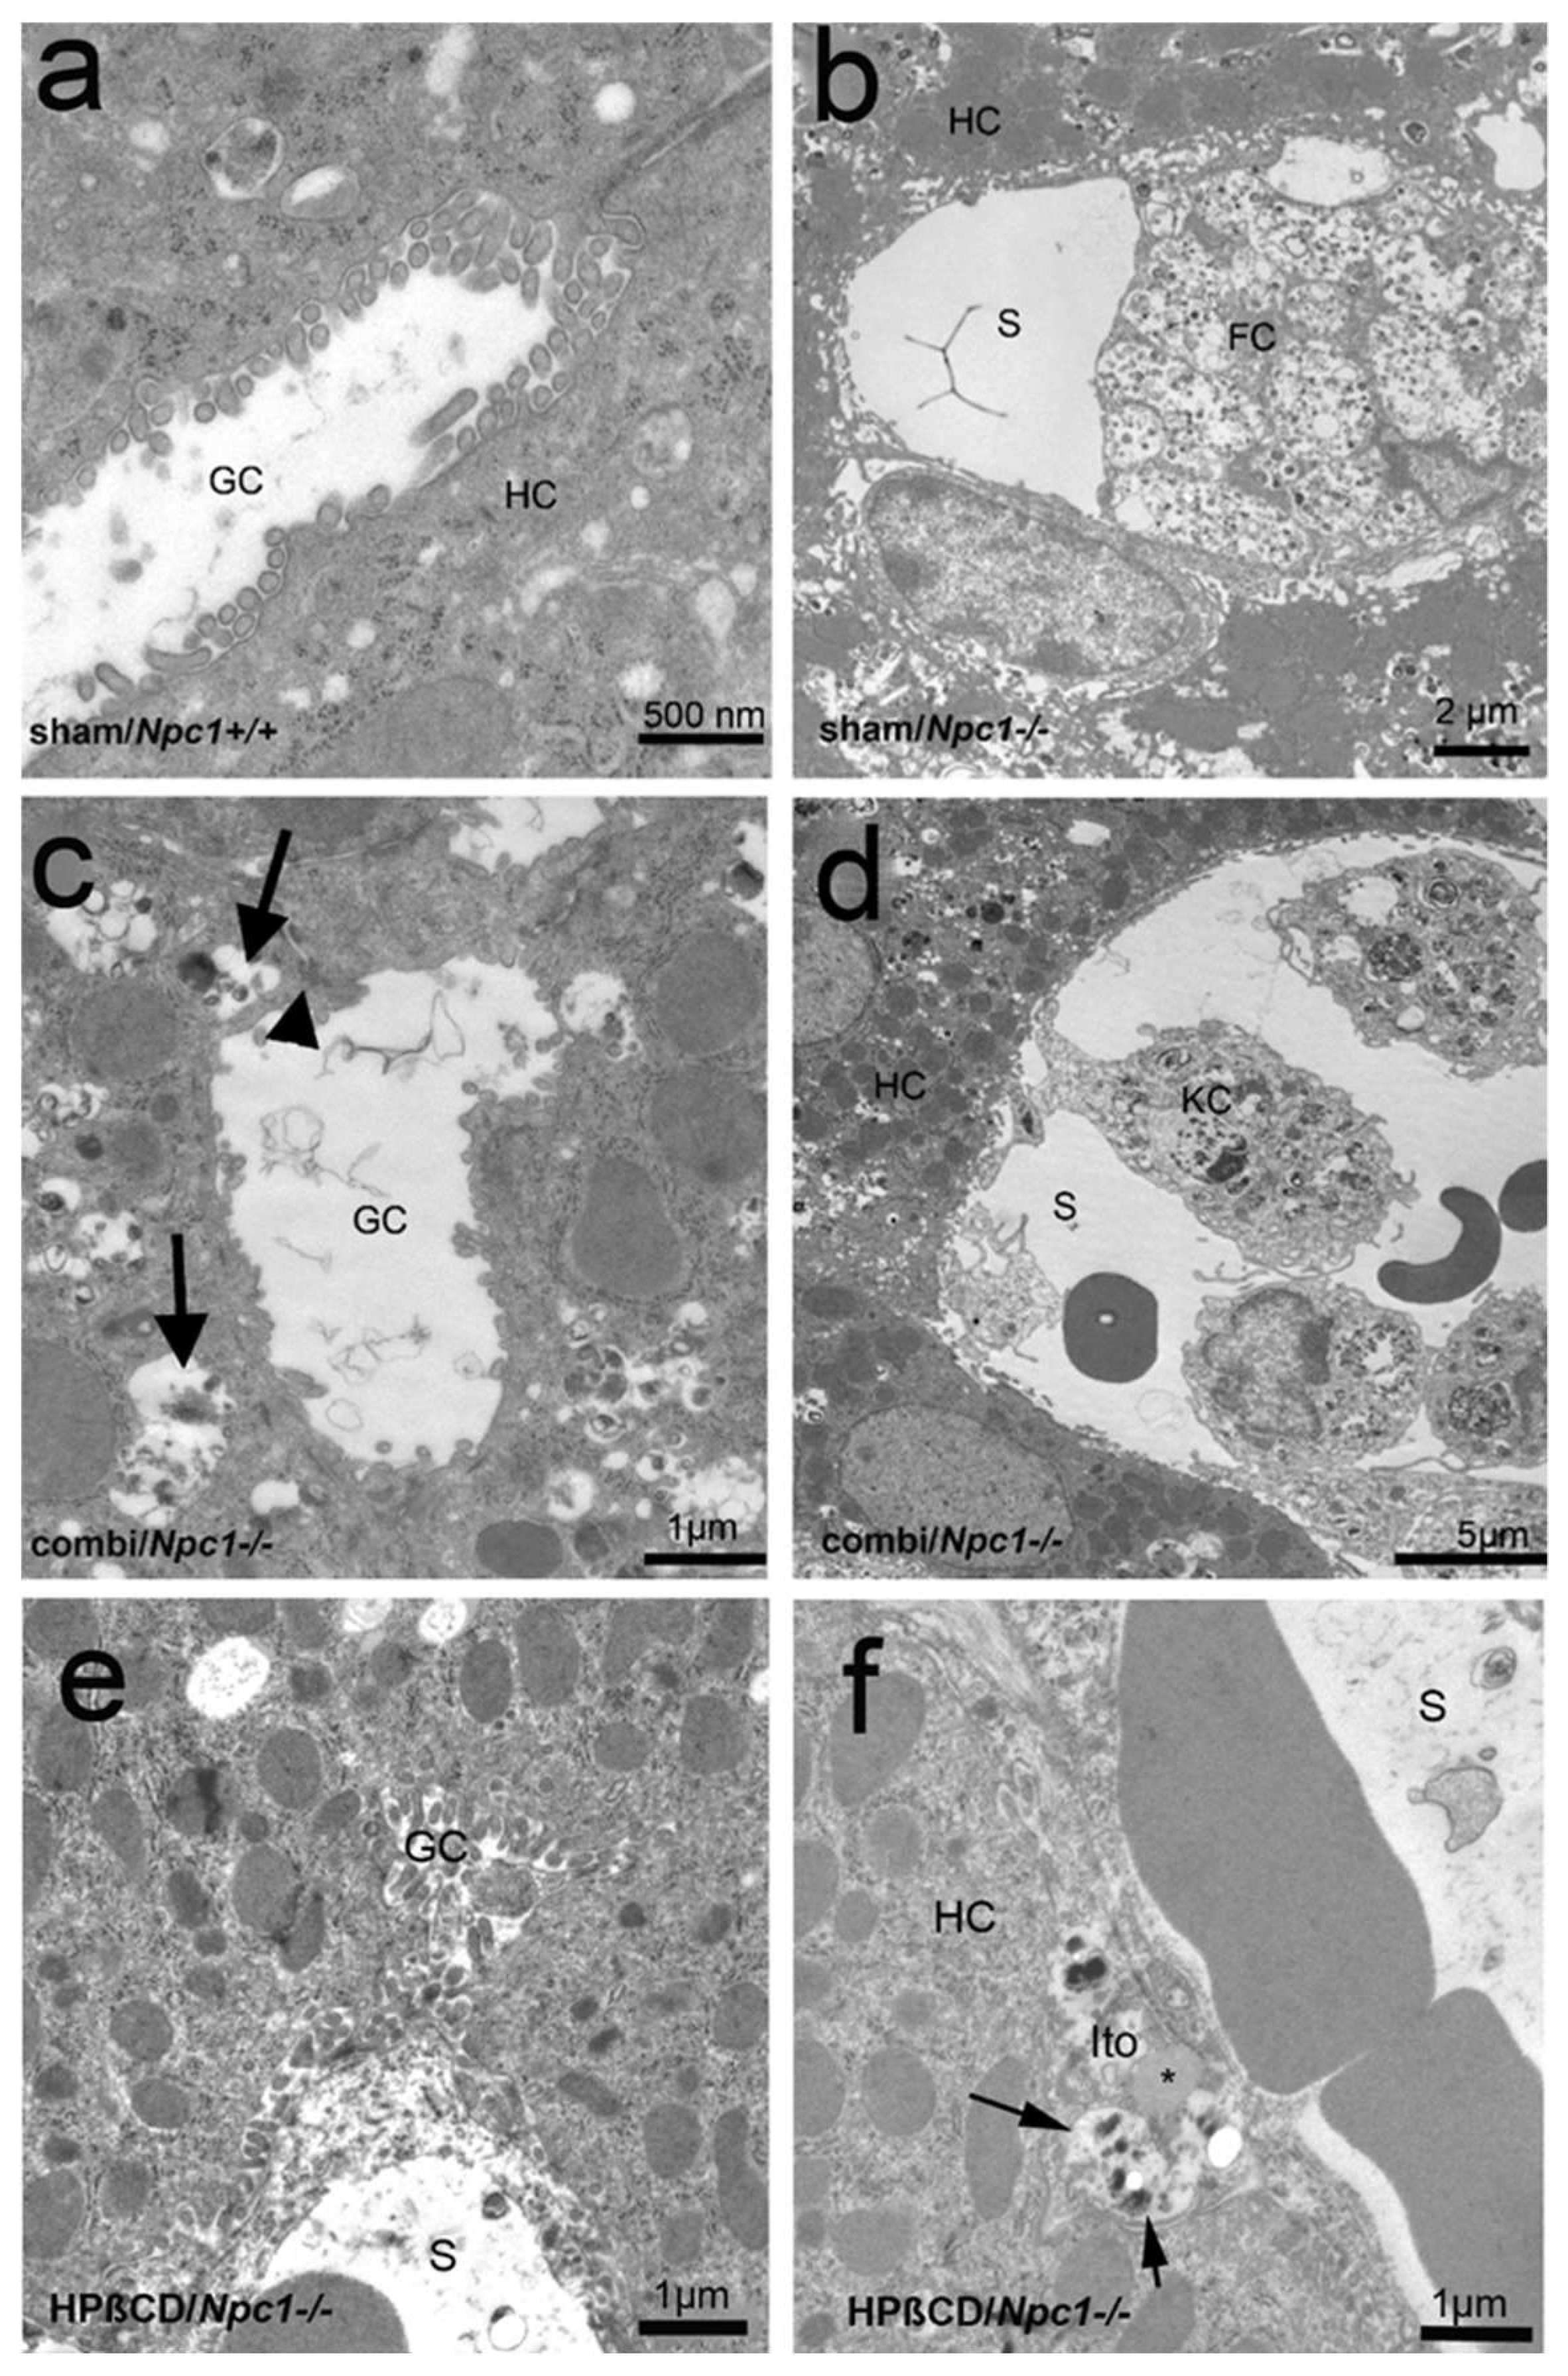
2.3. Electron Microscopy
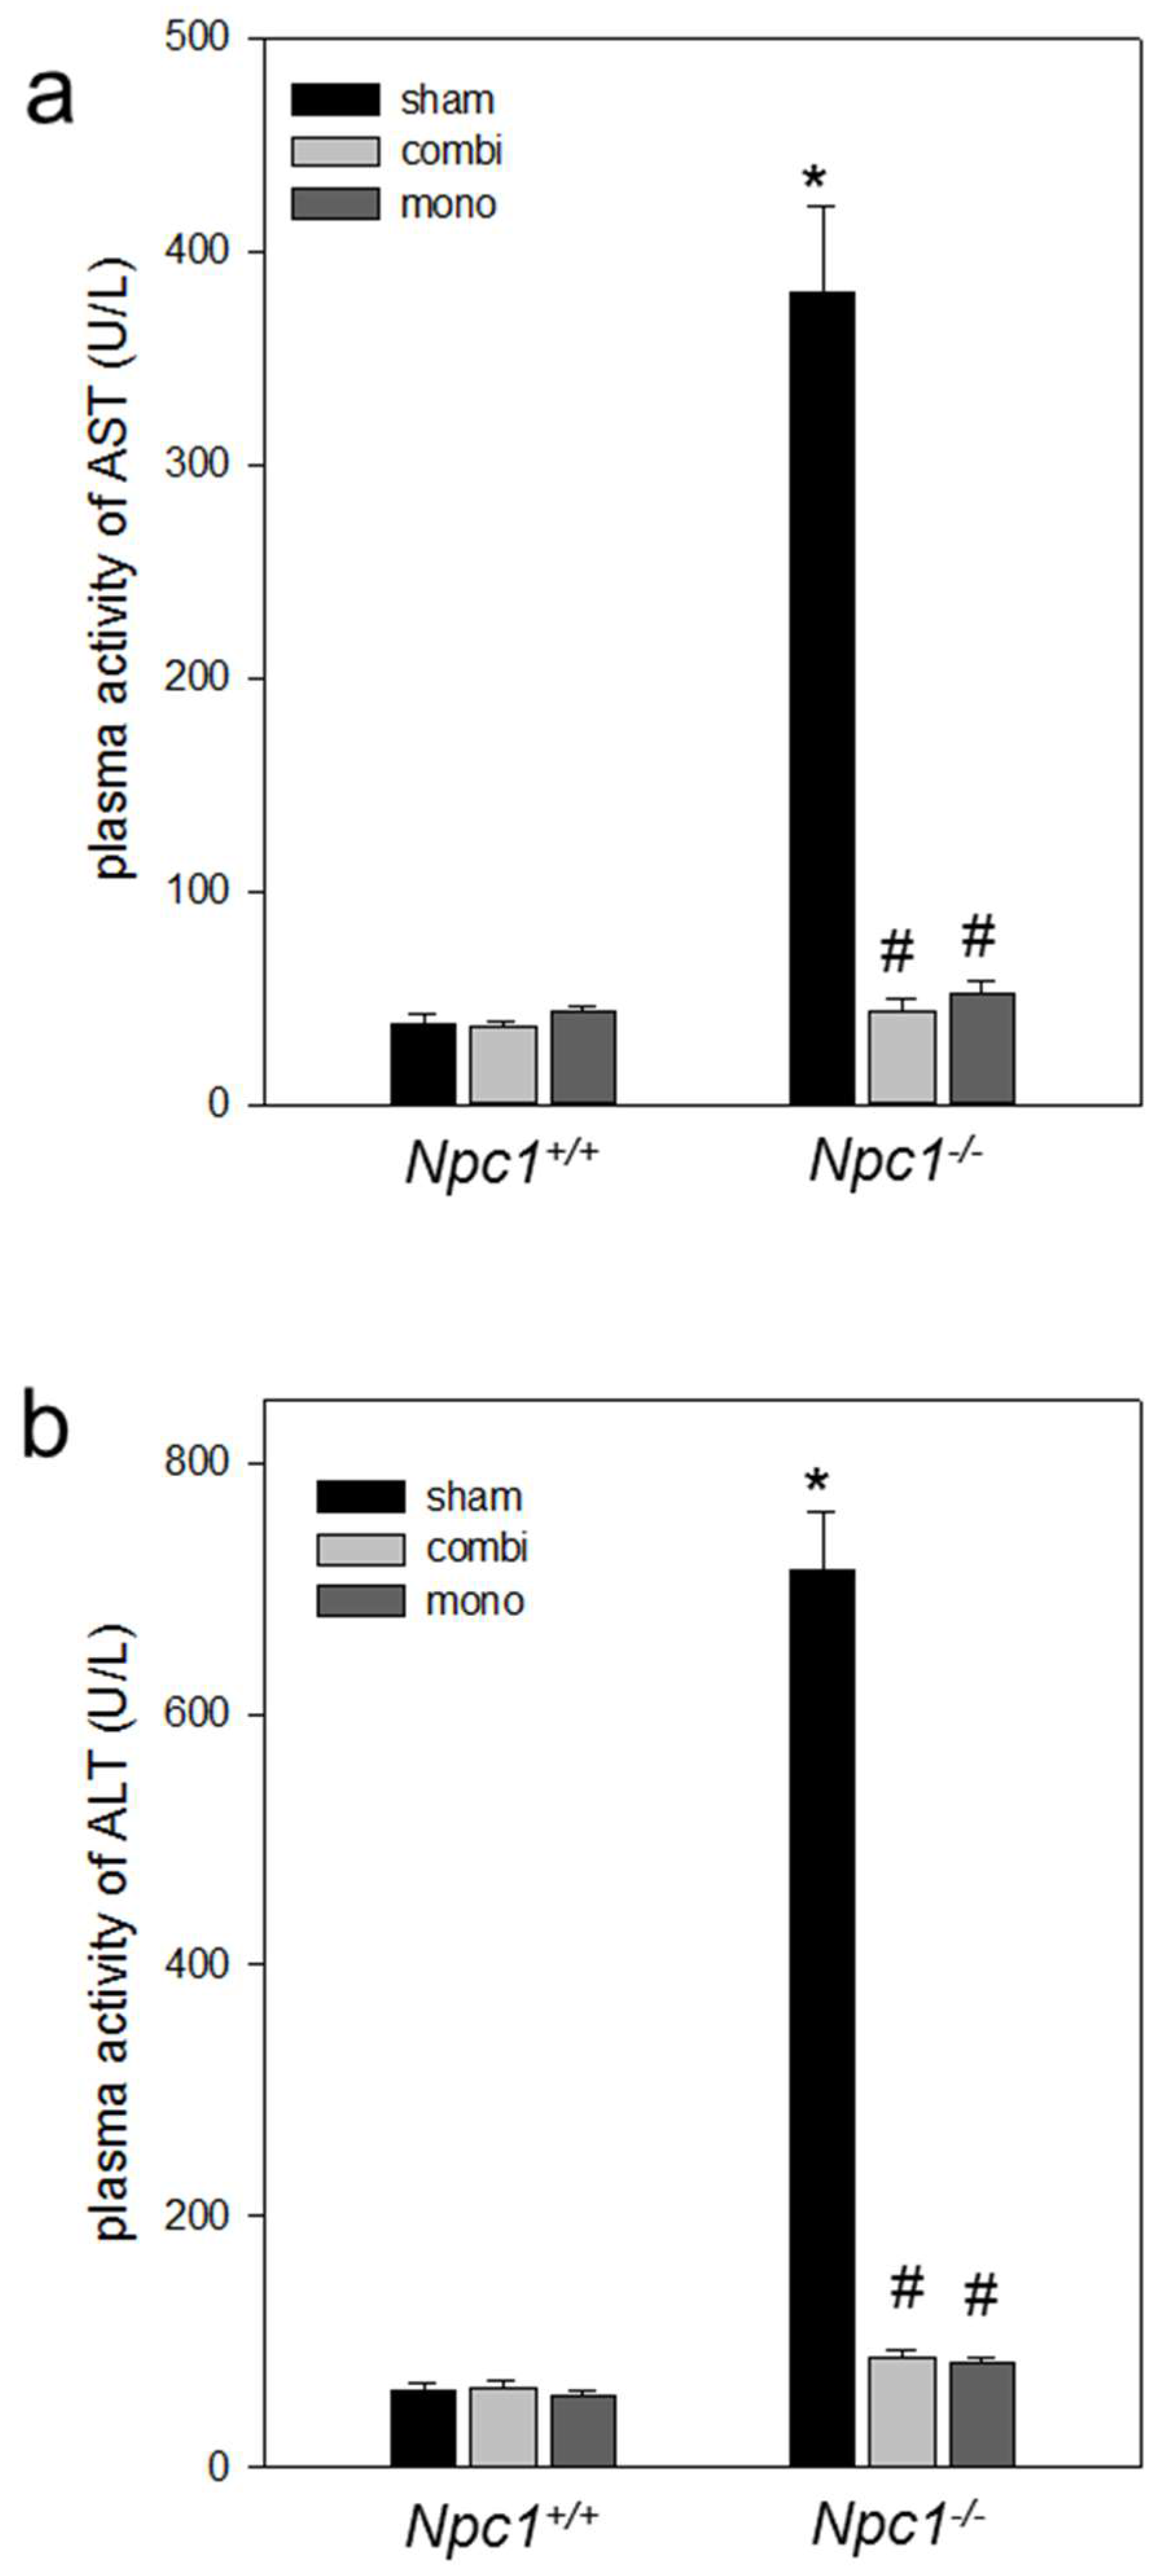
2.4. Biochemistry
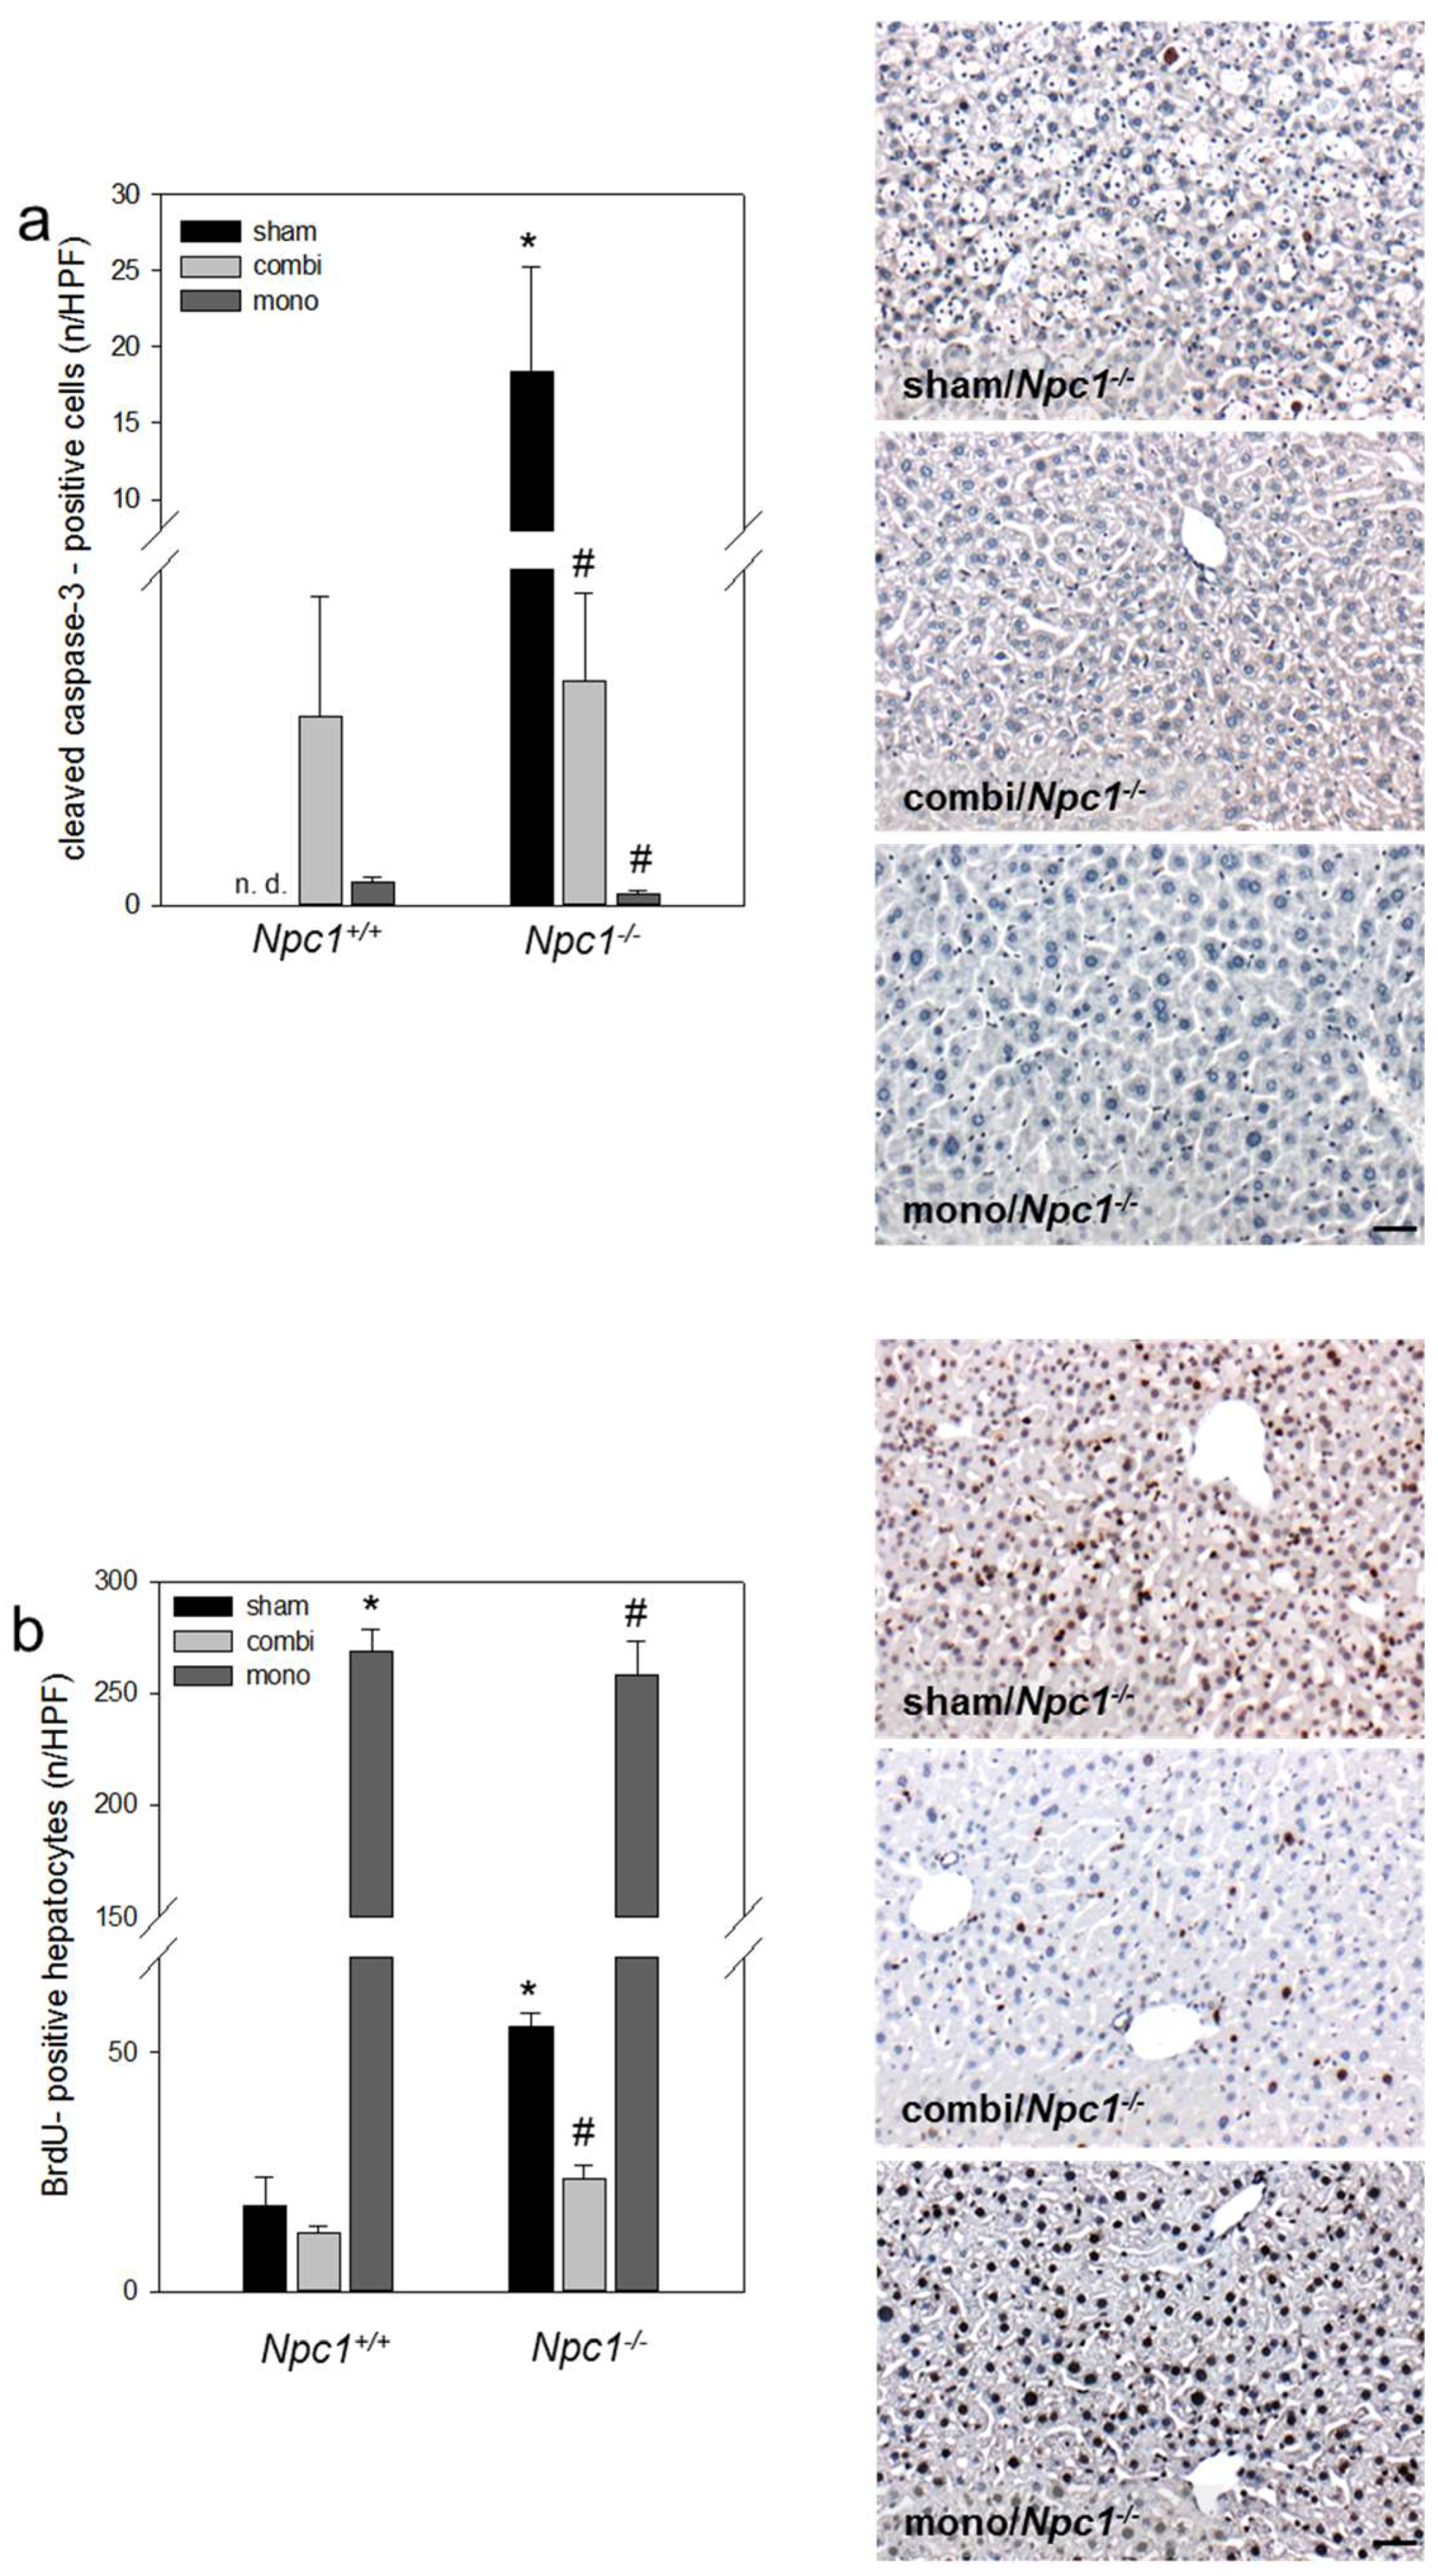
2.5. Immunohistochemistry of Cell Dynamics—Apoptosis and Proliferation
2.6. Inflammation and Cholesterol Homeostasis
2.6.1. Both Combination Therapy and Monotherapy Reduced Hepatic Inflammation
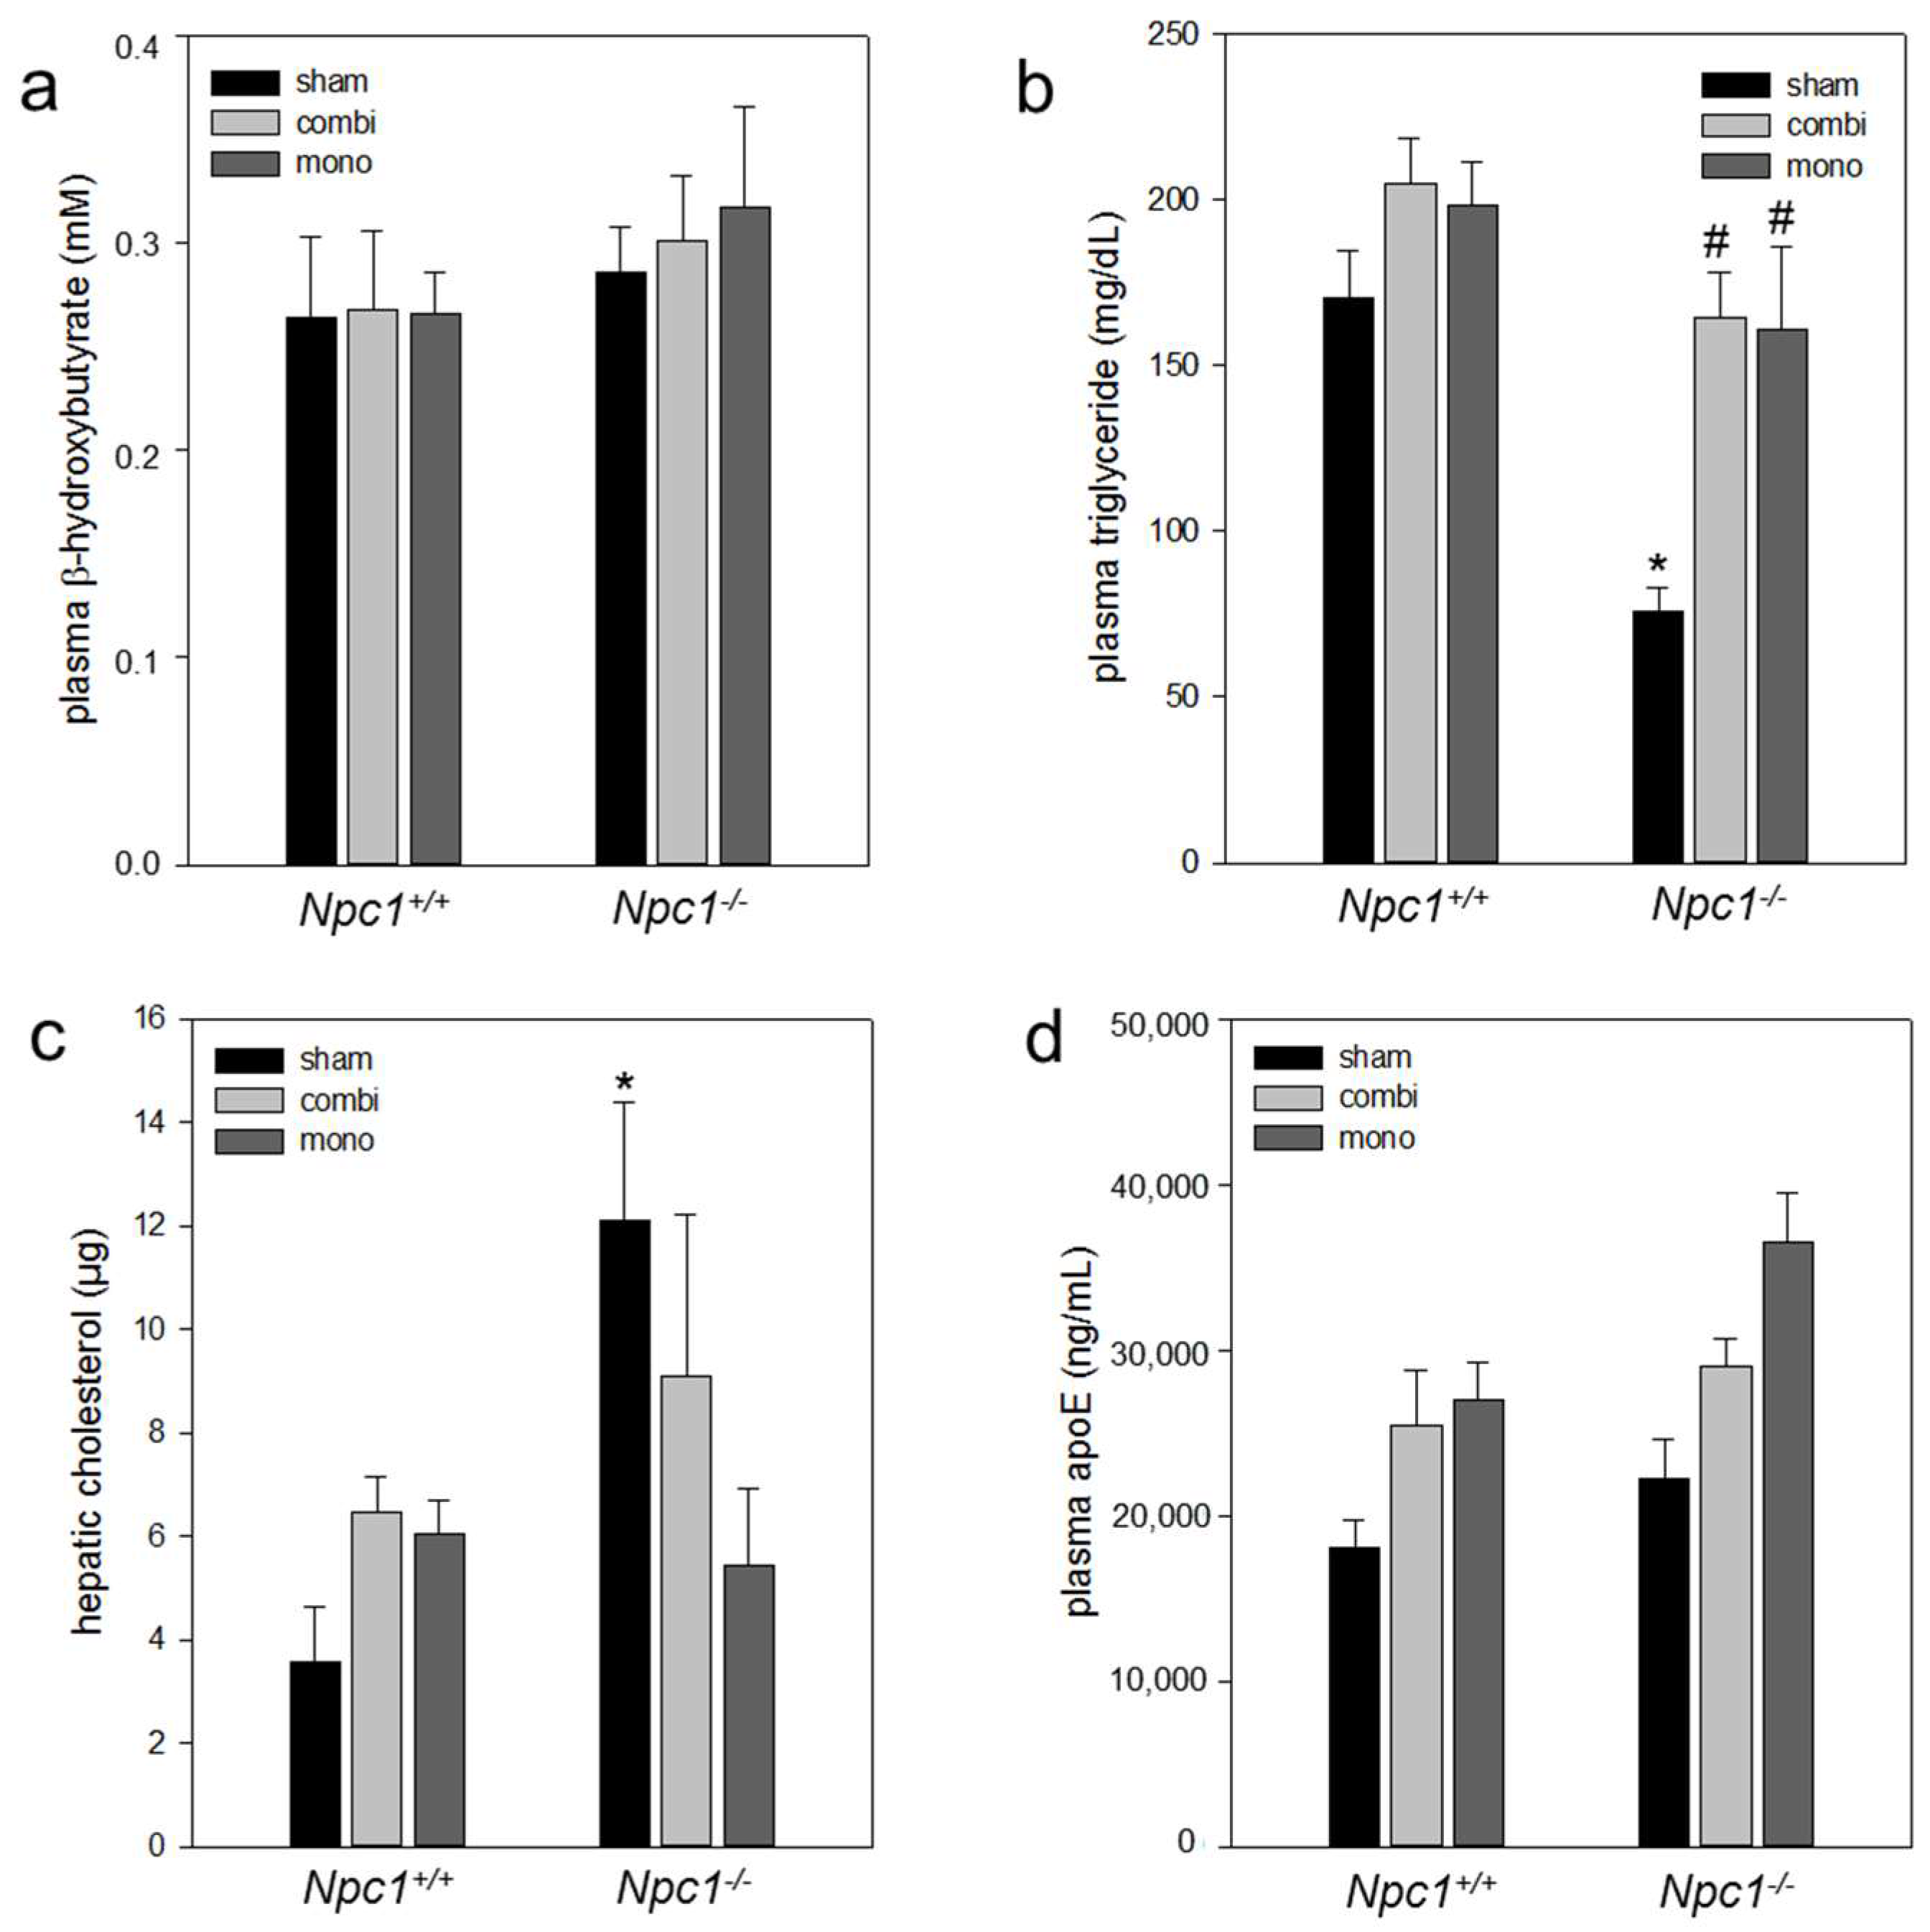
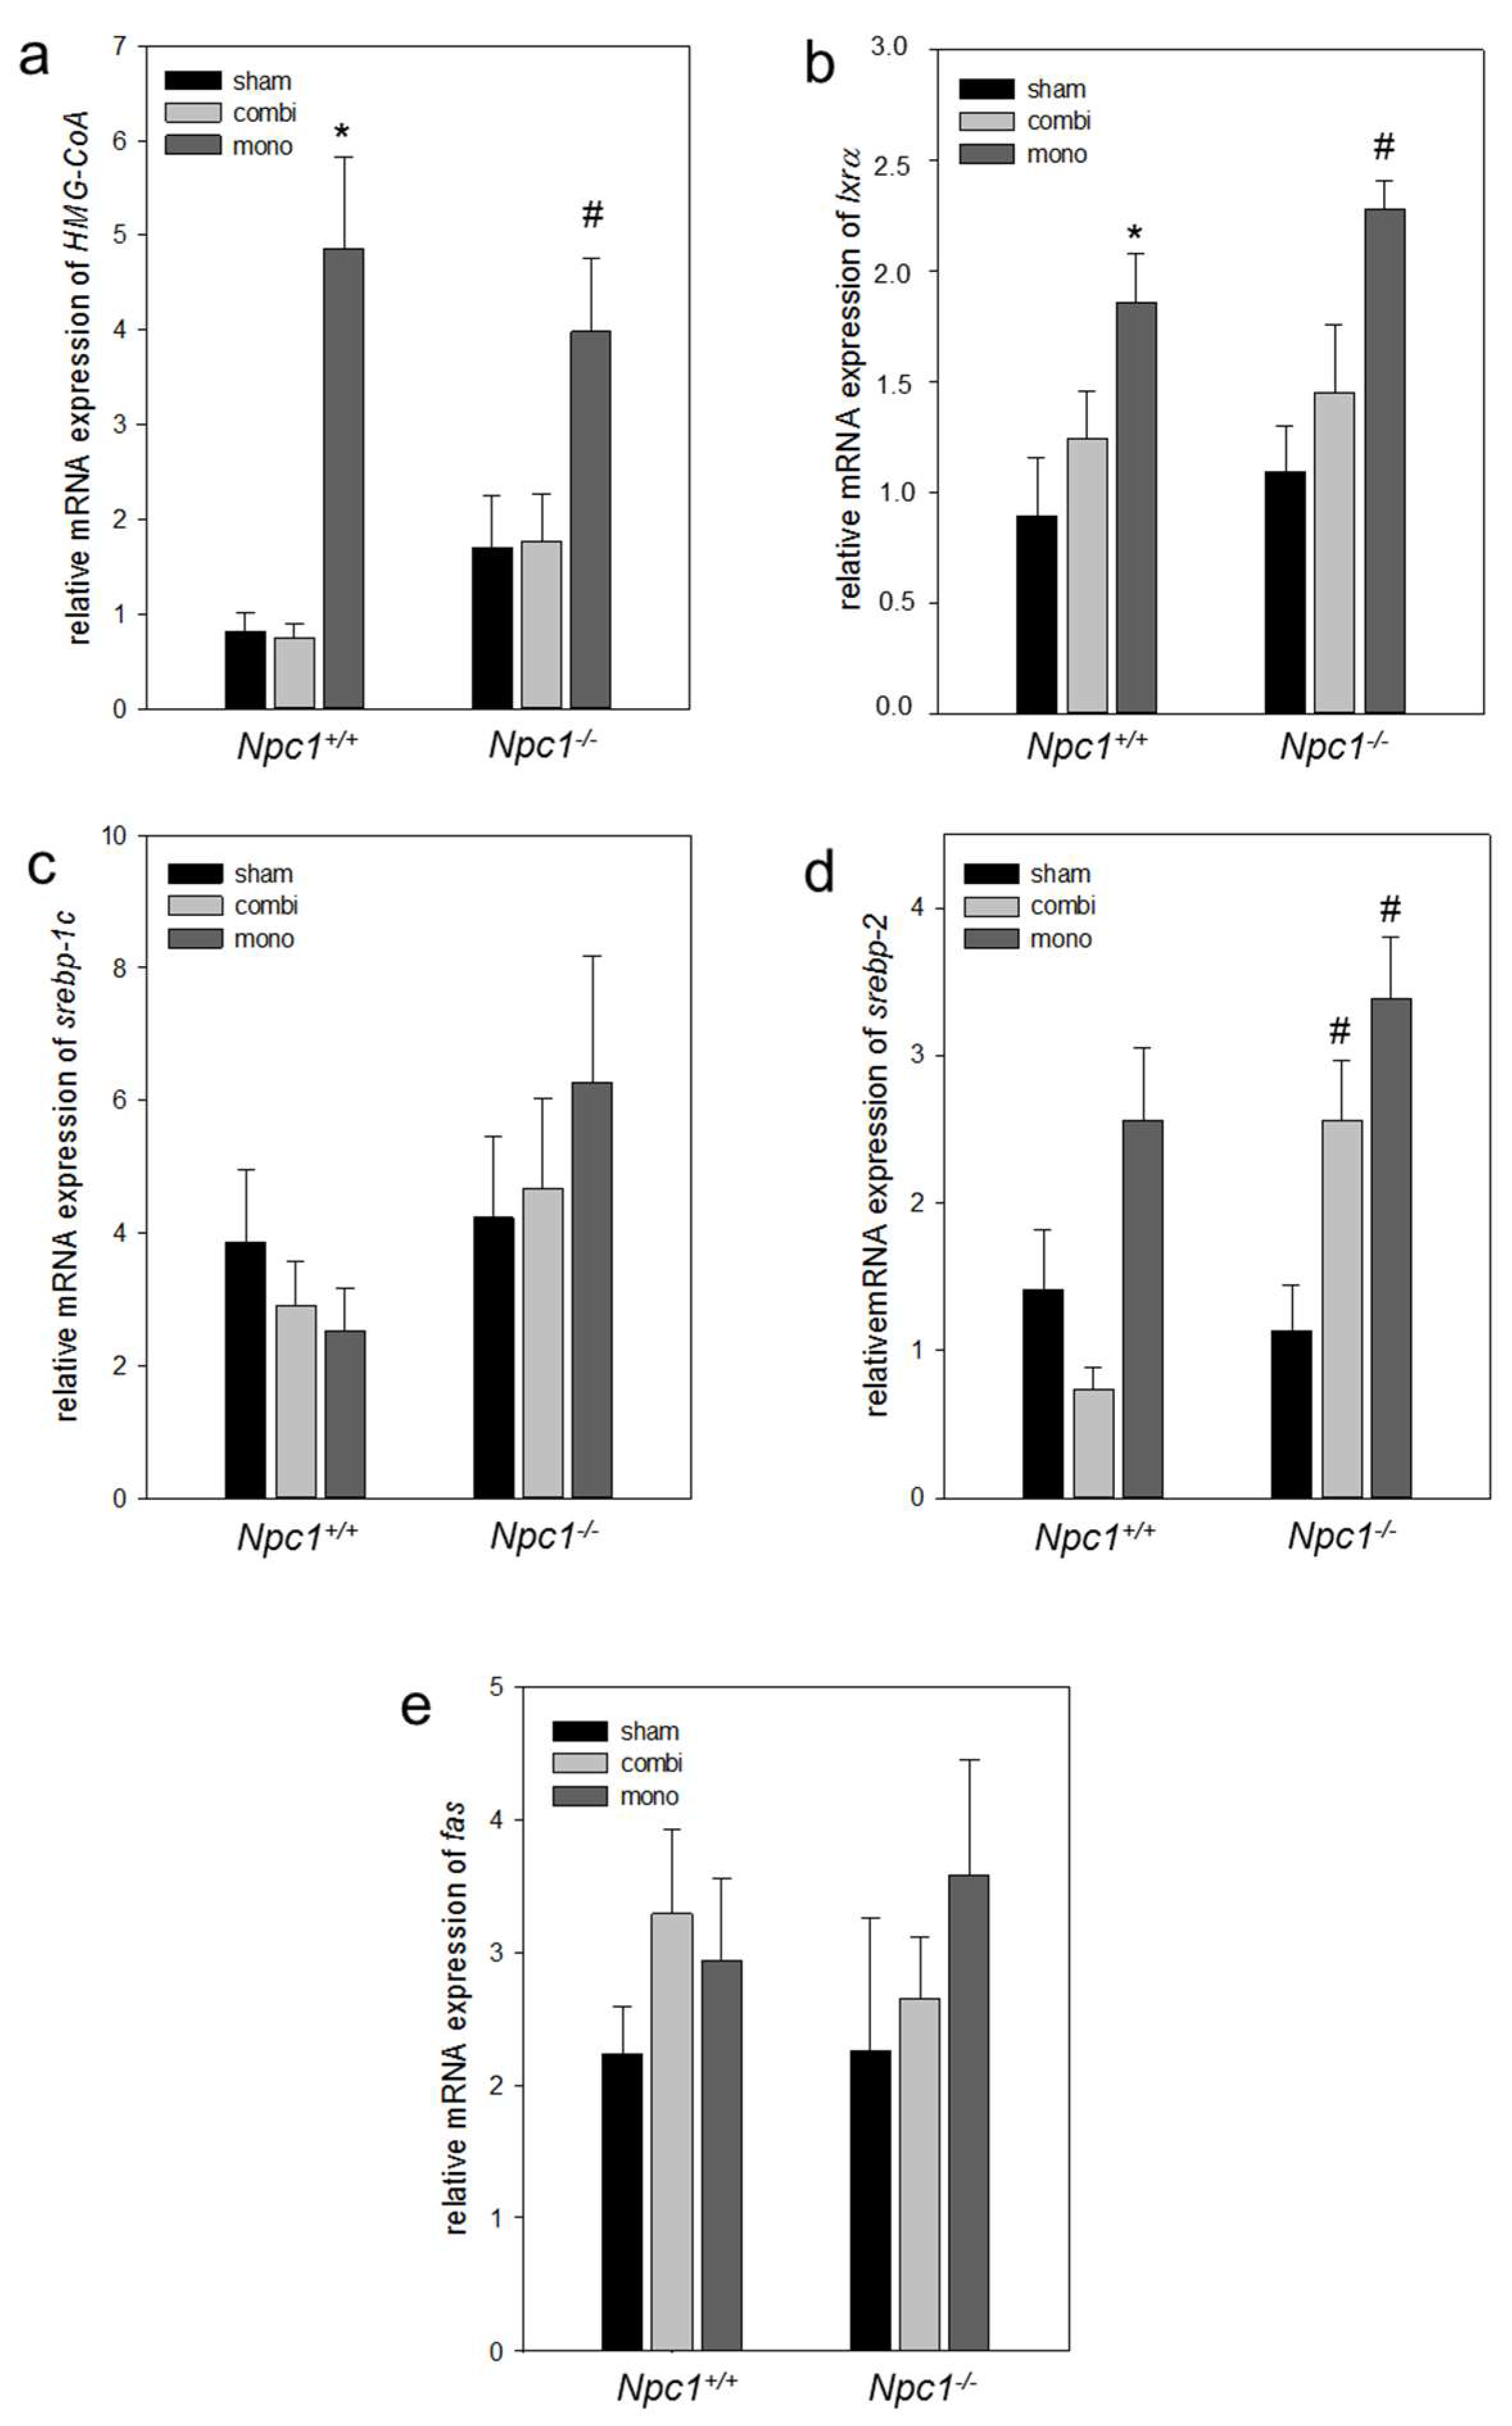
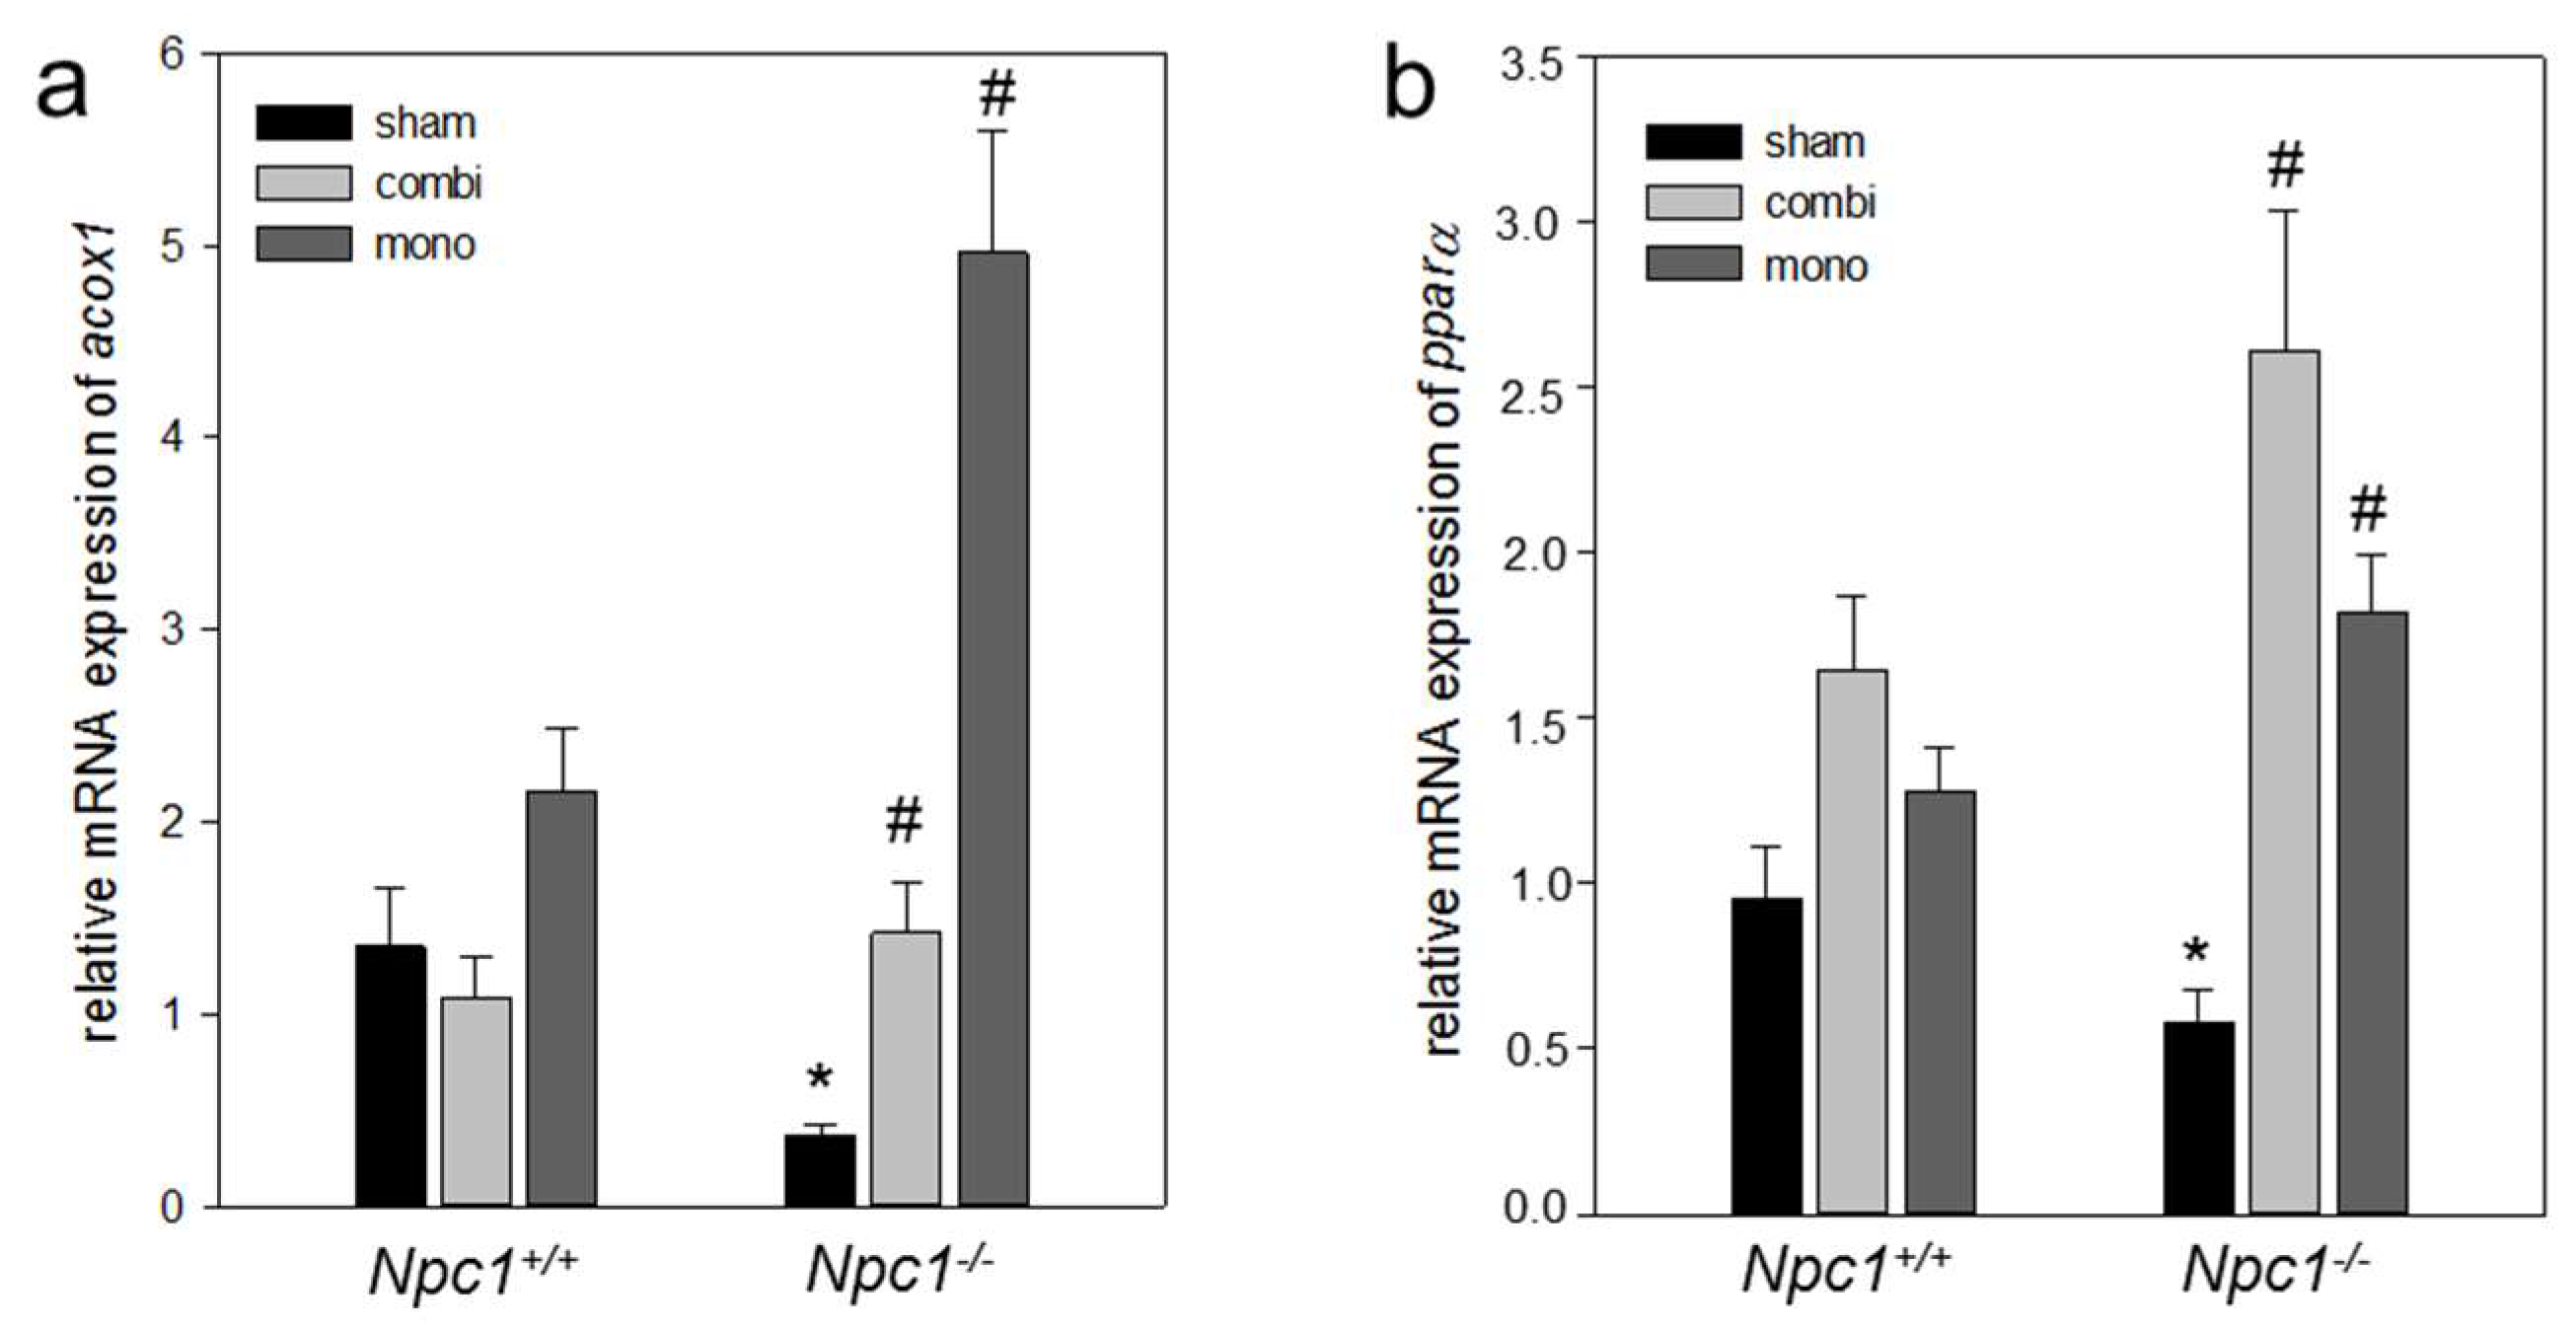
2.6.2. Combination Therapy and In Particular Monotherapy Restored the Cholesterol Homeostasis in Npc1−/− Mice
3. Discussion
4. Methods
4.1. Animals
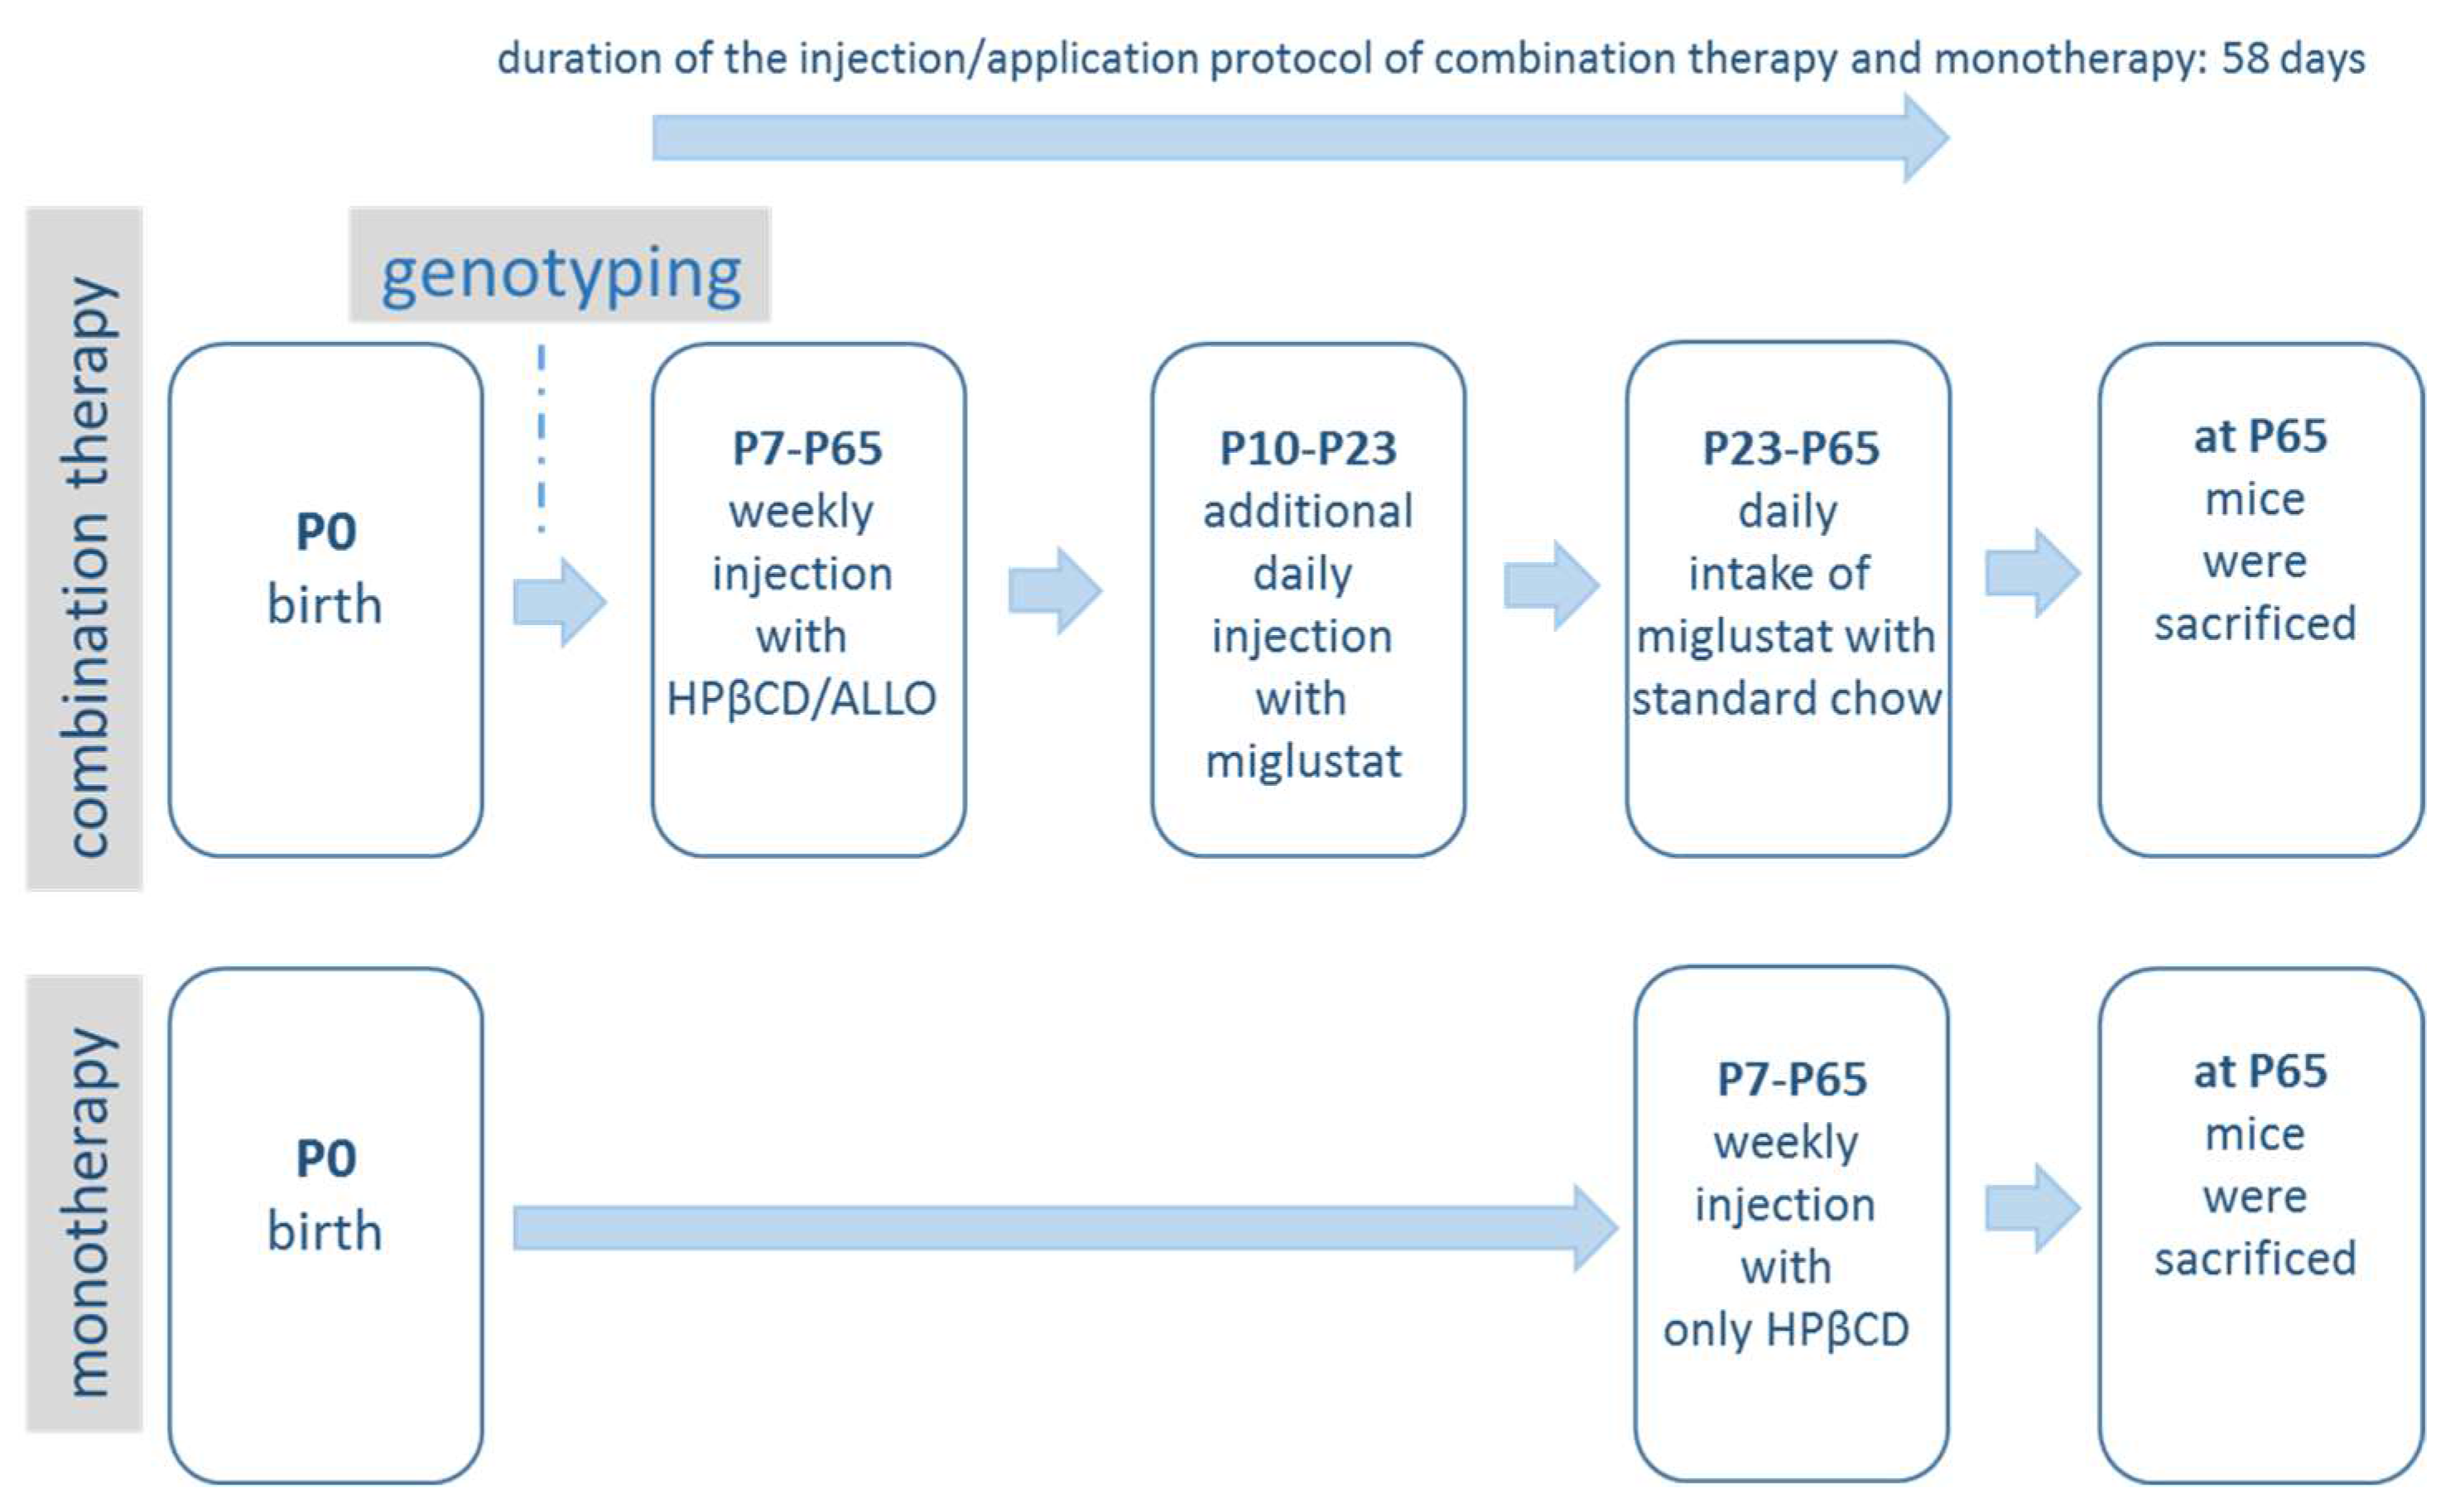
4.2. Pharmacological Treatment
4.3. BrdU Injections
4.4. Sampling and Assays
4.5. Quantitative Real-Time RT-PCR Analysis
4.6. Histology and Immunohistochemistry
4.7. Electron Microscopy
4.8. Statistical Analysis
Acknowledgments
Author Contributions
Conflicts of Interest
References
- Garver, W.S.; Jelinek, D.; Oyarzo, J.N.; Flynn, J.; Zuckerman, M.; Krishnan, K.; Chung, B.H.; Heidenreich, R.A. Characterization of liver disease and lipid metabolism in the Niemann-Pick C1 mouse. J. Cell. Biochem. 2007, 101, 498–516. [Google Scholar] [CrossRef] [PubMed]
- Garver, W.S.; Jelinek, D.; Meaney, F.J.; Flynn, J.; Pettit, K.M.; Shepherd, G.; Heidenreich, R.A.; Vockley, C.M.; Castro, G.; Francis, G.A. The National Niemann-Pick Type C1 Disease Database: Correlation of lipid profiles, mutations, and biochemical phenotypes. J. Lipid Res. 2010, 51, 406–415. [Google Scholar] [CrossRef] [PubMed]
- Carstea, E.D.; Morris, J.A.; Coleman, K.G.; Loftus, S.K.; Zhang, D.; Cummings, C.; Gu, J.; Rosenfeld, M.A.; Pavan, W.J.; Krizman, D.B.; et al. Niemann-Pick C1 disease gene: Homology to mediators of cholesterol homeostasis. Science 1997, 277, 228–231. [Google Scholar] [CrossRef] [PubMed]
- Patterson, M.C.; Vanier, M.T.; Suzuki, K.; Morris, J.A.; Carstea, E.D.; Neufeld, E.B.; Blanchette-Mackie, E.J.; Pentchev, P.G. Niemann-Pick disease type C: A lipid trafficking disorder. In The Metabolic and Molecular Bases of Inherited Disease, 8th ed.; Scriver, C., Beaudet, A., Sly, W., Vale, D., Eds.; McGraw Hill: New York, NY, USA, 2001; Volume 145, pp. 3611–3634. [Google Scholar] [CrossRef]
- Chang, T.Y.; Li, B.L.; Chang, C.C.; Urano, Y. Acyl-coenzyme A: Cholesterol acyltransferases. Am. J. Physiol. Endocrinol. Metab. 2009, 297, E1–E9. [Google Scholar] [CrossRef] [PubMed]
- Sakashita, N.; Lei, X.; Kamikawa, M.; Nishitsuji, K. Role of ACAT1-positive late endosomes in macrophages: Cholesterol metabolism and therapeutic applications for Niemann-Pick disease type C. J. Med. Investig. 2014, 61, 270–277. [Google Scholar] [CrossRef]
- Xie, C.; Turley, S.D.; Dietschy, J.M. Cholesterol accumulation in tissues of the Niemann-pick type C mouse is determined by the rate of lipoprotein-cholesterol uptake through the coated-pit pathway in each organ. Proc. Natl. Acad. Sci. USA 1999, 96, 11992–11997. [Google Scholar] [CrossRef] [PubMed]
- Beltroy, E.P.; Richardson, J.A.; Horton, J.D.; Turley, S.D.; Dietschy, J.M. Cholesterol accumulation and liver cell death in mice with Niemann-Pick type C disease. Hepatology 2005, 42, 886–893. [Google Scholar] [CrossRef] [PubMed]
- Chen, F.W.; Gordon, R.E.; Ioannou, Y.A. NPC1 late endosomes contain elevated levels of non-esterified (‘free’) fatty acids and an abnormally glycosylated form of the NPC2 protein. Biochem. J. 2005, 390, 549–561. [Google Scholar] [CrossRef] [PubMed]
- Jelinek, D.; Castillo, J.J.; Garver, W.S. The C57BL/6J Niemann-Pick C1 mouse model with decreased gene dosage has impaired glucose tolerance independent of body weight. Gene 2013, 527, 65–70. [Google Scholar] [CrossRef] [PubMed]
- Li, A.C.; Glass, C.K. PPAR- and LXR-dependent pathways controlling lipid metabolism and the development of atherosclerosis. J. Lipid Res. 2004, 45, 2161–2173. [Google Scholar] [CrossRef] [PubMed]
- Chen, W.; Sun, Y.; Welch, C.; Gorelik, A.; Leventhal, A.R.; Tabas, I.; Tall, A.R. Preferential ATP-binding cassette transporter A1-mediated cholesterol efflux from late endosomes/lysosomes. J. Biol. Chem. 2001, 276, 43564–43569. [Google Scholar] [CrossRef] [PubMed]
- Choi, H.Y.; Karten, B.; Chan, T.; Vance, J.E.; Greer, W.L.; Heidenreich, R.A.; Garver, W.S.; Francis, G.A. Impaired ABCA1-dependent lipid efflux and hypoalphalipoproteinemia in human Niemann-Pick type C disease. J. Biol. Chem. 2003, 278, 32569–32577. [Google Scholar] [CrossRef] [PubMed]
- Patterson, M.C.; Hendriksz, C.J.; Walterfang, M.; Sedel, F.; Vanier, M.T.; Wijburg, F. NP-C Guidelines Working Group. Recommendations for the diagnosis and management of Niemann-Pick disease type C: An update. Mol. Genet. Metab. 2012, 106, 330–344. [Google Scholar] [CrossRef] [PubMed]
- Actelion. Miglustat (Zavesca) Summary of Product Characteristics EMA (EudraPharm); Actelion: Allschwil, Switzerland, 2010. [Google Scholar]
- Platt, F.M.; Jeyakumar, M. Substrate reduction therapy. Acta Paediatr. 2008, 97, 88–93. [Google Scholar] [CrossRef] [PubMed]
- Ribas, G.S.; Pires, R.; Coelho, J.C.; Rodrigues, D.; Mescka, C.P.; Vanzin, C.S.; Biancini, G.B.; Negretto, G.; Wayhs, C.A.; Wajner, M.; et al. Oxidative stress in Niemann-Pick type C patients: A protective role of N-butyl-deoxynojirimycin therapy. Int. J. Dev. Neurosci. 2012, 30, 439–444. [Google Scholar] [CrossRef] [PubMed]
- Liu, B.; Ramirez, C.M.; Miller, A.M.; Repa, J.J.; Turley, S.D.; Dietschy, J.M. Cyclodextrin overcomes the transport defect in nearly every organ of NPC1 mice leading to excretion of sequestered cholesterol as bile acid. J. Lipid Res. 2010, 51, 933–944. [Google Scholar] [CrossRef] [PubMed]
- Tanaka, Y.; Yamada, Y.; Ishitsuka, Y.; Matsuo, M.; Shiraishi, K.; Wada, K.; Uchio, Y.; Kondo, Y.; Takeo, T.; Nakagata, N.; et al. Efficacy of 2-Hydroxypropyl-β-cyclodextrin in Niemann-Pick Disease Type C Model Mice and Its Pharmacokinetic Analysis in a Patient with the Disease. Biol. Pharm. Bull. 2015, 38, 844–851. [Google Scholar] [CrossRef] [PubMed]
- Maass, F.; Petersen, J.; Hovakimyan, M.; Schmitt, O.; Witt, M.; Hawlitschka, A.; Lukas, J.; Rolfs, A.; Wree, A. Reduced cerebellar neurodegeneration after combined therapy with cyclodextrin/allopregnanolone and miglustat in NPC1: A mouse model of Niemann-Pick type C1 disease. J. Neurosci. Res. 2015, 93, 433–442. [Google Scholar] [CrossRef] [PubMed]
- Hovakimyan, M.; Maass, F.; Petersen, J.; Holzmann, C.; Witt, M.; Lukas, J.; Frech, M.J.; Hübner, R.; Rolfs, A.; Wree, A. Combined therapy with cyclodextrin/allopregnanolone and miglustat improves motor but not cognitive functions in Niemann-Pick Type C1 mice. Neuroscience 2013, 12, 201–211. [Google Scholar] [CrossRef] [PubMed]
- Davidson, C.D.; Ali, N.F.; Micsenyi, M.C.; Stephney, G.; Renault, S.; Dobrenis, K.; Ory, D.S.; Vanier, M.T.; Walkley, S.U. Chronic cyclodextrin treatment of murine Niemann-Pick C disease ameliorates neuronal cholesterol and glycosphingolipid storage and disease progression. PLoS ONE 2009, 4, e6951. [Google Scholar] [CrossRef] [PubMed]
- Ramirez, C.M.; Liu, B.; Taylor, A.M.; Repa, J.J.; Burns, D.K.; Weinberg, A.G.; Turley, S.D.; Dietschy, J.M. Weekly cyclodextrin administration normalizes cholesterol metabolism in nearly every organ of the Niemann-Pick type C1 mouse and markedly prolongs life. Pediatr. Res. 2010, 68, 309–315. [Google Scholar] [CrossRef] [PubMed]
- Matsuo, M.; Togawa, M.; Hirabaru, K.; Mochinaga, S.; Narita, A.; Adachi, M.; Egashira, M.; Irie, T.; Ohno, K. Effects of cyclodextrin in two patients with Niemann-Pick Type C disease. Mol. Genet. Metab. 2013, 108, 76–81. [Google Scholar] [CrossRef] [PubMed]
- Sayre, N.L.; Rimkunas, V.M.; Graham, M.J.; Crooke, R.M.; Liscum, L. Recovery from liver disease in a Niemann-Pick type C mouse model. J. Lipid Res. 2010, 51, 2372–2383. [Google Scholar] [CrossRef] [PubMed]
- Delahunty, T.J.; Rubinstein, D. Accumulation and release of triglycerides by rat liver following partial hepatectomy. J. Lipid Res. 1970, 11, 536–543. [Google Scholar] [PubMed]
- Girard, A.; Roheim, P.S.; Eder, H.A. Lipoprotein synthesis and fatty acid mobilization in rats after partial hepatectomy. Biochim. Biophys. Acta 1971, 248, 105–113. [Google Scholar] [CrossRef]
- Alkhouri, N.; Dixon, L.J.; Feldstein, A.E. Lipotoxicity in nonalcoholic fatty liver disease: Not all lipids are created equal. Expert Rev. Gastroenterol. Hepatol. 2009, 3, 445–451. [Google Scholar] [CrossRef] [PubMed]
- Browning, J.D.; Horton, J.D. Molecular mediators of hepatic steatosis and liver injury. J. Clin. Investig. 2004, 114, 147–152. [Google Scholar] [CrossRef] [PubMed]
- Peet, D.J.; Janowski, B.A.; Mangelsdorf, D.J. The LXRs: A new class of oxysterol receptors. Curr. Opin. Genet. Dev. 1998, 8, 571–575. [Google Scholar] [CrossRef]
- Ducheix, S.; Lobaccaro, J.M.; Martin, P.G.; Guillou, H. Liver X Receptor: An oxysterol sensor and a major player in the control of lipogenesis. Chem. Phys. Lipids 2011, 164, 500–514. [Google Scholar] [CrossRef] [PubMed]
- Taylor, A.M.; Liu, B.; Mari, Y.; Liu, B.; Repa, J.J. Cyclodextrin mediates rapid changes in lipid balance in Npc1−/− mice without carrying cholesterol through the bloodstream. J. Lipid Res. 2012, 53, 2331–2342. [Google Scholar] [CrossRef] [PubMed]
- Rui, L. Energy metabolism in the liver. Compr. Physiol. 2014, 4, 177–197. [Google Scholar] [CrossRef] [PubMed]
- Berger, J.; Moller, D.E. The mechanisms of action of PPARs. Annu. Rev. Med. 2002, 53, 409–435. [Google Scholar] [CrossRef] [PubMed]
- Ogata, M.; Tsujita, M.; Hossain, M.A.; Akita, N.; Gonzalez, F.J.; Staels, B.; Suzuki, S.; Fukutomi, T.; Kimura, G.; Yokoyama, S. On the mechanism for PPAR agonists to enhance ABCA1 gene expression. Atherosclerosis 2009, 205, 413–419. [Google Scholar] [CrossRef] [PubMed]
- Hossain, M.A.; Tsujita, M.; Gonzalez, F.J.; Yokoyama, S. Effects of fibrate drugs on expression of ABCA1 and HDL biogenesis in hepatocytes. Cardiovasc. Pharmacol. 2008, 51, 258–266. [Google Scholar] [CrossRef] [PubMed]
- Vite, C.H.; Bagel, J.H.; Swain, G.P.; Prociuk, M.; Sikora, T.U.; Stein, V.M.; O’Donnell, P.; Ruane, T.; Ward, S.; Crooks, A.; et al. Intracisternal cyclodextrin prevents cerebellar dysfunction and Purkinje cell death in feline Niemann-Pick type C1 disease. Sci. Transl. Med. 2015, 7, 276ra26. [Google Scholar] [CrossRef] [PubMed]
- Liu, B.; Turley, S.D.; Burns, D.K.; Miller, A.M.; Repa, J.J.; Dietschy, J.M. Reversal of defective lysosomal transport in NPC disease ameliorates liver dysfunction and neurodegeneration in the npc1−/− mouse. Proc. Natl. Acad. Sci. USA 2009, 106, 2377–2382. [Google Scholar] [CrossRef] [PubMed]
- Krimbou, L.; Denis, M.; Haidar, B.; Carrier, M.; Marcil, M.; Genest, J., Jr. Molecular interactions between apoE and ABCA1: Impact on apoE lipidation. J. Lipid Res. 2004, 45, 839–848. [Google Scholar] [CrossRef] [PubMed]
- Ye, J.; DeBose-Boyd, R.A. Regulation of cholesterol and fatty acid synthesis. Cold Spring Harb. Perspect. Biol. 2011, 3, a004754. [Google Scholar] [CrossRef] [PubMed]
- Wong, J.; Quinn, C.M.; Brown, A.J. SREBP-2 positively regulates transcription of the cholesterol efflux gene, ABCA1, by generating oxysterol ligands for LXR. Biochem. J. 2006, 400, 485–491. [Google Scholar] [CrossRef] [PubMed]
- Siperstein, M.D. Role of cholesterogenesis and isoprenoid synthesis in DNA replication and cell growth. J. Lipid Res. 1984, 25, 1462–1468. [Google Scholar] [PubMed]
- Hou, M.; Xia, M.; Zhu, H.; Wang, Q.; Li, Y.; Xiao, Y.; Zhao, T.; Tang, Z.; Ma, J.; Ling, W. Lysophosphatidylcholine promotes cholesterol efflux from mouse macrophage foam cells via PPARgamma-LXRalpha-ABCA1-dependent pathway associated with apoE. Cell Biochem. Funct. 2007, 25, 33–44. [Google Scholar] [CrossRef] [PubMed]
- Aqul, A.; Liu, B.; Ramirez, C.M.; Pieper, A.A.; Estill, S.J.; Burns, D.K.; Liu, B.; Repa, J.J.; Turley, S.D.; Dietschy, J.M. Unesterified cholesterol accumulation in late endosomes/lysosomes causes neurodegeneration and is prevented by driving cholesterol export from this compartment. J. Neurosci. 2011, 31, 9404–9413. [Google Scholar] [CrossRef] [PubMed]
- Schlegel, V.; Thieme, M.; Holzmann, C.; Witt, M.; Grittner, U.; Rolfs, A.; Wree, A. Pharmacologic Treatment Assigned for Niemann Pick Type C1 Disease Partly Changes Behavioral Traits in Wild-Type Mice. Int. J. Mol. Sci. 2016, 17, 1866. [Google Scholar] [CrossRef] [PubMed]
- Meyer, A.; Wree, A.; Günther, R.; Holzmann, C.; Schmitt, O.; Rolfs, A.; Witt, M. Increased Regenerative Capacity of the Olfactory Epithelium in Niemann-Pick Disease Type C1. Int. J. Mol. Sci. 2017, 18, 777. [Google Scholar] [CrossRef] [PubMed]
- Bligh, E.G.; Dyer, W.J. A rapid method of total lipid extraction and purification. Can. J. Biochem. Physiol. 1959, 37, 911–917. [Google Scholar] [CrossRef] [PubMed]
- Kuhla, A.; Derbenev, M.; Shih, H.Y.; Vollmar, B. Prophylactic and abundant intake of α-lipoic acid causes hepatic steatosis and should be reconsidered in usage as an anti-aging drug. Biofactors 2016, 42, 179–189. [Google Scholar] [CrossRef] [PubMed]
- Kennedy, B.E.; LeBlanc, V.G.; Mailman, T.M.; Fice, D.; Burton, I.; Karakach, T.K.; Karten, B. Pre-symptomatic activation of antioxidant responses and alterations in glucose and pyruvate metabolism in Niemann-Pick Type C1-deficient murine brain. PLoS ONE 2013, 8, e82685. [Google Scholar] [CrossRef] [PubMed]
- Yan, X.; Ma, L.; Hovakimyan, M.; Lukas, J.; Wree, A.; Frank, M.; Guthoff, R.; Rolfs, A.; Witt, M.; Luo, J. Defects in the retina of Niemann-pick type C 1 mutant mice. BMC Neurosci. 2014, 15, 126. [Google Scholar] [CrossRef] [PubMed]


| Transcript | Forward Primer (5′–3′) | Reverse Primer (5′–3′) |
|---|---|---|
| abca1 | ACT GGA GAC ACC CCT GTG AC | GGA GAG CTT TCG TTT GTT GC |
| apoE | GTC TGA CCA GGT CCA GGA AG | AGT CGG TTG CGT AGA TCC TC |
| fas | TAC CAT GGC AAC GTG ACA CT | TAG CCC TCC CGT ACA CTC AC |
| HMG-CoA | CAG GAT GCA GCA CAG AAT GT | CTT TGC ATG CTC CTT GAA CA |
| lxrα | CAC CGC CAA ATT TAA CTG CAG A | AAG GGT TTG ATA AGT TCT AGC TGT |
| pparα | GGA AGC CGT TCT GTG ACA TC | TCA TCT GGA TGG TTG CTC TG |
| ppia | ACC AAA CAC AAA CGG TTC CC | CCA CAG TCG GAA ATG GTG ATC |
| srebp-1c | GAT CGC AGT CTG AGG AGG AG | GAT CGC CAA GCT TCT CTA CG |
| srebp-2 | ACC TGT GAC CTG CTA CTG TC | CAG CTG GTG TGT ACG GGT AG |
| acox1 | GAG CTG CTC ACA GTG AC TCG | ACT GCA GGG GCT TCA AGT G |
| acat1 | AGC ATT CAG TGT GGT TGT GC | TCC TCC TCC GTT GCA AAT AC |
| fatp2 | AAC ACA TCG CGG AGT ACC TG | CTC AGT CAT GGG CAC AAA TG |
© 2018 by the authors. Licensee MDPI, Basel, Switzerland. This article is an open access article distributed under the terms and conditions of the Creative Commons Attribution (CC BY) license (http://creativecommons.org/licenses/by/4.0/).
Share and Cite
Ebner, L.; Gläser, A.; Bräuer, A.; Witt, M.; Wree, A.; Rolfs, A.; Frank, M.; Vollmar, B.; Kuhla, A. Evaluation of Two Liver Treatment Strategies in a Mouse Model of Niemann–Pick-Disease Type C1. Int. J. Mol. Sci. 2018, 19, 972. https://doi.org/10.3390/ijms19040972
Ebner L, Gläser A, Bräuer A, Witt M, Wree A, Rolfs A, Frank M, Vollmar B, Kuhla A. Evaluation of Two Liver Treatment Strategies in a Mouse Model of Niemann–Pick-Disease Type C1. International Journal of Molecular Sciences. 2018; 19(4):972. https://doi.org/10.3390/ijms19040972
Chicago/Turabian StyleEbner, Lynn, Anne Gläser, Anja Bräuer, Martin Witt, Andreas Wree, Arndt Rolfs, Marcus Frank, Brigitte Vollmar, and Angela Kuhla. 2018. "Evaluation of Two Liver Treatment Strategies in a Mouse Model of Niemann–Pick-Disease Type C1" International Journal of Molecular Sciences 19, no. 4: 972. https://doi.org/10.3390/ijms19040972