Article

Preclinical Evaluation of Vemurafenib as Therapy for BRAFV600E Mutated Sarcomas

1
Department of Tumor Biology, Institute for Cancer Research, Oslo University Hospital, 0379 Oslo, Norway
2
Genomics Core Facility, Department of Core facility, Institute for Cancer Research, Oslo University Hospital, 0379 Oslo, Norway
3
Department of Clinical Science, University of Bergen, Bergen, Norway
*
Authors to whom correspondence should be addressed.
Authors contributed equally.
Int. J. Mol. Sci. 2018, 19(4), 969; https://doi.org/10.3390/ijms19040969
Submission received: 15 February 2018 / Revised: 9 March 2018 / Accepted: 22 March 2018 / Published: 23 March 2018
(This article belongs to the Special Issue Current Advances in Soft Tissue and Bone Sarcoma)

Abstract

:
The BRAFV600E mutation, which in melanoma is targetable with vemurafenib, is also found in sarcomas and we here evaluate the therapeutic potential in sarcoma cell lines. Methods: Four sarcoma cell lines harboring the BRAFV600E mutation, representing liposarcomas (SA-4 and SW872), Ewing sarcoma (A673) and atypical synovial sarcoma (SW982), were treated with vemurafenib and the effects on cell growth, apoptosis, cell cycle progression and cell signaling were determined. Results: Vemurafenib induced a strong cytostatic effect in SA-4 cells, mainly due to cell cycle arrest, whereas only moderate levels of apoptosis were observed. However, a high dose was required compared to BRAFV600E mutated melanoma cells, and removal of vemurafenib demonstrated that the continuous presence of drug was required for sustained growth inhibition. A limited growth inhibition was observed in the other three cell lines. Protein analyses demonstrated reduced phosphorylation of ERK during treatment with vemurafenib in all the four sarcoma cell lines confirming that the MAPK pathway is active in these cell lines, and that the pathway can be inhibited by vemurafenib, but also that these cells can proliferate despite this. Conclusions: These findings indicate that vemurafenib alone would not be an efficient therapy against BRAFV600E mutated sarcomas. However, further investigations of combination with other drugs are warranted.

1. Introduction

Sarcoma is a heterogeneous group of rare tumors, generally arising from mesenchymal cells and accounting for approximately 1% of all human cancers and 10–20% of childhood solid cancers [1,2]. Despite the rareness of the disease, the high degree of mortality in children and adolescents with sarcomas accounts for many years of lost lives [2]. More than 50 subtypes of sarcoma have been classified by the World Health Organization [3], and these can be divided into two main subgroups; bone and soft tissue tumors. With the exception of imatinib repurposed for patients with gastrointestinal stromal tumor (GIST) [4], targeted therapies are not routinely used for sarcomas, and the main treatments are still surgery, chemotherapy and radiotherapy, sometimes in combination. Unfortunately, in many cases these treatments are not curative, and improved treatment strategies are much needed. Rare cancers, such as these, are generally not a focus of drug development, and therefore repurposing drugs already approved for other indications would be a valuable alternative. Inhibitors targeting cancer-specific mutations are ideal for repurposing. The presence of the exact same mutation in other cancer types suggests that the cancer may be driven by the same mechanism. However, different context requires validation of the therapeutic principle since other compensatory factors may enable cells with different phenotypes to escape therapy.
Mutated BRAF are described in several cancers and can be targeted by selective inhibitors, such as vemurafenib [5]. The RAF kinase family (ARAF, BRAF and RAF1) are serine/threonine kinases which signal through the mitogen-activated protein kinase (MAPK) pathway, including the down-stream kinases MEK and ERK [6]. The cascade is initiated upon binding of a mitogen or a growth factor, such as PDGF and EGF, to its receptor tyrosine kinase (RTK) in the cell membrane. This leads to a RAS-induced phosphorylation of RAF proteins and initiation of a MAPK phosphorylation cascade resulting in activation of transcription factors that regulate cell proliferation and/or apoptosis [7,8]. Several mutations in the BRAF gene have been described, but the most common genetic alteration results in a substitution of the amino acid 600 from valine to glutamic acid (BRAFV600E) [9]. This amino acid is within the activation loop, and the substitution renders the protein constitutively active and independent of RAS activation [10,11].
The BRAFV600E mutation accounts for more than 90% of all reported BRAF mutations [12]. The BRAFV600E mutation is present in 50% of melanomas and has also been identified in subsets of many other cancer types, including colorectal cancer (10–15%), papillary thyroid carcinoma (30–50%) and non-small cell lung cancer (1.3%) [13,14,15,16,17]. The BRAFV600E mutation has also been reported in GIST, several cases of clear cell sarcoma, and liposarcoma [18,19,20,21]. Furthermore, the BRAFV600E mutation has been described in sarcoma cell lines of different subtypes, including SW872, SA-4, A673 and SW982 [12,21,22].
Vemurafenib was initially approved by the Food and Drug Administration (FDA) in 2011 as a therapy for melanoma patients with mutated BRAFV600E, and resulted in a response rate of >50% and approximately 7 months of median progression-free survival for melanoma patients [10,23]. In colorectal patients with the BRAFV600E mutation; however, vemurafenib as monotherapy was unsuccessful due to resistance, which occurred as a consequence of a rapid, EGFR-induced reactivation of the MAPK pathway, observed already at 24–48 h after treatment [14,24]. Importantly, significant tumor regression was achieved when vemurafenib was given in combination with EGFR inhibitors [14]. Vemurafenib has shown some anecdotal therapeutic potential in sarcomas, as a patient with clear cell sarcoma harboring the BRAFV600E mutation was successfully treated with vemurafenib and displayed tumor regression after 8 weeks of treatment [25]. Furthermore, antitumor activity was also observed for a GIST patient treated with dabrafenib, another BRAFV600E inhibitor [20]. Here, we have further investigated the potential of vemurafenib as a therapy for BRAFV600E mutated sarcomas, by determining its efficacy in vitro in four BRAFV600E mutated sarcoma cell lines.

2. Results

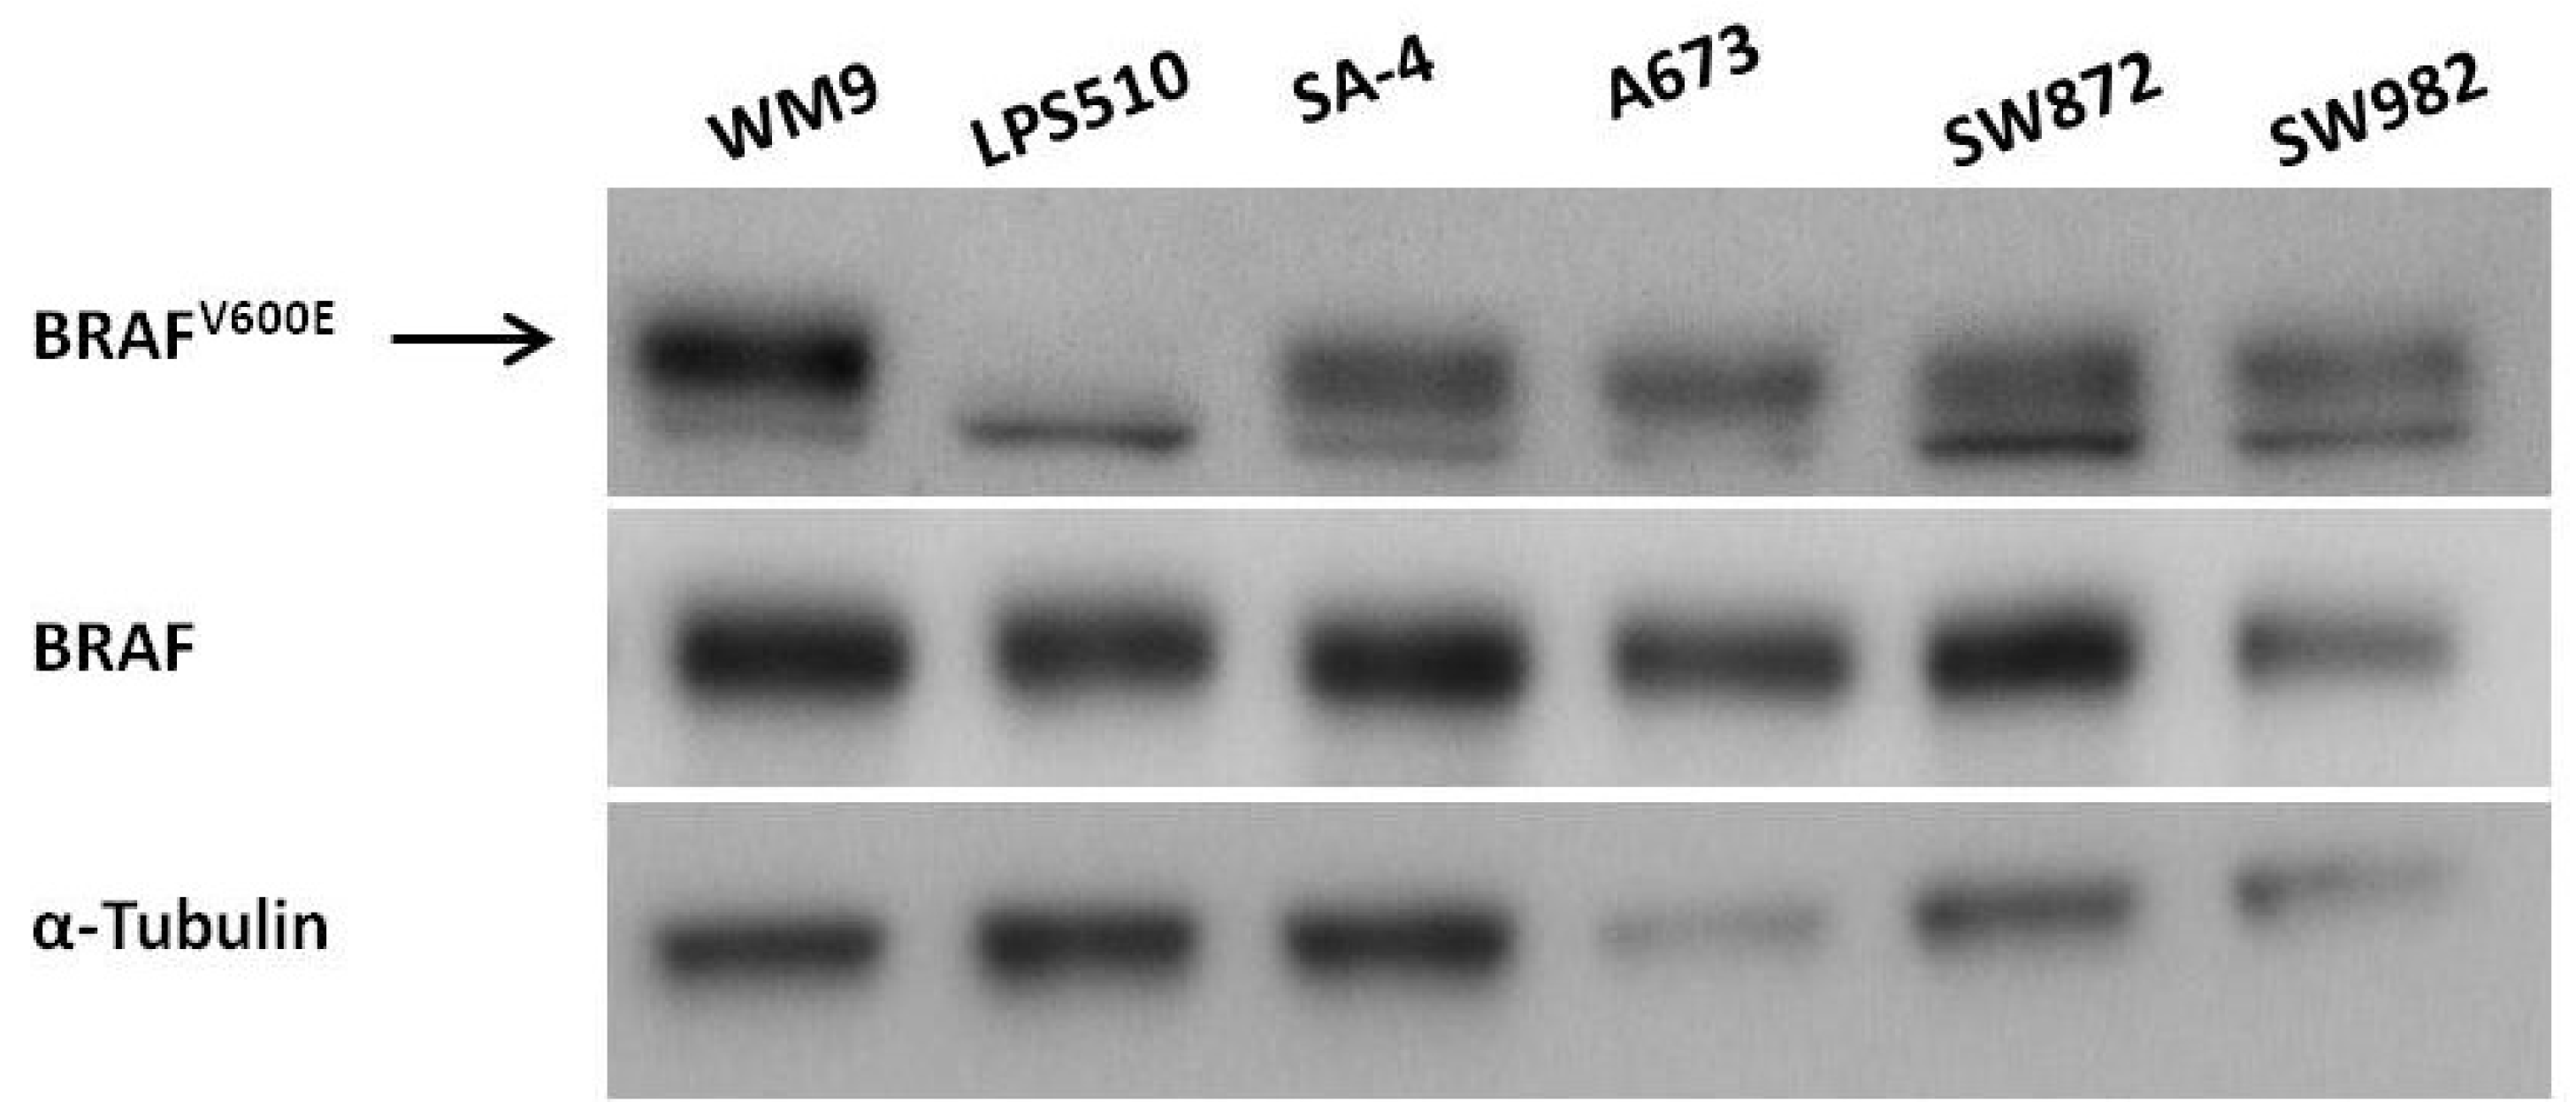
2.1. Expression of BRAFV600E in Sarcoma Cell Lines

We selected four ATCC sarcoma cell lines carrying heterozygous mutation for BRAFV600E, namely SA-4 and SW872, classified as liposarcomas, as well as Ewing sarcoma cell line A673 and an atypical synovial sarcoma cell line SW982 lacking the SYT-SSX translocation. The WM9 melanoma cell line, known to harbor a hemizygous BRAFV600E mutation, was included as a positive control, whereas the LPS510 liposarcoma cell line was included as a negative control line for all BRAFV600E mutated sarcoma cell lines, as it is wild-type for BRAF according to our DNA sequencing data. We evaluated the expression of wild-type and mutated BRAF mRNA by next-generation sequencing and found similar levels of wild-type and mutated BRAF transcripts in both SA-4 and SW872 cell lines, whereas LPS510 only expressed wild-type BRAF (Table 1). RNA sequencing data was not available for SW982 and A673 cell lines.
To determine the levels of total and BRAFV600E mutated protein in all cell lines, western blotting was performed using antibodies specific for pan-BRAF and BRAFV600E, respectively. BRAF protein was abundantly expressed in all the cell lines, and the presence of BRAFV600E mutated protein was confirmed in all five cell lines known to harbor the mutation (Figure 1). The specificity of detection was demonstrated by the absence of mutated protein in the BRAF wild-type cell line, LPS510.

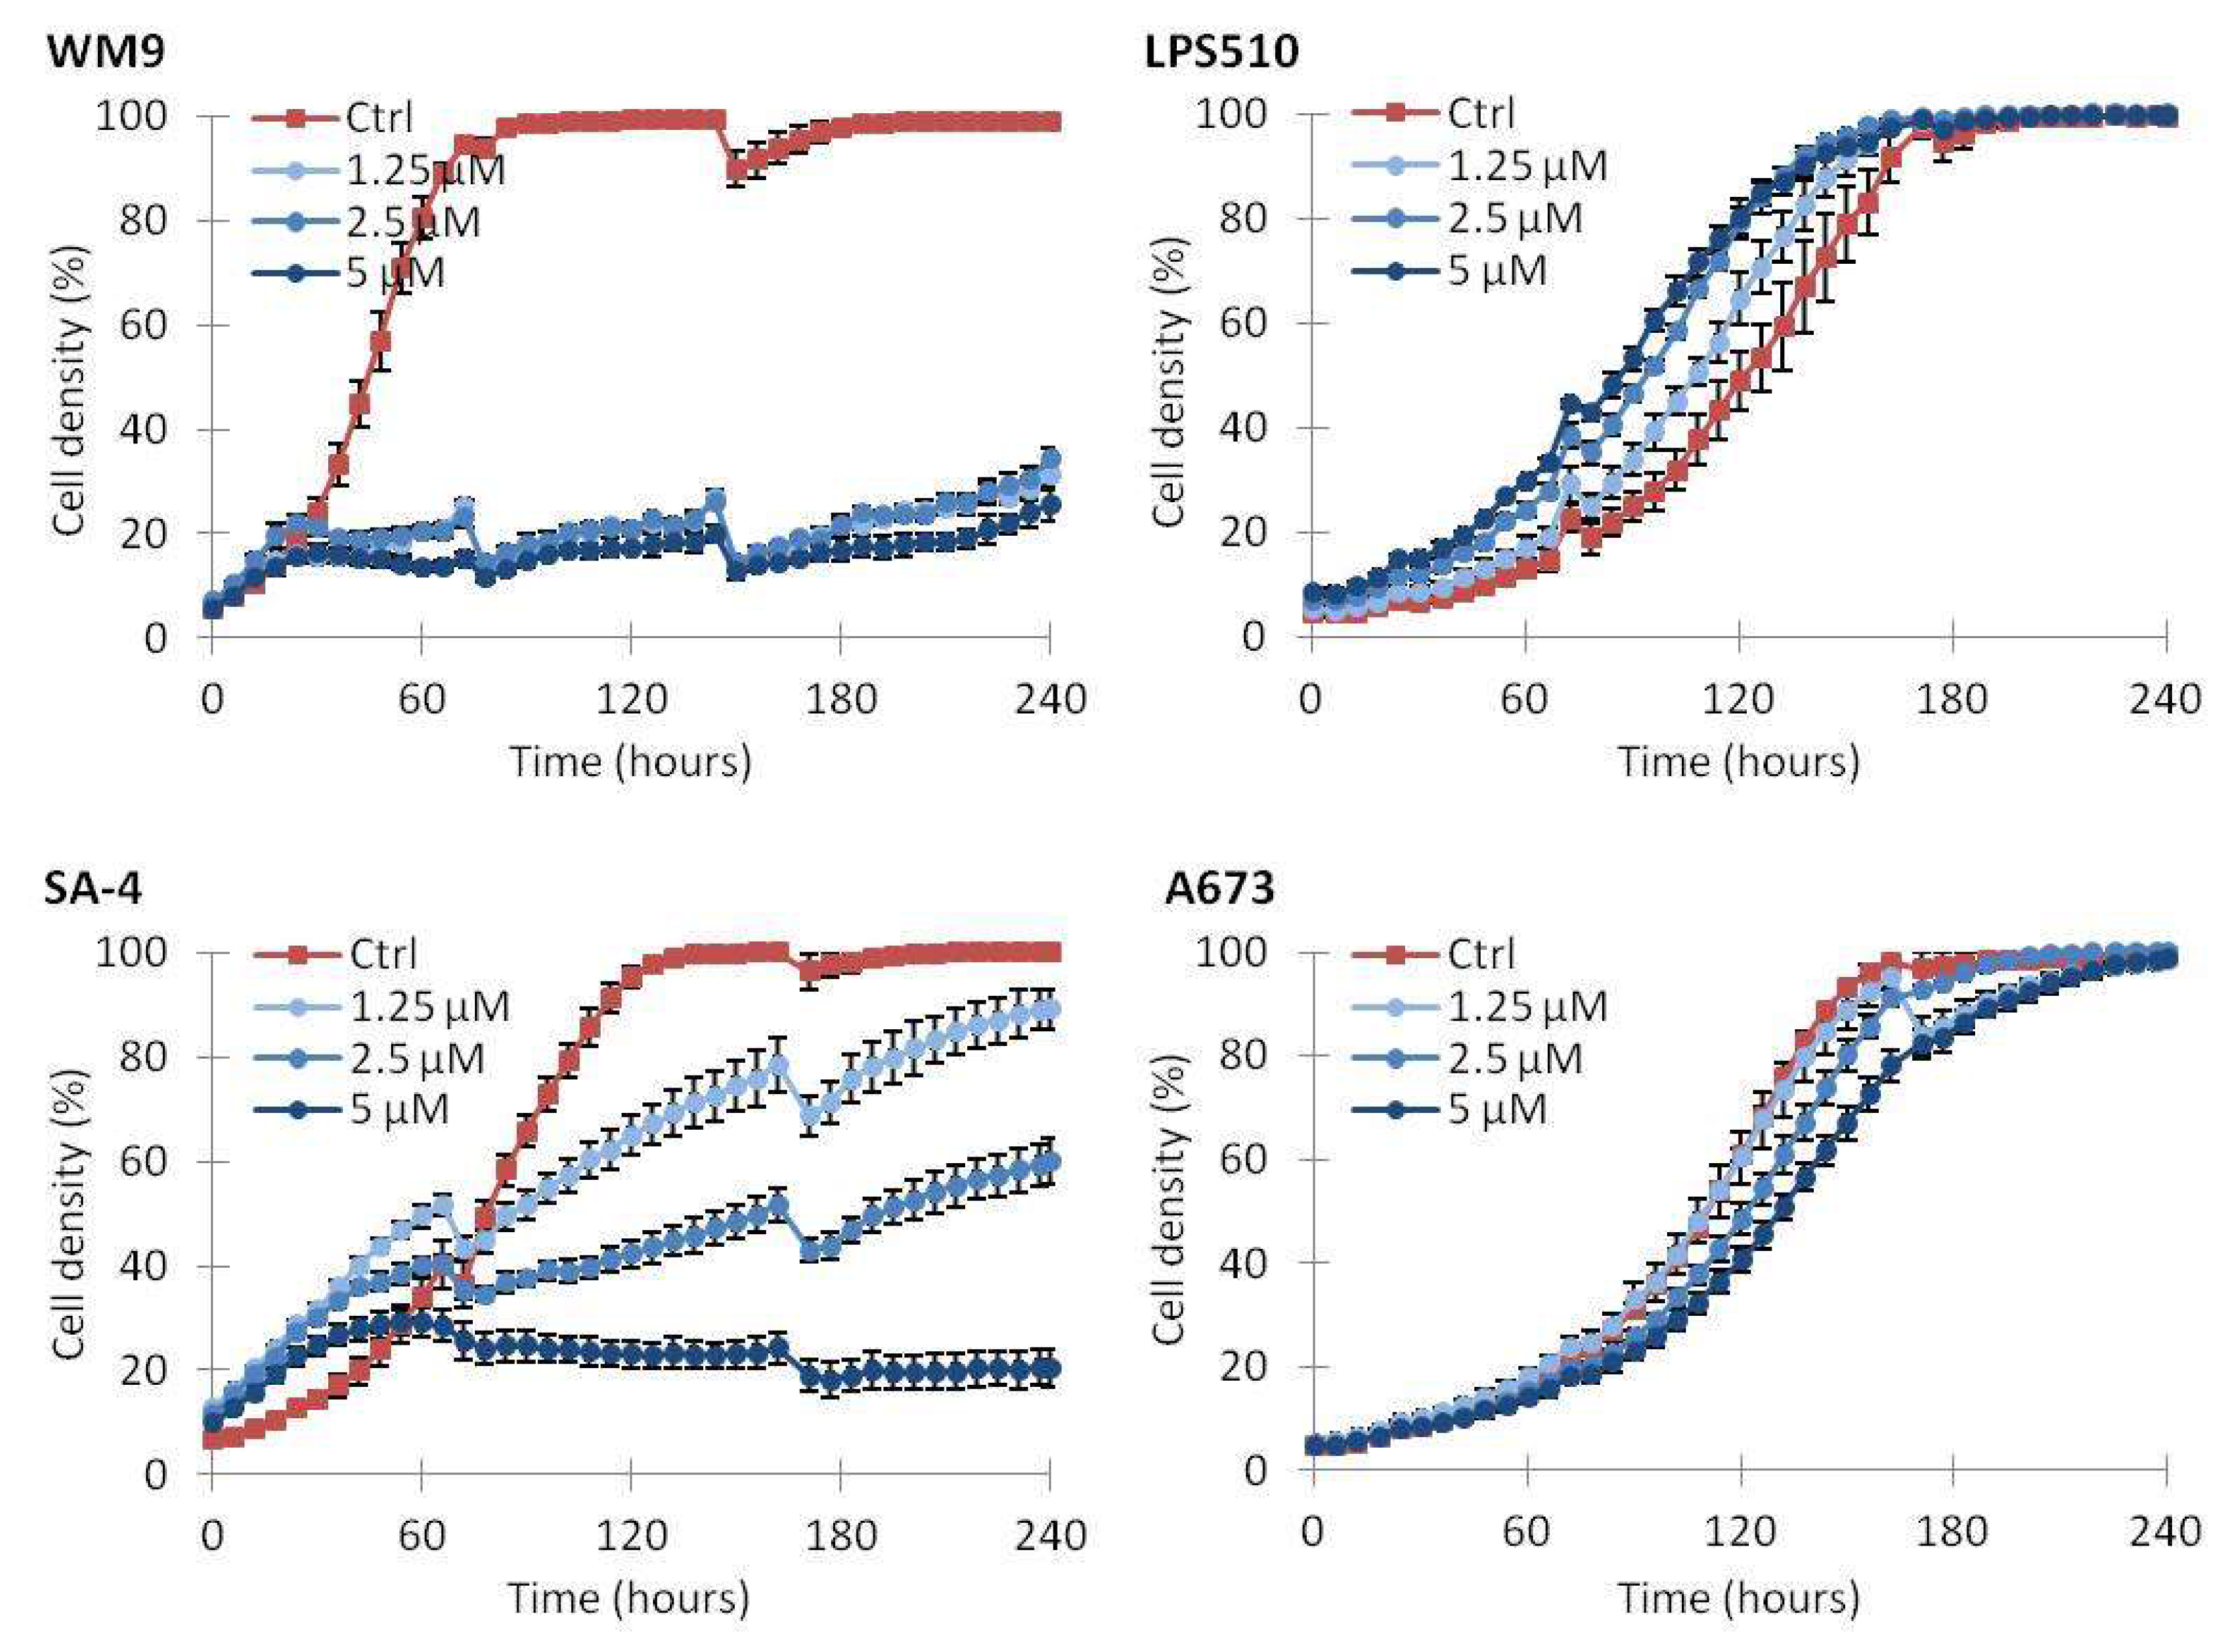
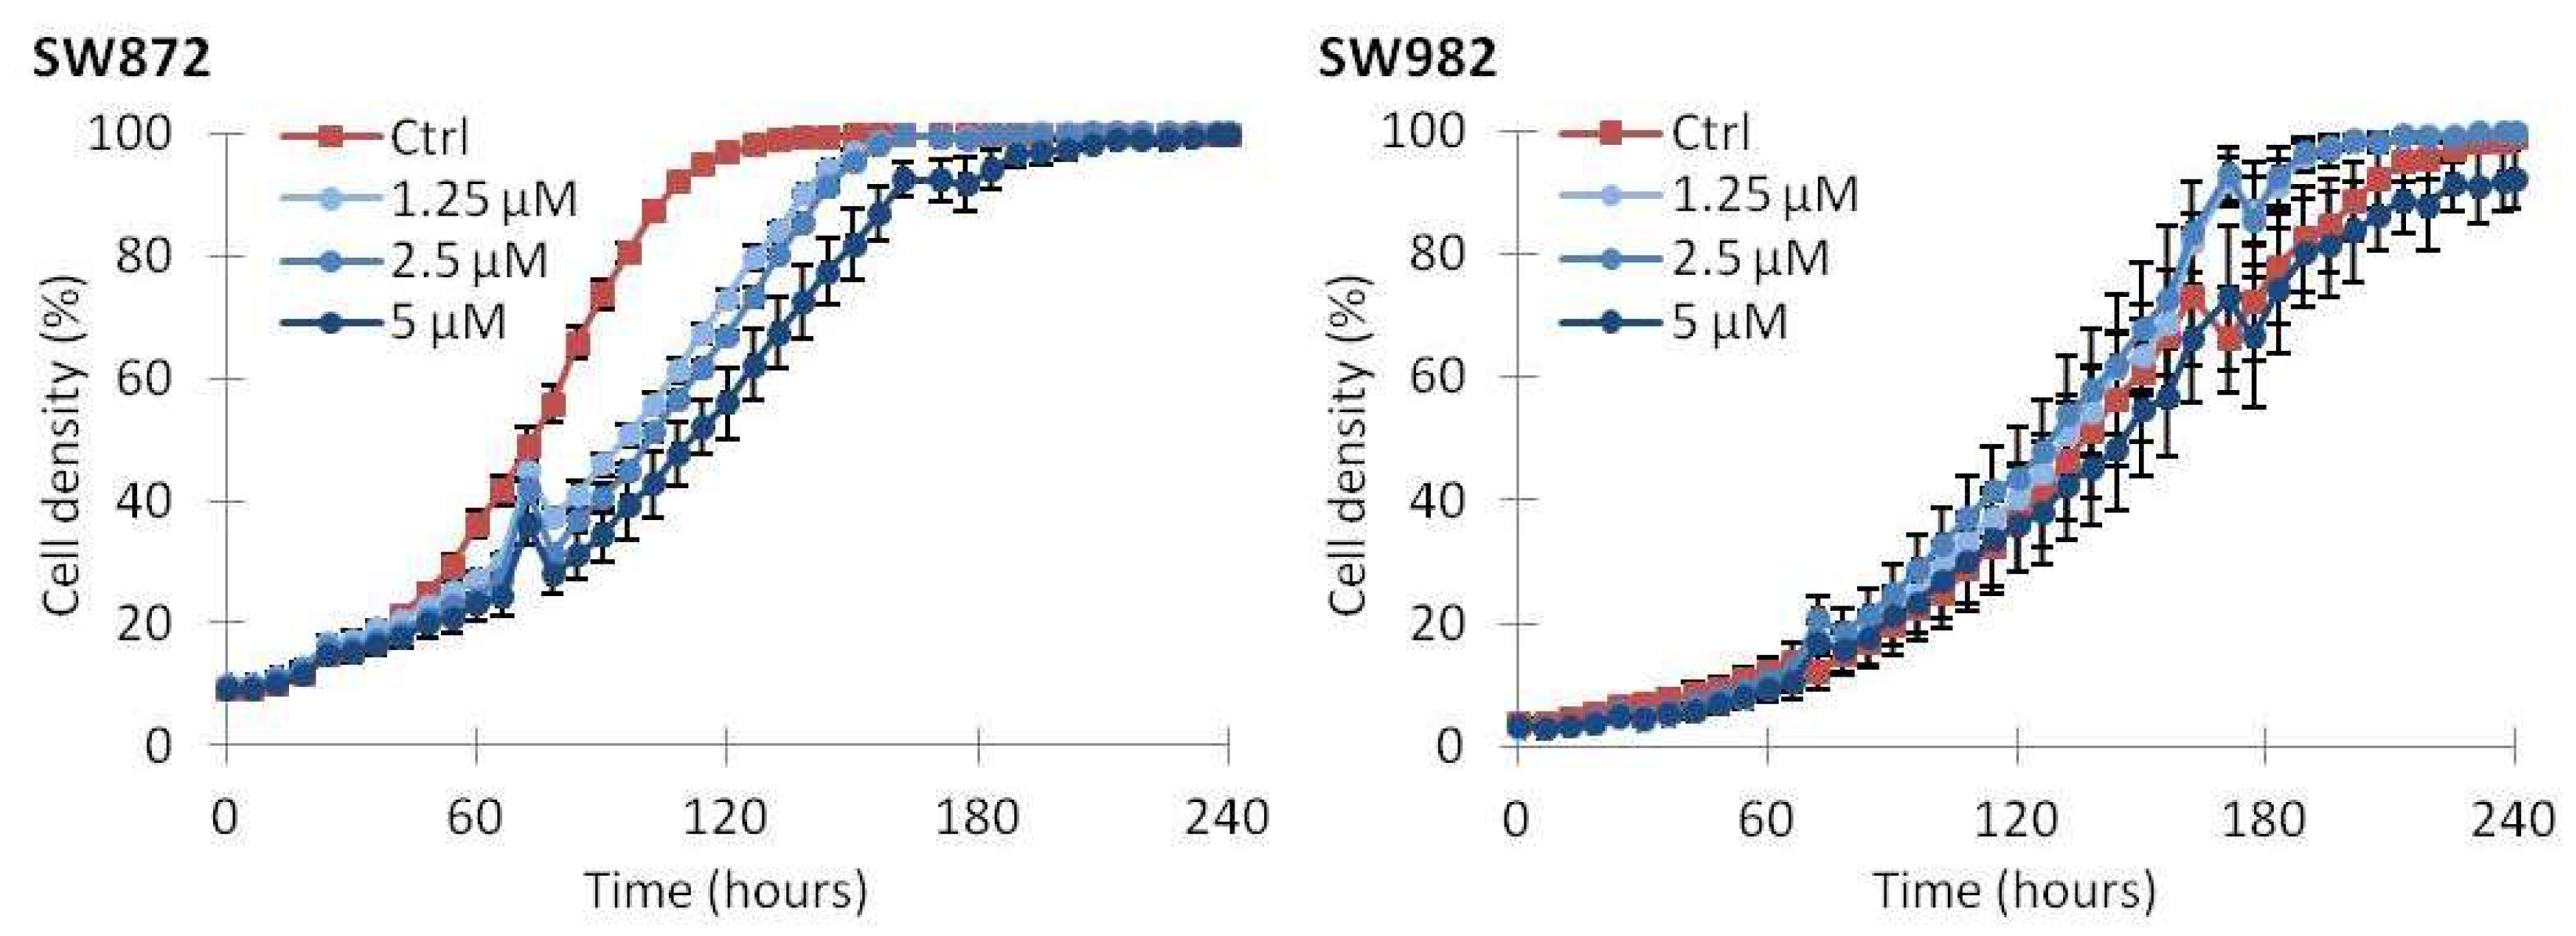
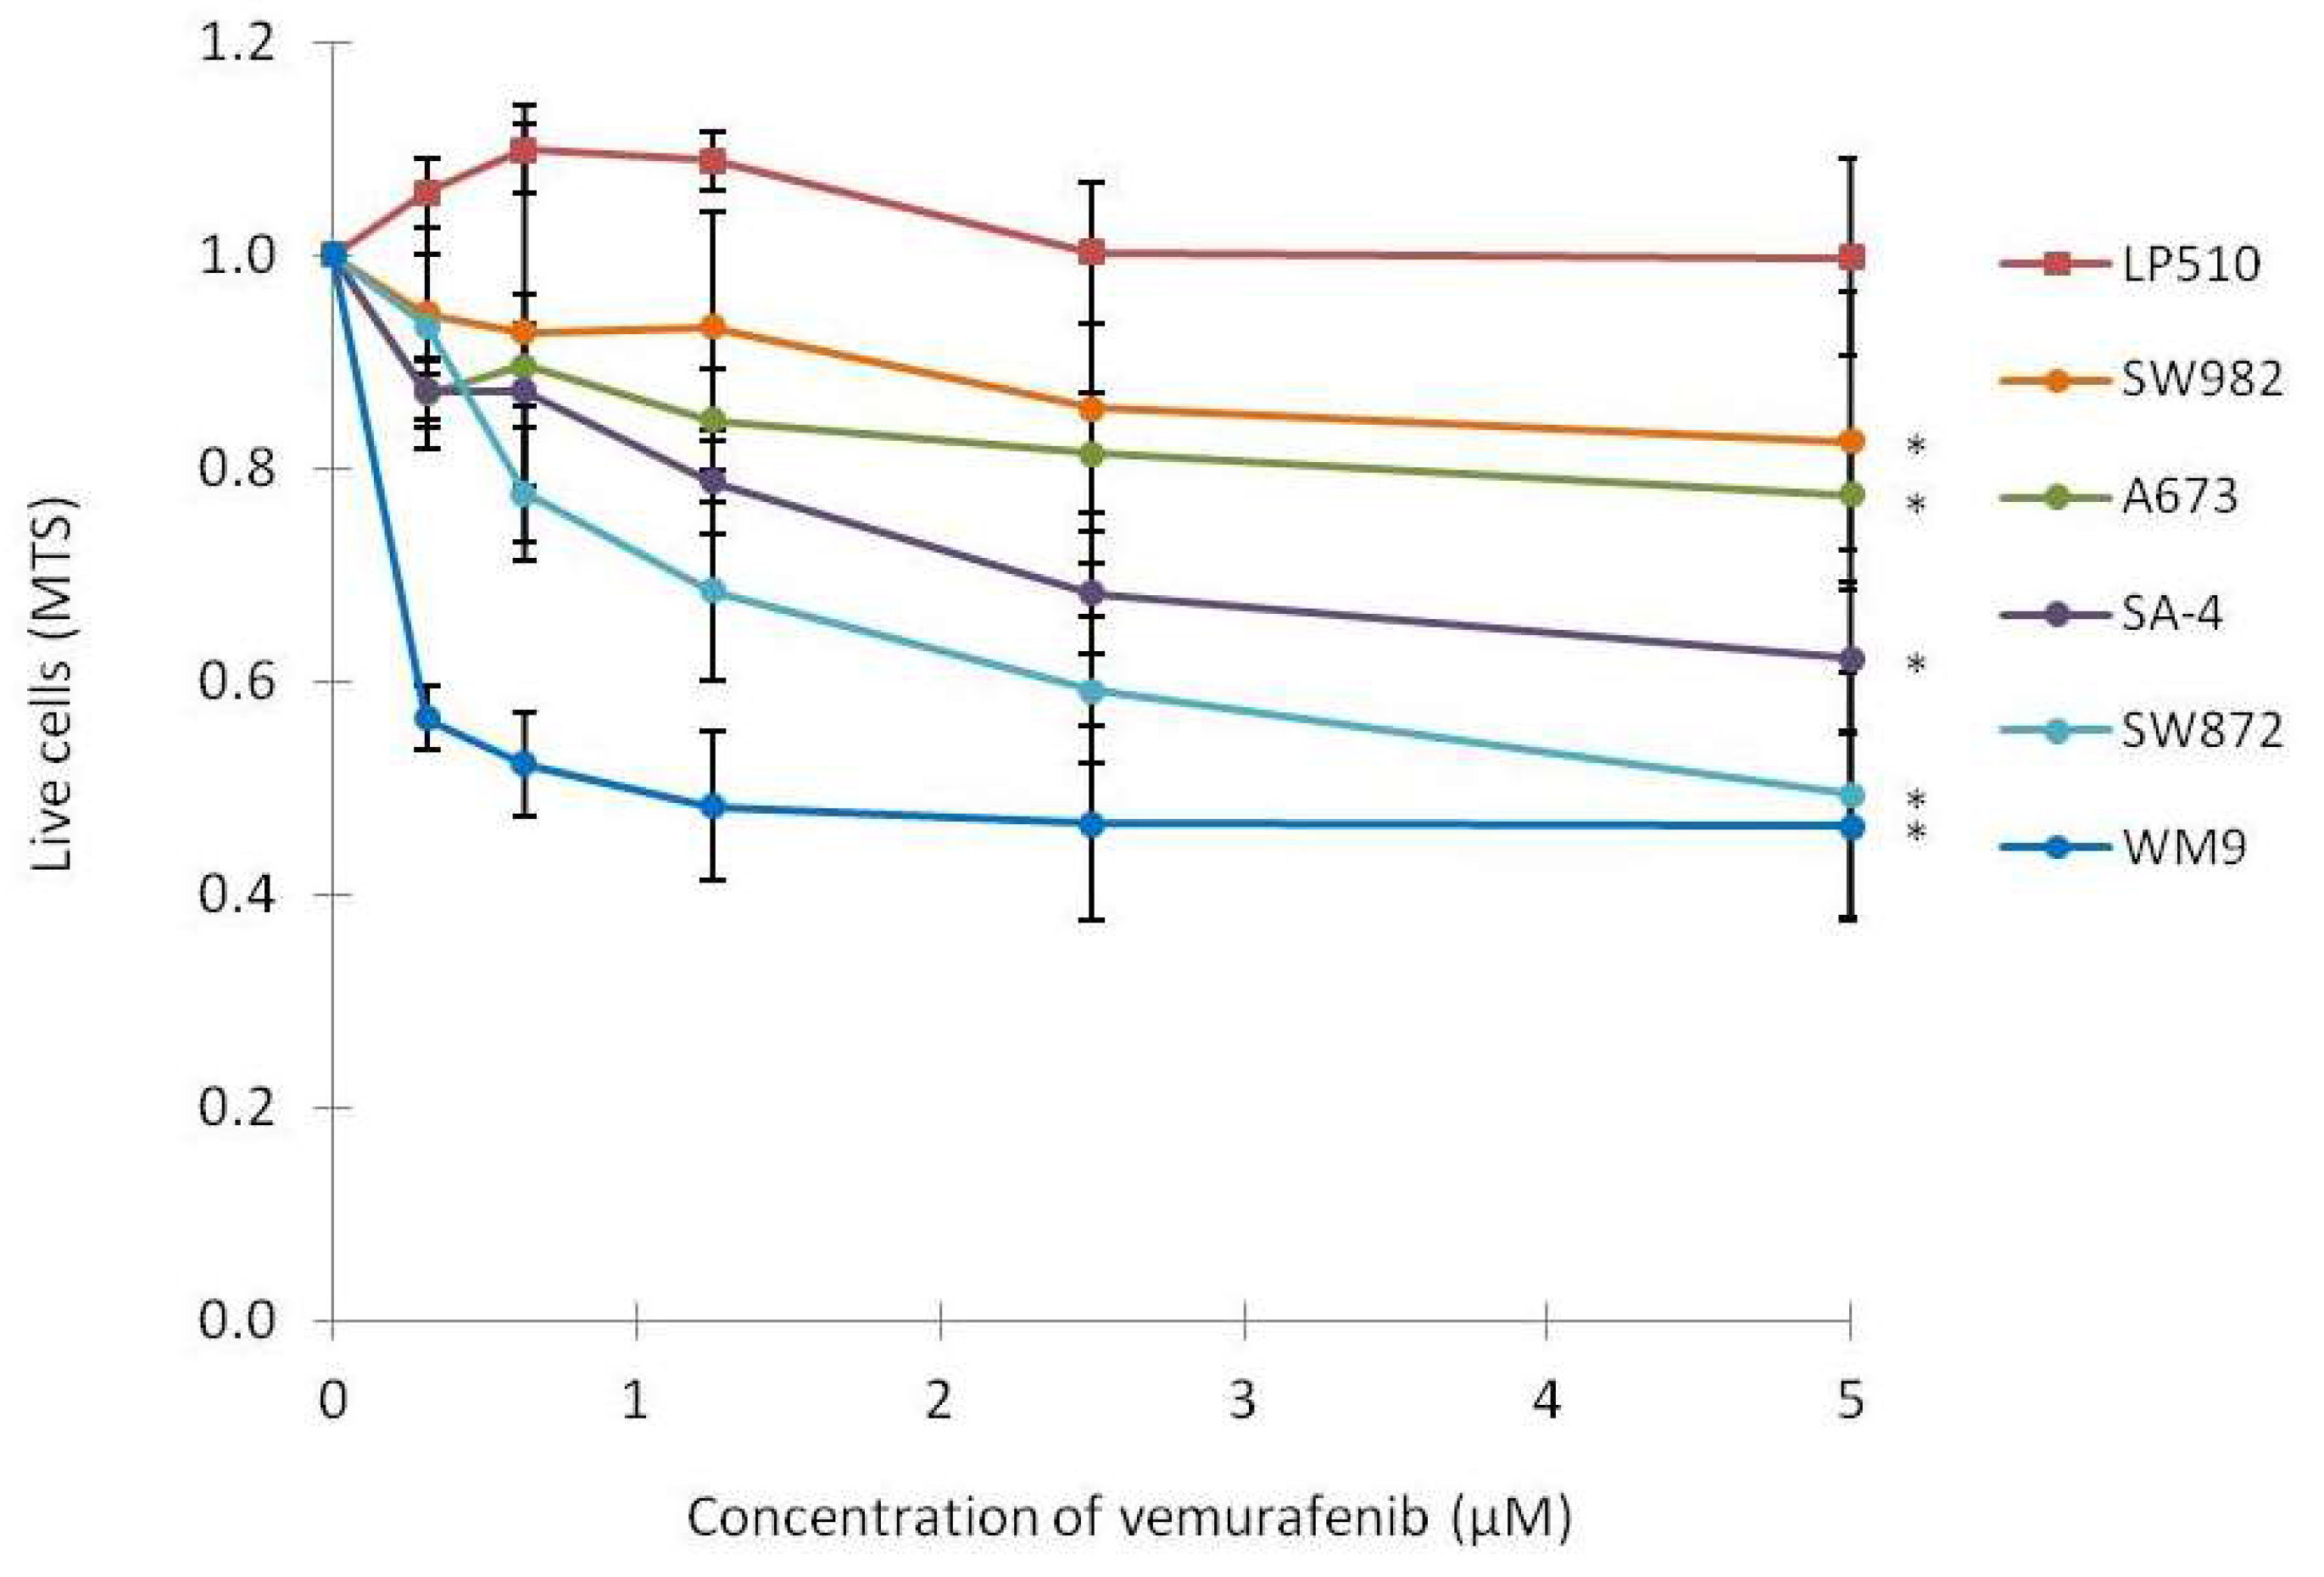
2.2. Vemurafenib Inhibits Cell Growth in BRAF Mutated Cell Lines

The growth of the cell lines was assessed by MTS assay after 72–96 h of exposure to 0.31 to 5 µM vemurafenib (Figure 2). The SW872 and SA-4 cell lines displayed the most significant reduction in cell growth at all doses, although to a lesser degree than observed for the melanoma cell line WM9. In contrast, A673 and SW982 cell lines displayed a minor response, although significant at the highest dose. As expected, no reduction in cell growth was observed for LPS510 following vemurafenib treatment.
Since MTS is a short-term assay with a fixed endpoint that measures cellular metabolic activity, we investigated long term effects of vemurafenib treatment by monitoring cell growth over longer periods of time. Cell cultures were monitored by time-lapse microscopy for up to 240 h in the presence of drug (Figure 3). A rapid and complete growth inhibition was observed for WM9 cells. SA-4 cells also displayed a full growth inhibition, although the inhibition appeared at a later time point and required a higher dose than for WM9 cells. The SW872 cells showed an initial response for the first 72 h, similar to SA-4. However, the inhibition was not sustained as cells exposed to continuous treatment with high doses of vemurafenib reached full cell density approximately 50 h after control-treated cells. The other BRAFV600E mutated sarcoma cell lines showed minor or no responses. The wild-type LPS510 cell line did not display a growth inhibitory response following vemurafenib treatment, but the cells underwent slight changes in morphology, appearing as increased cell density for vemurafenib-treated cells in the time-lapse analysis.

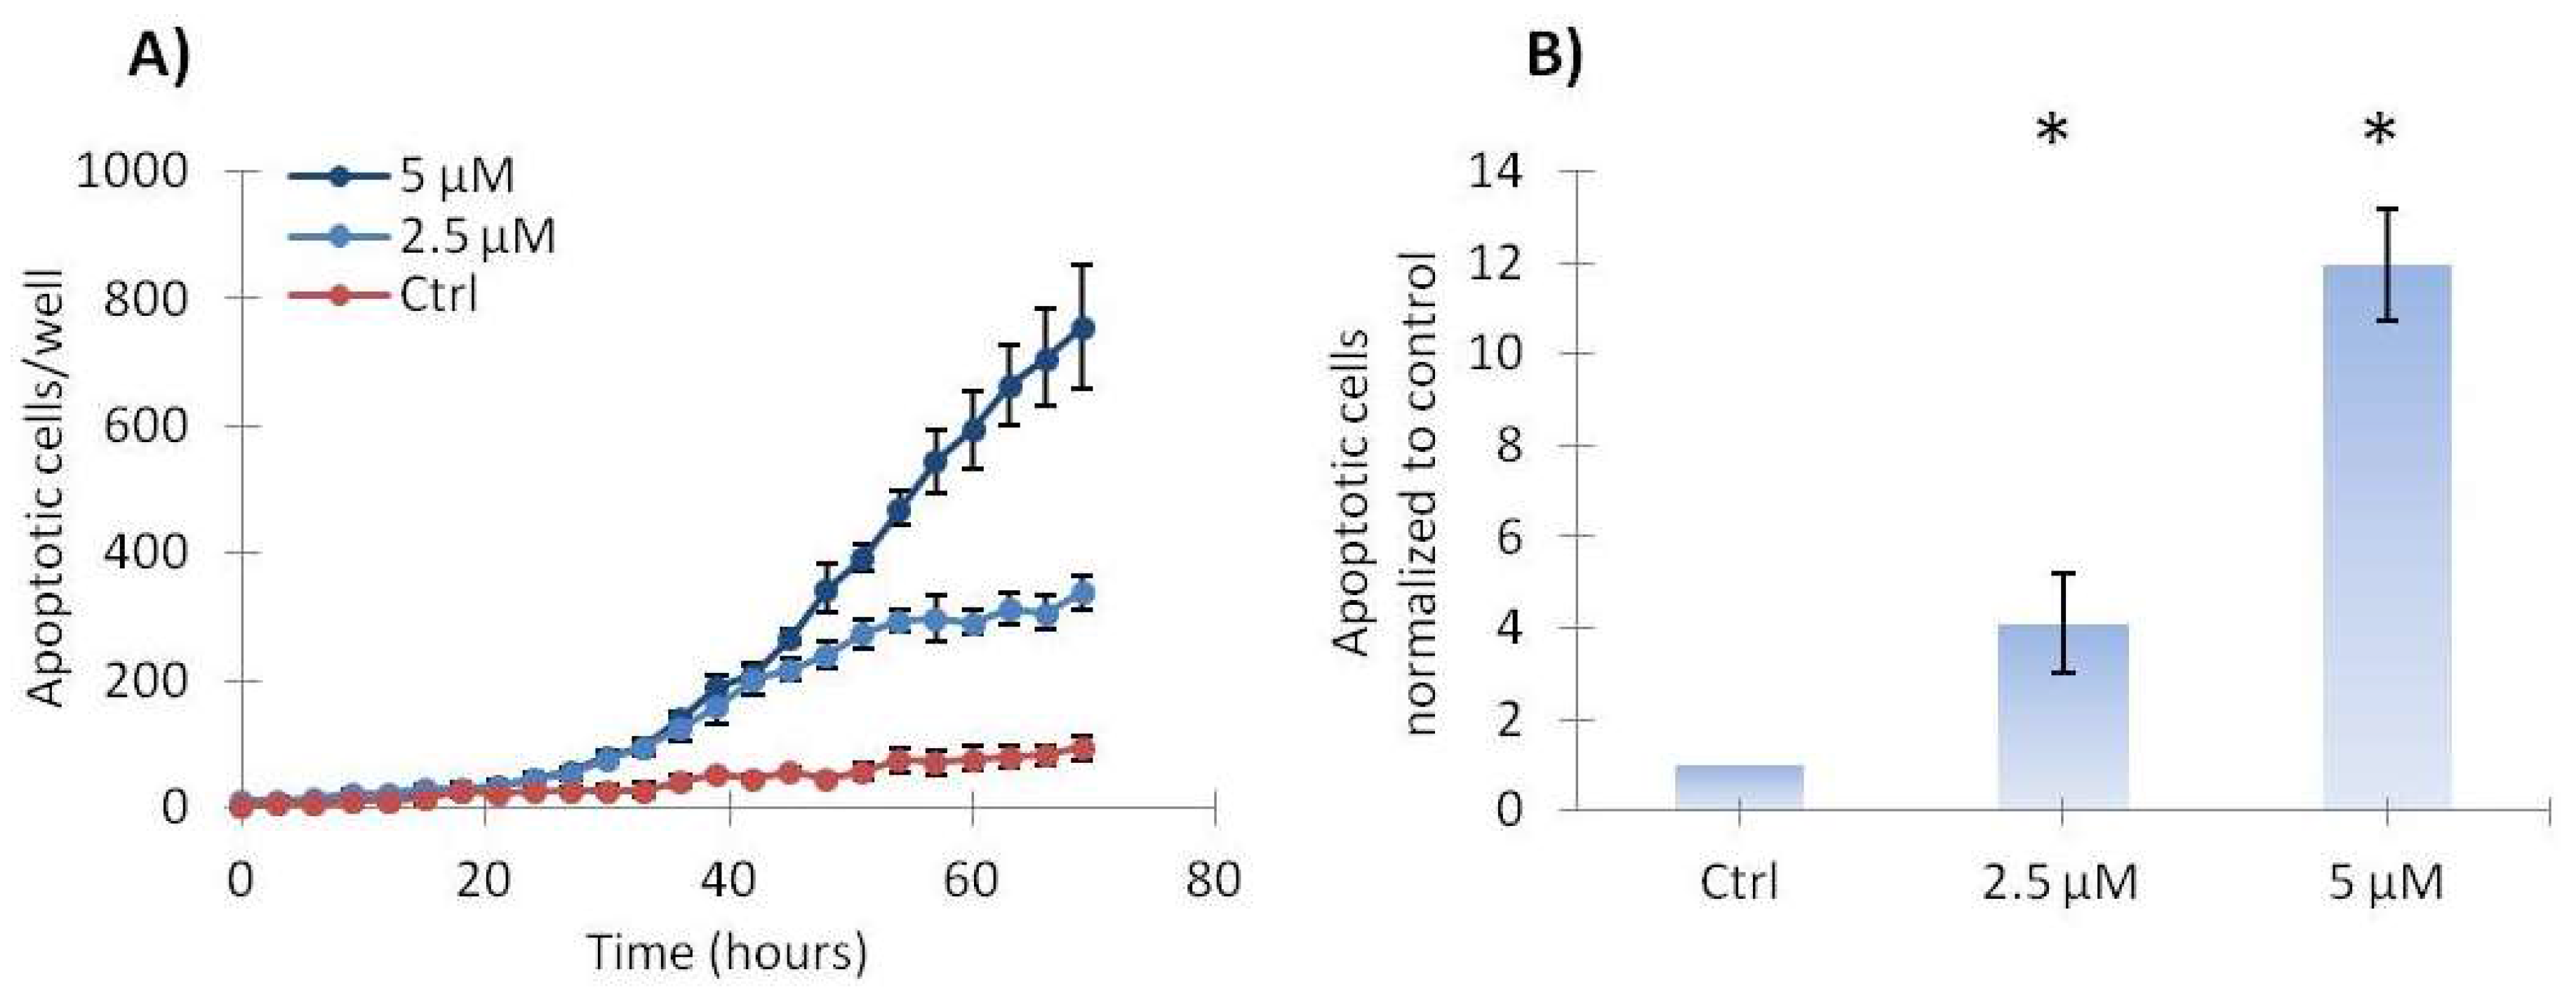
2.3. Vemurafenib Induces a Low Level of Apoptosis in SA-4 Cells

The best responding cell line, SA-4, was used to investigate in more depth the growth inhibitory mechanisms involved. The effect of 2.5 and 5 µM vemurafenib on apoptosis was evaluated using time-lapse microscopy in the presence of an agent that reports active caspase-3/7. As shown in Figure 4A, a dose-dependent increase in the number of caspase-3/7-positive SA-4 cells was observed, indicating induction of apoptosis. Figure 4B shows the levels of apoptosis relative to control cells after 72 h of treatment, confirming the significant, dose-dependent induction of apoptosis. However, apoptosis was only observed in a low percentage of the cells, suggesting that apoptosis is only a minor contributing factor to the observed growth inhibition.

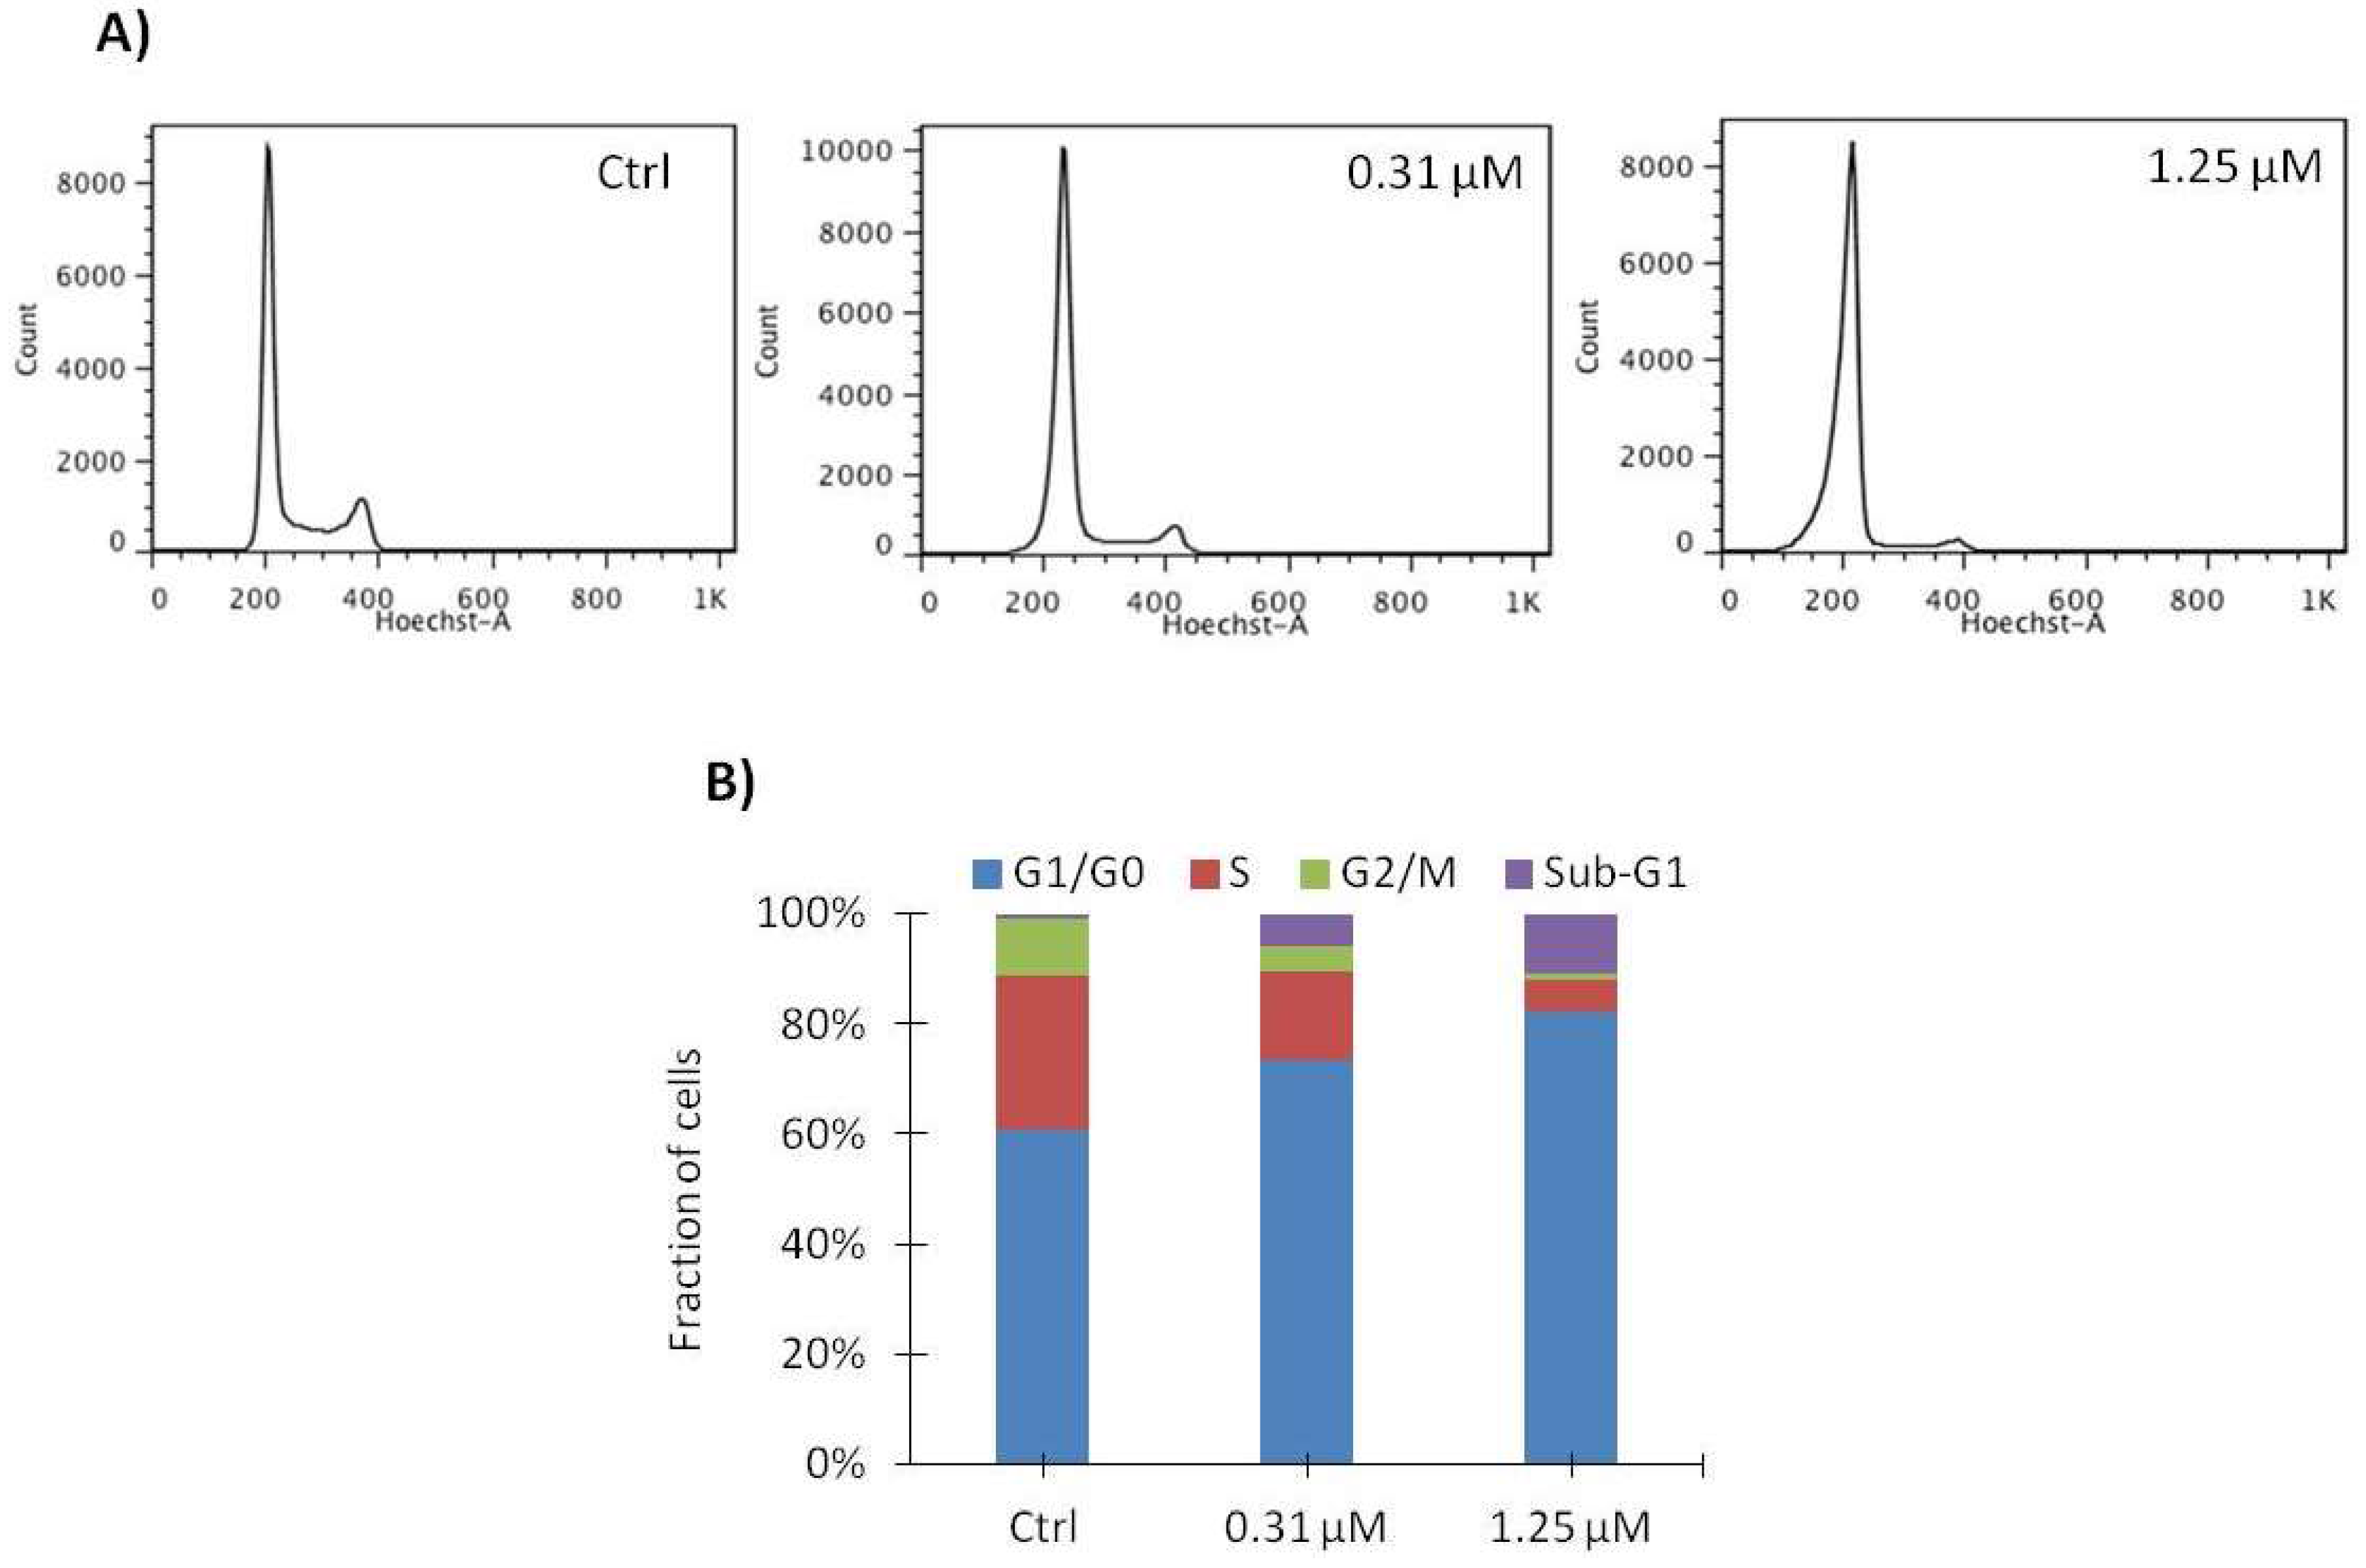
2.4. Vemurafenib Induces G1 Arrest in SA-4 Cells

To determine the effect of vemurafenib on cell cycle progression, SA-4 cells were treated with 0.31 or 1.25 µM vemurafenib for 48 h, and subsequently their DNA content was measured by flow cytometry. Figure 5A shows that vemurafenib induced a dose-dependent G1 arrest. Furthermore, a significant fraction of the nuclei appeared in the sub-G1 phase, displaying weaker DNA-staining than expected for cells in G1. Following treatment with 1.25 µM vemurafenib, the number of cells found in G1 increased from 55% to 82%, while the number of cells in S and G2 phase decreased from 33% to 7.4% and from 11% to 2.3%, respectively, as quantified in Figure 5B and Table 2. Our results indicate that G1 arrest is the major contributing factor for the observed growth inhibition induced by vemurafenib in SA-4 cells.

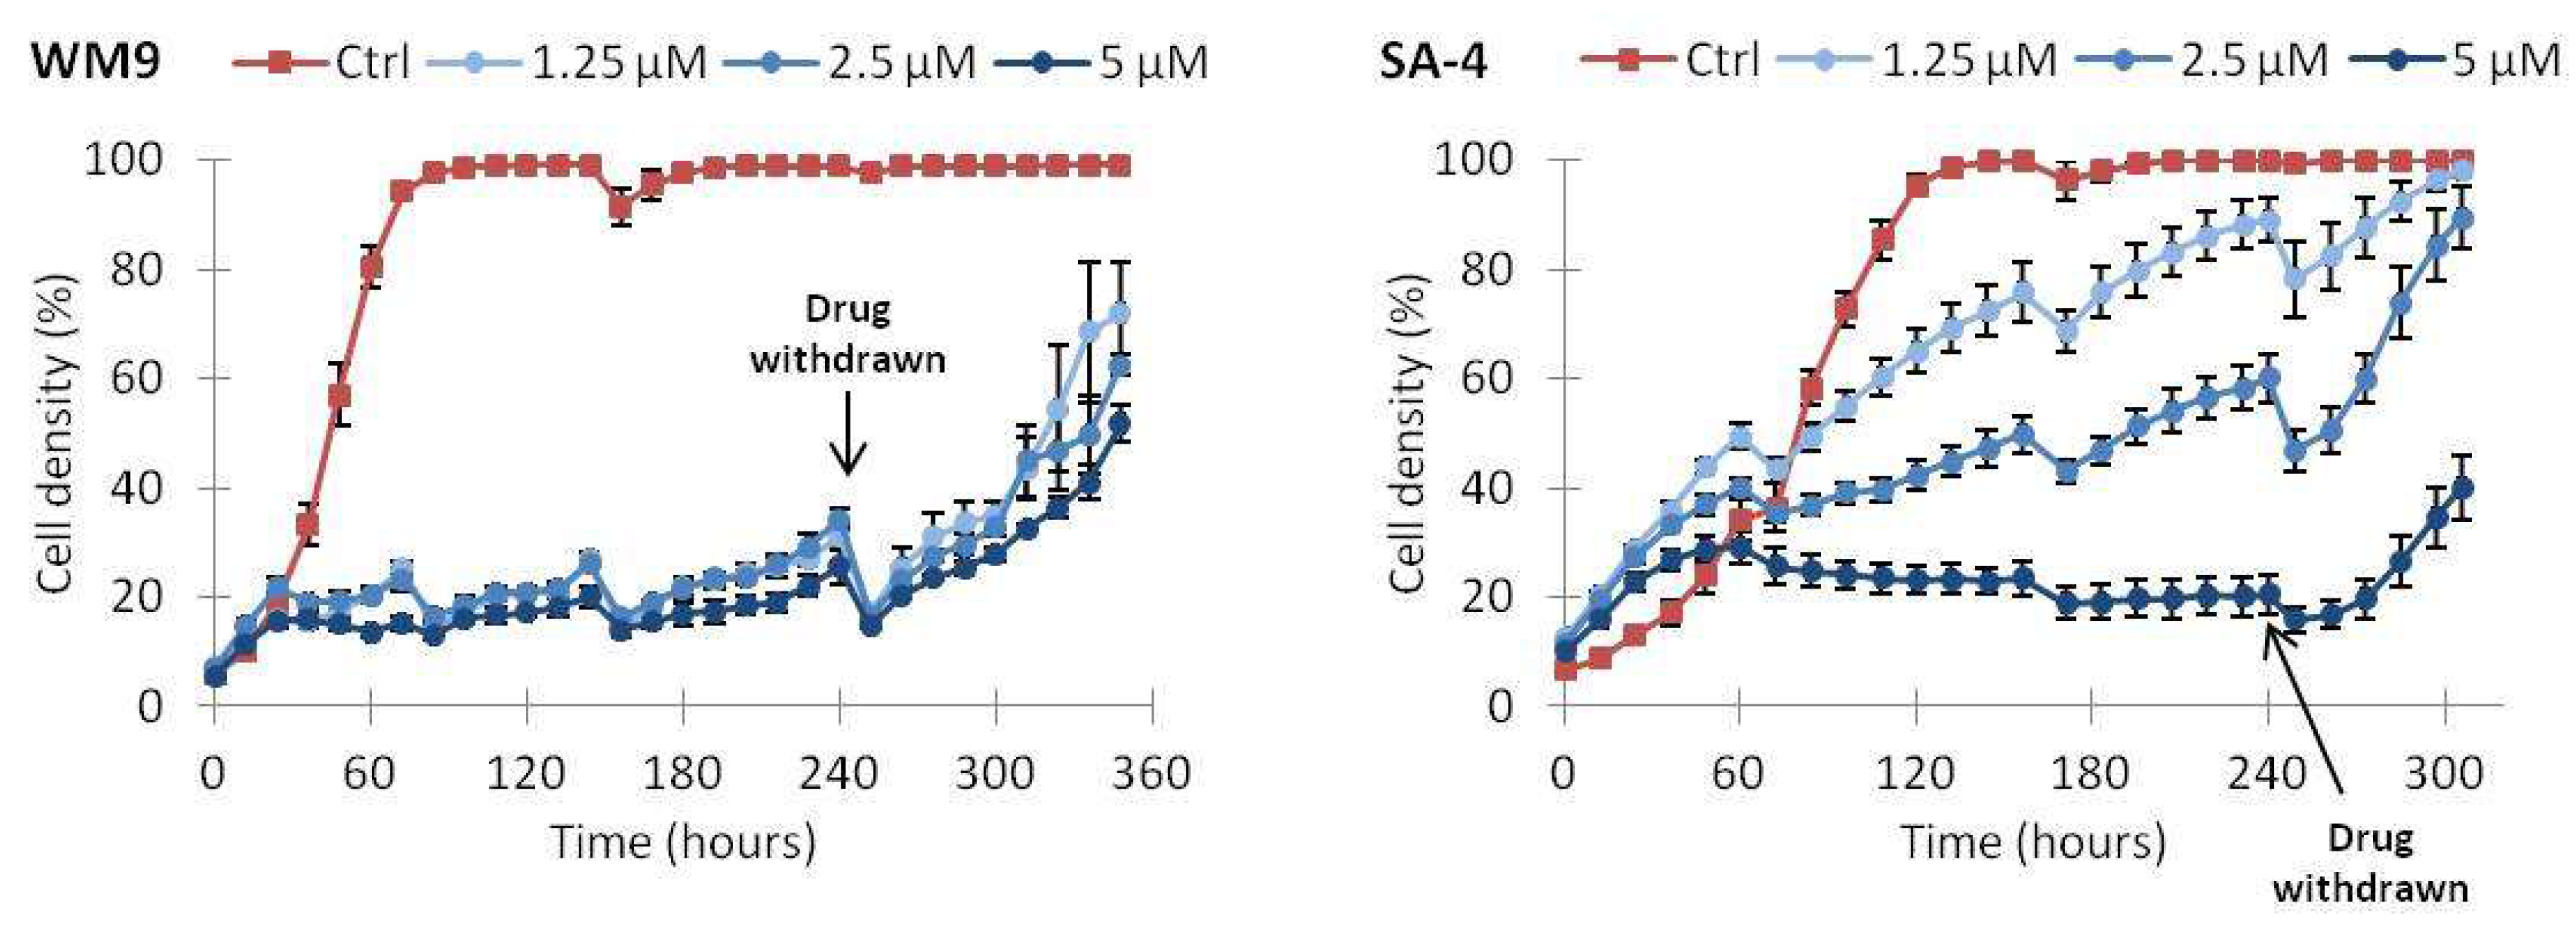
2.5. Continuous Treatment with Vemurafenib Is Necessary to Sustain Growth Inhibition

We also evaluated whether the effect of vemurafenib was transient or lasting after drug removal. SA-4 and WM9 cells were treated with 1.25, 2.5 or 5 µM vemurafenib for up to 10 days and subsequently incubated in growth medium without drug. As shown in Figure 6, again SA-4 required higher doses of vemurafenib for efficient growth inhibition, but even after the longest duration of treatment with the highest dose (5 µM), both SA-4 and WM9 cells regained growth after withdrawal of drug.

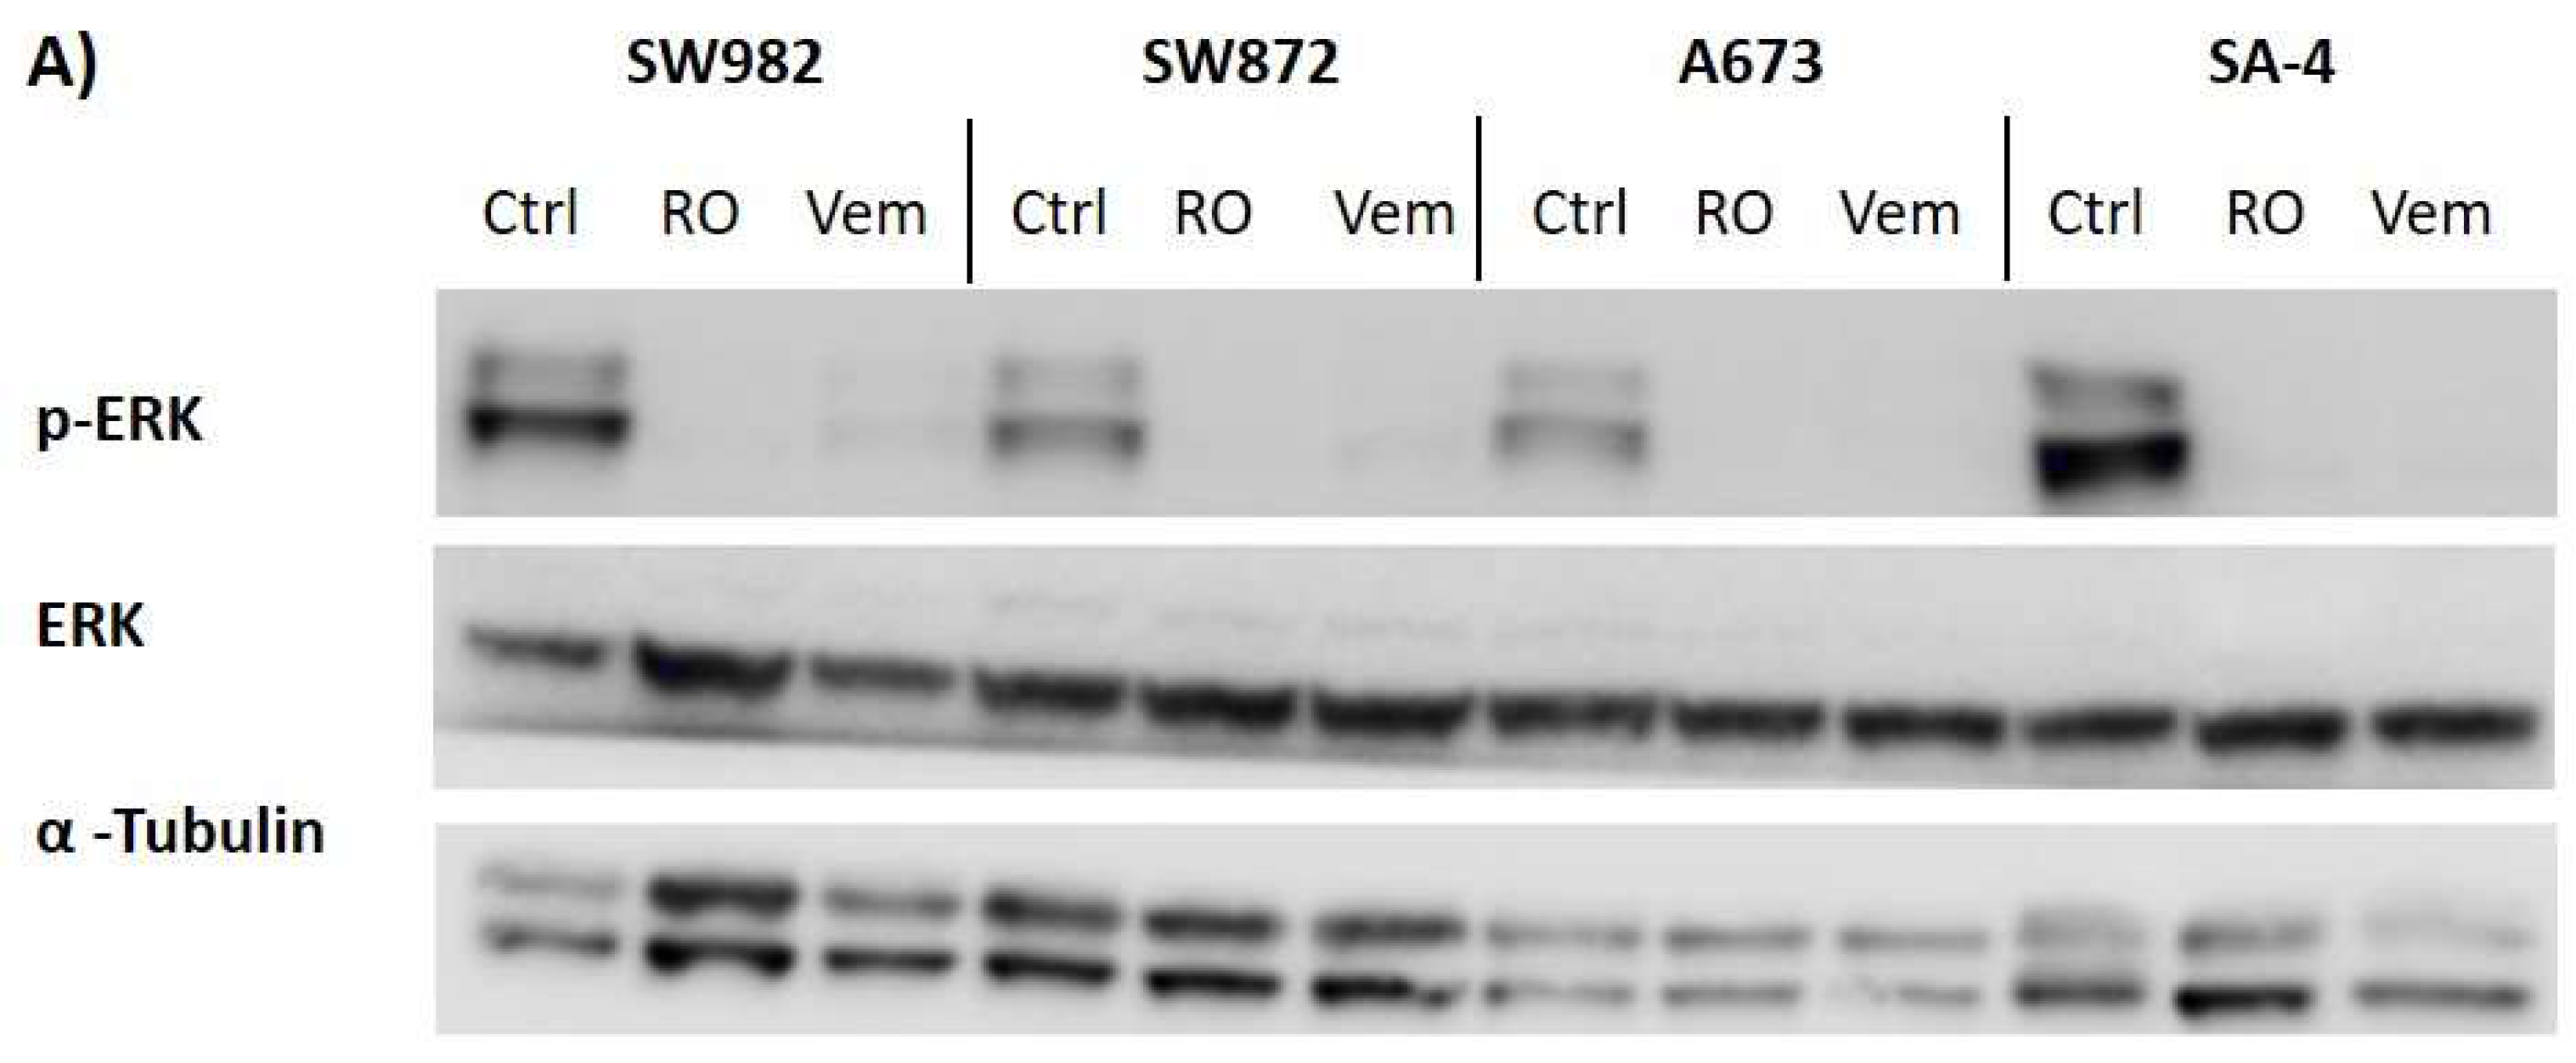
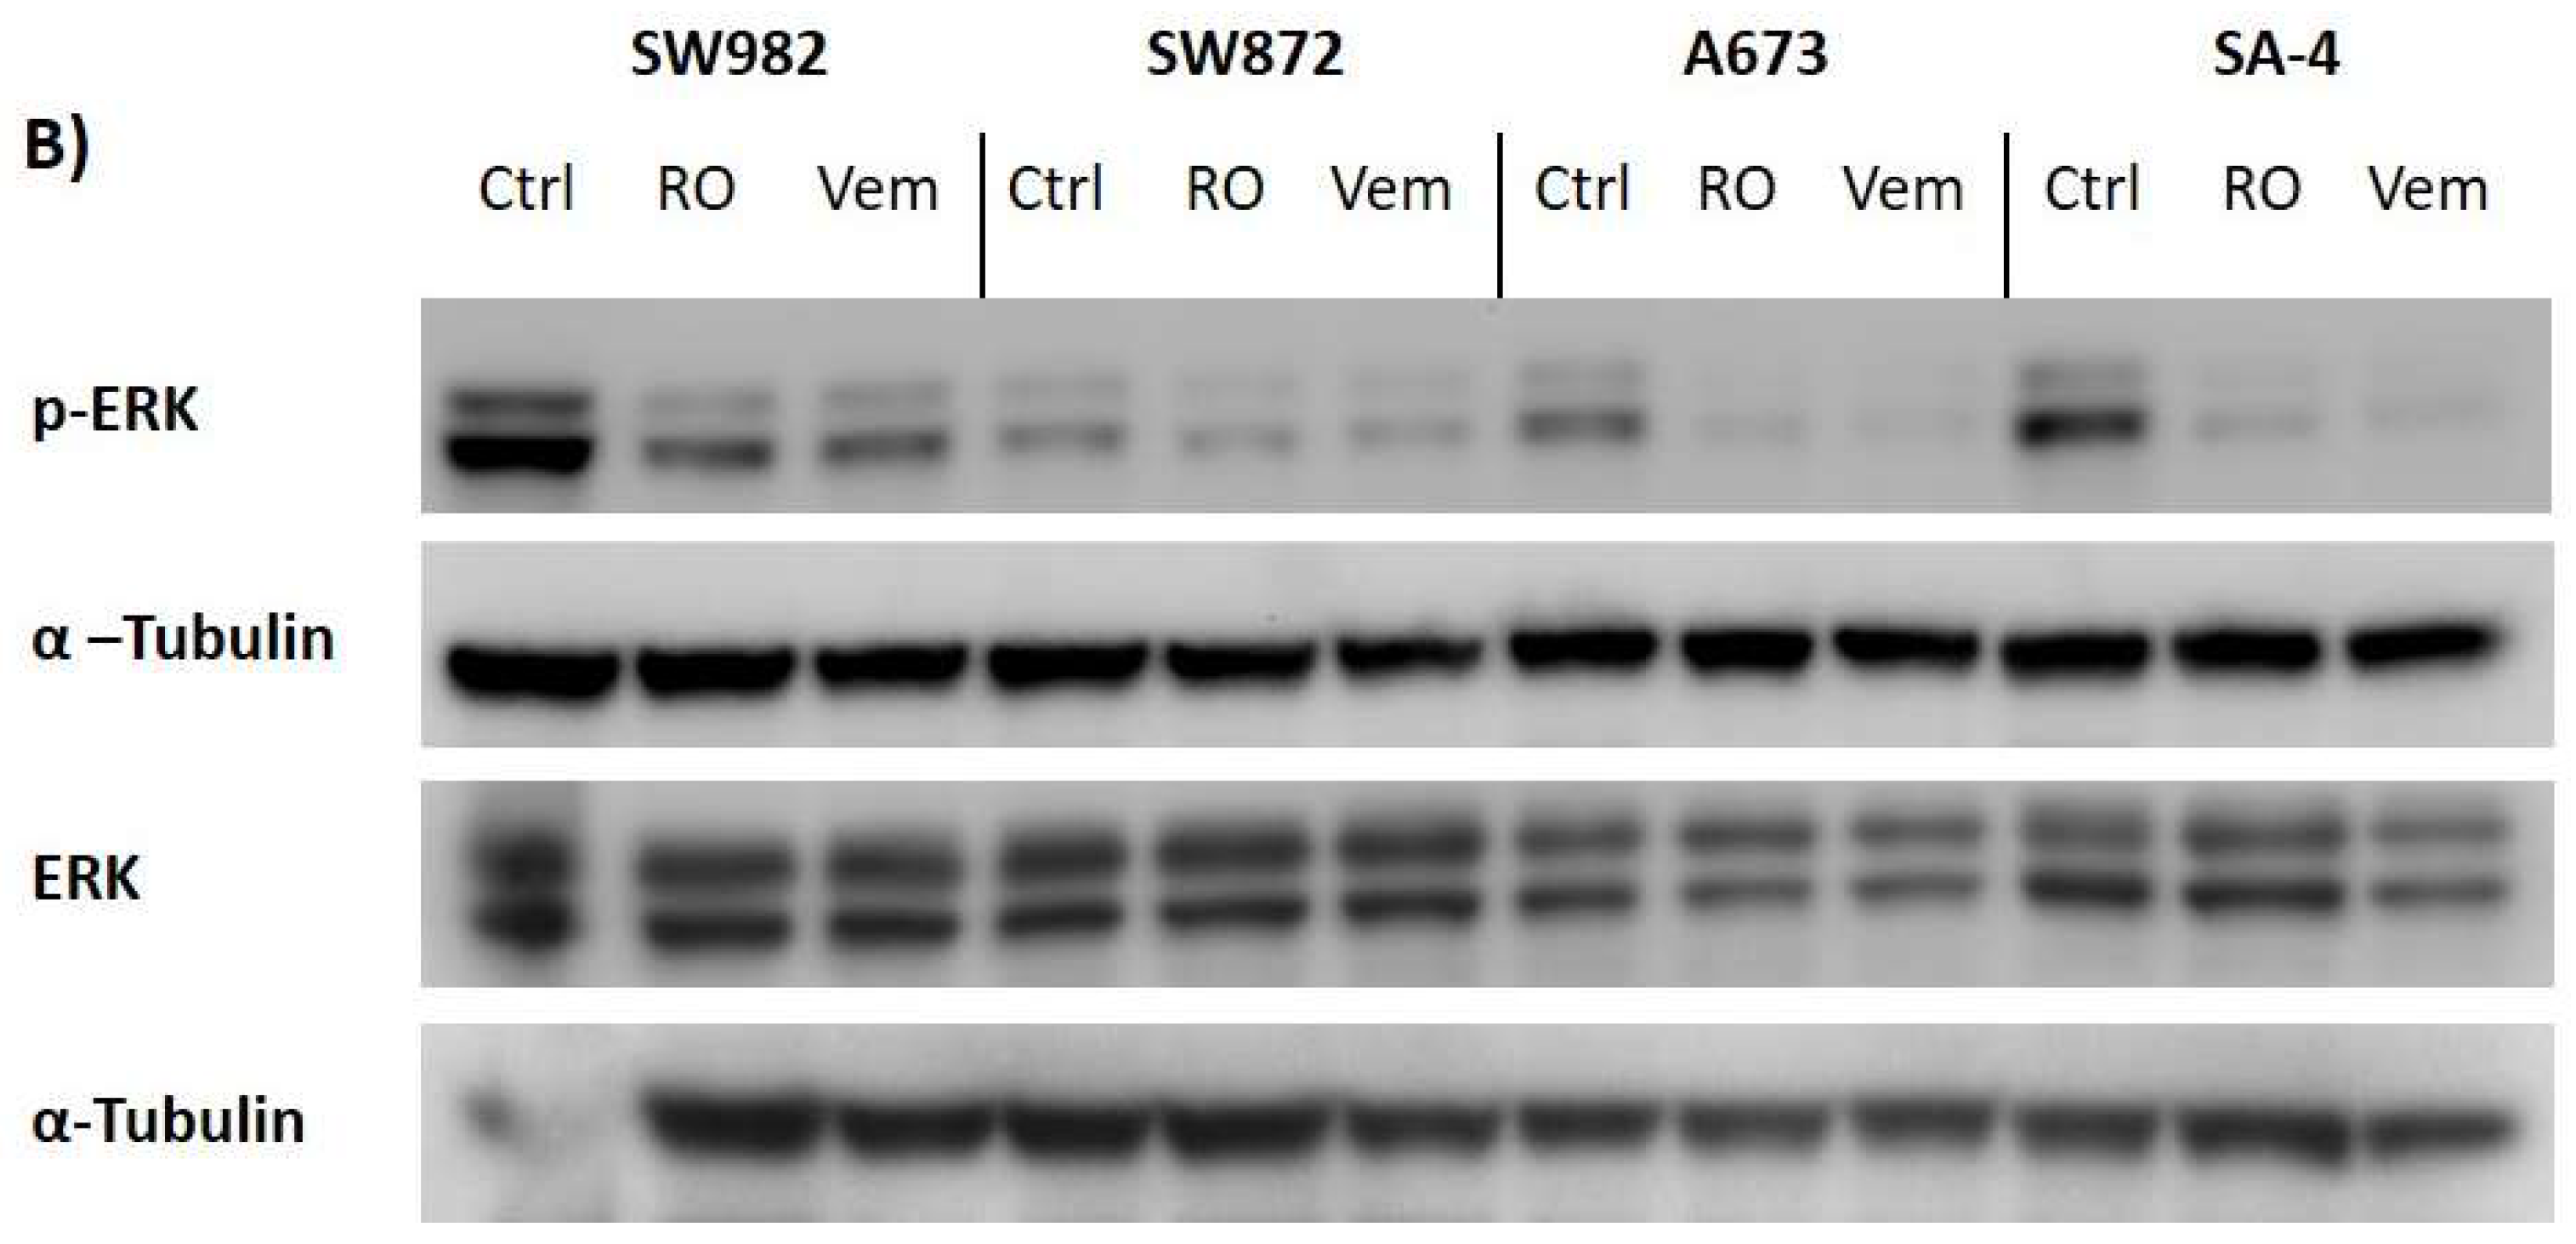
2.6. Vemurafenib De-Phosphorylates ERK Protein in All BRAF Mutated Sarcoma Cell Lines

ERK1 and −2 are the downstream kinases in the BRAF-MAPK signaling pathway, which phosphorylate nuclear transcription factors regulating cell growth and survival. Phosphorylation of ERK proteins can therefore be used as an indicator of an active MAPK signaling cascade. A common way for cells to circumvent BRAF inhibition is to up-regulate other signaling pathways that activate MAPK pathway, such as EGFR signaling, resulting in phosphorylation of ERK. To assess whether the sarcoma cell lines with a poor or short-term effect on cell growth circumvent the need for BRAF to be able to phosphorylate ERK, we evaluated the levels of p-ERK protein following treatment with vemurafenib for 3 or 72 h. The dual inhibitor RO5126766, targeting both BRAF and the downstream signaling molecule MEK, was included as a control. Treatment with either 5 µM vemurafenib or 300 nM RO5126766 for 3 h strongly reduced the level of phosphorylated ERK proteins in all the sarcoma cell lines harboring the mutation (Figure 7A). Levels of phosphorylated ERK were still strongly reduced after treatment for 72 h for all cell lines except for SW872 (Figure 7B).

3. Discussion

Precision cancer medicine is focused on targeting the tumor-specific mutations and affect mechanisms driving tumor growth. Repurposing drugs already approved for other indications are particularly valuable for orphan cancers such as sarcoma, where treatment options are limited and there is a large unmet therapeutic need. The V600E mutation of BRAF occurs in approximately 50% of melanoma tumors, and in these the selective BRAFV600E inhibitor, vemurafenib, provides on average >7 months of progression-free survival, although as many as 50% of these patients do not respond in spite of having the mutation in their tumors [26]. BRAFV600E is found in many cancer types, including some sarcomas [13,18,19,20,21,25,27], suggesting that vemurafenib might have activity against such tumors [21,28]. To determine the potential for using vemurafenib in sarcomas, we evaluated the efficacy in four BRAFV600E mutated sarcoma cell lines, using a range of vemurafenib concentrations based on previous studies [21]. Vemurafenib has already been shown to have some activity in two of the cell lines included in our study, SA-4 and SW872 [21], but it was unclear how strong and lasting this effect was compared to a responding melanoma model, and also how this treatment affected signaling in such mesenchymal models.
The levels of mRNA and protein for both wild-type and mutated BRAF were similar in both SA-4 and SW872 sarcoma cell lines. However, the growth inhibitory responses to vemurafenib were variable, with a strong, dose-dependent effect observed for SA-4 and minor effects observed for SW872 and the remaining BRAFV600E mutated sarcoma cell lines, A673 and SW982. In comparison, the melanoma cell line WM9 showed a strong and immediate growth inhibitory response also at lower doses, suggesting sub-optimal drug sensitivity in sarcomas. Acquired resistance to vemurafenib is commonly due to reactivation of MAPK signaling [29,30,31,32,33]. However, treatment with vemurafenib strongly reduced ERK phosphorylation in all the four mutated sarcoma lines at 3 h, and for three of the cell lines also at 72 h. A similar reduction was observed by treatment with the RAF/MEK-inhibitor RO5126766, indicating that SW982 and A673 cells are not intrinsically resistant to vemurafenib, but rather do not seem to be dependent on MAPK signaling for cell growth. However, ERK was fully phosphorylated again at 72 h in SW872 cells, which would explain the transient effect of vemurafenib on growth of these cells. Importantly, the presence of BRAFV600E or de-phosphorylation of ERK upon vemurafenib treatment cannot be used to predict response in BRAFV600E mutated sarcomas.
Further investigation of the growth inhibitory response observed for SA-4 cells revealed cell cycle arrest in G1 to be the major contributing mechanism for growth inhibition, consistent with previous studies in melanoma [34,35,36]. Although only moderate levels of apoptosis were induced in SA-4 cells, there was a long-lasting growth inhibitory effect at the highest drug concentrations. This could perhaps be a consequence of induction of senescence in some cells, as could be indicated by the weakly stained sub-G1 fraction observed by flow cytometry. However, continuous drug treatment was required to maintain the growth inhibitory response in both SA-4 sarcoma cells and the WM9 melanoma cell line, as cells regained growth following removal of vemurafenib at all tested concentrations. These findings indicate that there is a need for continuous treatment, should vemurafenib be used as a therapy against sarcoma, which is in agreement with experiences from treatment of other cancer types [37,38].
Our preclinical investigation of vemurafenib as treatment for patients with BRAFV600E mutated sarcomas is limited by the lack of suitable models. The efficient response of SA-4 cells to vemurafenib appears to be an exception within sarcoma. This cell line was described by ATCC as a liposarcoma, but the subtype of liposarcoma is not known. The cells are able to differentiate into adipocyte-like cells with lipid droplets in vitro [39], and pathological assessment of HE stained sections of SA-4 xenograft tumors demonstrated the presence of cells harboring lipid droplets (Supplementary Figure S1), which supports the classification. The cells have a gain on chromosome 12, including CPM and MDM2 which is consistent with liposarcomas [40], but not highly amplified, which rules out a well-differentiated/de-differentiated liposarcoma subtype. The absence of the classical translocation (t12:16) indicative of myxoid liposarcomas [41] suggests that SA-4 is of the third subgroup of liposarcoma, the pleomorphic subtype, which lacks specific genetic aberrations used for diagnosis.
The BRAFV600E mutation is only present in 2–5% of tumors derived from bone or soft tissue, according to the COSMIC database. Further, only 1 out of 4 BRAFV600E mutated sarcoma cell lines in our study responded to treatment, demonstrating the need to better identify responders. Interestingly, clear cell sarcomas which have been shown to respond to vemurafenib treatment [19,25], often express melanoma-related markers. We found that SA-4 cells also express several genes typical of melanomas, such as MITF, MLANA, S100B, and TYR, which are otherwise poorly expressed in our panel of liposarcoma cell lines (Table 3). This might indicate that the presence of both mutated BRAF and melanoma markers could be used to identify sarcoma patients expected to respond to vemurafenib.
Although not yet supported by preclinical data, we would expect targeted treatment of BRAFV600E mutated sarcomas to improve with the use of next generation RAF inhibitors in combination with other treatments. It could be envisioned that inhibition of phosphorylated ERK could sensitize other therapeutics or avoid resistance, and these options should be further evaluated.

4. Materials and Methods

4.1. Cancer Cell Lines and Cell Culturing

SA-4 (CRL-7938), SW872 (HTB-92), A673 (CRL-1598) and SW982 (HTB-93) cells were used as adherent human cancer cell model systems and were all obtained from ATCC. SA-4 is derived from a liposarcoma, whereas SW872 is derived from an undifferentiated liposarcoma. The A673 cell line represents Ewing sarcoma [42] and SW982 was derived from a synovial sarcoma, but lack the classical SYT-SSX translocation and is referred to as atypical synovial sarcoma [43]. The WM9 cell line (derived from a metastatic melanoma by Wistar Institute) and LPS510 cell line (derived from a dedifferentiated liposarcoma by Dr. J. Fletcher, Harvard Medical School, Boston, USA) were included as control cell lines in the study. All cell lines were cultured in a complete growth media consisting of RPMI1640 growth media (Sigma-Aldrich, St. Louis, MO, USA, #R0883) supplemented with 10% fetal bovine serum (FBS) (Sigma-Aldrich, #F7524), 1% L-alanine-L-glutamine (Glutamax) (Gibco by Life Technologies, Paisley, Scotland #35050-038) and 1% penicillin G and streptomycin sulfate (Sigma-Aldrich, #P4458). Cells were passaged twice a week and cultured in a humidified incubator holding 37 °C and 5% CO2. All cell lines included in the study were fingerprinted by short tandem repeat (STR) profiling to ensure correct identity of the cell stock and confirmed negative for mycoplasma infection using the VenorGeM Mycoplasma detection kit (Minerva Biolabs) for PCR.

4.2. Evaluation of Mutational Status in Cell Lines

Three of the sarcoma cell lines (SA-4, SW872 and LPS510) were exome-sequenced at the Oslo University Hospital Genomics Core Facility using Agilent SureSelectXT Human All Exon v5 protocol and Illumina sequencing by synthesis technology on a HiSeq 4000 instrument (2 × 150 bp). Preprocessing, mapping of the reads and calling of variants was performed as previously described [44]. RNA-sequencing was performed at the Genomics Core Facility for three of the cell lines, SA-4, SW872 and LPS510, using the Illumina TruSeq Stranded mRNA Library Prep kit for NeoPrep following supplier’s instructions. The libraries were sequenced on a NextSeq 500 Illumina sequencer using a High Output v2 kit chemistry, generating 2 × 75 bp paired-end sequence reads. RNA-Seq reads were aligned using STAR aligner (v.2.5.0b) against the human reference genome (UCSC hg19, RefSeq and Gencode gene annotations), and FPKM estimation for each mRNA was generated by Cufflinks 2 using RNA-seq alignment app at Illumina BaseSpace. The RNA sequencing data for SW872 and SA-4 are available in the Short Read Archive (SRA), with accession number SRP 134156.

4.3. Western Blotting

Cells were resuspended in Lysis buffer (1% SDS, 0.3% Trizma Base, 7% glycerol and 3.5% β-mercaptoethanol, supplemented with phosphostop (#04906837001) and protease inhibitors (#04693124001), both from Roche, and subsequently boiled at 95 °C. Cell lysates were separated on a 4–12% PAGE gel (Novex by Life technologies, #NP0323BOX) with 3-(N-morpholino) propanesulfonic acid (MOPS) running buffer (Invitrogen, Carlsbad, CA, USA, #NP000102) and transferred to PVDF membrane (Merck, Kenilworth, NJ, USA, #IPVH00010). Membranes were blocked with TBS-T containing 5% bovine serum albumin (pERK) or 10% non-fat dry milk for the other antibodies and incubated over night while shaking. The antibodies used were as follows: pan-BRAF (1:200) (Sigma-Aldrich, #HPA001238), BRAFV600E (1:1000) (RevMAb Biosciences, South San Francisco, CA, USA, #31-1042-005), phosphorylated p44/42 MAP kinase (pERK) (1:1000) (Cell signaling, #5370), p44/42 MAP kinase (ERK) (1:1000) (Cell Signaling, Danvers, MA, USA, #9102) and anti-α-Tubulin (1:2000) (Merck, #Cp06). Anti-Mouse (1:5000) (DAKO, #P0260) or anti-Rabbit (1:5000) (DAKO, Glostrup, Denmark, #P0448) was used as secondary antibodies. Following incubation with secondary antibody, the membrane was incubated in a development solution (Super Signal West Dura Extended Duration Substrate) (Thermo Scientific, Waltham, MA, USA, #34076). The emitted signal was detected using the digital developer G:BOX (Syngene) Cambridge, UK, and images captured were analyzed using the GeneSnap software.

4.4. Drug Treatment

The BRAF inhibitor, PLX4032 (vemurafenib) (Selleckchem, Munich, Germany #S1267) was dissolved in dimethyl sulfoxide (DMSO) to a 10 mM stock solution. The dual BRAF/MEK inhibitor RO5126766 (Selleckchem, #S7170) was dissolved in DMSO to a 1 mM stock solution. When used in experiments, drugs were further diluted in complete growth media. Cells treated with DMSO at a concentration corresponding to the highest drug concentration were included as controls in all experiments and referred to as vehicle.

4.5. Cell Growth by MTS

1000–2000 cells were plated in 96-well plates one day before drug treatment and subsequently treated with vemurafenib (0.31–5 µM) or vehicle only. Cell growth was assessed by MTS (Promega, Madison, WI, USA, #G5421) assay 72–96 h post treatment (depending on the growth rate of the individual cell lines), following the protocol recommended by the manufacturer. The absorbance was measured at 450 nm. The data was shown as mean of three biological experiments (n = 3) and presented relative to control.

4.6. Cell Cycle Analysis

10,000 cells were plated in 6-well plates, and on the subsequent day treated with the indicated concentrations of vemurafenib or vehicle only for 48 h. Cells were trypsinized, washed with PBS and fixed and permeabilized with 96% ethanol and stored at −20 °C at least 2 h. Cells were washed with PBS twice and stained with 2 µg/mL of the DNA-binding dye, Hoechst 33258 (Sigma-Aldrich, #94403). Approximately 1 × 10⁶ cells per sample was analyzed by flow cytometry using the LSR II (BD) at excitation/emission = 352/461 nm. FLOWJO v7.6.5 software and Watson settings were used to analyze the data. Data are presented as mean of three biological experiments.

4.7. Apoptotic Cell Death

1000–2000 cells were plated in 96-well plates and on the subsequent day, treated with vemurafenib at the indicated concentrations or vehicle only. The Cellplayer reagent that reports caspase 3/7 activity (Essen BioScience, Hertfordshire, UK #4440) was also included in a final concentration of 2.5 µM. The cells were monitored by live cell imaging (IncuCyte Zoom from Essen BioScience), where phase-contrast and green fluorescent images (488 nm) were recorded and used to estimate the confluence and the number of apoptotic cells, respectively. Data is presented as number of caspase-3/7 active cells per well and as means of three technical replicates. At 72 h, data is also shown as relative to cell density, normalized to control.

4.8. Growth Assay

1000–2000 cells were plated in 96-well plates one day before drug treatment, and subsequently treated with vemurafenib (1.25, 2.5 or 5 µM) or vehicle only. Replacement of media containing drug or control was performed twice a week for the entire duration of the experiment (approximately 240 h). To determine if continuous presence of drugs is necessary to achieve cell growth inhibition, drug containing media was exchanged with regular growth media after approximately 240 h. Cells were monitored by time-lapse microscopy, (IncuCyte FLR and IncuCyte ZOOM, Essen Bioscience) with phase-contrast images taken every third hour for the duration of the treatment, and cell growth estimated based on cell density. Data is presented as mean of three technical replicates.

4.9. Statistical Analysis

Data presented is obtained from at least three independent experiments, unless otherwise stated. Two-tailed paired Student’s t-test was used to compare the read-out of drug-treated with control-treated cells. p < 0.05 were considered statistically significant.

5. Conclusions

We conclude that vemurafenib can have therapeutic potential for selected cases of BRAFV600E sarcoma; however others could benefit from vemurafenib in combination with additional therapies and further work is required to explore this.

Supplementary Materials

The following are available online at https://www.mdpi.com/1422-0067/19/4/969/s1.

Acknowledgments

The authors want to thank M.D. Bodil Berkehagen (Section head of Department of Pathology at the Norwegian Radium Hospital at Oslo University Hospital) a specialist in sarcoma pathology of pathological analysis of the SA-4 derived tumors. Exome and RNA sequencing libraries were prepared at the Genomics Core Facility at Oslo University Hospital (oslo.genomics.no) financed by the Southern and Eastern Norway Regional Health Authority and the Research Council of Norway. We are grateful for the following grants: The Norwegian Cancer Society (#109390 to O.M.) and South-Eastern Norway Regional Health Authority (#2014047 to O.M.), and support from the Liddy Shriver Sarcoma Initiative (Translational research in well–and de-differentiated liposarcomas-II).

Author Contributions

S.G. performed the experiments, analyzed the data, and wrote the paper. L.A.M.-Z. contributed with bioinformatics. O.M. conceived and designed the study and wrote the paper, E.W.S. and E.M. designed the study and experiments, analyzed data, and wrote the paper. All authors approved the final version.

Conflicts of Interest

The authors declare no conflict of interest.

Abbreviations

µMicro
µgMicrogram
µLMicroliter
µMMicro molar
ARAFv-Raf murine sarcoma 3611 viral oncogene homolog 1
ATCCAmerican type culture collection
BRAFv-Raf murine sarcoma viral oncogene homolog B
BRAFV600EV600E-mutated BRAF
BRAFWTWild-type BRAF
DMSODimethyl sulfoxide
DNADeoxyribonucleic acid
EGFEpidermal growth factor
EGFREpidermal growth factor receptor
ERKExtracellular signal-regulated kinase
FBSFetal bovine serum
FDAFood and drug administration
FPKMFragments per kilobase million
GISTGastrointestinal stromal tumor
MAPKMitogen-activated protein kinase
MEKMitogen activated protein kinase
MITFMicrophthalmia-associated transcription factor
mLMilliliter
MLANAMelanoma antigen recognized by T-cells 1
mMMilli molar
mRNAMessenger RNA
nNumber of biological replicates
nmNanometer
nMNano molar
pProbability value
PAGEPolyacrylamide gel electrophoresis
PBSPhosphate-buffered saline
PCRPolymerase chain reaction
PDGFPlatelet-derived growth factor
p-ERKPhosphorylated ERK
PVDFPolyvinylidene difluoride
RAFRapidly accelerated fibrosarcoma
RAF1v-Raf-1 murine leukemia viral oncogene homolog 1
RASRas sarcoma
RNARibonucleic acid
RPKMReads per kilobase million
RTRoom temperature
RTKReceptor tyrosine kinase
SDStandard deviation
SDSSodium dodecyl sulfate
SEMStandard error of mean
STRShort tandem repeat
STSSoft tissue sarcoma
TBSTris-buffered saline
αAlpha
βBeta

References

  1. Williams, R.F.; Fernandez-Pineda, I.; Gosain, A. Pediatric Sarcomas. Surg. Clin. N. Am. 2016, 96, 1107–1125. [Google Scholar] [CrossRef] [PubMed]
  2. Burningham, Z.; Hashibe, M.; Spector, L.; Schiffman, J.D. The Epidemiology of Sarcoma. Clin. Sarcoma Res. 2012, 2, 14. [Google Scholar] [CrossRef] [PubMed]
  3. Fletcher, C.D.M.; Bridge, J.A.; Hogendoorn, P.C.W.; Mertens, F. World Health Organization Classification of Tumours. Pathology and Genetics of Tumours of Soft Tissue and Bone, 4th ed.; IARC Press: Lyon, France, 2013. [Google Scholar]
  4. Din, O.S.; Woll, P.J. Treatment of gastrointestinal stromal tumor: Focus on imatinib mesylate. Ther. Clin. Risk Manag. 2008, 4, 149–162. [Google Scholar] [PubMed]
  5. Ascierto, P.A.; Kirkwood, J.M.; Grob, J.-J.; Simeone, E.; Grimaldi, A.M.; Maio, M.; Palmieri, G.; Testori, A.; Marincola, F.M.; Mozzillo, N. The role of BRAF V600 mutation in melanoma. J. Transl. Med. 2012, 10, 85. [Google Scholar] [CrossRef] [PubMed]
  6. Wellbrock, C.; Karasarides, M.; Marais, R. The RAF proteins take centre stage. Nat. Rev. Mol. Cell Biol. 2004, 5, 875. [Google Scholar] [CrossRef] [PubMed]
  7. McCubrey, J.A.; Steelman, L.S.; Chappell, W.H.; Abrams, S.L.; Wong, E.W.T.; Chang, F.; Lehmann, B.; Terrian, D.M.; Milella, M.; Tafuri, A.; et al. Roles of the RAF/MEK/ERK pathway in cell growth, malignant transformation and drug resistance. Biochim. Biophys. Acta 2007, 1773, 1263–1284. [Google Scholar] [CrossRef] [PubMed]
  8. Cargnello, M.; Roux, P.P. Activation and Function of the MAPKs and Their Substrates, the MAPK-Activated Protein Kinases. Microbiol. Mol. Biol. Rev. 2011, 75, 50–83. [Google Scholar] [CrossRef] [PubMed]
  9. Wan, P.T.C.; Garnett, M.J.; Roe, S.M.; Lee, S.; Niculescu-Duvaz, D.; Good, V.M.; Project, C.G.; Jones, C.M.; Marshall, C.J.; Springer, C.J.; et al. Mechanism of Activation of the RAF-ERK Signaling Pathway by Oncogenic Mutations of B-RAF. Cell 2004, 116, 855–867. [Google Scholar] [CrossRef]
  10. Bollag, G.; Tsai, J.; Zhang, J.; Zhang, C.; Ibrahim, P.; Nolop, K.; Hirth, P. Vemurafenib: The first drug approved for BRAF-mutant cancer. Nat. Rev. Drug Discov. 2012, 11, 873. [Google Scholar] [CrossRef] [PubMed]
  11. Satyamoorthy, K.; Li, G.; Gerrero, M.R.; Brose, M.S.; Volpe, P.; Weber, B.L.; van Belle, P.; Elder, D.E.; Herlyn, M. Constitutive Mitogen-activated Protein Kinase Activation in Melanoma Is Mediated by Both BRAF Mutations and Autocrine Growth Factor Stimulation. Cancer Res. 2003, 63, 756–759. [Google Scholar] [PubMed]
  12. Shelledy, L.; Roman, D. Vemurafenib: First-in-Class BRAF-Mutated Inhibitor for the Treatment of Unresectable or Metastatic Melanoma. J. Adv. Pract. Oncol. 2015, 6, 361–365. [Google Scholar] [PubMed]
  13. Hyman, D.M.; Puzanov, I.; Subbiah, V.; Faris, J.E.; Chau, I.; Blay, J.-Y.; Wolf, J.; Raje, N.S.; Diamond, E.L.; Hollebecque, A.; et al. Vemurafenib in Multiple Nonmelanoma Cancers with BRAF V600 Mutations. N. Engl. J. Med. 2015, 373, 726–736. [Google Scholar] [CrossRef] [PubMed]
  14. Corcoran, R.B.; Ebi, H.; Turke, A.B.; Coffee, E.M.; Nishino, M.; Cogdill, A.P.; Brown, R.D.; Pelle, P.D.; Dias-Santagata, D.; Hung, K.E.; et al. EGFR-mediated re-activation of MAPK signaling contributes to insensitivity of BRAF mutant colorectal cancers to RAF inhibition with vemurafenib. Cancer Discov. 2012, 2, 227–235. [Google Scholar] [CrossRef] [PubMed]
  15. Oddo, D.; Sennott, E.M.; Barault, L.; Valtorta, E.; Arena, S.; Cassingena, A.; Filiciotto, G.; Marzolla, G.; Elez, E.; van Geel, R.M.J.M.; et al. Molecular Landscape of Acquired Resistance to Targeted Therapy Combinations in BRAF-Mutant Colorectal Cancer. Cancer Res. 2016, 76, 4504. [Google Scholar] [CrossRef] [PubMed]
  16. Notarangelo, T.; Sisinni, L.; Condelli, V.; Landriscina, M. Dual EGFR and BRAF blockade overcomes resistance to vemurafenib in BRAF mutated thyroid carcinoma cells. Cancer Cell Int. 2017, 17, 86. [Google Scholar] [CrossRef] [PubMed]
  17. Kim, S.-M.; Kim, H.; Jang, K.W.; Kim, M.H.; Sohn, J.; Yun, M.R.; Kang, H.N.; Kang, C.W.; Kim, H.R.; Lim, S.M.; et al. EGFR-Mediated Reactivation of MAPK Signaling Induces Acquired Resistance to GSK2118436 in BRAF V600E–Mutant NSCLC Cell Lines. Mol. Cancer Ther. 2016, 15, 1627–1636. [Google Scholar] [CrossRef] [PubMed]
  18. Park, B.M.; Jin, S.A.; Choi, Y.D.; Shin, S.H.; Jung, S.T.; Lee, J.B.; Lee, S.C.; Yun, S.J. Two cases of clear cell sarcoma with different clinical and genetic features: Cutaneous type with BRAF mutation and subcutaneous type with KIT mutation. Br. J. Dermatol. 2013, 169, 1346–1352. [Google Scholar] [CrossRef] [PubMed]
  19. Hocar, O.; Le Cesne, A.; Berissi, S.; Terrier, P.; Bonvalot, S.; Vanel, D.; Auperin, A.; Le Pechoux, C.; Bui, B.; Coindre, J.M.; et al. Clear Cell Sarcoma (Malignant Melanoma) of Soft Parts: A Clinicopathologic Study of 52 Cases. Dermatol. Res. Pract. 2012, 2012, 984096. [Google Scholar] [CrossRef] [PubMed]
  20. Falchook, G.S.; Trent, J.C.; Heinrich, M.C.; Beadling, C.; Patterson, J.; Bastida, C.C.; Blackman, S.C.; Kurzrock, R. BRAF Mutant Gastrointestinal Stromal Tumor: First report of regression with BRAF inhibitor dabrafenib (GSK2118436) and whole exomic sequencing for analysis of acquired resistance. Oncotarget 2013, 4, 310–315. [Google Scholar] [CrossRef] [PubMed]
  21. Kanojia, D.; Nagata, Y.; Garg, M.; Lee, D.H.; Sato, A.; Yoshida, K.; Sato, Y.; Sanada, M.; Mayakonda, A.; Bartenhagen, C.; et al. Genomic landscape of liposarcoma. Oncotarget 2015, 6, 42429–42444. [Google Scholar] [CrossRef] [PubMed]
  22. Becerikli, M.; Jacobsen, F.; Rittig, A.; Kohne, W.; Nambiar, S.; Mirmohammadsadegh, A.; Stricker, I.; Tannapfel, A.; Wieczorek, S.; Epplen, J.T.; et al. Growth rate of late passage sarcoma cells is independent of epigenetic events but dependent on the amount of chromosomal aberrations. Exp. Cell Res. 2013, 319, 1724–1731. [Google Scholar] [CrossRef] [PubMed]
  23. Flaherty, K.T.; Puzanov, I.; Kim, K.B.; Ribas, A.; McArthur, G.A.; Sosman, J.A.; O’Dwyer, P.J.; Lee, R.J.; Grippo, J.F.; Nolop, K.; et al. Inhibition of Mutated, Activated BRAF in Metastatic Melanoma. N. Engl. J. Med. 2010, 363, 809–819. [Google Scholar] [CrossRef] [PubMed]
  24. Villanueva, J.; Vultur, A.; Herlyn, M. Resistance to BRAF inhibitors: Unraveling mechanisms and future treatment options. Cancer Res. 2011, 71, 7137–7140. [Google Scholar] [CrossRef] [PubMed]
  25. Protsenko, S.A.; Semionova, A.I.; Komarov, Y.I.; Aleksakhina, S.N.; Ivantsov, A.O.; Iyevleva, A.G.; Imyanitov, E.N. BRAF-mutated clear cell sarcoma is sensitive to vemurafenib treatment. Investig. New Drugs 2015, 33, 1136–1143. [Google Scholar] [CrossRef] [PubMed]
  26. Sosman, J.A.; Kim, K.B.; Schuchter, L.; Gonzalez, R.; Pavlick, A.C.; Weber, J.S.; McArthur, G.A.; Hutson, T.E.; Moschos, S.J.; Flaherty, K.T.; et al. Survival in BRAF V600–Mutant Advanced Melanoma Treated with Vemurafenib. N. Engl. J. Med. 2012, 366, 707–714. [Google Scholar] [CrossRef] [PubMed]
  27. Jiang, Y.; Subbiah, V.; Janku, F.; Ludwig, J.A.; Naing, A.; Benjamin, R.S.; Brown, R.E.; Anderson, P.; Kurzrock, R. Novel Secondary Somatic Mutations in Ewing’s Sarcoma and Desmoplastic Small Round Cell Tumors. PLoS ONE 2014, 9, e93676. [Google Scholar] [CrossRef] [PubMed]
  28. Tolcher, A.W.; Peng, W.; Calvo, E. Rational Approaches for Combination Therapy Strategies Targeting the MAP Kinase Pathway in Solid Tumors. Mol. Cancer Ther. 2018, 17, 3–16. [Google Scholar] [CrossRef] [PubMed]
  29. Yadav, V.; Zhang, X.; Liu, J.; Estrem, S.; Li, S.; Gong, X.-Q.; Buchanan, S.; Henry, J.R.; Starling, J.J.; Peng, S.-B. Reactivation of Mitogen-activated Protein Kinase (MAPK) Pathway by FGF Receptor 3 (FGFR3)/Ras Mediates Resistance to Vemurafenib in Human B-RAF V600E Mutant Melanoma. J. Biol. Chem. 2012, 287, 28087–28098. [Google Scholar] [CrossRef] [PubMed]
  30. Spagnolo, F.; Ghiorzo, P.; Orgiano, L.; Pastorino, L.; Picasso, V.; Tornari, E.; Ottaviano, V.; Queirolo, P. BRAF-mutant melanoma: Treatment approaches, resistance mechanisms, and diagnostic strategies. OncoTargets Ther. 2015, 8, 157–168. [Google Scholar] [CrossRef] [PubMed]
  31. Sullivan, R.J.; Flaherty, K.T. Resistance to BRAF-targeted therapy in melanoma. Eur. J. Cancer 2013, 49, 1297–1304. [Google Scholar] [CrossRef] [PubMed]
  32. Poulikakos, P.I.; Zhang, C.; Bollag, G.; Shokat, K.M.; Rosen, N. RAF inhibitors transactivate RAF dimers and ERK signalling in cells with wild-type BRAF. Nature 2010, 464, 427. [Google Scholar] [CrossRef] [PubMed]
  33. Rushworth, L.K.; Hindley, A.D.; O’Neill, E.; Kolch, W. Regulation and Role of Raf-1/B-Raf Heterodimerization. Mol. Cell. Biol. 2006, 26, 2262–2272. [Google Scholar] [CrossRef] [PubMed]
  34. Joseph, E.W.; Pratilas, C.A.; Poulikakos, P.I.; Tadi, M.; Wang, W.; Taylor, B.S.; Halilovic, E.; Persaud, Y.; Xing, F.; Viale, A.; et al. The RAF inhibitor PLX4032 inhibits ERK signaling and tumor cell proliferation in a V600E BRAF-selective manner. Proc. Natl. Acad. Sci. USA 2010, 107, 14903–14908. [Google Scholar] [CrossRef] [PubMed]
  35. Kim, A.; Cohen, M.S. The discovery of vemurafenib for the treatment of BRAF-mutated metastatic melanoma. Expert Opin. Drug Discov. 2016, 11, 907–916. [Google Scholar] [CrossRef] [PubMed]
  36. Lee, J.T.; Li, L.; Brafford, P.A.; van den Eijnden, M.; Halloran, M.B.; Sproesser, K.; Haass, N.K.; Smalley, K.S.M.; Tsai, J.; Bollag, G.; et al. PLX4032, a Potent Inhibitor of the B-Raf V600E Oncogene, Selectively Inhibits V600E-positive Melanomas. Pigment Cell Melanoma Res. 2010, 23, 820–827. [Google Scholar] [CrossRef] [PubMed]
  37. Hartsough, E.J.; Aplin, A.E. A STATement on Vemurafenib-Resistant Melanoma. J. Investig. Dermatol. 2013, 133, 1928–1929. [Google Scholar] [CrossRef] [PubMed]
  38. Wagle, N.; Emery, C.; Berger, M.F.; Davis, M.J.; Sawyer, A.; Pochanard, P.; Kehoe, S.M.; Johannessen, C.M.; MacConaill, L.E.; Hahn, W.C.; et al. Dissecting Therapeutic Resistance to RAF Inhibition in Melanoma by Tumor Genomic Profiling. J. Clin. Oncol. 2011, 29, 3085–3096. [Google Scholar] [CrossRef] [PubMed]
  39. Stratford, E.W.; Castro, R.; Daffinrud, J.; Skårn, M.; Lauvrak, S.; Munthe, E.; Myklebost, O. Characterization of Liposarcoma Cell Lines for Preclinical and Biological Studies. Sarcoma 2012, 2012, 9. [Google Scholar] [CrossRef] [PubMed]
  40. Wang, X.; Asmann, Y.W.; Erickson-Johnson, M.R.; Oliveira, J.L.; Zhang, H.; Moura, R.D.; Lazar, A.J.; Lev, D.; Bill, K.; Lloyd, R.V.; et al. High-resolution genomic mapping reveals consistent amplification of the fibroblast growth factor receptor substrate 2 gene in well-differentiated and dedifferentiated liposarcoma. Genes Chromosomes Cancer 2011, 50, 849–858. [Google Scholar] [CrossRef] [PubMed]
  41. Crozat, A.; Aman, P.; Mandahl, N.; Ron, D. Fusion of CHOP to a novel RNA-binding protein in human myxoid liposarcoma. Nature 1993, 363, 640–644. [Google Scholar] [CrossRef] [PubMed]
  42. Martinez-Ramirez, A.; Rodriguez-Perales, S.; Melendez, B.; Martinez-Delgado, B.; Urioste, M.; Cigudosa, J.C.; Benitez, J. Characterization of the A673 cell line (Ewing tumor) by molecular cytogenetic techniques. Cancer Genet. Cytogenet. 2003, 141, 138–142. [Google Scholar] [CrossRef]
  43. Teicher, B.A.; Polley, E.; Kunkel, M.; Evans, D.; Silvers, T.; Delosh, R.; Laudeman, J.; Ogle, C.; Reinhart, R.; Selby, M.; et al. Sarcoma Cell Line Screen of Oncology Drugs and Investigational Agents Identifies Patterns Associated with Gene and microRNA Expression. Mol. Cancer Ther. 2015, 14, 2452–2462. [Google Scholar] [CrossRef] [PubMed]
  44. Namløs, H.M.; Zaikova, O.; Bjerkehagen, B.; Vodák, D.; Hovig, E.; Myklebost, O.; Boye, K.; Meza-Zepeda, L.A. Use of liquid biopsies to monitor disease progression in a sarcoma patient: A case report. BMC Cancer 2017, 17, 29. [Google Scholar] [CrossRef] [PubMed]
Figure 1. Expression of BRAFV600E protein in sarcoma cell lines. The presence of BRAFV600E mutated protein was evaluated in the five sarcoma cell lines (LPS510, SA-4, A673, SW872, SW982). The melanoma cell line WM9 (with BRAFV600E) and LPS510 (with wild-type BRAF) were included as control cell lines. Cell lysates were analyzed by western blotting, using indicated antibodies. α-Tubulin served as protein loading control. Arrow indicates the expected size of BRAFV600E, and an unspecific band was observed below this band for all cell types.
Ijms 19 00969 g001
Figure 2. Effect on cell growth following vemurafenib treatment. Cell lines were treated with the indicated concentrations of vemurafenib or vehicle only, and MTS assay was performed 72 h (WM9, LPS510, SA-4 and A673) or 96 h (SW872 and SW982) after initiation of treatment. The absorbance at 450 nm was measured and normalized to vehicle-treated cells. Curves represent means of three biological experiments and error bars represent standard deviations (SD) (n = 3). * indicates p < 0.05 at the highest dose.
Ijms 19 00969 g002
Figure 3. Effect on cell growth during vemurafenib treatment. Cells were treated with the indicated concentrations of vemurafenib or vehicle only (Ctrl) and monitored by time-lapse microscopy. Growth medium supplemented with drug was replaced twice a week. Irregularities in growth curves are caused by loss of poorly attached cells by media change. One representative experiment is shown (n = 2). Error bars represent standard error of mean (SEM) of three technical replicates.
Ijms 19 00969 g003aIjms 19 00969 g003b
Figure 4. Vemurafenib induces apoptosis in SA-4 cells. (A) The number of apoptotic cells per well was determined based on caspase-3/7 activity monitored by time-lapse microscopy during treatment with 2.5 or 5 µM vemurafenib or vehicle only (Ctrl). The curve from one out of three representative experiment is shown and error bars represent standard error of mean (SEM) of three technical replicates; (B) Apoptotic cells shown relative to total cells, normalized to control at 72 h. Error bars represent standard deviations (SD) between biological experiments (n = 3). * indicates p < 0.05.
Ijms 19 00969 g004
Figure 5. Vemurafenib induces G1 arrest in SA-4 cells. Cells were treated with 0.31 or 1.25 μM vemurafenib or vehicle only (Ctrl) for 48 h and subsequently stained with a DNA-binding dye and analyzed by flow cytometry. (A) Histogram from a representative experiment is shown (n = 3), where the x-axis represents fluorescence intensity and the y-axis represents cell count; (B) Bar graphs represent distribution of cells among the phases of cell cycle. The fraction of cells in each phase is indicated by colors.
Ijms 19 00969 g005
Figure 6. Continuous vemurafenib treatment is required for sustained growth inhibition. Cell lines were treated with the indicated concentrations of vemurafenib or vehicle only (Ctrl) for 240 h and growth medium supplemented with drug was replaced twice a week for this duration. As indicated by the arrows, after 240 h drug-containing medium was replaced with regular growth medium. Irregularities in growth curves are caused by loss of poorly attached cells by media change. One representative experiment is shown (n = 2). Error bars represent standard error of mean (SEM) of three technical replicates.
Ijms 19 00969 g006
Figure 7. Vemurafenib inhibits ERK phosphorylation in sarcoma cell lines. Four BRAFV600E mutated sarcoma cell lines were treated with 5 µM vemurafenib, 300 nM RO5126766 or vehicle only (Ctrl) for either (A) 3 h or (B) 72 h, before levels of phosphorylated ERK (p-ERK) in cell lysates were analyzed by western blotting, using indicated antibodies. α-Tubulin served as protein loading control.
Ijms 19 00969 g007aIjms 19 00969 g007b
Table 1. mRNA expression.
GENE SYMBOLSA-4SW872LPS510
ARAF9.024.121.7
BRAFWT4.34.42.7
BRAFV600E4.04.60
RAF119.026.533.3
Gene expression shown as RPKM values (Reads Per Kilobase Million) based on mRNA sequencing data. RNA sequencing data for SW982 and A673 were not available.
Table 2. Percentages (%) of cells in the phases of cell cycle, including standard deviations (n = 3).
G0/G1SG2Sub-G1
Vehicle (Ctrl)55.2 ± 4.833.1 ± 4.911.3 ± 1.70.5 ± 0.7
0.31 μM72.4 ± 2.118.5 ± 3.85.5 ± 1.03.7 ± 2.7
1.25 μM81.6 ± 0.77.4 ± 2.02.3 ± 0.8 8.7 ± 2.4
Table 3. Endogenous mRNA expression.
GENE SYMBOLSA-4SW872LPS510
S100B6620.120
MITF39.22.70.99
TYR71.70.020
MLANA27800
SOX102620.050
Gene expression shown as RPKM values (Reads Per Kilobase Million) based on mRNA sequencing data. RNA sequencing data for SW982 and A673 were not available and therefore not included.

