Article

Genome-Wide Identification and Characterization of Tyrosine Kinases in the Silkworm, Bombyx mori

State Key Laboratory of Silkworm Genome Biology, Key Laboratory of Sericultural Biology and Genetic Breeding, Ministry of Agriculture, Southwest University, Chongqing 400715, China
*
Author to whom correspondence should be addressed.
Int. J. Mol. Sci. 2018, 19(4), 934; https://doi.org/10.3390/ijms19040934
Submission received: 7 March 2018 / Revised: 16 March 2018 / Accepted: 20 March 2018 / Published: 21 March 2018
(This article belongs to the Special Issue Molecular Entomology of Insects of Economic Importance)

Abstract

:
The tyrosine kinases (TKs) are important parts of metazoan signaling pathways and play significant roles in cell growth, development, apoptosis and disease. Genome-wide characterization of TKs has been conducted in many metazoans, however, systematic information about this family in Lepidoptera is still lacking. We retrieved 33 TK-encoding genes in silkworm and classified them into 25 subfamilies by sequence analysis, without members in AXL, FRK, PDGFR, STYK1 and TIE subfamilies. Although domain sequences in each subfamily are conserved, TKs in vertebrates tend to be remarkably conserved and stable. Our results of phylogenetic analysis supported the previous conclusion for the second major expansion of TK family. Gene-Ontology (GO) analysis revealed that a higher proportion of BmTKs played roles in binding, catalysis, signal transduction, metabolism, biological regulation and response to stimulus, compared to all silkworm genes annotated in GO. Moreover, the expression profile analysis of BmTKs among multiple tissues and developmental stages demonstrated that many genes exhibited stage-specific and/or sex-related expression during embryogenesis, molting and metamorphosis, and that 8 BmTKs presented tissue-specific high expression. Our study provides systematic description of silkworm tyrosine kinases, and may also provide further insights into metazoan TKs and assist future studies addressing their functions.

1. Introduction

Tyrosine kinases (TKs) are a large and diverse protein superfamily containing canonical catalytic domains. This superfamily is related to serine/threonine kinases, and is capable of regulating multiple cellular pathways [1]. TKs were first identified 39 years ago, and were found to catalyze tyrosine phosphorylation by transferring the γ-phosphate of ATP (adenosine triphosphate) to tyrosine residues on protein substrates [2,3,4,5,6]. According to the presence or absence of trans-membrane domains, TKs are categorized into two major classes, i.e., RTKs (receptor TKs) and CTKs (non-receptor TKs or cytoplasmic TKs). In general, RTKs phosphorylate endo-cellular target proteins in respond to extra-cellular ligands to activate the signal transduction cascades, while CTKs are likely to transmit the intracellular pTyr (phosphotyrosine) signals [7,8]. In addition to the highly conserved TK domains, TK proteins also contain various functional protein domains interacting with other components within signal transduction pathways [9]. Based on kinase domain sequence and protein secondary structure, TKs are generally grouped into 30 subfamilies [10,11].
Compared to many serine/threonine kinases capable of regulating processes of both multi-cellular and unicellular organisms, the functions of TKs primarily involve the regulation of multi-cellular organisms [1,10,12]. TKs mediate the signal transduction events of one of the few signal transduction pathways that are conserved throughout the metazoans [13]. Tyrosine phosphorylation plays vital and ubiquitous roles in multi-cellular biology processes, including tissue differentiation, growth development, immune responses, cell adhesion, motility and apoptosis [9,14,15,16,17,18,19]. Therefore, mutation and malfunction of tyrosine kinase genes result in many diseases such as cancer and diabetes [20,21,22,23]. In history, TKs defined the prototypical class of oncogenes involved in numerous human malignancies [10]. Now, TKs have been considered to be well-verified targets for cancer therapy [24,25]. TK genes are also implicated in congenital disorders such as dwarfism and hereditary lymphedema [15,26,27,28]. At present, TKs have been the subject of a growing number of studies in physiology and pathology, including inflammation, autoimmunity, neuro-degeneration and infectious diseases [24,25].
Physiological effects and in vivo regulatory mechanisms of TKs have been interesting topics of research in recent years [29,30]. After years of research, TKs have been characterized in masses of species, and genome-wide systematic identification and characterization of this protein superfamily has also been conducted in many metazoans, including humans, amphioxus, zebra-fish and green anole lizard [10,11,31,32,33], providing numerous important insights into the structure, function, and regulation of TKs. Some important progress has also been made in the study of silkworm TKs recently [34,35]. However, the systematic information on TK protein superfamily in the Lepidoptera is still lacking.
The silkworm (Bombyx mori) is an economically important lepidopteran insect, and has also been considered as a model organism for physiology, microbiology, genetics and functional genomics analysis [36]. In this study, we systematically identified and characterized the silkworm TK genes, performed phylogenetic analyses in metazoans, and analyzed their spatial/temporal expression patterns. This article provides the first comprehensive resource of silkworm TKs. The systematic identification, naming, orthology and expression analysis of TKs encoded in the silkworm genome would facilitate an understanding of the physiological and developmental function of silkworm TKs. Our findings may also provide insights into metazoan TK genes and would aid future studies on their functions.

2. Results and Discussion

2.1. Identification of Silkworm TK Proteins

To identify TK proteins in silkworm, the HMMER3.0 package (Available online: http://hmmer.org/) [37] was applied to search in the silkworm protein dataset using the hidden Markov model profile for the TK domain (PF07714). Redundant sequences were manually removed. The presence of TK domains was verified by SMART (Simple Modular Architecture Research Tool, Available online: http://smart.embl-heidelberg.de/) and CDD (Conserved Domain Database, Available online: http://www.ncbi.nlm.nih.gov/Structure/cdd/wrpsb.cgi) search-based online domain analysis. As a result, a total of 33 non-redundant silkworm TK proteins (BmTKs) were retrieved, among that 19 are classified as RTKs and 14 are grouped as CTKs.
Generally, TKs are categorized into 30 subfamilies [10,11,33]. The multiformity of TKs is likely to imply the complicacy of the pTyr-based signaling system [38]. Based on sequence similarity and protein secondary structure, we clustered BmTKs into 25 subfamilies (Table 1), while no members fell into AXL, FRK, PDGFR, STYK1 and TIE subfamilies, which are almost absent in lower metazoans [11]. A total of 6 in these 25 subfamilies have multiple members (2 members in ACK, EPH, RYK and SRC1 subfamilies, 3 members in FGFR and INSR subfamilies, respectively).
In silico analysis showed that the lengths of BmTKs ranged from 184 residues to 3012 residues. The molecular weights ranged from 20.47 kDa to 332.25 kDa. Isoelectric points varied from 4.41 to 8.69 (Table 1). We also investigated gene structures and found that the intron sequences within the ORF (open reading frame) of the BmTK genes varied greatly and that the shortest BmTK gene (BmMET) was only ~2.2 kb (kilo-base), while the longest one was BmFGFR1 with a ~106.3 kb genomic sequence (Table S1). The other detailed information of these genes, including gene and protein ID, sequences, chromosome location and corresponding human gene name and protein accession No., is summarized in Table S1.

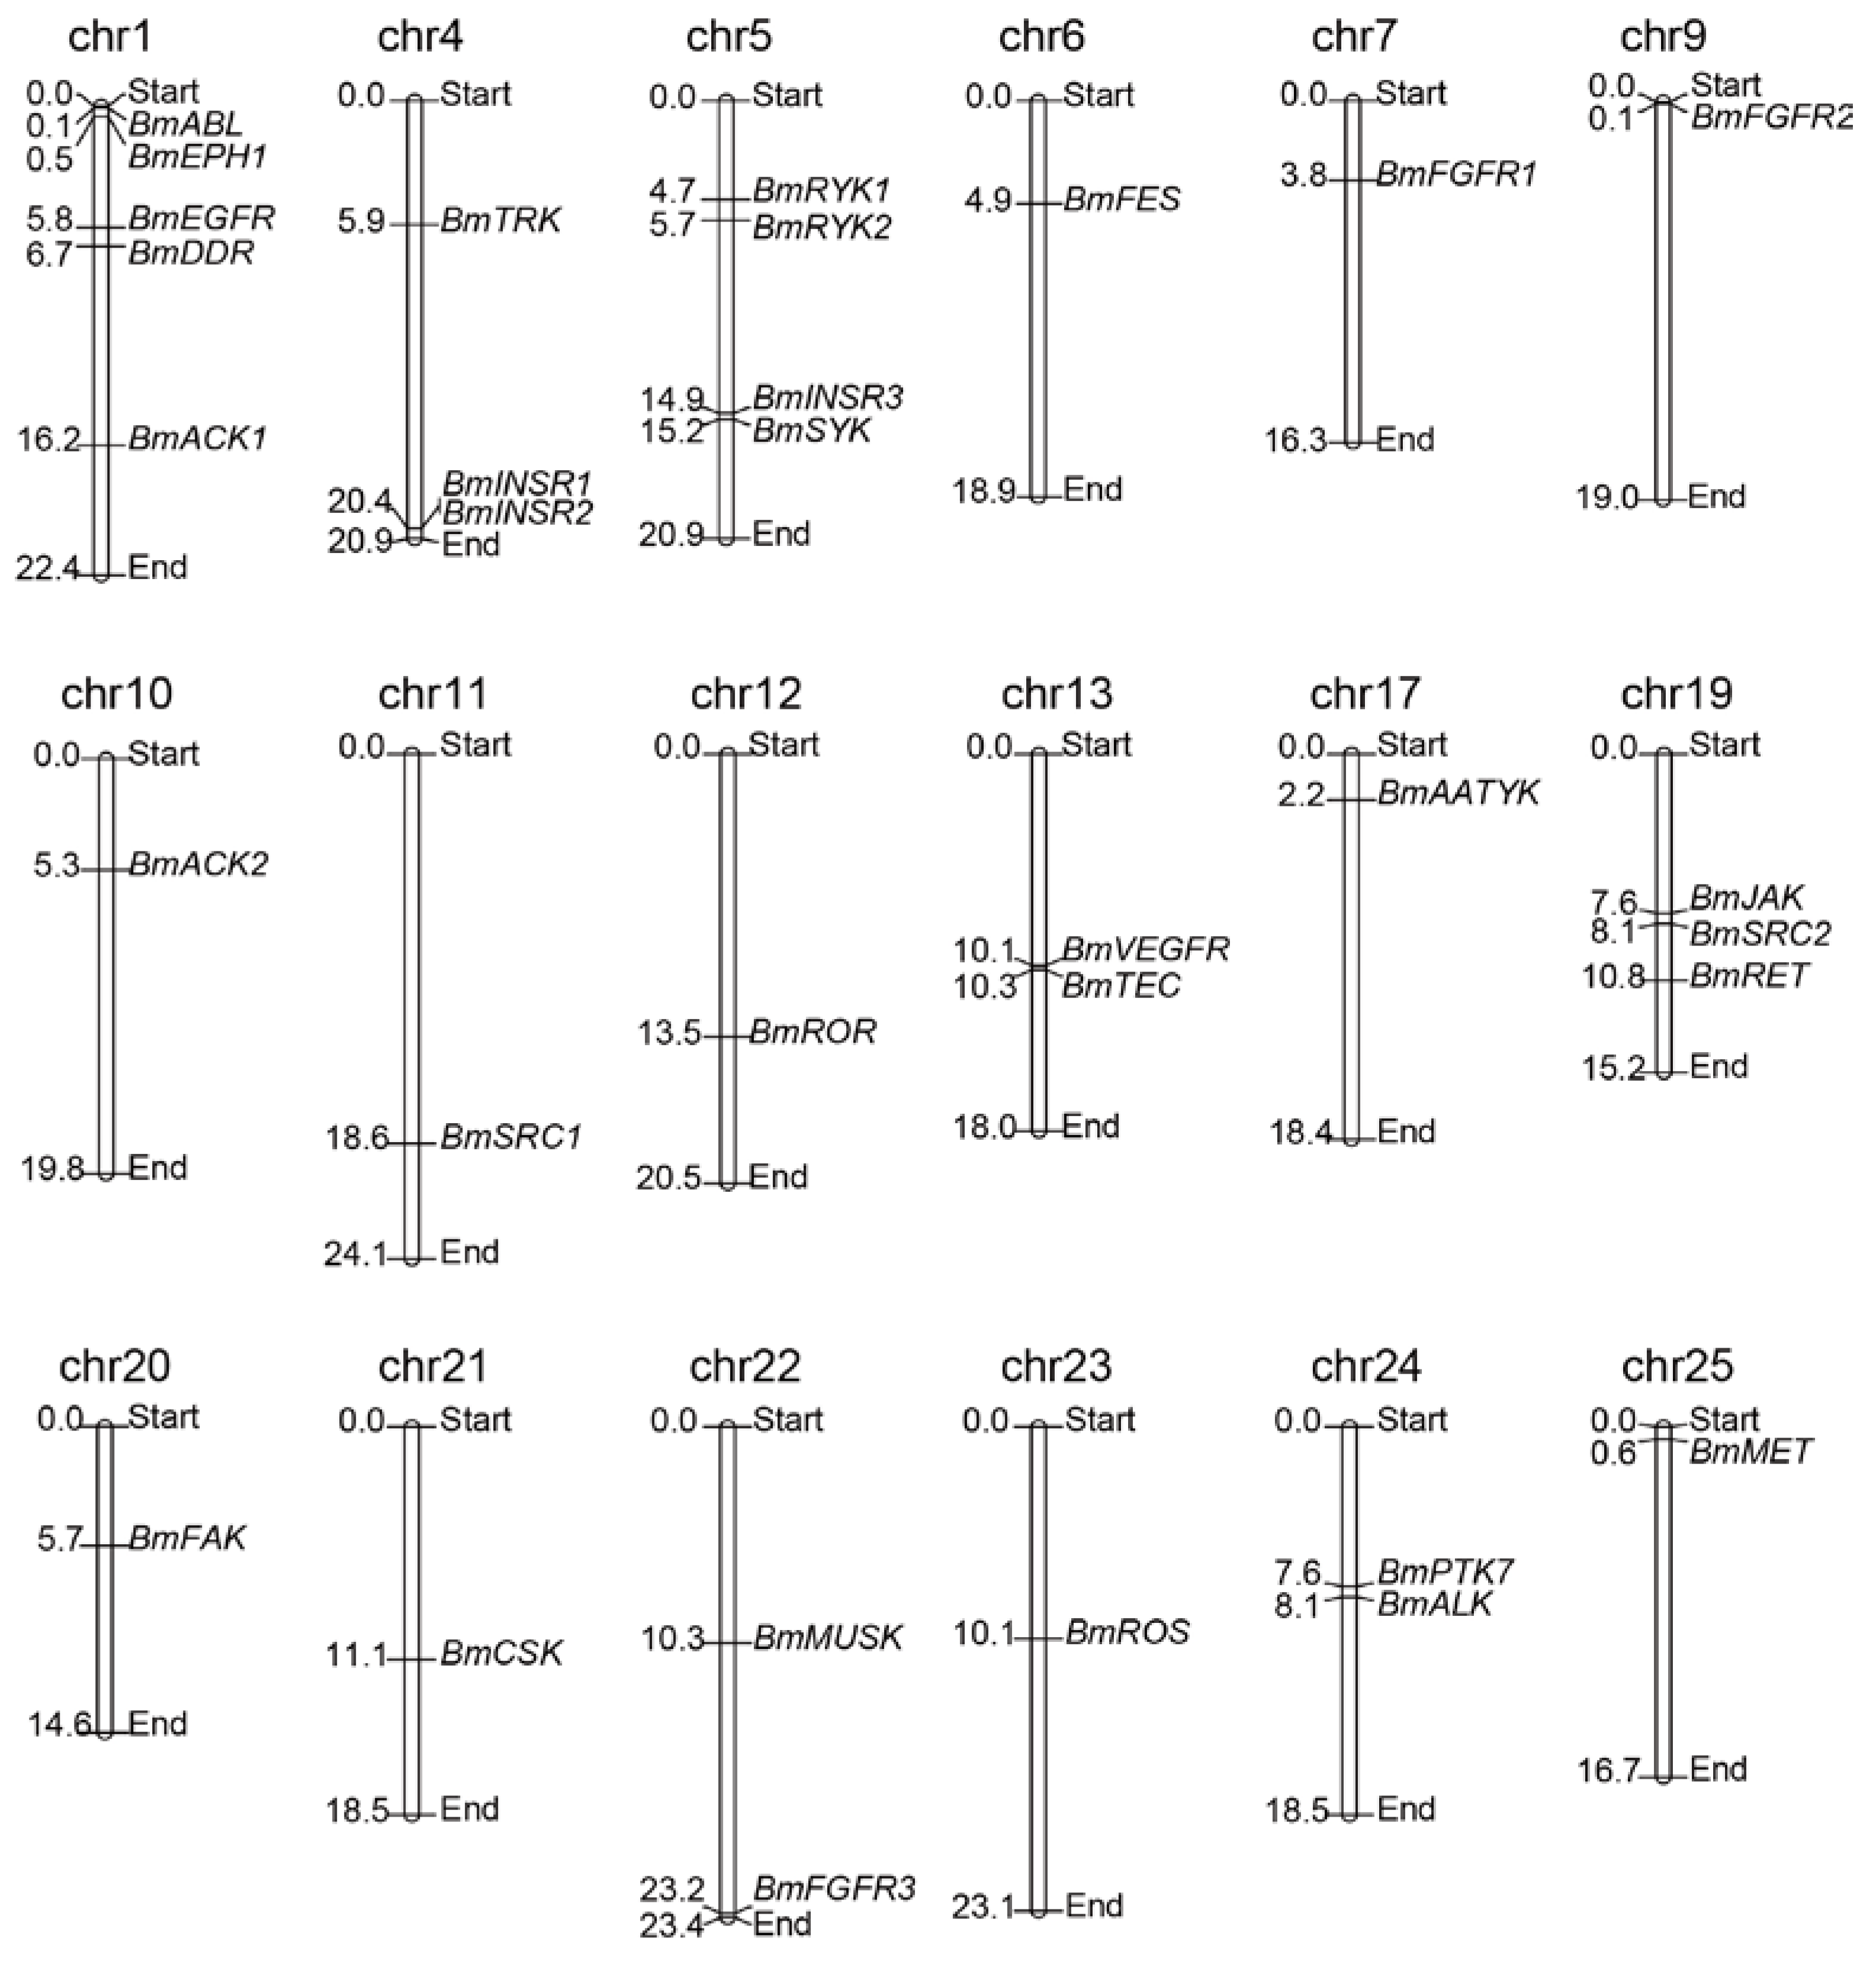
2.2. Chromosomal Distribution of the BmTK Gene Family

To determine the distribution and contexts of the BmTK genes on silkworm chromosomes, the TK genes were mapped on chromosomes according to their chromosomal coordinates from the silkworm genome database (Available online: http://sgp.dna.affrc.go.jp/KAIKObase/). Chromosomal distribution analysis showed that 32 BmTKs are assigned to 18 of the 28 silkworm chromosomes (Figure 1, Table 1 and Table S1), while the other one (BmEPH2) does not have location information on chromosomes. The distribution of BmTK genes is widespread and scattered on the chromosomes. 11 chromosomes respectively have only one BmTK gene, chromosome 1 has the largest number of BmTK genes (5 genes), followed by chromosomes 5 (4 genes), chromosomes 4 and 19 respectively have 3 BmTK genes, and 2 BmTK genes are on chromosomes 13, 22 and 24, respectively (Figure 1). No TK genes closely arrange in tandem (without other genes interrupted between them) on chromosomes, only BmINSR1 and BmINSR2 located tandemly on chromosomes but with one other genes between them, that is different from the cases in higher animals which have been systematically studied [10,11,33]. Genome duplication events are thought to contribute in the expansion of gene families [39,40]. It was reported that a large number of TK genes of higher metazoans likely originated from whole genome duplication events [10,11,19,32,33], and many TK genes arranging in tandem may be retained following these events. In contrast, there is no evidence of whole genome duplication events in the silkworm, and given the much less number of TK genes compared with the higher metazoans, it is not hard to understand the absent of the case of closely tandem arrangement of BmTK genes.

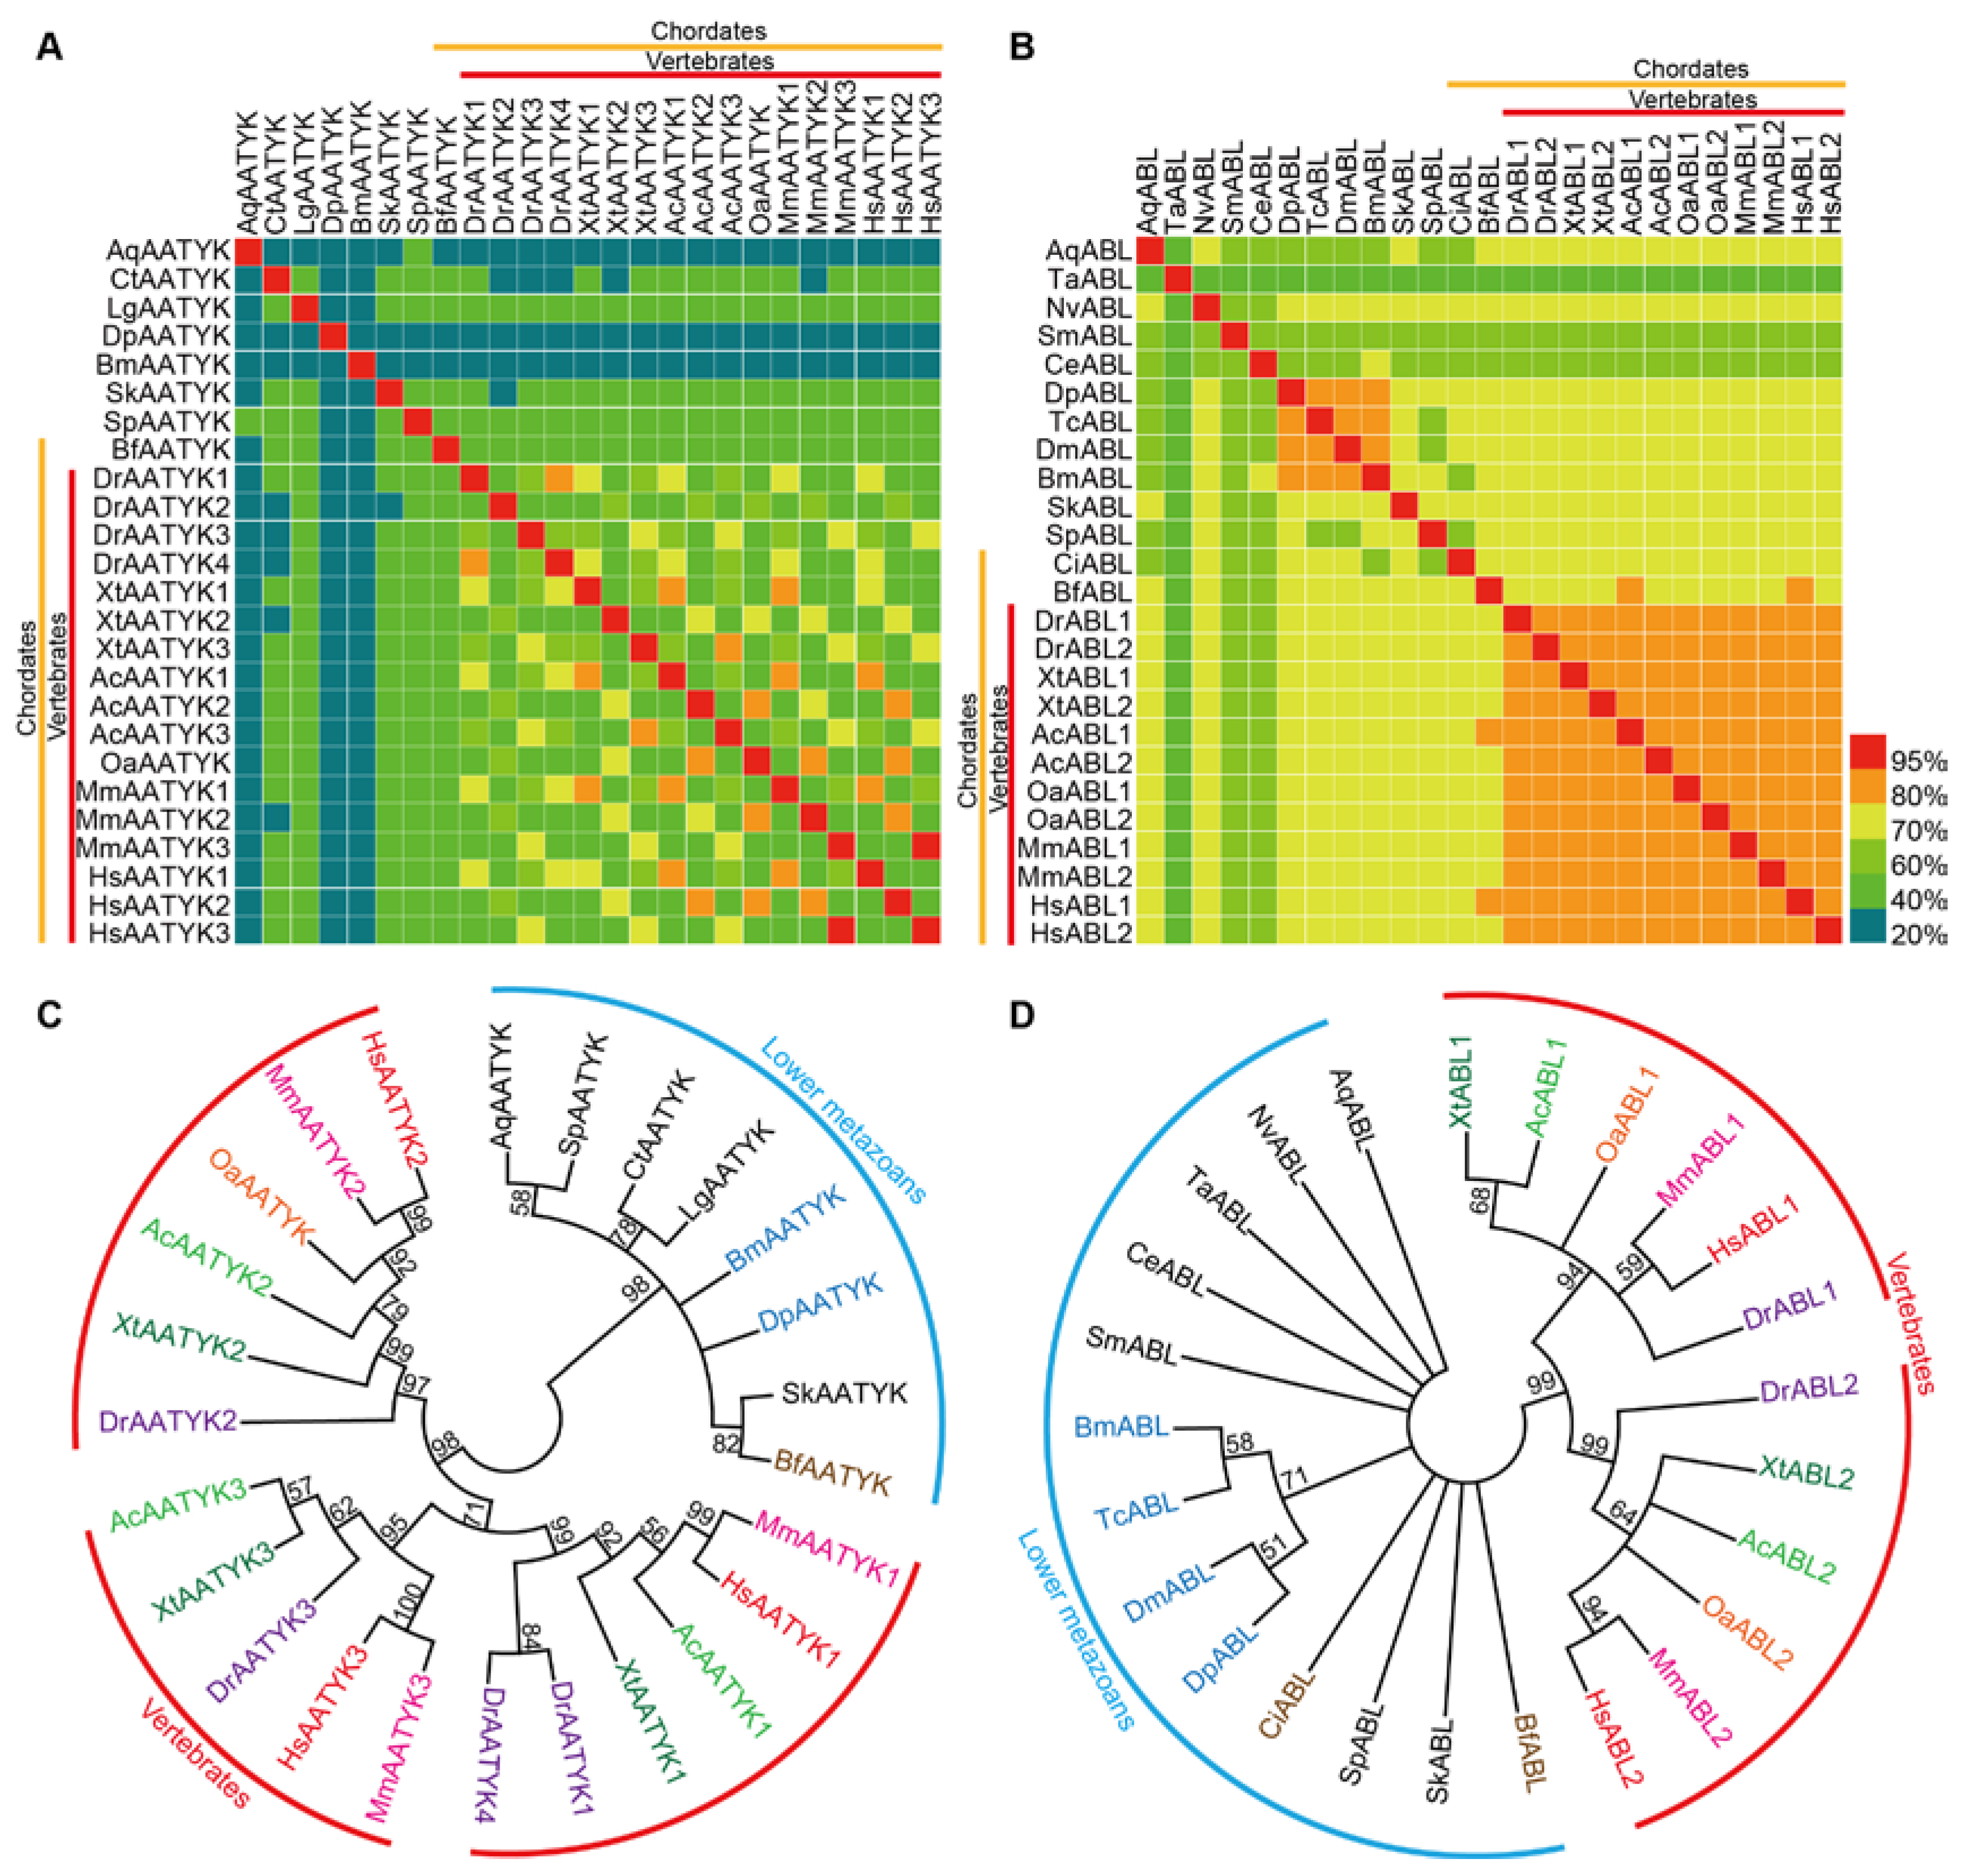
2.3. Comparative Analysis of TKs within Metazoans

To investigate and evaluate the orthologous relationships of TKs, orthology analysis was performed, and a list of orthologous genes between silkworm and humans as well as the protein sequence identities of kinase domains is shown in Table 2. Despite the vast difference between silkworm and humans, the average of sequence identity between their orthologous TK domains is 52%, and the highest sequence identity is actually as high as 77% (ABL) while the lowest sequence identity is 29% (AATYK), suggesting that the TK domain sequences are generally highly conserved and that the degree of variation among TK domain sequences of different subfamilies varies greatly.
Like many other multi-gene families, the TK family shows differential expansion and it was proposed that there are two major expansions in this gene family. The first expansion seems to have occurred before the segregation between the poriferans and the other metazoans, the second occurred around the split between the cyclostomes and the gnathostomes [41,42,43]. It was found that different TK subfamilies differ significantly in sequence conservation (Table 2).
To study phylogenetic relationships of TK subfamilies with different sequence conservation, we performed sequence identity analysis and phylogenetic analysis for ABLs and AATYKs (subfamilies with the highest and the lowest sequence identities in our analysis above, respectively) in silkworm and 20 other representative metazoan species (Table S2), respectively. Based on sequence identity values and sequences of TK domains, matrices and ML (maximum likelihood) trees were constructed (Figure 2).
Similar to the identity values between silkworm and humans, among all species used for analysis (some species do not have the ABL or AATYK), the sequence identity values of TK-domains in AATYK are relatively low (mean ~51.6%), while the sequence identity values of ABL TK-domains are quite high (mean ~75.2%). Higher sequence identity values are present among the higher chordates (i.e., vertebrates) (Figure 2A,B), indicating that TKs in vertebrates tend to be remarkably conserved and stable. In each of the ML trees, the higher metazoans were clustered into a major clade, and divided into sub-clades for different gene copies of the subfamily, while the lower animals clustered together (Figure 2C,D). Interestingly, two chordates, i.e., Bf (Branchiostoma floridae; Cyclostome, Cephalochordata, Leptocardii) and Ci (Ciona intestinalis; Cyclostome, Urochordata, Ascidiacea), have the same gene copy numbers as lower animals, and were clustered with lower animals rather than with other higher chordates (vertebrates). This is similar to the case in the matrices that there are almost no high identity values between Bf/Ci and vertebrates (Figure 2A,B). These results reveal that the TK domains (at least in AATYKs and ABLs) of invertebrate chordates are more closely similar to lower animals, and suggest that there are expansion and sequence variation events in TK family of vertebrates after segregating from the other metazoans, which are around the period of split between the cyclostomes and the gnathostomes. This supports the previous conclusion [41,42] of the time for the second major expansion of the TK family.

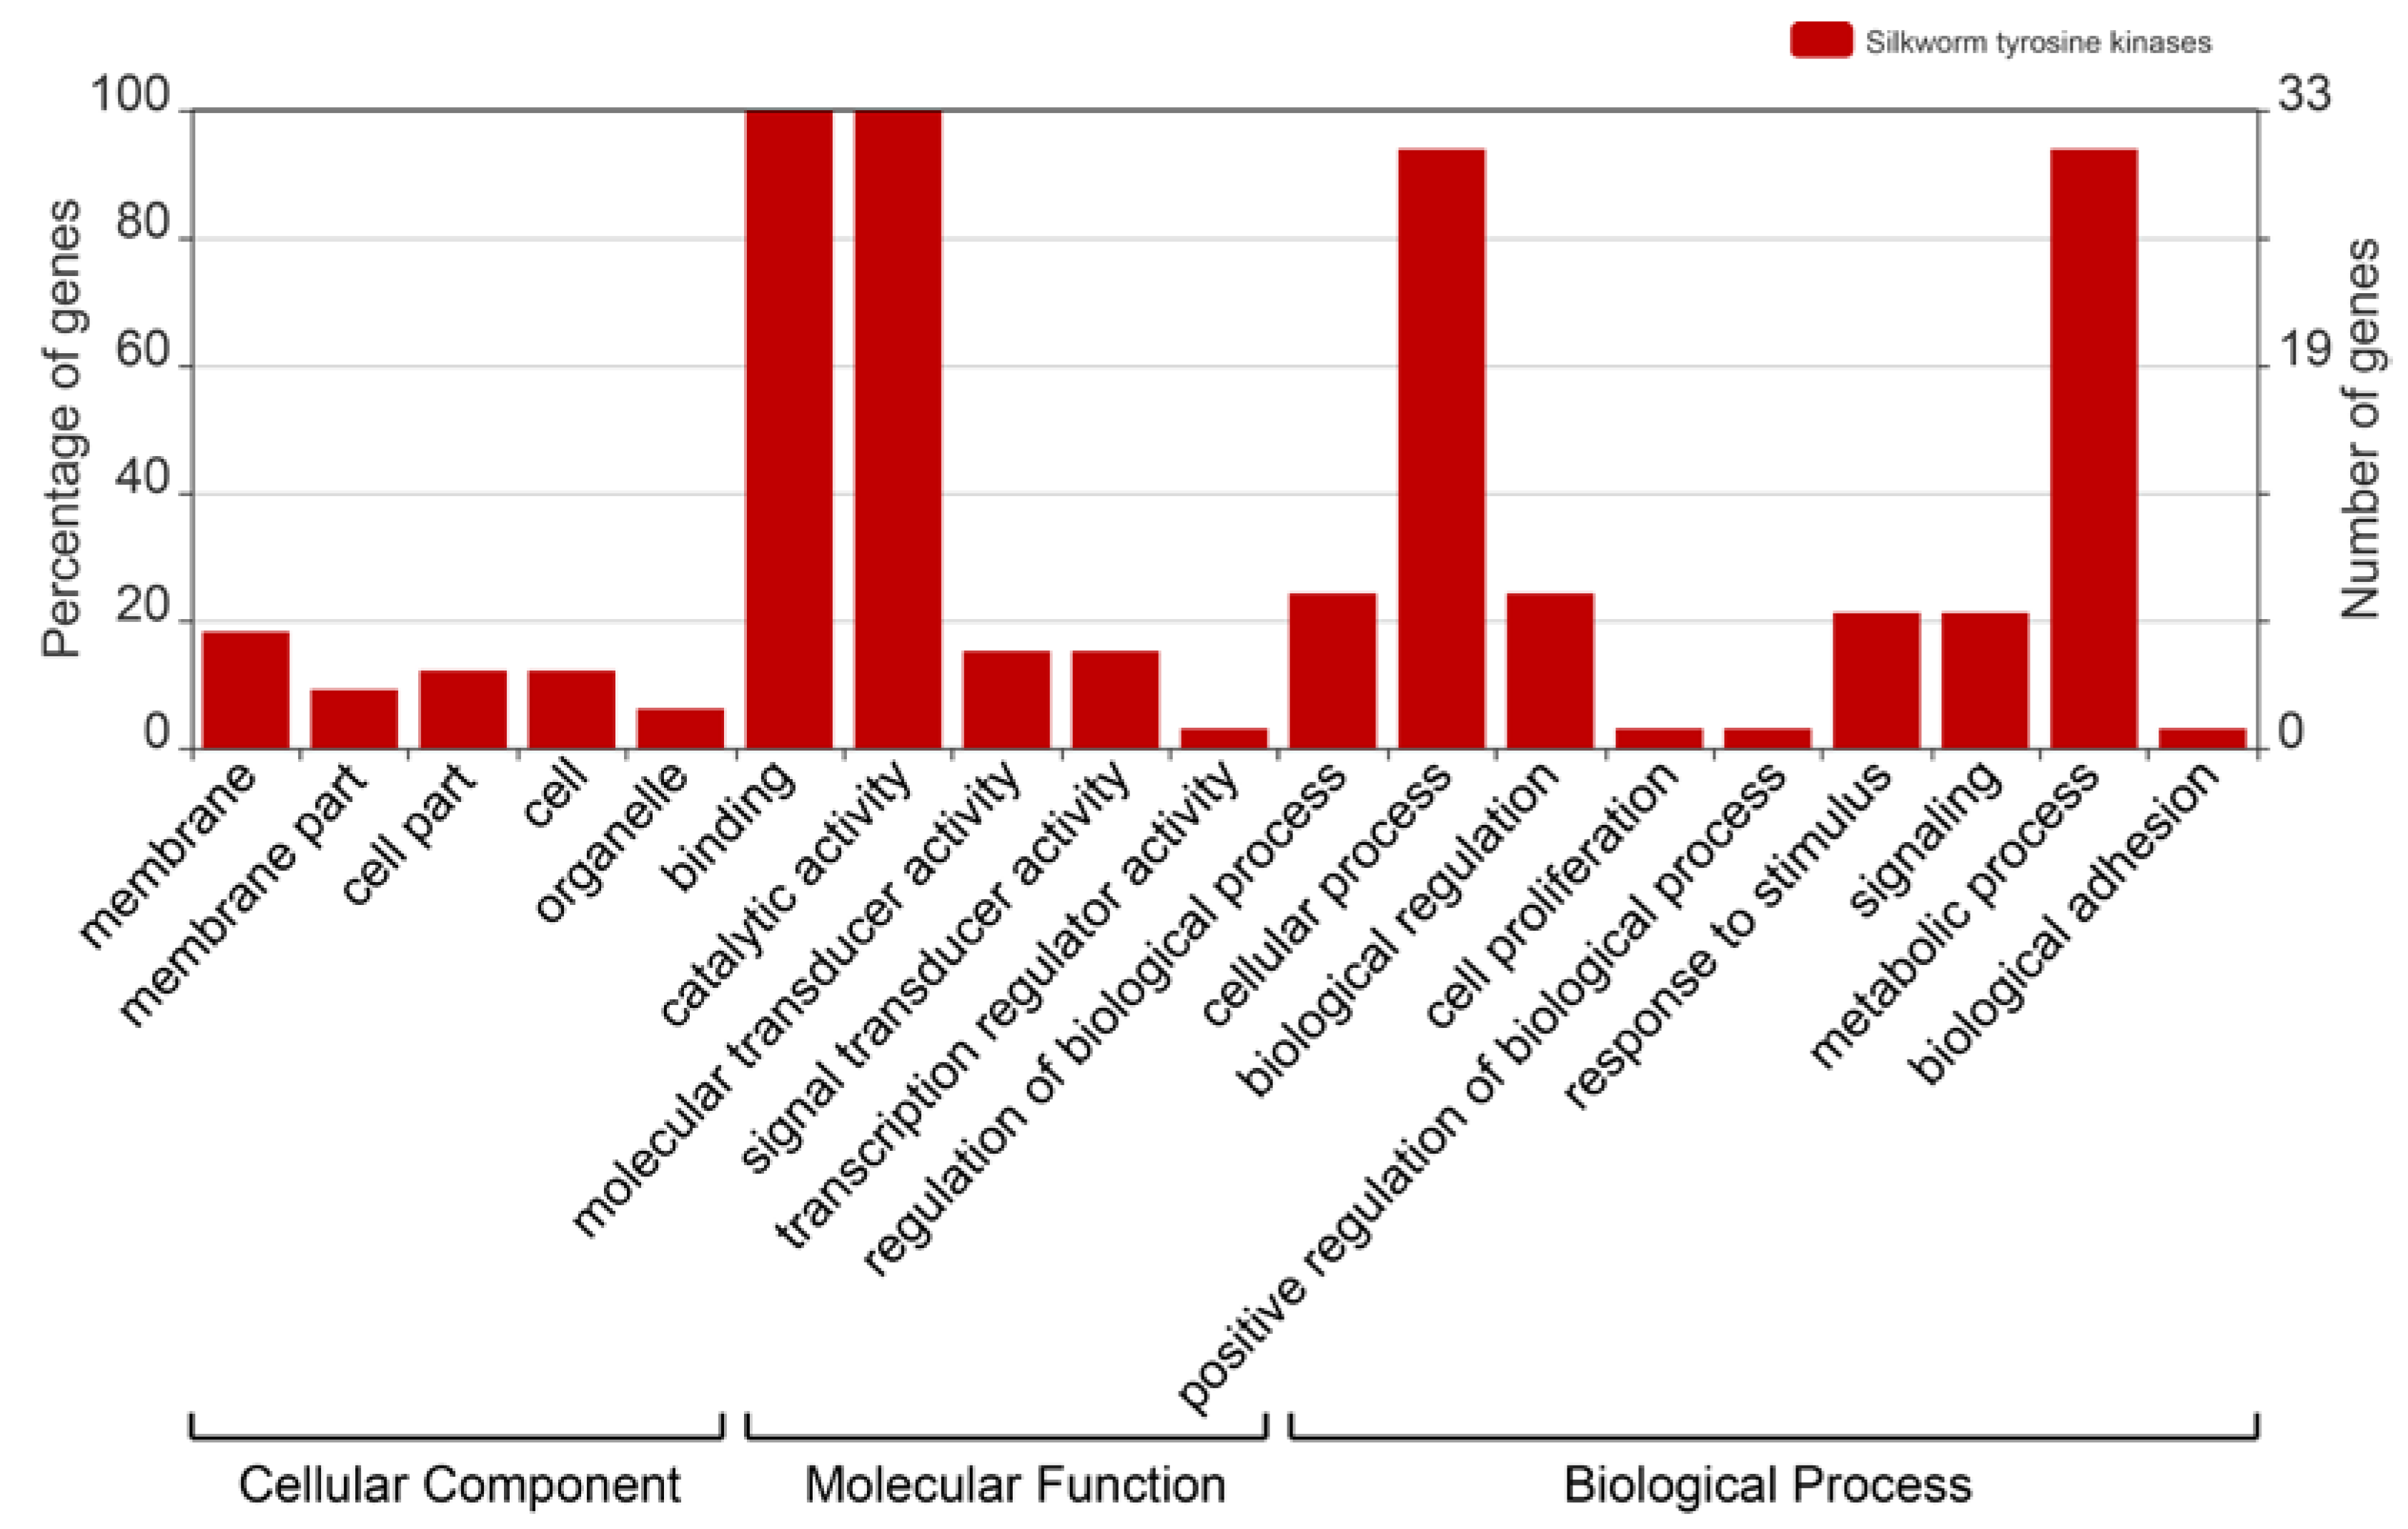
2.4. Gene Ontology Analysis of the BmTKs

To survey the functions of the BmTKs, GO (Gene Ontology) annotation was obtained from two silkworm genome databases (Available online: http://sgp.dna.affrc.go.jp/KAIKObase/ and Available online: http://www.silkdb.org) to construct GO graphs. As shown in the GO graph, all BmTKs (33, 100%) are involved in catalytic activity and binding (Figure 3, Table S3), that are consistent with the primary protein functions. The results also showed that the BmTKs were involved in diverse biological processes and predominantly participated in metabolic process and cellular process (31, ~93.9%) (Figure 3, Table S3). Compared to a wide range of genes with GO annotations, a higher proportion of BmTK genes played roles in catalytic activity, binding, signal transducer activity, molecular transducer activity, metabolic process, biological regulation, response to stimulus and so on (Figure S1).

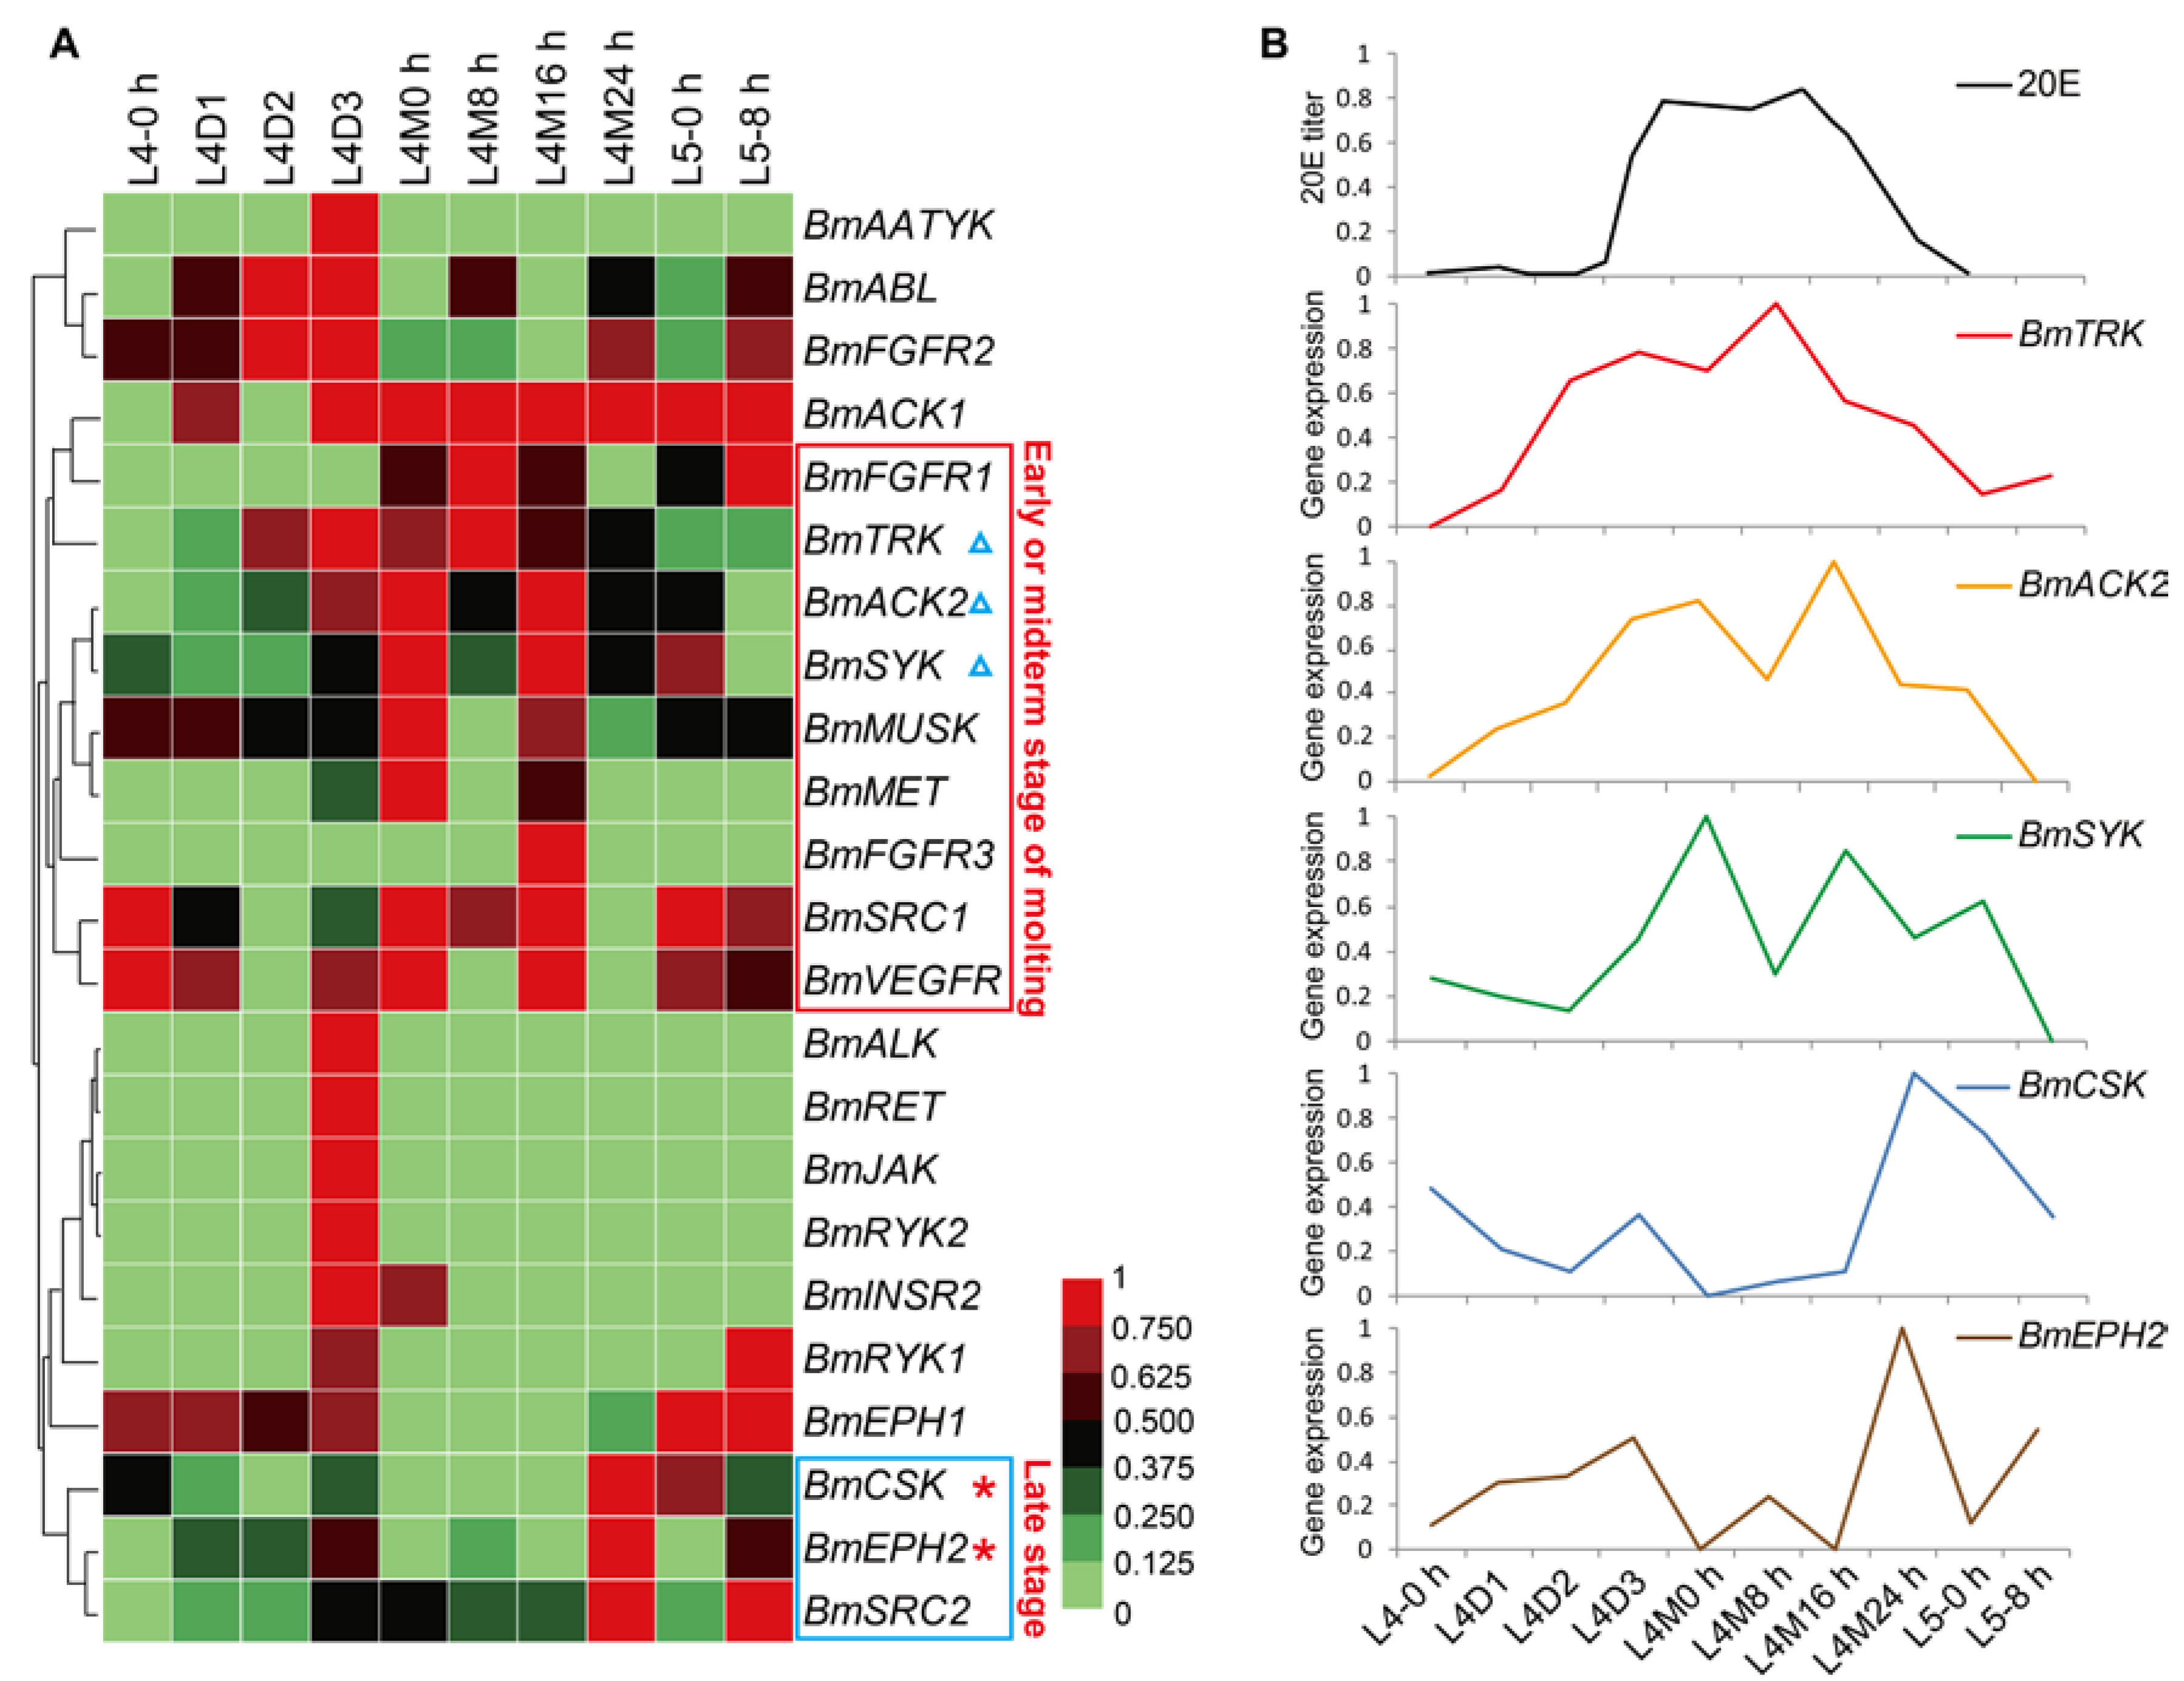
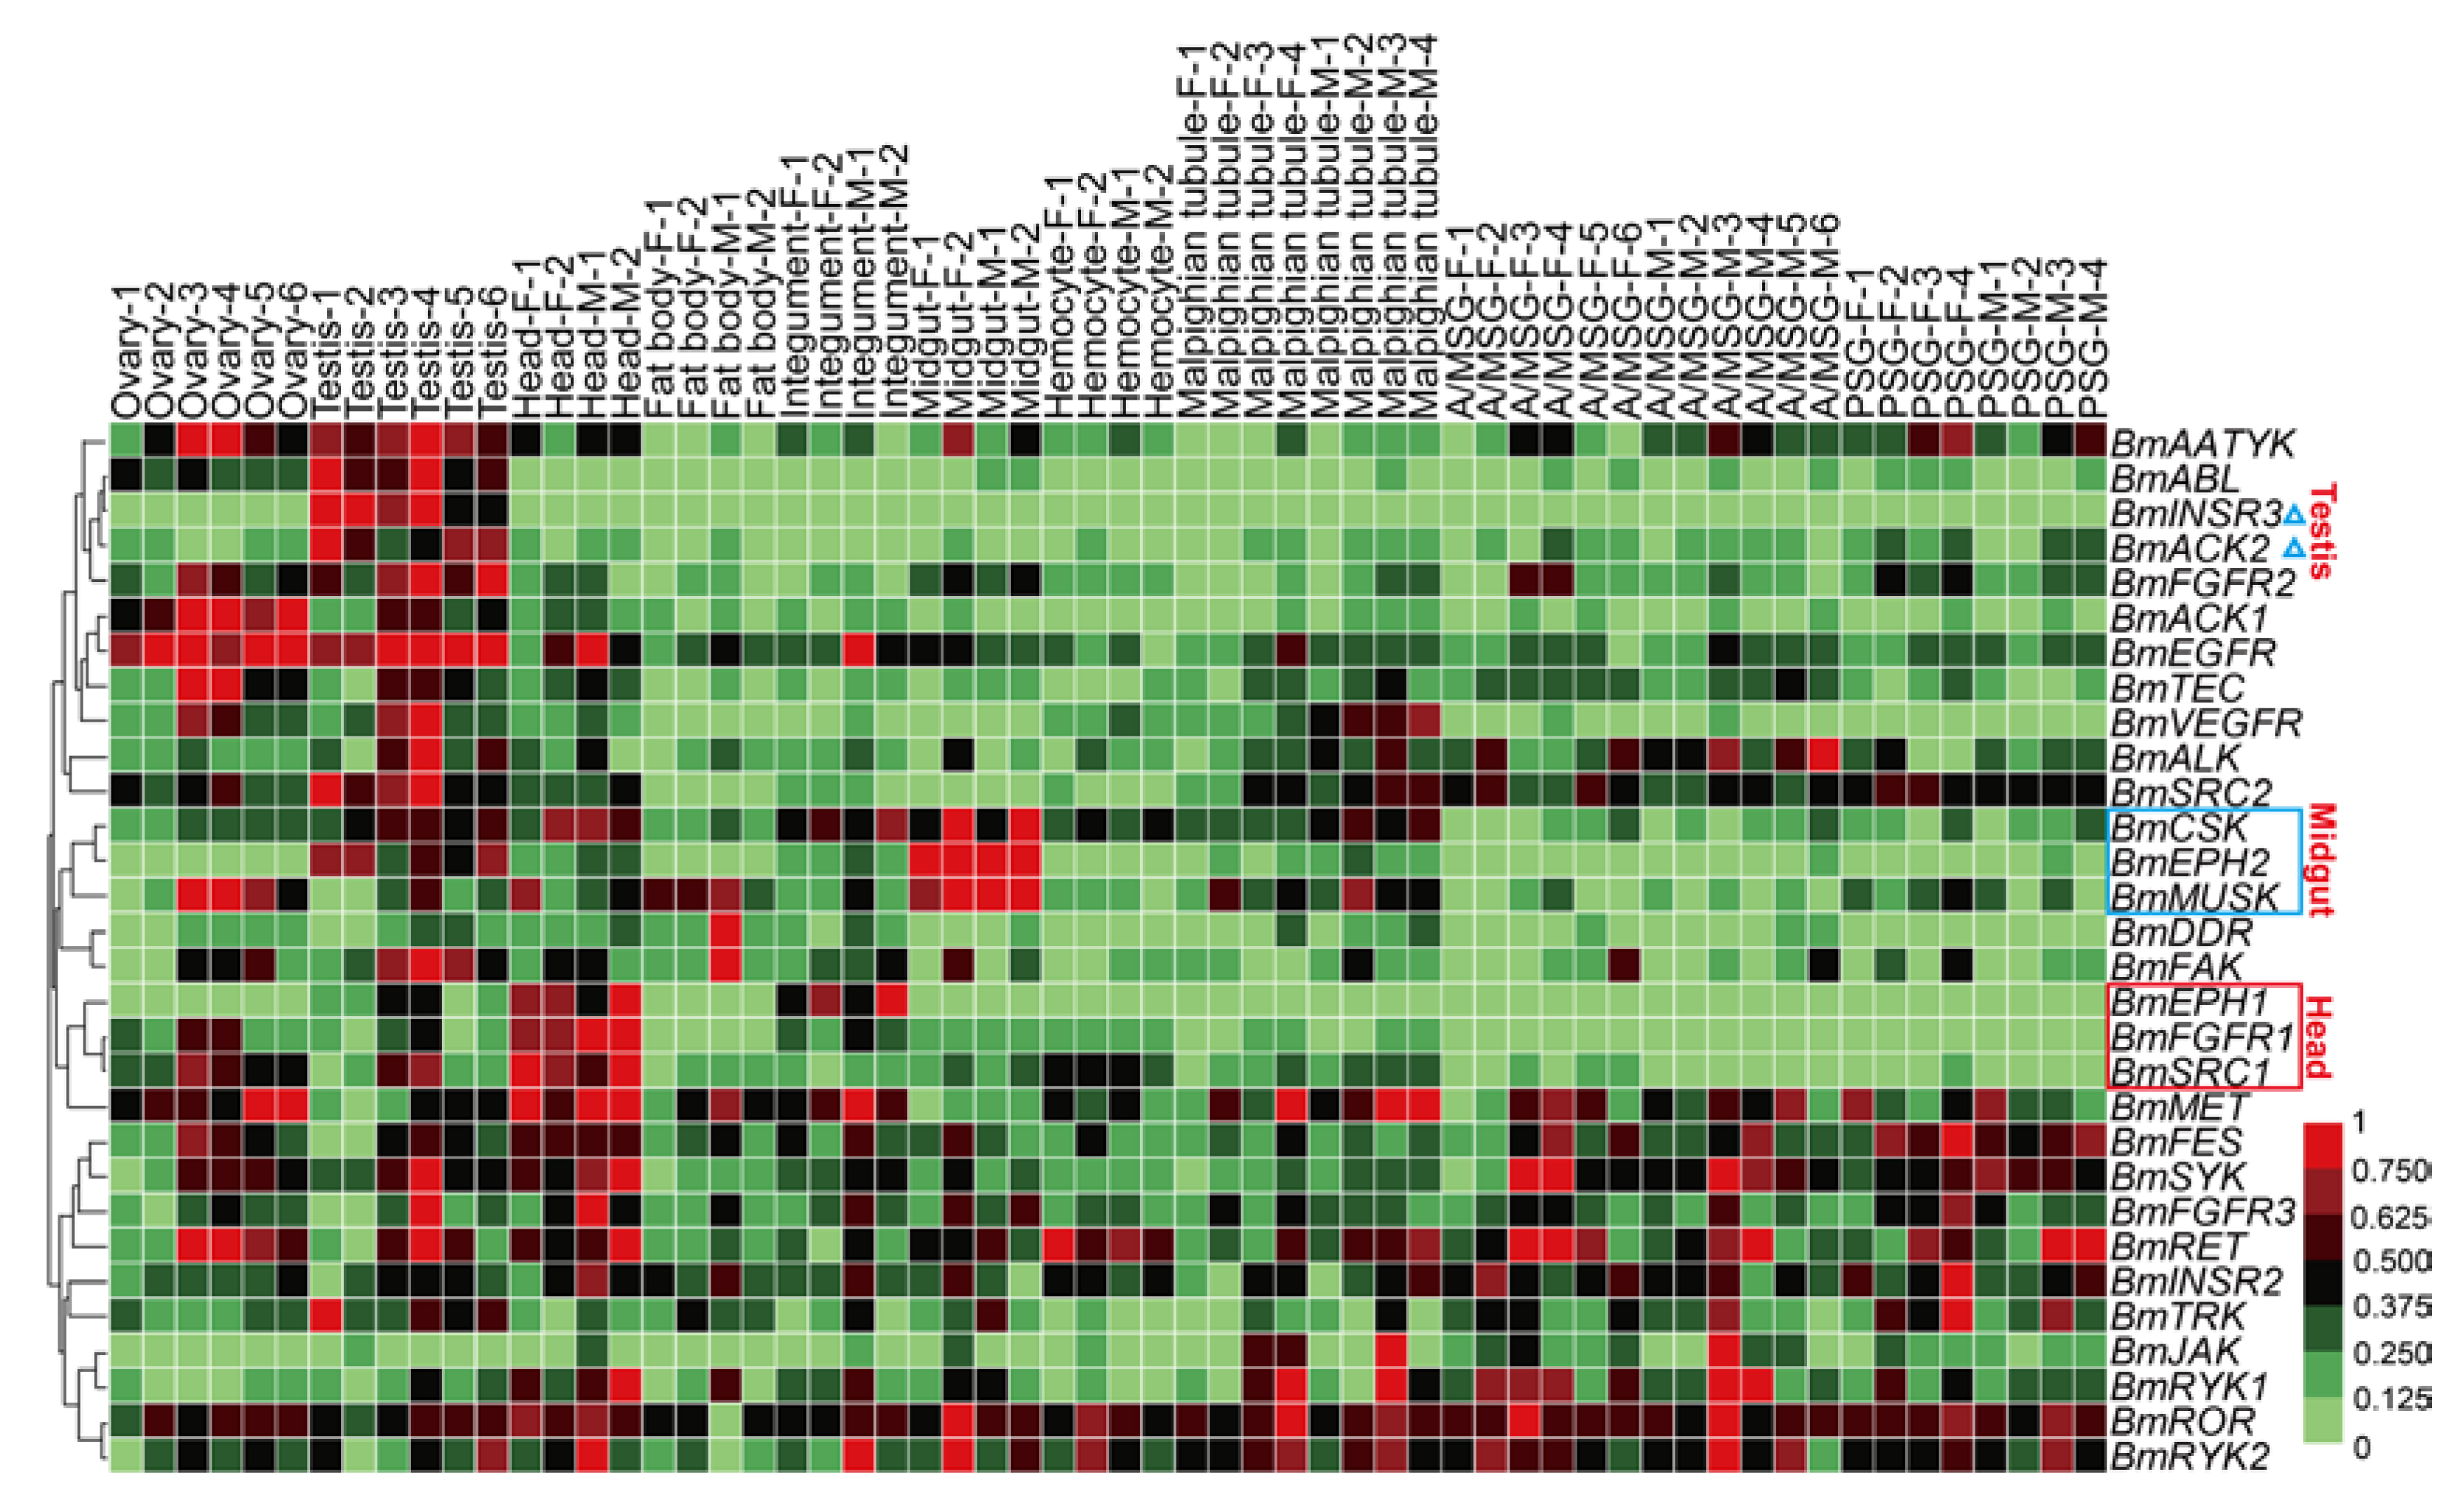
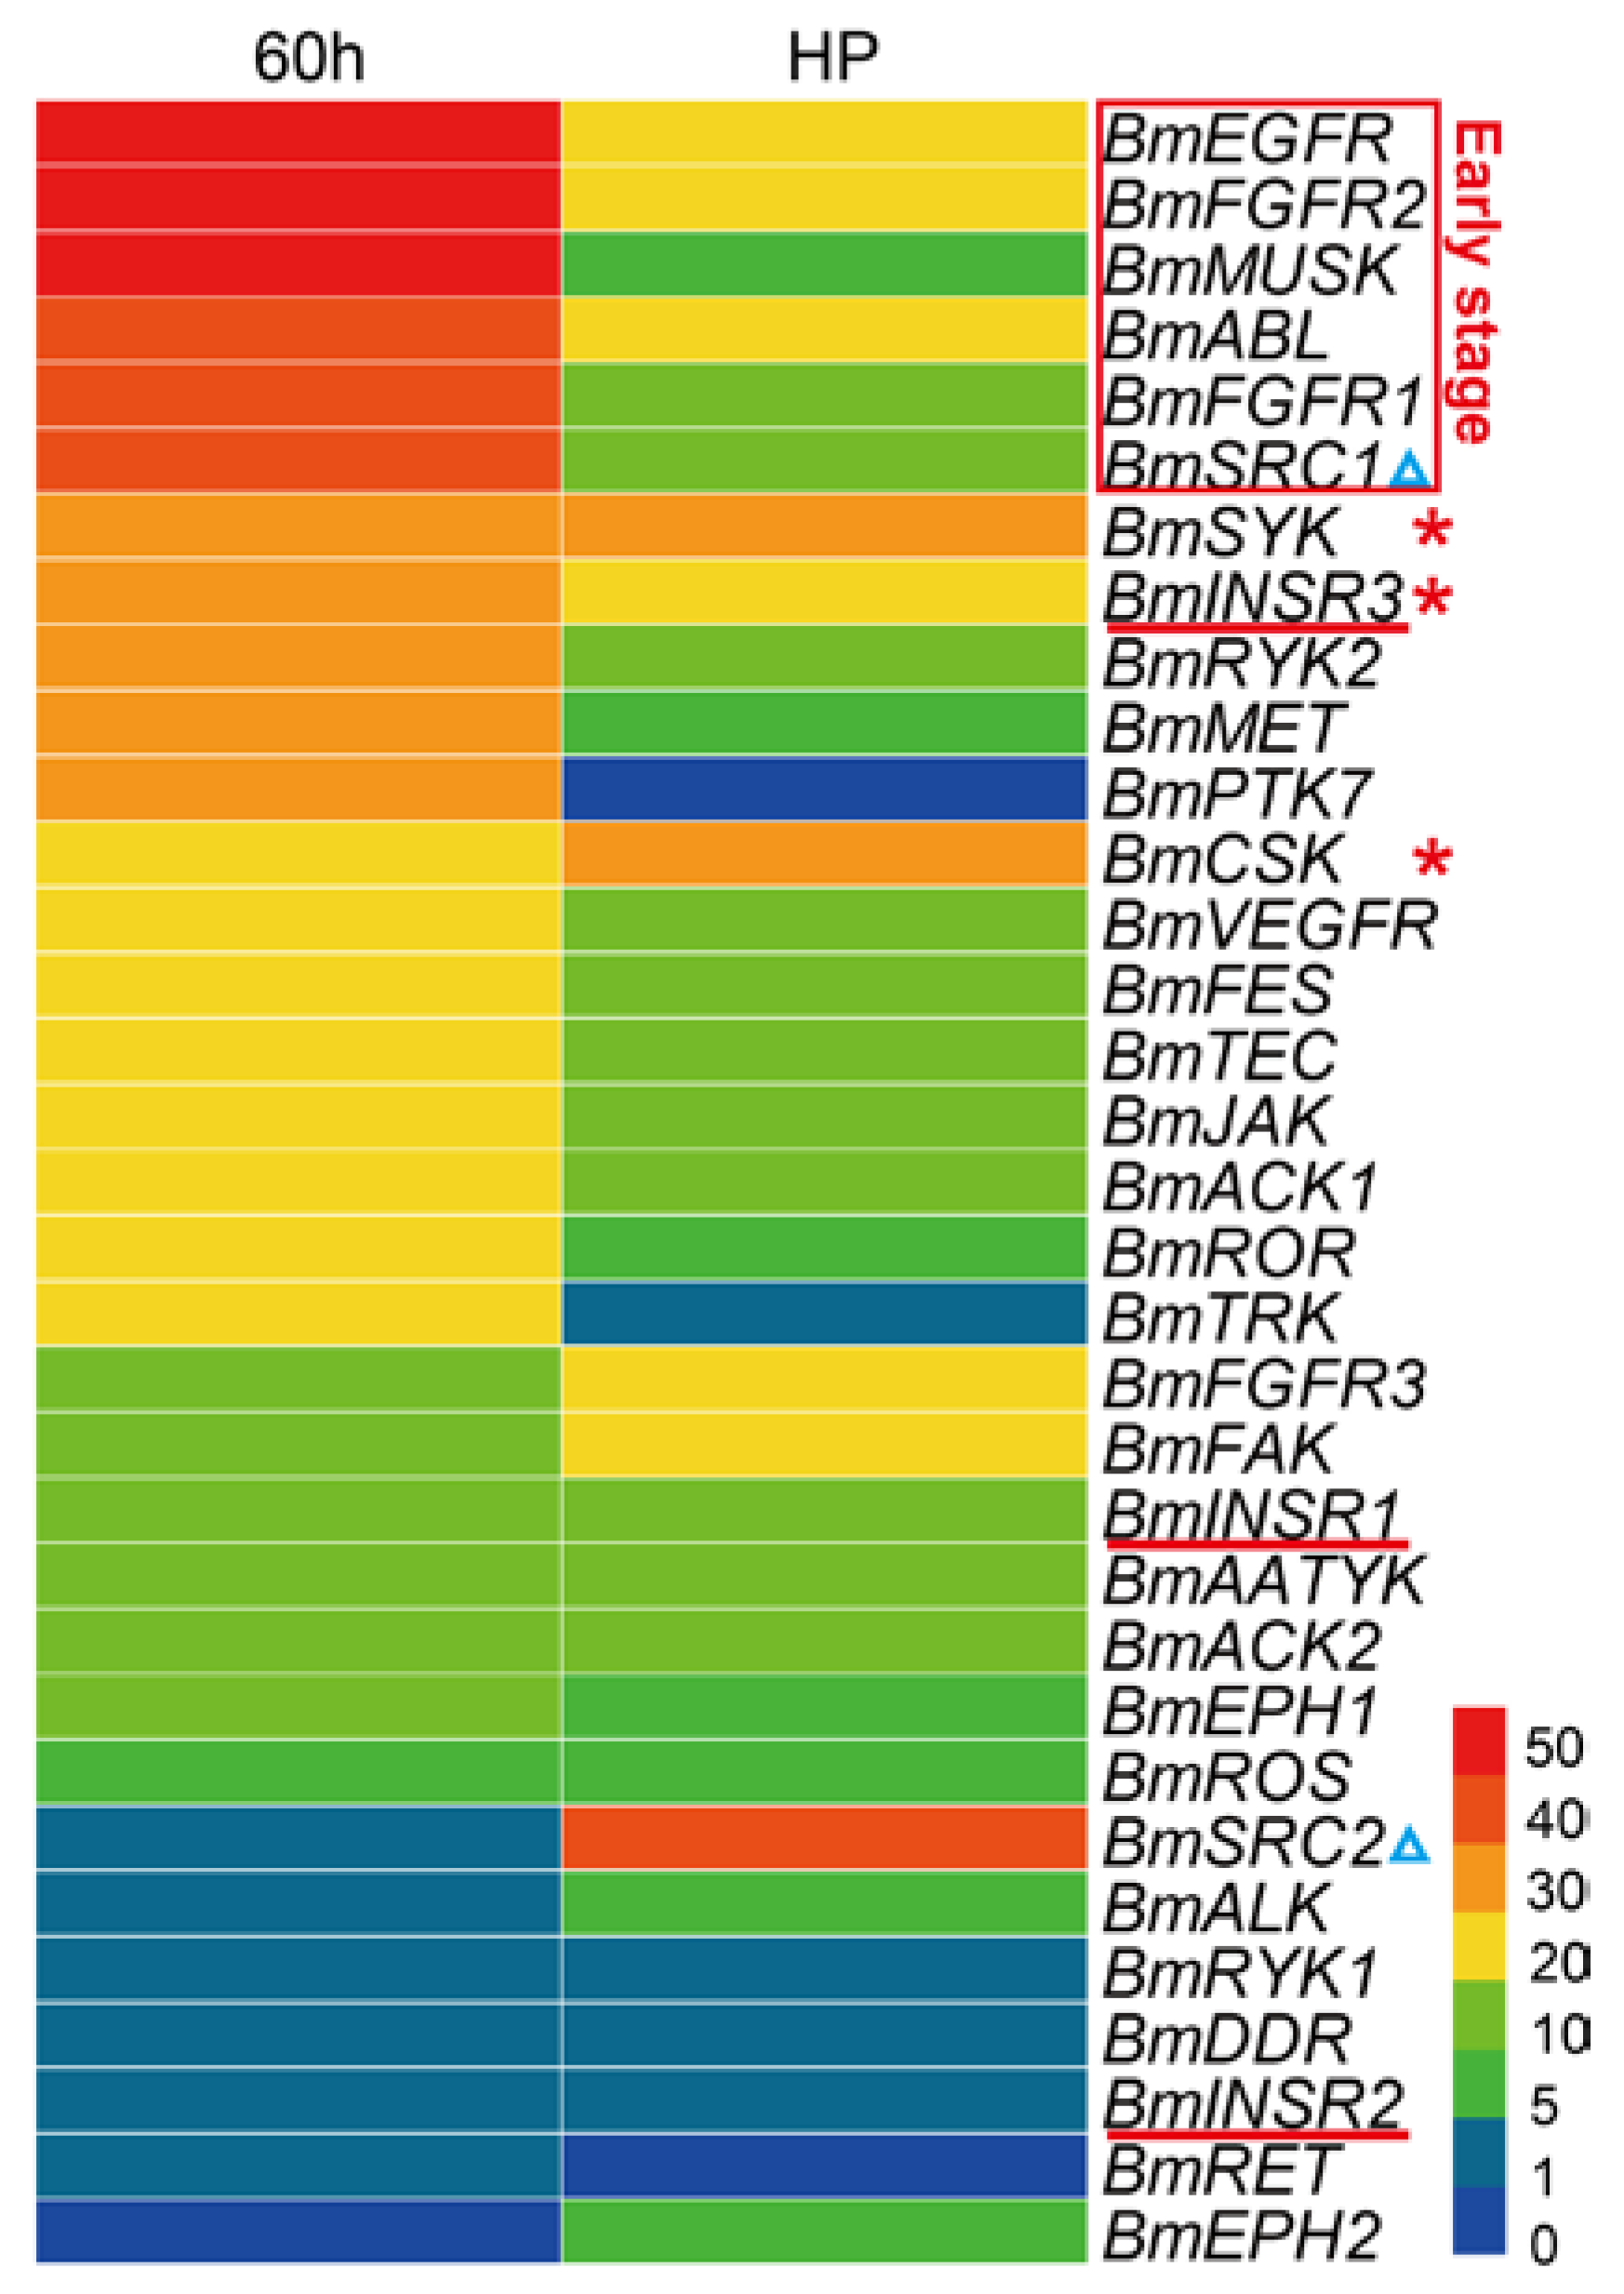
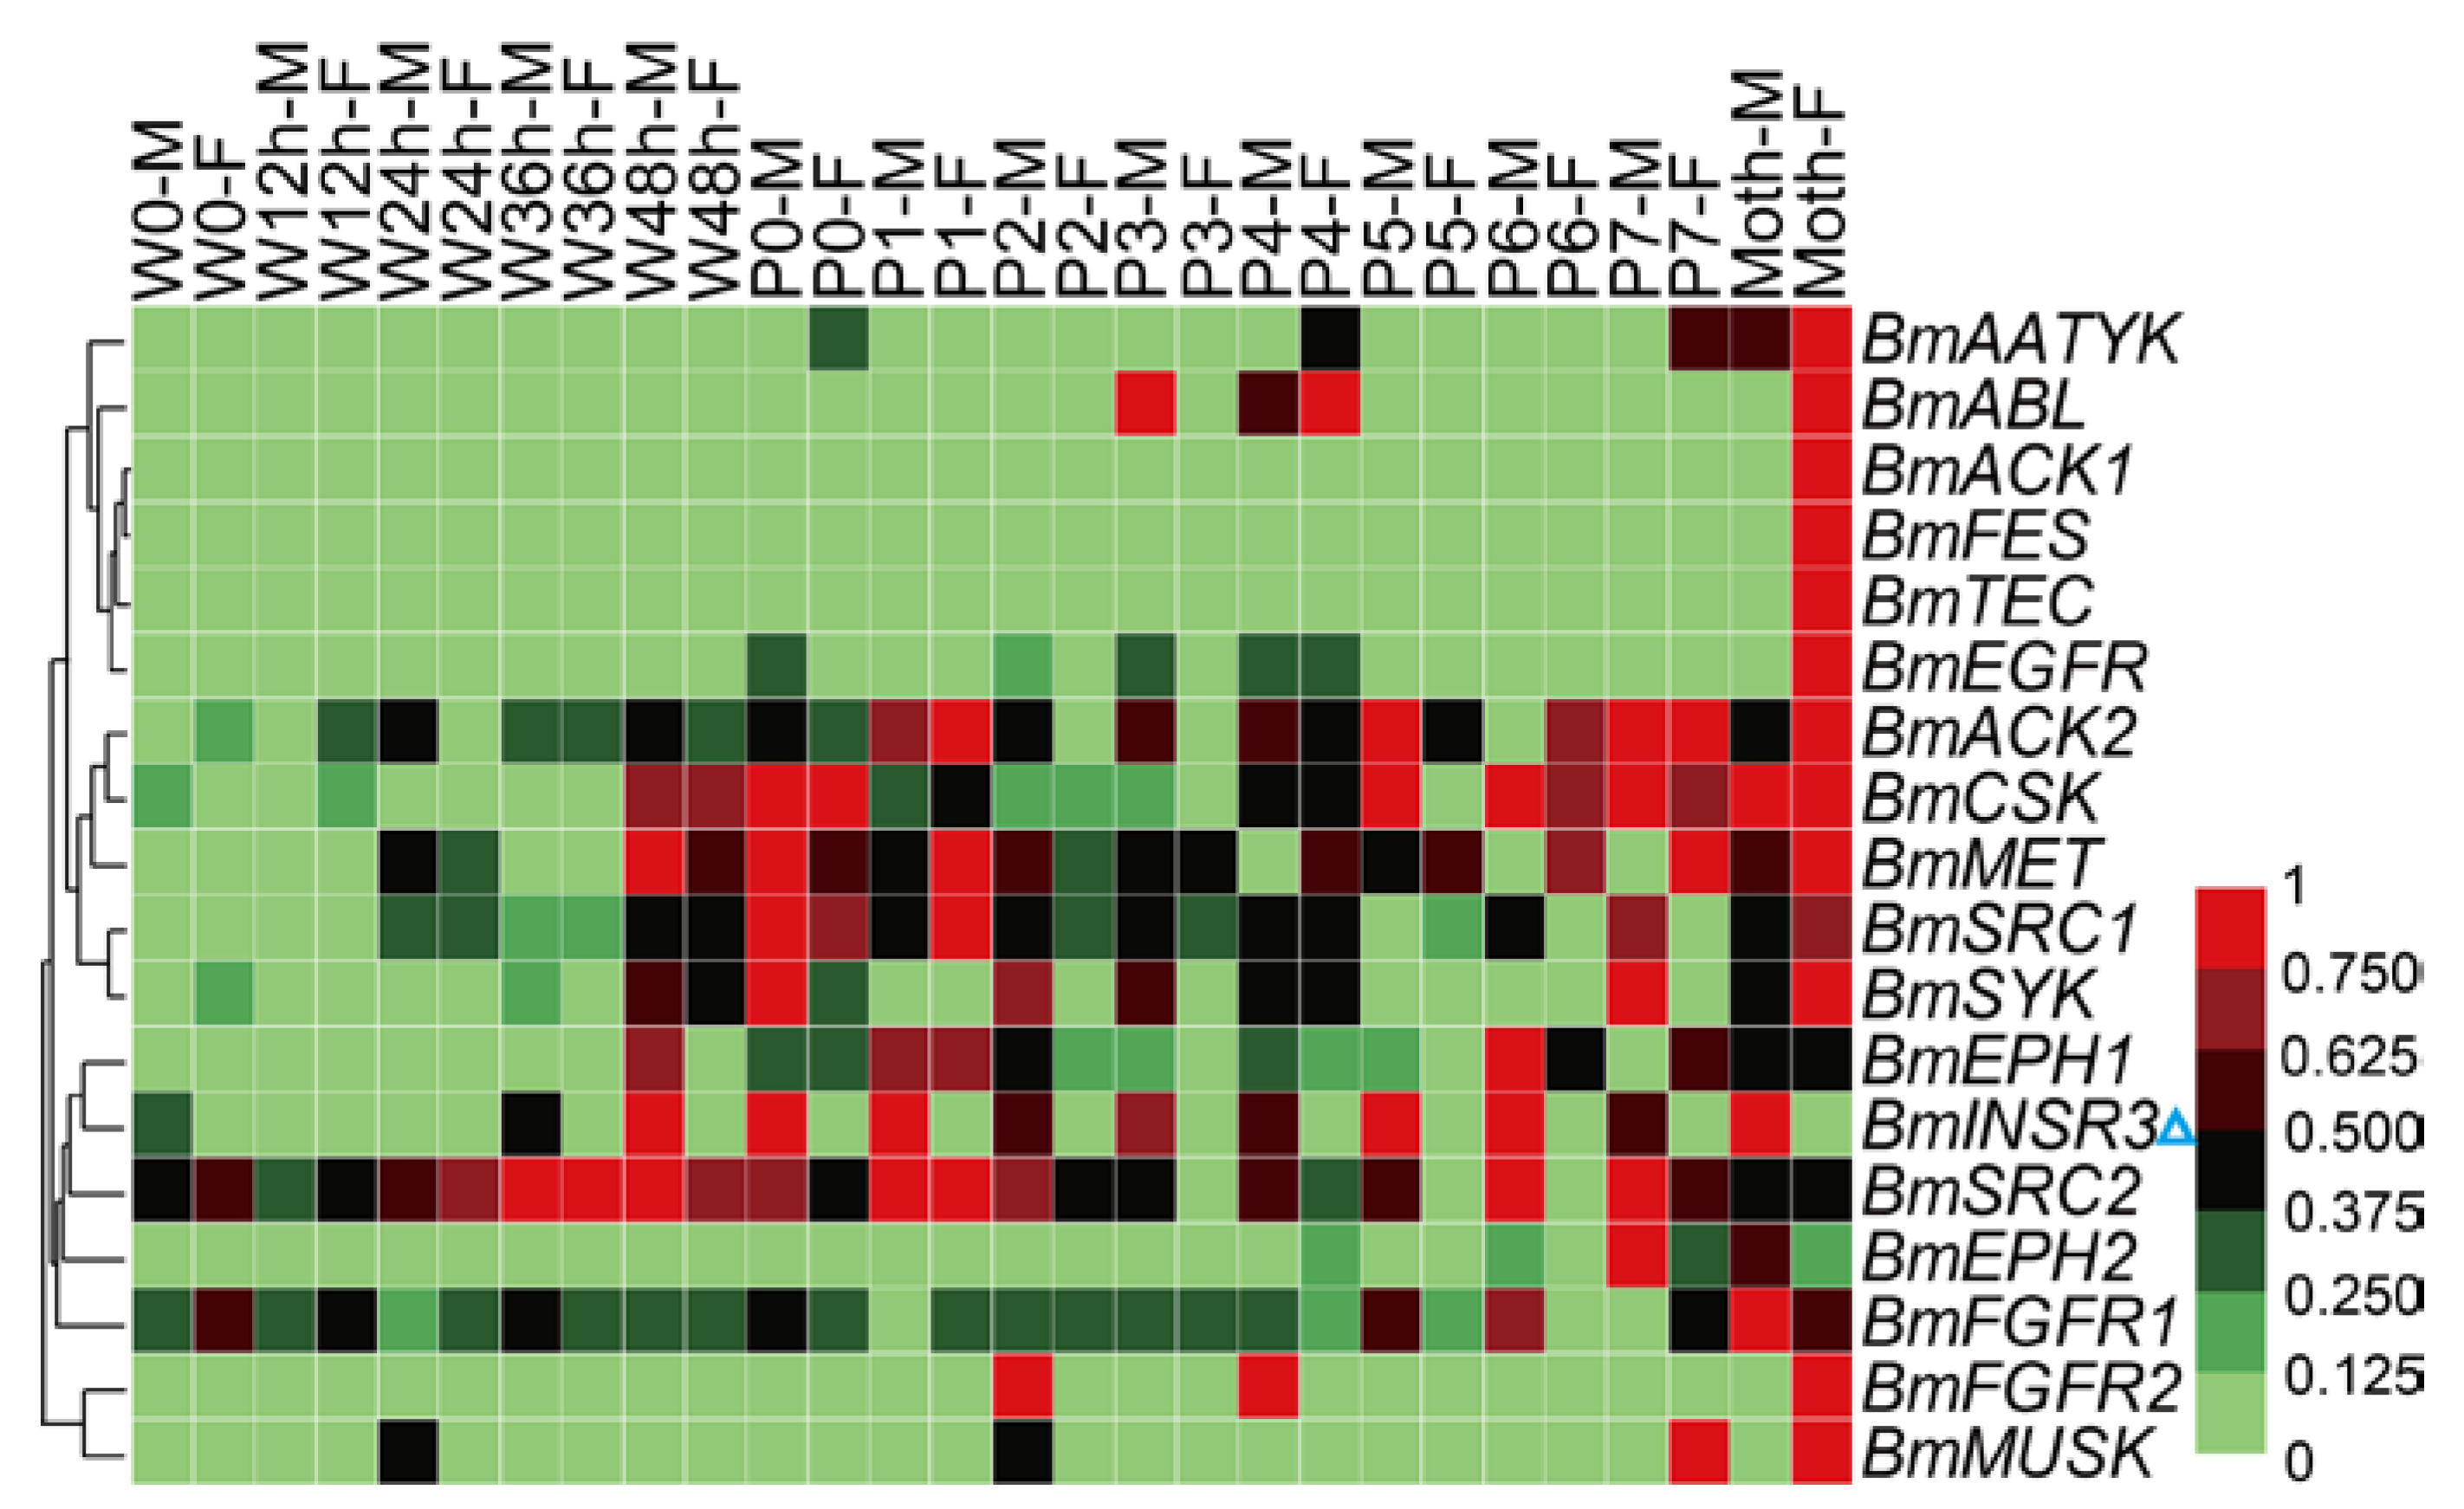
2.5. Spatial and Temporal Expression Profile of the BmTK Genes

Compared to the static characteristics including genomic locations, protein structures, sequence similarities and phylogenetic features, the gene expression patterns provide a more vivid image of the functions and biological activities of genes. To view the expression profile of BmTK genes across various tissues, we used the microarray gene expression dataset from SilkDB (Available online: http://www.silkdb.org), which contains normalized gene expression levels across 10 tissues. A total of 30 genes were detected by the tissue microarray (Figure 4, Table S4). Almost half of the genes are highly expressed in the gonads of the silkworm. Approximately one-third of the genes are expressed in the silk glands. BmINSR3 and BmACK2 exhibit testis-specific expression (Figure 4, blue triangles). 3 BmTK genes (BmSRC1, BmFGFR1 and BmEPH1) show higher expression in the head (Figure 4, red box), BmEPH1 expression is also present in the integument, and BmSRC1 is also expressed in the gonads. 3 genes (BmMUSK, BmEPH2 and BmCSK) are mainly expressed in the mid-gut (Figure 4, blue box). The diverse expression profiles indicate that some BmTK proteins are involved in specific physiological functions in specific tissues.
Due to the significant cellular functions, previous studies have shown essential roles of the TK families in multiple aspects of embryonic development, including a wide range from early events in fertilization and gastrulation to late events in histogenesis and organogenesis [33]. To view the expression patterns of the BmTK genes in the silkworm embryonic period, we used the RNA-seq-based DGE (digital gene expression) dataset of silkworm early embryos (hatching for ~60 h, thoracic and abdominal appendages are just formed) and late embryos (head pigmentation stage, organogenesis has basically been completed). The analysis shows that the majority of genes are highly expressed in the early embryos, while BmTKs are generally lowly expressed in the late stage of embryos (Figure 5, Table S5), indicating that the roles of these genes in silkworm early embryos in are more pronounced. More detailedly, the expression of BmEGFR, BmMUSK, BmFGFR2, BmFGFR1, BmABL and BmSRC1 is high in the early embryos, but is reduced in late embryos (Figure 5, red box). BmSYK, BmCSK and BmINSR3 are with relatively high expression in both the early and late embryos (Figure 5, red asterisks). Interestingly, although belonging to the same subfamily, BmSRC1 is highly expressed in the early stage, while BmSRC2 is highly expressed in the late stage (Figure 5, blue triangles). Similarly, compared to the relatively high expression of BmINSR3 in both early and late stages, BmINSR1 and BmINSR2 show low expressions at both the stages (Figure 5, red lines). These results reveal that BmTK genes of the same TK subfamily have diverse functions, or play roles at different stages of silkworm embryonic development. To get a more accurate and complete panorama of gene expression and a better understanding of their roles in silkworm embryonic development, we need to select more intensive time points for investigation in the future research and to continue the follow-up functional study.
In general, silkworm larvae experience four times of molting and form five larval instars. Larval molts are key physiological processes in silkworm growth. To view the temporal expression profiles of the BmTK genes during larval molting, we used the microarray gene expression data around the fourth larval molting, which contains normalized gene expression values across 10 time points from the 4th larval instar to the 5th larval instar. A total of 23 BmTK genes were found to be expressed during this period (Table S6), and 13 BmTK genes were detected to be highly expressed during larval molting (Figure 6A, from L4M0 h to L4M24 h). BmACK1 shows high expression across the 7 time points around larval molting, and 9 genes exhibit high expression at the early or midterm stages of molting (Figure 6A, red box), while other 3 genes present high expression at late stage of molting (Figure 6A, blue box). The 20-hydroxyecdysone (20E) is the major regulatory hormone in insects and other arthropods, and mediates developmental transitions such as larval molting and metamorphosis [44,45]. The expression pattern of BmTRK, BmACK2 and BmSYK resembles the changing titer of 20E in silkworm haemolymph (Figure 6B), and the expression of BmCSK and BmEPH2 appears to respond to low concentrations of 20E (Figure 6B), suggesting that the expression of these genes might be regulated by 20E.
The silkworm is an economically-important insect for silk production. Metamorphosis is the most crucial physiological stage of silkworm. Before this stage, silkworms spin cocoons to protect pupae from injury and this behavior also relates to economic benefit. Tissue dissociation and reconstruction occur during the metamorphosis stage, and the physiological status of pupae determines the success rate and synchronization of adult emergence, that are related to the quality and quantity of eggs. To investigate the expression profiles of the BmTK genes during metamorphosis, we used the microarray gene expression dataset from spinning to adult stages, which contains normalized gene expression values across 14 time points. A total of 18 BmTK genes were found to be expressed during this period (Table S7). Most genes exhibit high expression in the pupal and adult stages (Figure 7), indicating that these genes are involved in silkworm metamorphosis. The hierarchical clustering graph shows that the expression pattern of BmINSR3 displays sexual dimorphism, which is specifically expressed in male individuals (Figure 7, blue triangle). We also found that BmINSR3 were expressed specifically in the testis (Figure 4, blue triangle), indicating that this gene may be required for spermatogenesis or testicular development.
Our results have also been supported by studies on the function of orthologous genes in other species. We found that the expression of BmSRC1, BmMUSK and BmEGFR was very high in the early embryos of silkworm (Figure 5, red box). Previous studies in zebra-fish have shown that: the non-receptor tyrosine kinase SRC participated in egg activation during fertilization [47], MUSK played roles in neuromuscular synapse formation [48], and the EGFR receptor tyrosine kinase family affected the development of neural crest in the early stage of embryos [49]. The EPHR family is crucial for retinotectal system pattern, mesenchymal-to-epithelial transition and extracellular matrix assembly [50,51,52,53], and our results showed BmEPH1 exhibited relatively high expression in the head (Figure 4, red box). The MET receptor tyrosine kinase (ortholog of BmMET, whose encoding gene is highly expressed in the head and fat-body of silkworm, and fat-body is an insect organ functionally homologous to liver) was proved to regulate the development of liver and cerebellum [54,55,56].

3. Materials and Methods

3.1. Genome-Wide Identification of TK Proteins

Using the hidden Markov model (HMM) of tyrosine kinase domains (TK or Pkinase_Tyr, PF07714), hmmsearch program (HMMER3.0, Available online: http://hmmer.org/ [37], E-value ≤ 1 × 10⁻¹, score ≥ 0) was applied to identify the putative TK proteins in the silkworm protein dataset downloaded from two silkworm genome databases, KAIKObase (Available online: http://sgp.dna.affrc.go.jp/KAIKObase/) and SilkDB (Available online: http://www.silkdb.org). Redundant sequences were deleted manually. Two online tools, SMART (simple modular architecture research tool, Available online: http://smart.embl-heidelberg.de/) [57] and CDD (conserved domain database, Available online: http://www.ncbi.nlm.nih.gov/Structure/cdd/wrpsb.cgi) [58], were used to verify the TK domains in the predicted proteins. The TK genes were annotated by online BLASTP searches (standard protein BLAST, basic local alignment search tool) against the non-redundant protein database in NCBI (Available online: https://www.ncbi.nlm.nih.gov/).

3.2. Chromosomal Distribution and Gene Basic Information

The protein lengths, gene lengths, chromosomal locations, transcription directions and probes ID were obtained from KAIKObase and SilkDB. Isoelectric point values and theoretical molecular weights were calculated online at http://web.expasy.org/protparam/. Based on silkworm chromosomal coordinates of genes from the KAIKObase, the TK genes were mapped on chromosomes according to their order of physical position, and the BmTKs distribution map was constructed by MapChart [59].

3.3. Sequence Identity Matrix and Phylogenetic Analysis

Tyrosine kinase sequences of humans were retrieved from the previous reports [10]. We carried out pairwise sequence comparison for TK domain sequences of humans and silkworm to reveal sequence identity using BLASTP.
ABLs and AATYKs of other 19 representative metazoans were obtained from the previous reports (amphioxus [32] and zebra-fish [33]) or identified by BLASTP searches (Available online: ftp://ftp.ncbi.nlm.nih.gov/blast/executables/blast+/LATEST/) against protein sequences of the human ABLs and AATYKs. The information of these species is listed in Table S2. The protein sequences were downloaded from NCBI (Available online: ftp://ftp.ncbi.nlm.nih.gov/genomes/) and Ensembl (Available online: http://www.ensembl.org), and were verified using the online program SMART.
Pairwise sequence comparison of TK domain sequences of ABLs and AATYKs in the 21 metazoans was performed using BLASTP to reveal sequence identity. The sequence identity matrices were generated using the heat map illustrator (HemI) software package (version 1.0.3.3, Huazhong University of Science and Technology, Wuhan, China) [60].
Multiple sequence alignments for TK domains of ABLs and AATYKs from the 21 metazoans were performed by the MUSCLE (multiple sequence alignment) program [61,62], and unrooted phylogenetic trees were constructed by the maximum-likelihood method [63,64] with a bootstrap of 1000 replicates.

3.4. Gene Ontology Annotation

Gene Ontology (GO) categories of genes were obtained from two silkworm genome databases (Available online: http://sgp.dna.affrc.go.jp/KAIKObase/ and Available online: http://www.silkdb.org), and was visualized with WEGO (web gene ontology annotation plotting, Available online: http://wego.genomics.org.cn/) [65].

3.5. Expression Profiling Based on DGE Sequencing and Microarray Data

Based on the microarray gene expression data of 10 tissues on Day 3 of the fifth instar [66], we investigated the spatial expression pattern of BmTK genes. Each tissue was analyzed using at least two biological repeats, including head, fat body, midgut, Malpighian tubule, integument, hemocyte, ovary, testis, A/MSG (anterior/median silk gland) and PSG (posterior silk gland). Each biological repeat was a mixture from multiple individuals. As the previously-described protocol [67], four house-keeping genes (encoding proteasome β subunit, eIF 3A subunit 5, eIF-3 subunit 4 and eIF 4A) were used to normalize raw microarray data by a linear normalization method. The normalized values were then processed by the min-max normalization, and were used to generate hierarchical clustering graph based on a Pearson correlation distance metric and average linkage clustering using the HemI software package [60].
To elucidate the expression pattern of BmTK genes during silkworm larval molting and metamorphosis, we analyzed the microarray gene expression data at 10 developmental time points around the fourth larval molting and 14 developmental time points around metamorphosis. The raw microarray data were processed as described above. If the normalized signal intensity value of a gene was less than 400, the gene was considered to be unexpressed. Gene expression microarray data on L5D3 (day 3 of the 5th larval stage) were used as a control. The ratio of the signal intensity values of each gene at each developmental time point to that in the L5D3 was used to investigate dynamic changes of the expression level. The ratio values were then processed by the min-max normalization, and were used to generate hierarchical clustering graphs by the HemI software package as described above.
Based on DGE (digital gene expression) sequencing data of embryos hatching for ~60 h (early embryos, thoracic and abdominal appendages are just formed) and embryos at HP (head pigmentation) stage (late embryos, organogenesis has basically been completed), we investigated the expression pattern of BmTK genes in the embryonic period. RPKM (reads per kilo-base per million mapped reads) was used to quantify gene expression. The hierarchical clustering graph was generated using the HemI software package.

4. Conclusions

Tyrosine kinases (TKs), important components of signaling pathways, play key roles in cell growth, development, apoptosis and disease. We conducted a genome-wide analysis in silkworm and identified 33 TK-encoding genes belonging to 25 subfamilies. Sequence identity matrix analysis suggested that TKs in vertebrates tended to be remarkably conserved and stable. Phylogenetic analysis suggested that expansion and sequence variation events occur in TK family in vertebrates. GO analysis revealed that more BmTKs played roles in binding, catalysis, signal transduction, metabolism, biological regulation and response to stimulus, compared to all silkworm genes annotated in GO. Expression pattern analyses revealed the tissue-specific, stage-specific, or sex-dimorphic expressions of the BmTK genes. These findings complement systematic information on TK family of silkworm in Lepidoptera, and increase our understanding of metazoan TKs. The follow-up functional studies are required for a better understanding of the roles of TKs in regulation of key growth and developmental processes.

Supplementary Materials

Supplementary materials can be found at https://www.mdpi.com/1422-0067/19/4/934/s1.

Acknowledgments

The research was supported by the Chongqing Postdoctoral Science Special Foundation (Xm2017149), the China Postdoctoral Science Foundation (2016M602639), the National Natural Science Foundation of China (No. 31372379) and the Hi-Tech Research and Development 863 Program of China Grant (No. 2013AA102507).

Author Contributions

Fangyin Dai and Songzhen He conceived of the study. Songzhen He performed the study. Songzhen He and Minjin Han analyzed the data. Yanmin Bai collected the data. Songzhen He wrote the paper. Fangyin Dai, Xiaoling Tong and Minjin Han edited and revised the manuscript.

Conflicts of Interest

The authors declare no conflict of interest.

Abbreviations

TKTyrosine Kinase
BmBombyx mori
kDakilo-Dalton
RTKReceptor TK
CTKCytoplasmic TK (nonreceptor TK)

References

  1. Mohanty, S.; Oruganty, K.; Kwon, A.; Byrne, D.P.; Ferries, S.; Ruan, Z.; Hanold, L.E.; Katiyar, S.; Kennedy, E.J.; Eyers, P.A.; et al. Hydrophobic Core Variations Provide a Structural Framework for Tyrosine Kinase Evolution and Functional Specialization. PLoS Genet. 2016, 12, e1005885. [Google Scholar]
  2. Eckhart, W.; Hutchinson, M.A.; Hunter, T. An activity phosphorylating tyrosine in polyoma T antigen immunoprecipitates. Cell 1979, 18, 925–933. [Google Scholar] [CrossRef]
  3. Sefton, B.M.; Hunter, T.; Beemon, K. Product of in vitro translation of the Rous sarcoma virus src gene has protein kinase activity. J. Virol. 1979, 30, 311–318. [Google Scholar] [PubMed]
  4. Collett, M.S.; Purchio, A.F.; Erikson, R.L. Avian sarcoma virus-transforming protein, pp60src shows protein kinase activity specific for tyrosine. Nature 1980, 285, 167–169. [Google Scholar] [CrossRef] [PubMed]
  5. Hanks, S.K.; Quinn, A.M. Protein kinase catalytic domain sequence database: Identification of conserved features of primary structure and classification of family members. Methods Enzymol. 1991, 200, 38–62. [Google Scholar] [PubMed]
  6. Hunter, T.; Eckhart, W. The discovery of tyrosine phosphorylation: It’s all in the buffer! Cell 2004, 116, S35–S39. [Google Scholar] [CrossRef]
  7. Lemmon, M.A.; Schlessinger, J. Cell signaling by receptor tyrosine kinases. Cell 2010, 141, 1117–1134. [Google Scholar] [CrossRef] [PubMed]
  8. Annenkov, A. Receptor tyrosine kinase (RTK) signalling in the control of neural stem and progenitor cell (NSPC) development. Mol. Neurobiol. 2014, 49, 440–471. [Google Scholar] [CrossRef] [PubMed]
  9. Hubbard, S.R.; Till, J.H. Protein tyrosine kinase structure and function. Annu. Rev. Biochem. 2000, 69, 373–398. [Google Scholar] [CrossRef] [PubMed]
  10. Robinson, D.R.; Wu, Y.M.; Lin, S.F. The protein tyrosine kinase family of the human genome. Oncogene 2000, 19, 5548–5557. [Google Scholar] [CrossRef] [PubMed]
  11. Liu, A.; He, F.; Gu, X. Identification and characterization of tyrosine kinases in anole lizard indicate the conserved tyrosine kinase repertoire in vertebrates. Mol. Genet. Genom. 2017, 292, 1405–1418. [Google Scholar] [CrossRef] [PubMed]
  12. Mahajan, K.; Mahajan, N.P. Cross talk of tyrosine kinases with the DNA damage signaling pathways. Nucleic Acids Res. 2015, 43, 10588–10601. [Google Scholar] [CrossRef] [PubMed]
  13. Pires-daSilva, A.; Sommer, R.J. The evolution of signalling pathways in animal development. Nat. Rev. Genet. 2003, 4, 39–49. [Google Scholar] [CrossRef] [PubMed]
  14. Van der Geer, P.; Hunter, T.; Lindberg, R.A. Receptor protein-tyrosine kinases and their signal transduction pathways. Annu. Rev. Cell Biol. 1994, 10, 251–337. [Google Scholar] [CrossRef] [PubMed]
  15. Hunter, T. The Croonian Lecture 1997. The phosphorylation of proteins on tyrosine: Its role in cell growth and disease. Philos. Trans. R. Soc. Lond. Ser. B Biol. Sci. 1998, 353, 583–605. [Google Scholar] [CrossRef] [PubMed]
  16. Robertson, S.C.; Tynan, J.; Donoghue, D.J. RTK mutations and human syndromes: When good receptors turn bad. Trends Genet. 2000, 16, 265–271. [Google Scholar] [CrossRef]
  17. Manning, G.; Whyte, D.B.; Martinez, R.; Hunter, T.; Sudarsanam, S. The protein kinase complement of the human genome. Science 2002, 298, 1912–1934. [Google Scholar] [CrossRef] [PubMed]
  18. Bae, J.H.; Schlessinger, J. Asymmetric tyrosine kinase arrangements in activation or autophosphorylation of receptor tyrosine kinases. Mol. Cells 2010, 29, 443–448. [Google Scholar] [CrossRef] [PubMed]
  19. Brunet, F.G.; Volff, J.N.; Schartl, M. Whole Genome Duplications Shaped the Receptor Tyrosine Kinase Repertoire of Jawed Vertebrates. Genome Biol. Evol. 2016, 8, 1600–1613. [Google Scholar] [CrossRef] [PubMed]
  20. Jha, P.; Lu, D.; Yuan, Y.; Xu, S. Signature of positive selection of PTK6 gene in East Asian populations: A cross talk for Helicobacter pylori invasion and gastric cancer endemicity. Mol. Genet. Genom. 2015, 290, 1741–1752. [Google Scholar] [CrossRef] [PubMed]
  21. Peng, M.; Ball-Kell, S.M.; Tyner, A.L. Protein tyrosine kinase 6 promotes ERBB2-induced mammary gland tumorigenesis in the mouse. Cell Death Dis. 2015, 6, e1848. [Google Scholar] [CrossRef] [PubMed]
  22. Valiaho, J.; Faisal, I.; Ortutay, C.; Smith, C.I.; Vihinen, M. Characterization of all possible single-nucleotide change caused amino acid substitutions in the kinase domain of Bruton tyrosine kinase. Hum. Mutat. 2015, 36, 638–647. [Google Scholar] [CrossRef] [PubMed]
  23. Maxson, J.E.; Abel, M.L.; Wang, J.; Deng, X.; Reckel, S.; Luty, S.B.; Sun, H.; Gorenstein, J.; Hughes, S.B.; Bottomly, D.; et al. Identification and Characterization of Tyrosine Kinase Nonreceptor 2 Mutations in Leukemia through Integration of Kinase Inhibitor Screening and Genomic Analysis. Cancer Res. 2016, 76, 127–138. [Google Scholar] [CrossRef] [PubMed]
  24. Drake, J.M.; Lee, J.K.; Witte, O.N. Clinical targeting of mutated and wild-type protein tyrosine kinases in cancer. Mol. Cell. Biol. 2014, 34, 1722–1732. [Google Scholar] [CrossRef] [PubMed]
  25. Giordani, E.; Zoratto, F.; Strudel, M.; Papa, A.; Rossi, L.; Minozzi, M.; Caruso, D.; Zaccarelli, E.; Verrico, M.; Tomao, S. Old Tyrosine Kinase Inhibitors and Newcomers in Gastrointestinal Cancer Treatment. Curr. Cancer Drug Targets 2016, 16, 175–185. [Google Scholar] [PubMed]
  26. Blume-Jensen, P.; Hunter, T. Oncogenic kinase signalling. Nature 2001, 411, 355–365. [Google Scholar] [CrossRef] [PubMed]
  27. Chang, Y.M.; Kung, H.J.; Evans, C.P. Nonreceptor tyrosine kinases in prostate cancer. Neoplasia 2007, 9, 90–100. [Google Scholar] [CrossRef] [PubMed]
  28. Nelson, E.G.; Grandis, J.R. Aberrant kinase signaling: Lessons from head and neck cancer. Future Oncol. 2007, 3, 353–361. [Google Scholar] [CrossRef] [PubMed]
  29. Li, W.; Young, S.L.; King, N.; Miller, W.T. Signaling properties of a non-metazoan Src kinase and the evolutionary history of Src negative regulation. J. Biol. Chem. 2008, 283, 15491–15501. [Google Scholar] [CrossRef] [PubMed]
  30. Manning, G.; Young, S.L.; Miller, W.T.; Zhai, Y. The protist, Monosiga brevicollis, has a tyrosine kinase signaling network more elaborate and diverse than found in any known metazoan. Proc. Natl. Acad. Sci. USA 2008, 105, 9674–9679. [Google Scholar] [CrossRef] [PubMed]
  31. Shiu, S.H.; Li, W.H. Origins, lineage-specific expansions, and multiple losses of tyrosine kinases in eukaryotes. Mol. Biol. Evol. 2004, 21, 828–840. [Google Scholar] [CrossRef] [PubMed]
  32. D’Aniello, S.; Irimia, M.; Maeso, I.; Pascual-Anaya, J.; Jimenez-Delgado, S.; Bertrand, S.; Garcia-Fernandez, J. Gene expansion and retention leads to a diverse tyrosine kinase superfamily in amphioxus. Mol. Biol. Evol. 2008, 25, 1841–1854. [Google Scholar] [CrossRef] [PubMed]
  33. Challa, A.K.; Chatti, K. Conservation and early expression of zebrafish tyrosine kinases support the utility of zebrafish as a model for tyrosine kinase biology. Zebrafish 2013, 10, 264–274. [Google Scholar] [CrossRef] [PubMed]
  34. Li, X.; Hua, X.; Song, L.; Xia, Q.; Wang, F. Identification of Tyrosine Kinase Src Responsible for Antimicrobial Peptides Production in Bombyx mori. Protein Pept. Lett. 2017, 24, 174–180. [Google Scholar] [CrossRef] [PubMed]
  35. Shobahah, J.; Xue, S.; Hu, D.; Zhao, C.; Wei, M.; Quan, Y.; Yu, W. Quantitative phosphoproteome on the silkworm (Bombyx mori) cells infected with baculovirus. Virol. J. 2017, 14, 117. [Google Scholar] [CrossRef] [PubMed]
  36. Goldsmith, M.R.; Shimada, T.; Abe, H. The genetics and genomics of the silkworm, Bombyx mori. Annu. Rev. Entomol. 2005, 50, 71–100. [Google Scholar] [CrossRef] [PubMed]
  37. Finn, R.D.; Clements, J.; Eddy, S.R. HMMER web server: Interactive sequence similarity searching. Nucleic Acids Res. 2011, 39, W29–W37. [Google Scholar] [CrossRef] [PubMed]
  38. Suga, H.; Dacre, M.; de Mendoza, A.; Shalchian-Tabrizi, K.; Manning, G.; Ruiz-Trillo, I. Genomic survey of premetazoans shows deep conservation of cytoplasmic tyrosine kinases and multiple radiations of receptor tyrosine kinases. Sci. Signal. 2012, 5, ra35. [Google Scholar] [CrossRef] [PubMed]
  39. Zhang, L.; Lu, H.H.; Chung, W.Y.; Yang, J.; Li, W.H. Patterns of segmental duplication in the human genome. Mol. Biol. Evol. 2005, 22, 135–141. [Google Scholar] [CrossRef] [PubMed]
  40. Shoja, V.; Zhang, L. A roadmap of tandemly arrayed genes in the genomes of human, mouse, and rat. Mol. Biol. Evol. 2006, 23, 2134–2141. [Google Scholar] [CrossRef] [PubMed]
  41. Iwabe, N.; Kuma, K.; Miyata, T. Evolution of gene families and relationship with organismal evolution: Rapid divergence of tissue-specific genes in the early evolution of chordates. Mol. Biol. Evol. 1996, 13, 483–493. [Google Scholar] [CrossRef] [PubMed]
  42. Suga, H.; Kuma, K.; Iwabe, N.; Nikoh, N.; Ono, K.; Koyanagi, M.; Hoshiyama, D.; Miyata, T. Intermittent divergence of the protein tyrosine kinase family during animal evolution. FEBS Lett. 1997, 412, 540–546. [Google Scholar] [CrossRef]
  43. Suga, H.; Koyanagi, M.; Hoshiyama, D.; Ono, K.; Iwabe, N.; Kuma, K.; Miyata, T. Extensive gene duplication in the early evolution of animals before the parazoan-eumetazoan split demonstrated by G proteins and protein tyrosine kinases from sponge and hydra. J. Mol. Evol. 1999, 48, 646–653. [Google Scholar] [CrossRef] [PubMed]
  44. Truman, J.W.; Riddiford, L.M. Endocrine insights into the evolution of metamorphosis in insects. Annu. Rev. Entomol. 2002, 47, 467–500. [Google Scholar] [CrossRef] [PubMed]
  45. Ishimoto, H.; Kitamoto, T. The steroid molting hormone Ecdysone regulates sleep in adult Drosophila melanogaster. Genetics 2010, 185, 269–281. [Google Scholar] [CrossRef] [PubMed]
  46. Kiguchi, K.; Agui, N. Ecdysteroid levels and developmental events during larval moulting in the silkworm, Bombyx mori. J. Insect Physiol. 1981, 27, 805–807. [Google Scholar] [CrossRef]
  47. Sharma, D.; Kinsey, W.H. Fertilization triggers localized activation of Src-family protein kinases in the zebrafish egg. Dev. Biol. 2006, 295, 604–614. [Google Scholar] [CrossRef] [PubMed]
  48. Jing, L.; Gordon, L.R.; Shtibin, E.; Granato, M. Temporal and spatial requirements of unplugged/MuSK function during zebrafish neuromuscular development. PLoS ONE 2010, 5, e8843. [Google Scholar] [CrossRef] [PubMed] [Green Version]
  49. Budi, E.H.; Patterson, L.B.; Parichy, D.M. Embryonic requirements for ErbB signaling in neural crest development and adult pigment pattern formation. Development 2008, 135, 2603–2614. [Google Scholar] [CrossRef] [PubMed]
  50. Barrios, A.; Poole, R.J.; Durbin, L.; Brennan, C.; Holder, N.; Wilson, S.W. Eph/Ephrin signaling regulates the mesenchymal-to-epithelial transition of the paraxial mesoderm during somite morphogenesis. Curr. Biol. 2003, 13, 1571–1582. [Google Scholar] [CrossRef] [PubMed]
  51. Julich, D.; Mould, A.P.; Koper, E.; Holley, S.A. Control of extracellular matrix assembly along tissue boundaries via Integrin and Eph/Ephrin signaling. Development 2009, 136, 2913–2921. [Google Scholar] [CrossRef] [PubMed]
  52. Oates, A.C.; Lackmann, M.; Power, M.A.; Brennan, C.; Down, L.M.; Do, C.; Evans, B.; Holder, N.; Boyd, A.W. An early developmental role for eph-ephrin interaction during vertebrate gastrulation. Mech. Dev. 1999, 83, 77–94. [Google Scholar] [CrossRef]
  53. Wagle, M.; Grunewald, B.; Subburaju, S.; Barzaghi, C.; Le Guyader, S.; Chan, J.; Jesuthasan, S. EphrinB2a in the zebrafish retinotectal system. J. Neurobiol. 2004, 59, 57–65. [Google Scholar] [CrossRef] [PubMed]
  54. Elsen, G.E.; Choi, L.Y.; Prince, V.E.; Ho, R.K. The autism susceptibility gene met regulates zebrafish cerebellar development and facial motor neuron migration. Dev. Biol. 2009, 335, 78–92. [Google Scholar] [CrossRef] [PubMed]
  55. Latimer, A.J.; Jessen, J.R. Hgf/c-met expression and functional analysis during zebrafish embryogenesis. Dev. Dyn. Off. Publ. Am. Assoc. Anat. 2008, 237, 3904–3915. [Google Scholar]
  56. Tallafuss, A.; Eisen, J.S. The Met receptor tyrosine kinase prevents zebrafish primary motoneurons from expressing an incorrect neurotransmitter. Neural Dev. 2008, 3, 18. [Google Scholar] [CrossRef] [PubMed]
  57. Ponting, C.P.; Schultz, J.; Milpetz, F.; Bork, P. SMART: Identification and annotation of domains from signalling and extracellular protein sequences. Nucleic Acids Res. 1999, 27, 229–232. [Google Scholar] [CrossRef] [PubMed]
  58. Marchler-Bauer, A.; Lu, S.; Anderson, J.B.; Chitsaz, F.; Derbyshire, M.K.; DeWeese-Scott, C.; Fong, J.H.; Geer, L.Y.; Geer, R.C.; Gonzales, N.R.; et al. CDD: A Conserved Domain Database for the functional annotation of proteins. Nucleic Acids Res. 2011, 39, D225–D229. [Google Scholar] [CrossRef] [PubMed]
  59. Voorrips, R.E. MapChart: Software for the graphical presentation of linkage maps and QTLs. J. Hered. 2002, 93, 77–78. [Google Scholar] [CrossRef] [PubMed]
  60. Deng, W.; Wang, Y.; Liu, Z.; Cheng, H.; Xue, Y. HemI: A toolkit for illustrating heatmaps. PLoS ONE 2014, 9, e111988. [Google Scholar] [CrossRef] [PubMed]
  61. Edgar, R.C. MUSCLE: Multiple sequence alignment with high accuracy and high throughput. Nucleic Acids Res. 2004, 32, 1792–1797. [Google Scholar] [CrossRef] [PubMed]
  62. Tamura, K.; Stecher, G.; Peterson, D.; Filipski, A.; Kumar, S. MEGA6: Molecular Evolutionary Genetics Analysis version 6.0. Mol. Biol. Evol. 2013, 30, 2725–2729. [Google Scholar] [CrossRef] [PubMed]
  63. Matsuda, H. Protein phylogenetic inference using maximum likelihood with a genetic algorithm. Pac. Symp. Biocomput. 1996, 96, 512–523. [Google Scholar]
  64. Salter, L.A.; Pearl, D.K. Stochastic search strategy for estimation of maximum likelihood phylogenetic trees. Syst. Biol. 2001, 50, 7–17. [Google Scholar] [CrossRef] [PubMed]
  65. Ye, J.; Fang, L.; Zheng, H.; Zhang, Y.; Chen, J.; Zhang, Z.; Wang, J.; Li, S.; Li, R.; Bolund, L.; et al. WEGO: A web tool for plotting GO annotations. Nucleic Acids Res. 2006, 34, W293–W297. [Google Scholar] [CrossRef] [PubMed]
  66. Xia, Q.; Cheng, D.; Duan, J.; Wang, G.; Cheng, T.; Zha, X.; Liu, C.; Zhao, P.; Dai, F.; Zhang, Z.; et al. Microarray-based gene expression profiles in multiple tissues of the domesticated silkworm, Bombyx mori. Genome Biol. 2007, 8, R162. [Google Scholar] [CrossRef] [PubMed]
  67. He, S.; Tong, X.; Han, M.; Hu, H.; Dai, F. Genome-Wide Identification and Characterization of WD40 Protein Genes in the Silkworm, Bombyx mori. Int. J. Mol. Sci. 2018, 19, 527. [Google Scholar] [CrossRef] [PubMed]
Figure 1. BmTKs distribution map on silkworm chromosomes. 32 of the identified silkworm TK genes (i.e., all except BmEPH2) were plotted onto chromosomes based on their physical coordinates. The chr indicates chromosome. Chromosomal distances are given in Mb (Mega base).
Ijms 19 00934 g001
Figure 2. Sequence identity matrices and phylogenetic analysis of AATYK and ABL subfamilies members in metazoans. (A,B) Sequence identity matrices. The yellow and red lines on the X and Y axes indicate chordates and vertebrates, respectively. (C,D) TK domain sequence-based phylogenetic trees. The ML (Maximum-Likelihood) trees are based on multiple sequence alignments of TK domains from AATYK and ABL subfamilies. Bootstrap values below 50 are not shown. Chordates and arthropods are indicated by different colors. The red arcs indicate the different protein classifications of the higher chordates (i.e., vertebrates). The blue arcs indicate the proteins of lower metazoans. Corresponding species names for the abbreviations are listed in Table S2.
Ijms 19 00934 g002
Figure 3. Gene Ontology (GO) categories of BmTK genes. This analysis was visualized with an online tool, WEGO (Available online: http://wego.genomics.org.cn/).
Ijms 19 00934 g003
Figure 4. Microarray-based gene expression profiling of BmTK genes in multiple tissues. Biological repeats of each tissue are indicated with different numerals. F: female, M: male, A/MSG: anterior/median silk gland, PSG: posterior silk gland. Blue triangles indicate the genes with testis-specific expression. Red box indicates the genes with higher expression in the head. Blue box indicates the genes with high expression in the mid-gut.
Ijms 19 00934 g004
Figure 5. Gene expression profiling of BmTK genes in the embryonic period. RPKM (reads per kilo-base per million mapped reads) of digital gene expression data was used to quantify gene expression. 60 h: embryos hatching for ~60 h (early embryos), HP: embryos at head pigmentation stage (late embryos). Red box indicates the genes with high expression in the early embryos. Red asterisks indicate the genes with relatively high expression in both the early and late embryos. Blue triangles indicate the genes in the SRC subfamily. Red lines indicate the genes in the INSR subfamily.
Ijms 19 00934 g005
Figure 6. Microarray-based gene expression profiling of BmTK genes during the fourth larval molting. 23 BmTK genes were detected to be expressed during silkworm larval molting. L: larval (L4-0 h: beginning of the 4th larval instar, L4D1: day 1 of the 4th larval instar), M: molting (L4M0 h: beginning of molting, L4M8 h: 8 h after L4M0 h). (A) Red box indicates the genes with high expression at the early or midterm stage of molting. Blue box indicates the genes with high expression at late stage of molting. (B) The 20E titer in silkworm haemolymph (from Kiguchi et al. [46]) is shown at the top. BmTRK, BmACK2 and BmSYK are with the expression pattern resembling the pulse of 20E (A, blue triangles). BmCSK and BmEPH2 might respond to low concentrations of 20E (A, red asterisks).
Ijms 19 00934 g006
Figure 7. Microarray-based gene expression profiling of BmTK genes during silkworm metamorphosis. 18 BmTK genes were detected to be expressed during silkworm metamorphosis. W: Wandering (W0: beginning of wandering for spinning, W12 h: 12 h after W0), P: pupation (P0: beginning of pupation, P1: one day after P0), M: male, F: female. Blue triangle indicates the gene with male-specific expression.
Ijms 19 00934 g007
Table 1. Inventory of TK genes in the silkworm genome.
TypeGeneProtein LengthMolecular WeightIsoelectric PointChromosome
RTKsBmDDR65675,616.438.24chr1
BmEGFR1448161,311.645.82chr1
BmEPH11006111,7465.78chr1
BmTRK57864,646.35.43chr4
BmRYK159765,058.488.49chr5
BmRYK254260,476.736.98chr5
BmFGFR185697,292.725.86chr7
BmFGFR261669,437.855.61chr9
BmROR971109,667.498.05chr12
BmVEGFR1366155,204.045.85chr13
BmAATYK3012332,254.394.41chr17
BmRET80791,551.546.24chr19
BmFGFR3910134,082.478.65chr22
BmMUSK63872,945.695.88chr22
BmROS2464276,014.616.56chr23
BmALK1698187,163.16.67chr24
BmPTK718421,040.156.31chr24
BmMET73983,289.745.83chr25
BmEPH218420,469.514.85unknown
CTKsBmABL1247136,157.768.31chr1
BmACK11136127,807.116.84chr1
BmINSR1985107,739.528.53chr4
BmINSR21022112,004.686.67chr4
BmINSR31472164,583.026.4chr5
BmSYK80390,867.36.34chr5
BmFES86798,133.688.38chr6
BmACK2911102,923.586.89chr10
BmSRC152159,837.597.22chr11
BmTEC65774,694.18.49chr13
BmJAK1074123,869.626.75chr19
BmSRC250758,373.316.21chr19
BmFAK1524169,553.797.39chr20
BmCSK58964,243.58.31chr21
RTKs indicate receptor tyrosine kinases; CTKs indicate cytoplasmic (non-receptor) tyrosine kinases.
Table 2. Orthology of silkworm and human TKs with names, protein accession numbers, and sequence identity of kinase domains.
TypeSilkworm Gene NameProtein AccessionHuman Gene NameProtein AccessionIdentity
RTKsBmAATYKXP_021203756.1AATYKNP_00491129%
BmALKXP_012552890.1ALKNP_00429561%
BmDDRNP_001108469.1DDR2NP_00617342%
BmEGFRXP_004929799.2ERBB4NP_00522665%
BmEPH1XP_021207962.1EPHA5P5475672%
BmEPH2Gene016321EPHA2NP_00442247%
BmFGFR1NP_001037558.1FGFR3NP_00013364%
BmFGFR2XP_004922880.2FGFR1AAA3583548%
BmFGFR3BGIBMGA010869FGFR1AAA3583537%
BmMETXP_004925752.1RONNP_00243840%
BmMUSKNP_001186538.1MUSKNP_00558362%
BmPTK7XP_021209072.1PTK7NP_00281239%
BmRETNP_001164049.1RETP0794944%
BmRORXP_021203906.1ROR1NP_00500355%
BmROSXP_012551361.1ROS1NP_00293559%
BmRYK1XP_021207735.1RYKAAB2634144%
BmRYK2XP_004932386.1RYKAAB2634150%
BmTRKXP_004929369.2NTRK2NP_00617146%
BmVEGFRXP_012547297.1VEGFR1NP_00201043%
CTKsBmABLXP_012551486.1ABL1NP_00514877%
BmACK1XP_004933204.2ACK1NP_00577247%
BmACK2XP_004930430.1ACK1NP_00577258%
BmCSKXP_012548803.1CSKNP_00437457%
BmFAKXP_021207025.1FAKNP_00559859%
BmFESXP_012549644.1 FESNP_00199657%
BmINSR1XP_021203435.1INSRNP_00019944%
BmINSR2XP_021203450.1INSRRAAC3175935%
BmINSR3NP_001037011.1IGF1RNP_00086671%
BmJAKXP_021206252.1JAK2NP_00496334%
BmSRC1XP_004932912.1FYNNP_00202857%
BmSRC2XP_012549151.1FYNNP_00202870%
BmSYKXP_004930074.1ZAP70A4426648%
BmTECXP_021204775.1TECNP_00320658%

