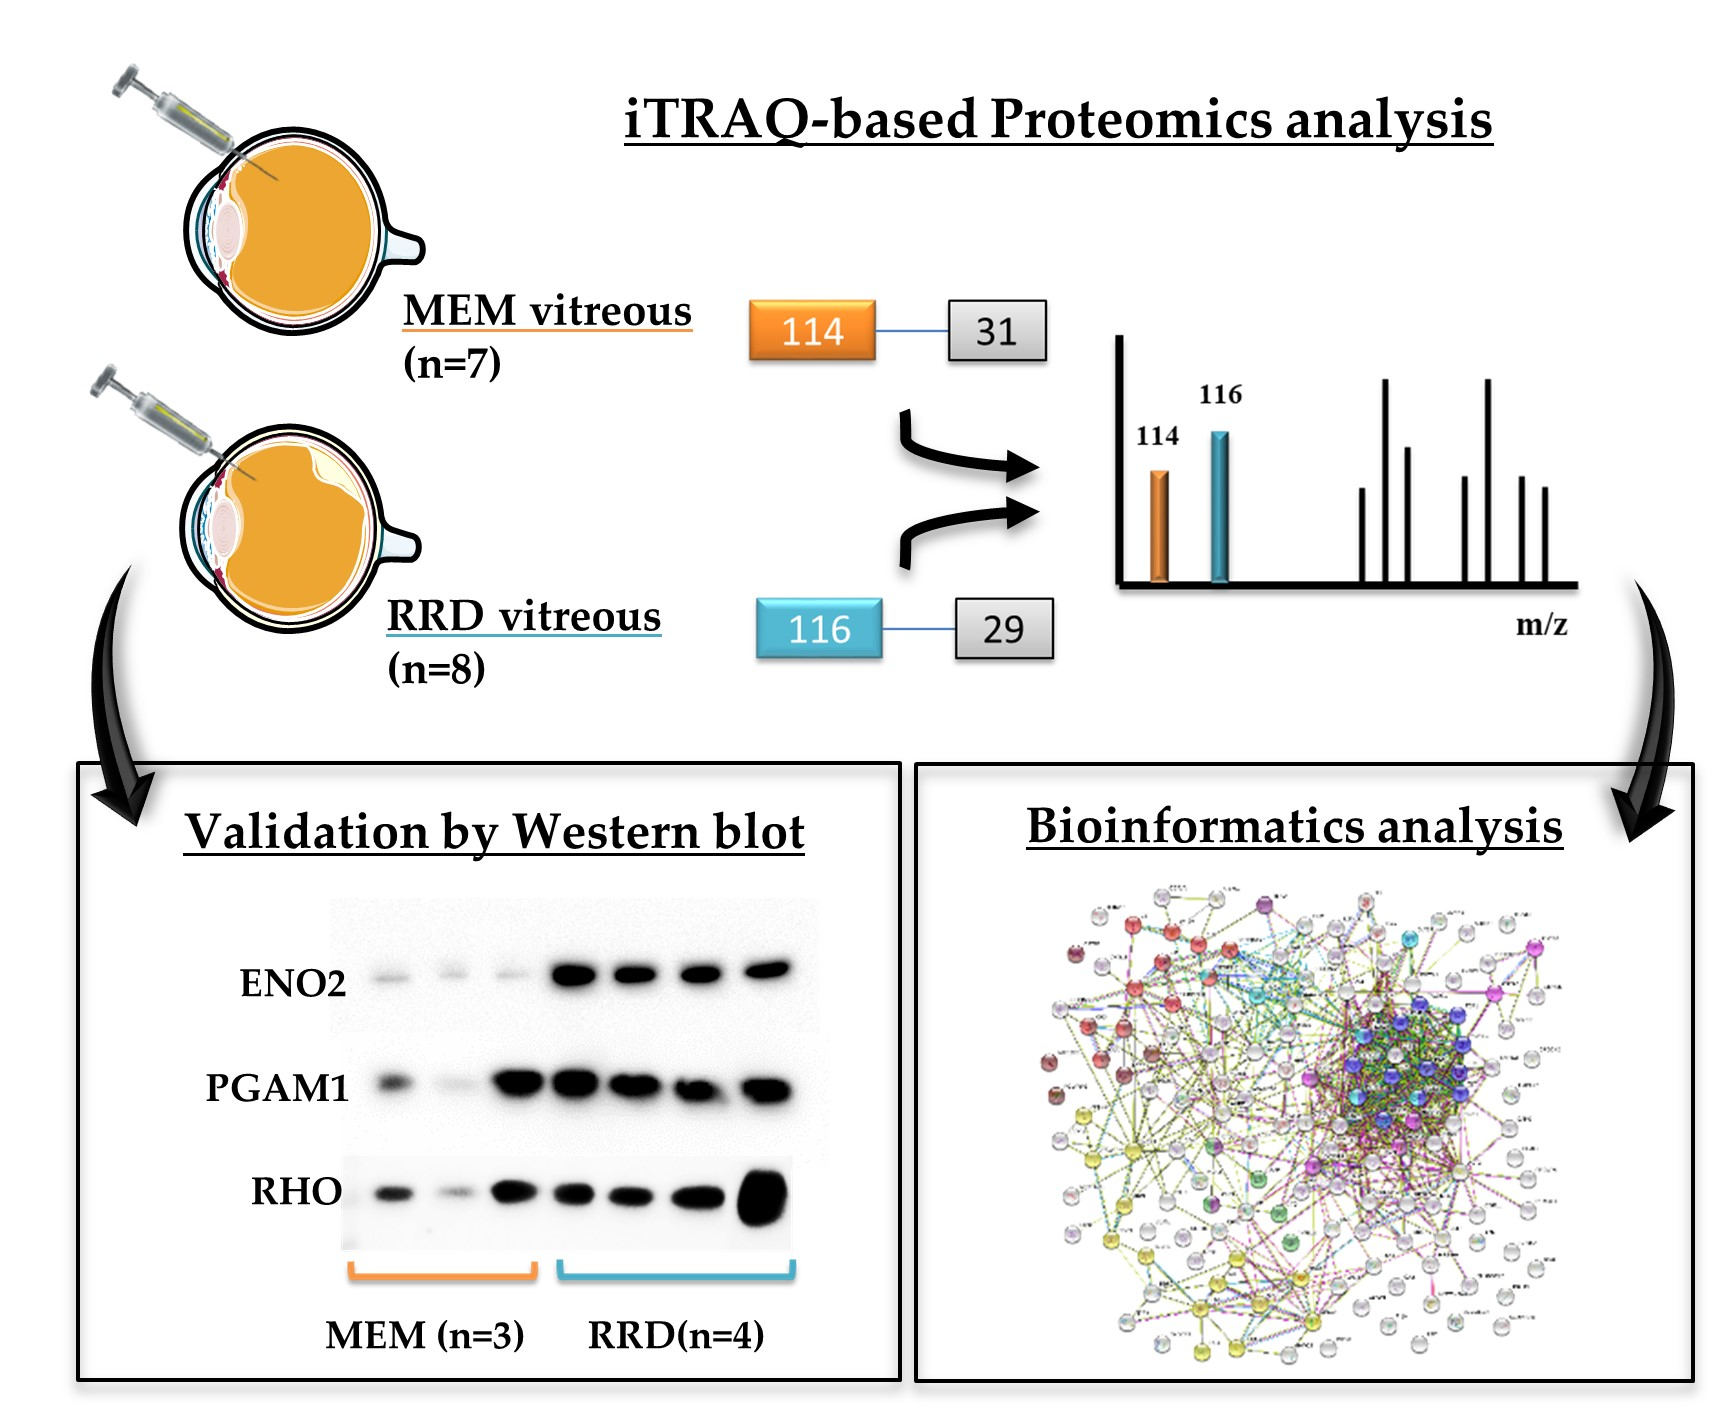
iTRAQ Quantitative Proteomic Analysis of Vitreous from Patients with Retinal Detachment

 , and
, and
Abstract
:
1. Introduction
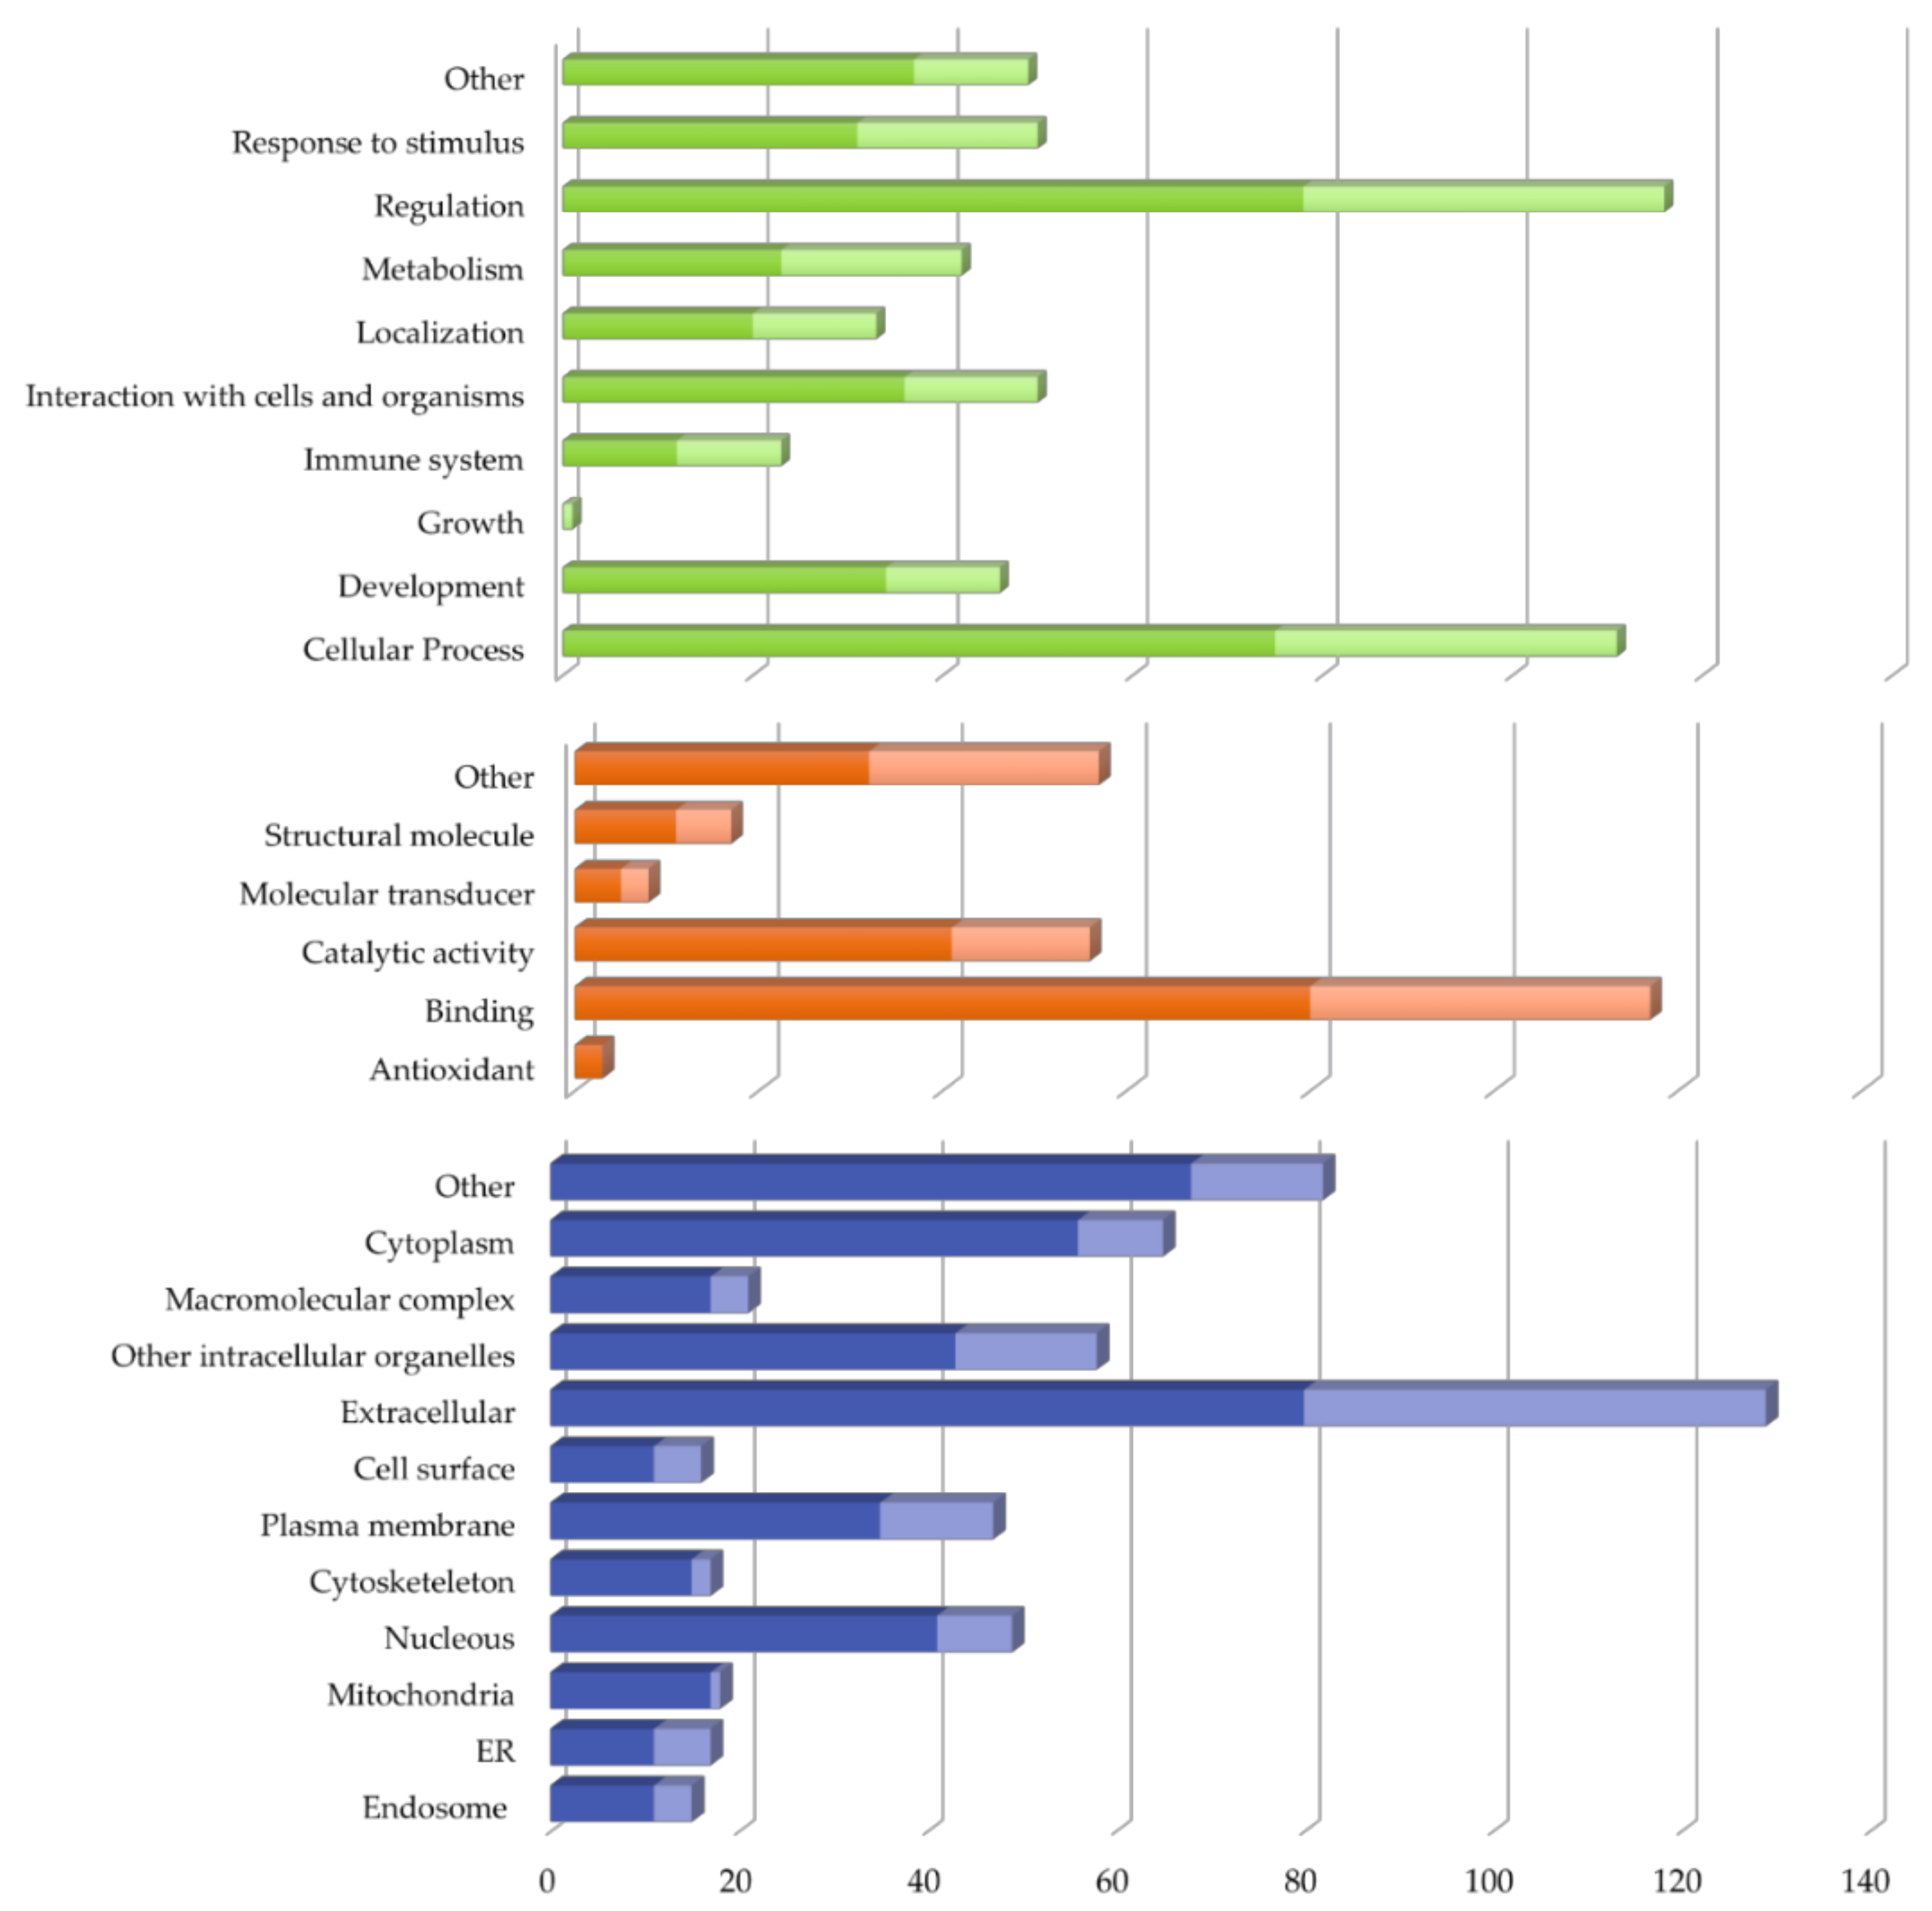
2. Results
2.1. Characterization of Patients and Vitreous Samples
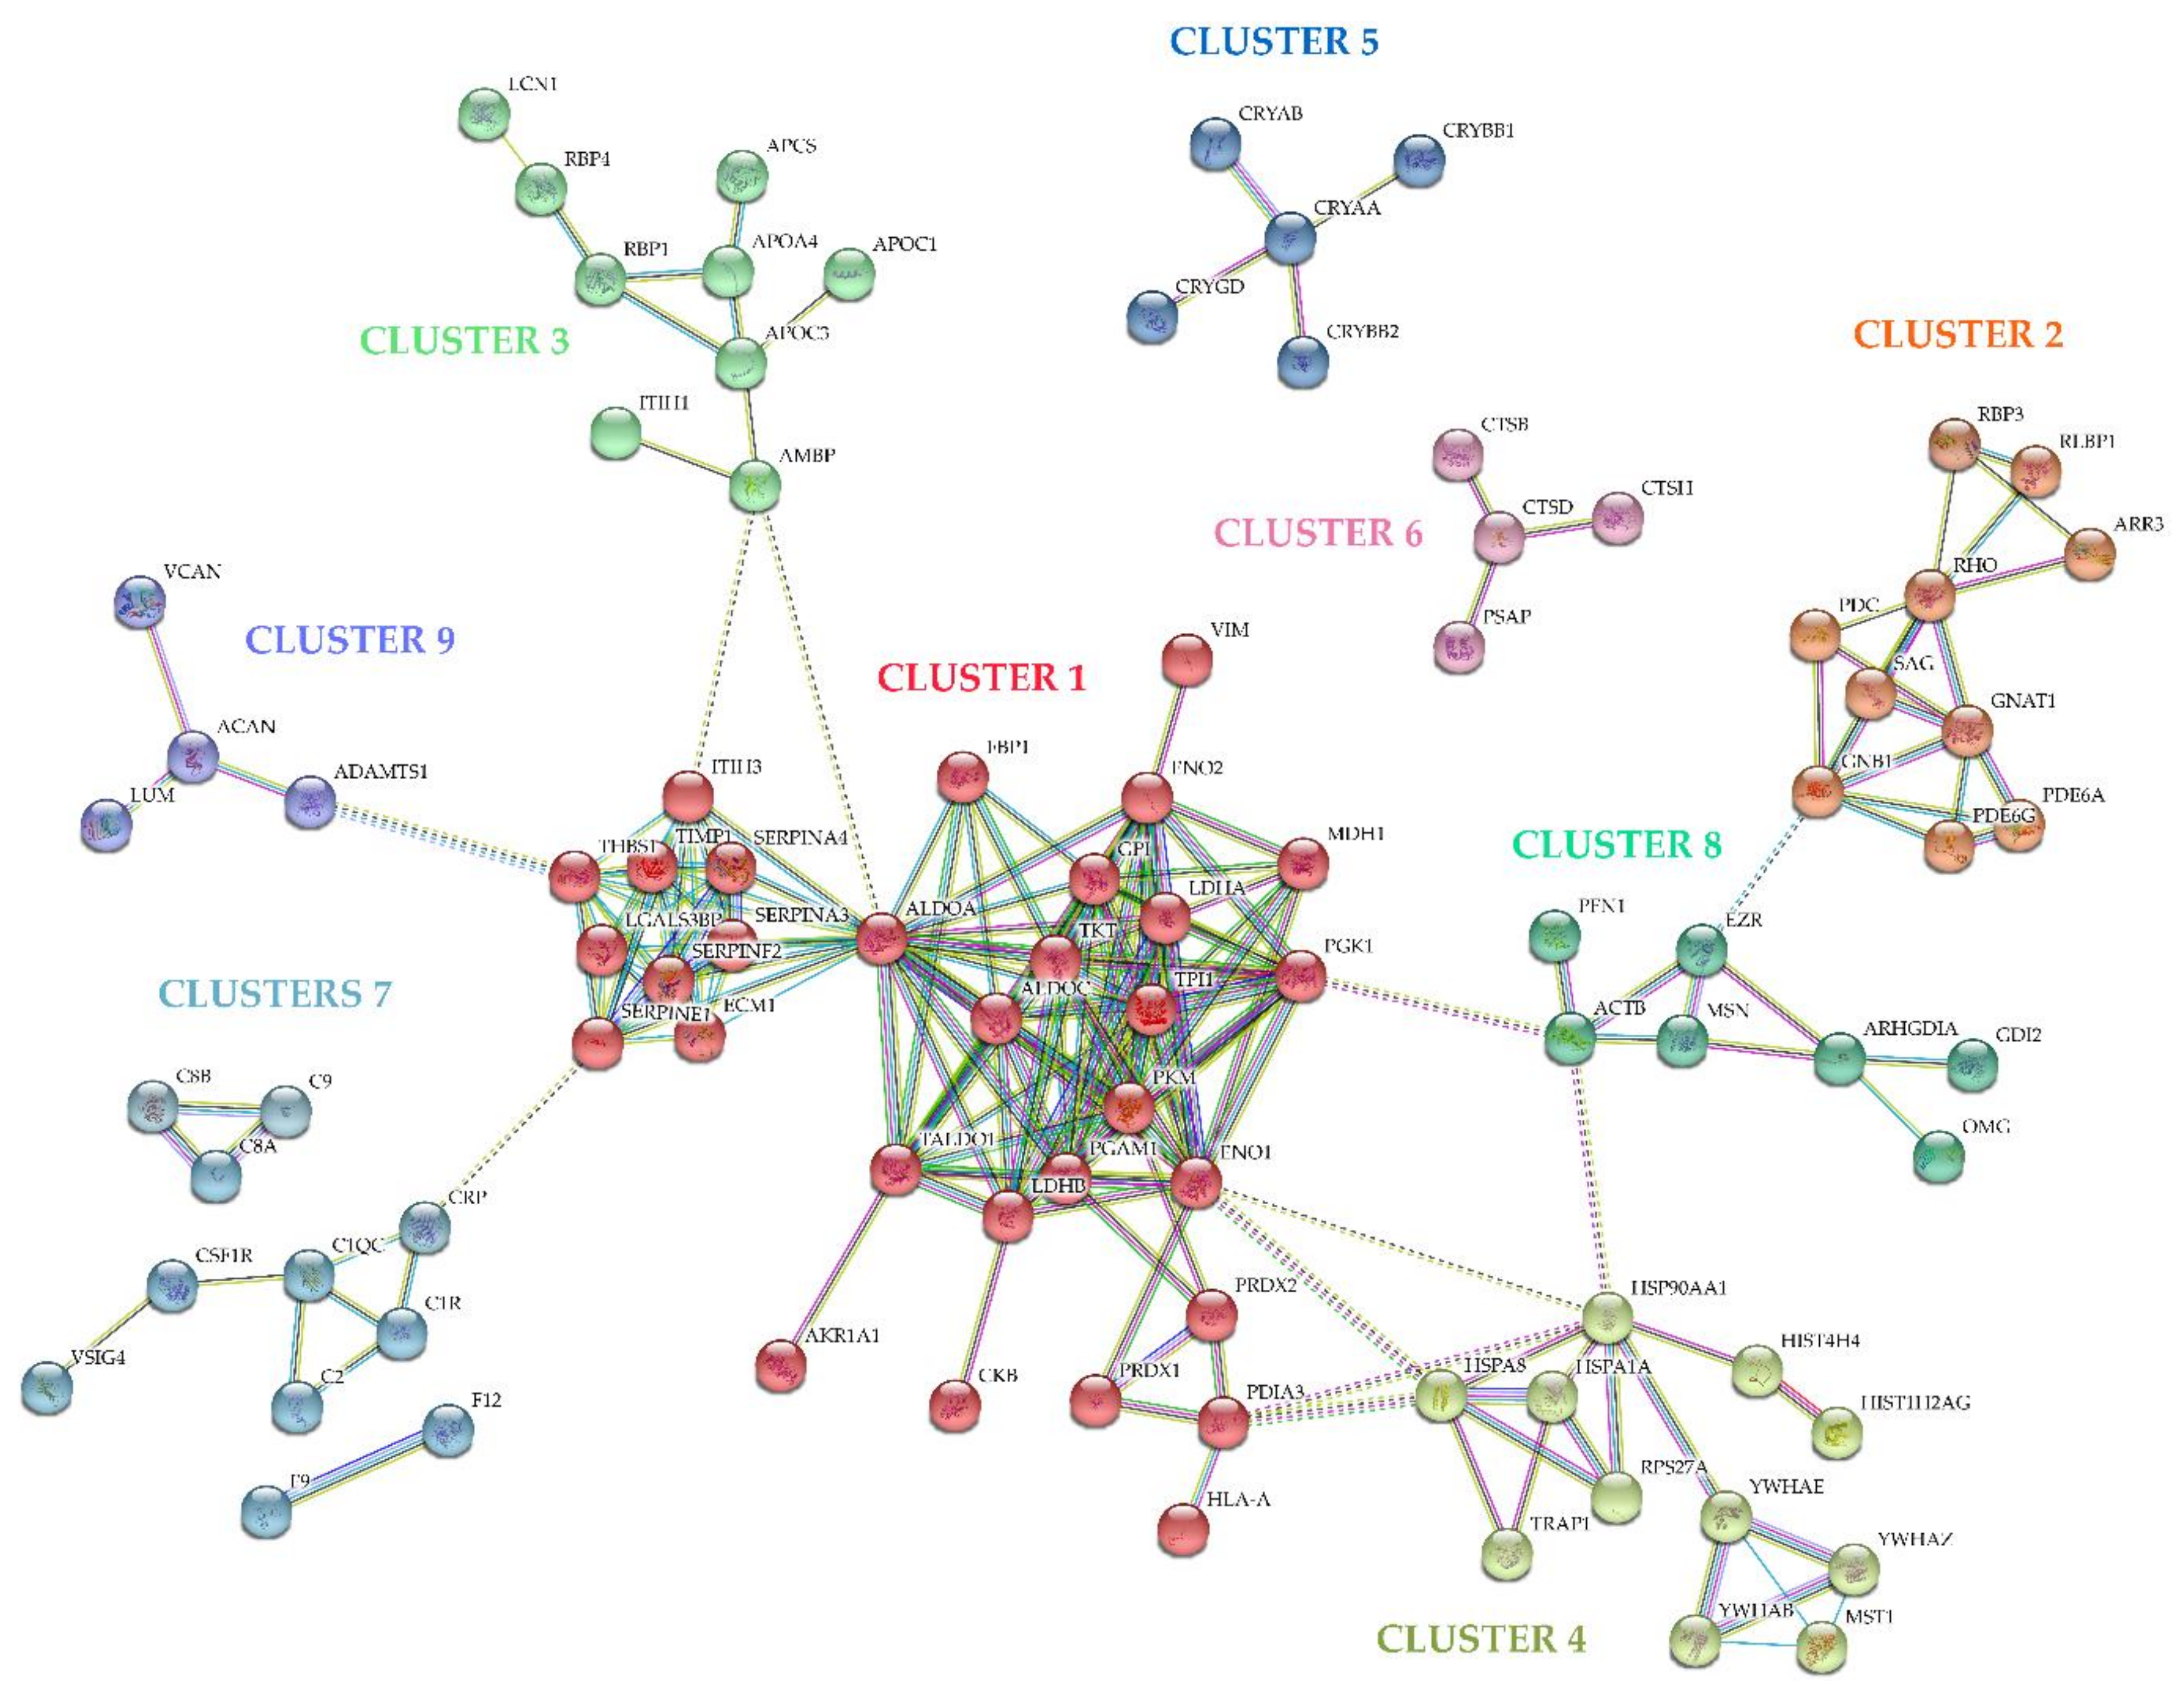
2.2. Vitreous Proteome in Rhegmatogenous Retinal Detachment (RRD)
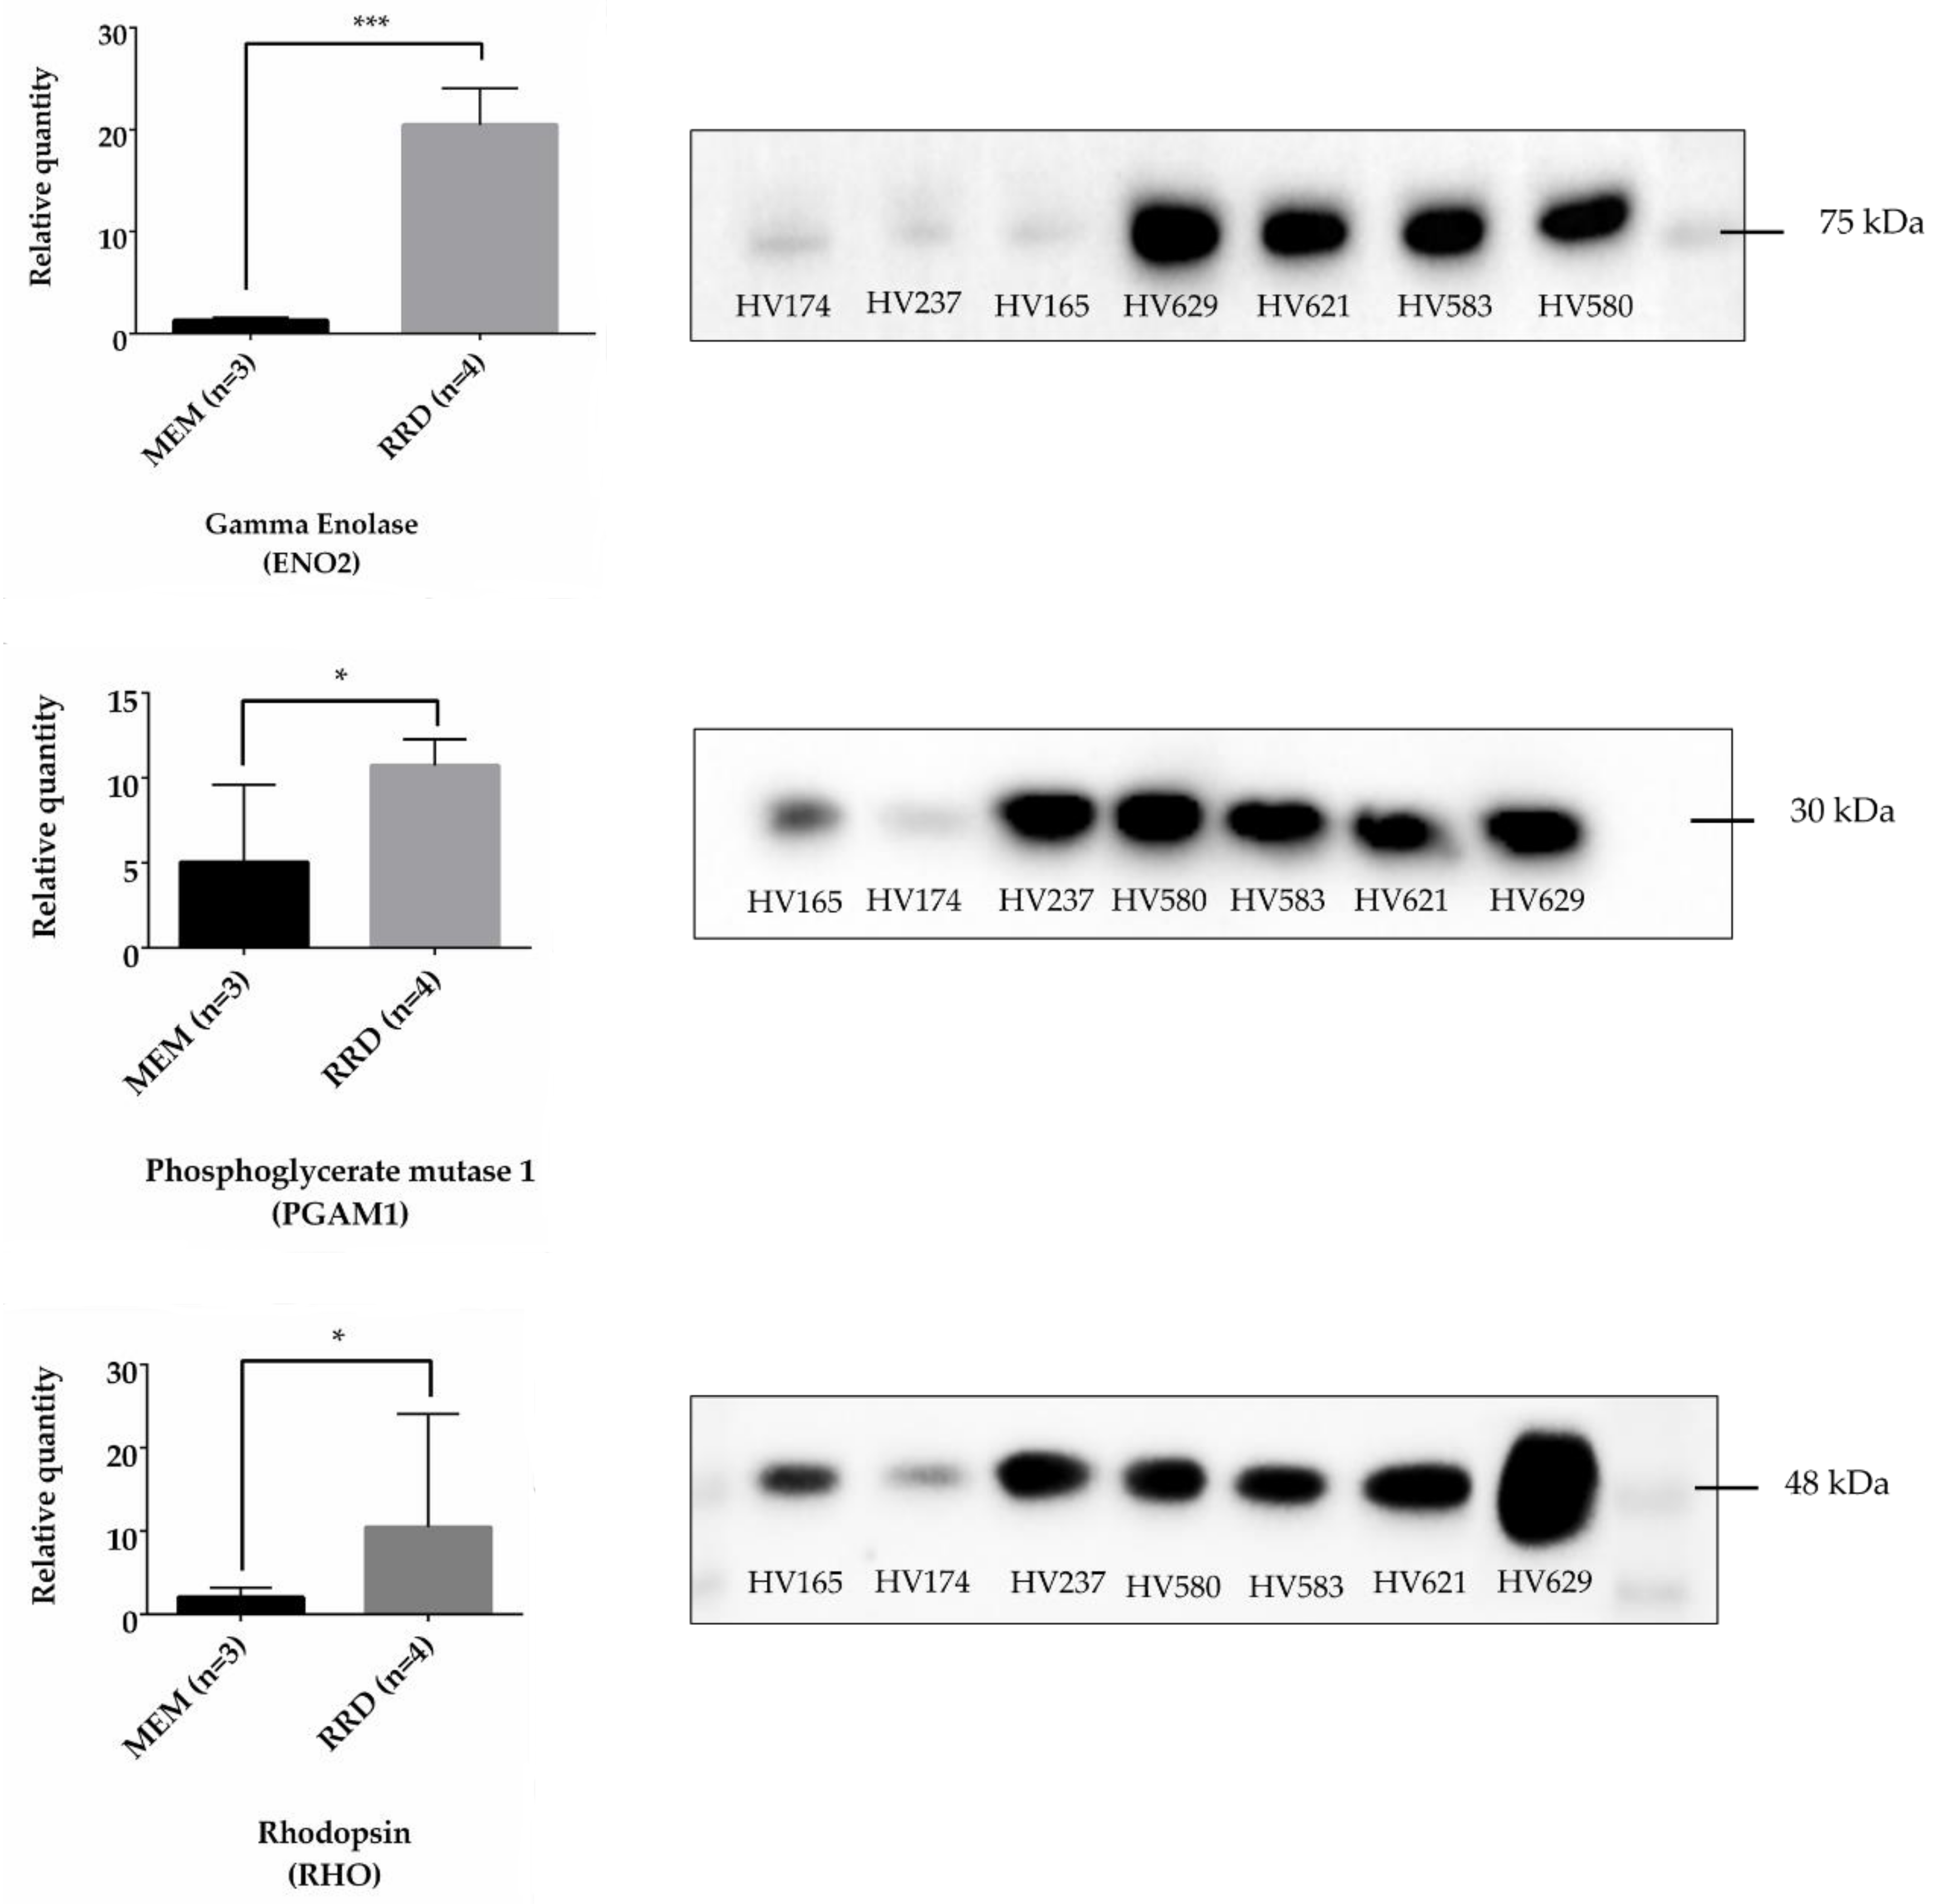
2.3. Protein Validation by Western Blotting
3. Discussion
4. Materials and Methods
4.1. Demographics and Clinical Variables
4.2. Vitreous Samples Handling
4.3. In-Solution Digestion and iTRAQ Labeling
4.4. 2D-Nano-LC-ESI-MS/MS Analysis
4.5. MS/MS Data Analysis
4.6. Bioinformatic Analysis
4.7. Validation by Western Blotting
5. Conclusions
Supplementary Materials
Acknowledgments
Author Contributions
Conflicts of Interest
Abbreviations
| 2D-LC-MS/MS | Two-dimensional liquid chromatography-electrospray tandem mass spectrometry |
| AKR1A1 | Alcohol dehydrogenase [NADP(+)] |
| ALDOA | Fructose-bisphosphate aldolase A |
| ALDOC | Fructose-bisphosphate aldolase C |
| APOA4 | Apolipoprotein A-IV |
| APOC2 | Apolipoprotein C-II |
| APOC3 | Apolipoprotein C-III |
| BRB | Blood-retinal barrier |
| C1R | Complement component 1 |
| C8A | Complement component 8 |
| C8B | Complement component 8 |
| C9 | Complement component 9 |
| ENO2 | Enolase 2 |
| F12 | Coagulation factor XII |
| F9 | Coagulation factor IX |
| FBP1 | Fructose-1,6-bisphosphatase 1 |
| GO | Gene ontology |
| GPI | Glucose-6-phosphate isomerase |
| GSTP1 | Gstp1 |
| HIF-1 | Transcriptional regulator hypoxia-inducible factor-1 |
| iTRAQ | Isobaric tags for relative and absolute quantitation |
| KEGG | Kyoto encyclopedia of genes and genomes |
| LC-ESI-MS/MS | Liquid chromatography-electrospray ion trap-mass spectrometry-mass spectrometry |
| LDHB | L-lactate dehydrogenase |
| MALDI-TOF/TOF | Matrix-assisted laser desorption/ionization-tandem time-of-flight mass spectrometry |
| MEM | Macular epiretinal membranes |
| NSR | Neurosensory retina |
| PDC | Phosducin |
| PDE6G | Retinal rod rhodopsin-sensitive cgmp 3~,5~-cyclic phosphodiesterase |
| PGAM1 | Phosphoglycerate mutase 1 |
| PGK1 | Phosphoglycerate kinase 1 |
| PKM | Pyruvate kinase |
| PVR | Proliferative vitreoretinopathy |
| RBP1 | Retinol-binding protein 1 |
| RBP3 | Retinol-binding protein 3 |
| RBP4 | Retinol-binding protein 4 |
| RD | Retinal detachment |
| RD | Retinal detachment |
| RHO | Rhodopsin |
| RLBP1 | Retinaldehyde-binding protein 1 |
| ROS | Retinal rod outer segment |
| RPE | Retinal pigment epithelium |
| RRD | Rhegmatogenous retinal detachment |
| RRDCD | Rhegmatogenous retinal detachment associated with choroidal detachment |
| SAG | S-arrestin |
| SLC2A1 | solute carrier family 2, facilitated glucose transporter member 1 |
| STRAP | Software Tool for Rapid Annotation of Proteins |
| STRING | Search Tool for the Retrieval of Interacting Genes/Proteins |
| TALDO1 | Transaldolase |
| TPI1 | Triosephosphate isomerase |
| VEGF-A | Vascular endothelial growth factor A |
| VEGF-B | Vascular endothelial growth factor B |
| WB | Western blotting |
References
- Mitry, D.; Charteris, D.G.; Fleck, B.W.; Campbell, H.; Singh, J. The epidemiology of rhegmatogenous retinal detachment: Geographical variation and clinical associations. Br. J. Ophthalmol. 2010, 94, 678–684. [Google Scholar] [CrossRef] [PubMed]
- Kang, H.K.; Luff, A.J. Management of retinal detachment: A guide for non-ophthalmologists. BMJ 2008, 336, 1235–1240. [Google Scholar] [CrossRef] [PubMed]
- Ghazi, N.G.; Green, W.R. Pathology and pathogenesis of retinal detachment. Eye 2002, 16, 411–421. [Google Scholar] [CrossRef] [PubMed]
- Kuhn, F.; Aylward, B. Rhegmatogenous retinal detachment: A reappraisal of its pathophysiology and treatment. Ophthalmic Res. 2014, 51, 15–31. [Google Scholar] [CrossRef] [PubMed]
- Delyfer, M.-N.; Raffelsberger, W.; Mercier, D.; Korobelnik, J.-F.; Gaudric, A.; Charteris, D.G.; Tadayoni, R.; Metge, F.; Caputo, G.; Barale, P.-O.; et al. Transcriptomic Analysis of Human Retinal Detachment Reveals Both Inflammatory Response and Photoreceptor Death. PLoS ONE 2011, 6, e28791. [Google Scholar] [CrossRef] [PubMed] [Green Version]
- Nemet, A.; Moshiri, A.; Yiu, G.; Loewenstein, A.; Moisseiev, E. A Review of Innovations in Rhegmatogenous Retinal Detachment Surgical Techniques. J. Ophthalmol. 2017, 2017, 1–5. [Google Scholar] [CrossRef] [PubMed]
- Mitry, D.; Fleck, B.W.; Wright, A.F.; Campbell, H.; Charteris, D.G. Pathogenesis of rhegmatogenous retinal detachment: Predisposing anatomy and cell biology. Retina 2010, 30, 1561–1572. [Google Scholar] [CrossRef] [PubMed]
- Haugstad, M.; Moosmayer, S.; Bragadόttir, R. Primary rhegmatogenous retinal detachment—Surgical methods and anatomical outcome. Acta Ophthalmol. 2017, 95, 247–251. [Google Scholar] [CrossRef] [PubMed]
- Sahanne, S.; Tuuminen, R.; Haukka, J.; Loukovaara, S. A retrospective study comparing outcomes of primary rhegmatogenous retinal detachment repair by scleral buckling and pars plana vitrectomy in Finland. Clin. Ophthalmol. 2017, 11, 503–509. [Google Scholar] [CrossRef] [PubMed]
- Feltgen, N.; Walter, P. Rhegmatogenous retinal detachment—An ophthalmologic emergency. Dtsch. Arztebl. Int. 2014, 111, 12–22. [Google Scholar] [CrossRef] [PubMed]
- Wu, Z.; Ding, N.; Yu, M.; Wang, K.; Luo, S.; Zou, W.; Zhou, Y.; Yan, B.; Jiang, Q. Identification of Potential Biomarkers for Rhegmatogenous Retinal Detachment Associated with Choroidal Detachment by Vitreous iTRAQ-Based Proteomic Profiling. Int. J. Mol. Sci. 2016, 17, 2052. [Google Scholar] [CrossRef] [PubMed]
- Tuuminen, R.; Haukka, J.; Loukovaara, S. Statins in rhegmatogenous retinal detachment are associated with low intravitreal angiopoietin-2, VEGF and MMP-2 levels, and improved visual acuity gain in vitrectomized patients. Graefes Arch. Clin. Exp. Ophthalmol. 2015, 253, 1685–1693. [Google Scholar] [CrossRef] [PubMed]
- Angi, M.; Kalirai, H.; Coupland, S.E.; Damato, B.E.; Semeraro, F.; Romano, M.R. Proteomic Analyses of the Vitreous Humour. Mediat. Inflamm. 2012, 2012, 1–7. [Google Scholar] [CrossRef] [PubMed]
- Shitama, T.; Hayashi, H.; Noge, S.; Uchio, E.; Oshima, K.; Haniu, H.; Takemori, N.; Komori, N.; Matsumoto, H. Proteome Profiling of Vitreoretinal Diseases by Cluster Analysis. Proteom. Clin. Appl. 2008, 2, 1265–1280. [Google Scholar] [CrossRef] [PubMed]
- Rocha, A.S.; Santos, F.M.; Monteiro, J.P.; Castro-de-Sousa, J.P.; Queiroz, J.A.; Passarinha, L.P. Trends in proteomic analysis of human vitreous humor samples. Electrophoresis 2014, 35, 2495–2508. [Google Scholar] [CrossRef] [PubMed]
- Pollreisz, A.; Funk, M.; Breitwieser, F.F.P.F.; Parapatics, K.; Sacu, S.; Georgopoulos, M.; Dunavoelgyi, R.; Zlabinger, G.J.; Colinge, J.; Bennett, K.L.; et al. Quantitative proteomics of aqueous and vitreous fluid from patients with idiopathic epiretinal membranes. Exp. Eye Res. 2013, 108, 48–58. [Google Scholar] [CrossRef] [PubMed]
- Silberring, J.; Ciborowski, P. Biomarker discovery and clinical proteomics. TrAC Trends Anal. Chem. 2010, 29, 128–140. [Google Scholar] [CrossRef] [PubMed]
- Monteiro, J.P.J.P.; Santos, F.M.F.M.; Rocha, A.S.A.S.; Castro-de-Sousa, J.P.J.P.; Queiroz, J.A.J.A.; Passarinha, L.A.L.A.; Tomaz, C.T.C.T. Vitreous humor in the pathologic scope: Insights from proteomic approaches. Proteom. Clin. Appl. 2015, 9, 187–202. [Google Scholar] [CrossRef] [PubMed]
- Gaspar, L.M.; Santos, F.M.; Albuquerque, T.; Castro-de-Sousa, J.P.; Passarinha, L.A.; Tomaz, C.T. Proteome analysis of vitreous humor in retinal detachment using two different flow-charts for protein fractionation. J. Chromatogr. B Anal. Technol. Biomed. Life Sci. 2017, 1061–1062, 334–341. [Google Scholar] [CrossRef] [PubMed]
- Kuo, H.-K.; Chen, Y.-H.; Huang, F.; Wu, Y.-C.; Shiea, J.; Wu, P.-C. The upregulation of zinc finger protein 670 and prostaglandin D2 synthase in proliferative vitreoretinopathy. Graefes Arch. Clin. Exp. Ophthalmol. 2016, 254, 205–213. [Google Scholar] [CrossRef] [PubMed]
- Yu, J.; Liu, F.; Cui, S.-J.; Liu, Y.; Song, Z.-Y.; Cao, H.; Chen, F.-E.; Wang, W.-J.; Sun, T.; Wang, F. Vitreous proteomic analysis of proliferative vitreoretinopathy. Proteomics 2008, 8, 3667–3678. [Google Scholar] [CrossRef] [PubMed]
- Yu, J.; Peng, R.; Chen, H.; Cui, C.; Ba, J. Elucidation of the Pathogenic Mechanism of Rhegmatogenous Retinal Detachment with Proliferative Vitreoretinopathy by Proteomic Analysis. Investig. Opthalmol. Vis. Sci. 2012, 53, 8146. [Google Scholar] [CrossRef] [PubMed]
- Nakanishi, T.; Koyama, R.; Ikeda, T.; Shimizu, A. Catalogue of soluble proteins in the human vitreous humor: Comparison between diabetic retinopathy and macular hole. J. Chromatogr. B Anal. Technol. Biomed. Life Sci. 2002, 776, 89–100. [Google Scholar] [CrossRef]
- Yamane, K.; Minamoto, A.; Yamashita, H.; Takamura, H.; Miyamoto-Myoken, Y.; Yoshizato, K.; Nabetani, T.; Tsugita, A.; Mishima, H.K. Proteome analysis of human vitreous proteins. Mol. Cell. Proteom. 2003, 2, 1177–1187. [Google Scholar] [CrossRef] [PubMed]
- Wu, C.W.; Sauter, J.L.; Johnson, P.K.; Chen, C.-D.; Olsen, T.W. Identification and localization of major soluble vitreous proteins in human ocular tissue. Am. J. Ophthalmol. 2004, 137, 655–661. [Google Scholar] [CrossRef] [PubMed]
- Ouchi, M.; West, K.; Crabb, J.W.; Kinoshita, S.; Kamei, M. Proteomic analysis of vitreous from diabetic macular edema. Exp. Eye Res. 2005, 81, 176–182. [Google Scholar] [CrossRef] [PubMed]
- Kim, T.; Kim, S.J.; Kim, K.; Kang, U.-B.; Lee, C.; Park, K.S.; Yu, H.G.; Kim, Y. Profiling of vitreous proteomes from proliferative diabetic retinopathy and nondiabetic patients. Proteomics 2007, 7, 4203–4215. [Google Scholar] [CrossRef] [PubMed]
- Gao, B.B.-B.B.; Chen, X.; Timothy, N.; Aiello, L.P.; Feener, E.P. Characterization of the vitreous proteome in diabetes without diabetic retinopathy and diabetes with proliferative diabetic retinopathy. J. Proteome Res. 2008, 7, 2516–2525. [Google Scholar] [CrossRef] [PubMed]
- Aretz, S.; Krohne, T.U.; Kammerer, K.; Warnken, U.; Hotz-Wagenblatt, A.; Bergmann, M.; Stanzel, B.V.; Kempf, T.; Holz, F.G.; Schnölzer, M.; et al. In-depth mass spectrometric mapping of the human vitreous proteome. Proteome Sci. 2013, 11, 10. [Google Scholar] [CrossRef] [PubMed]
- Murthy, K.R.; Goel, R.; Subbannayya, Y.; Jacob, H.K.; Murthy, P.R.; Manda, S.; Patil, A.H.; Sharma, R.; Sahasrabuddhe, N.A.; Parashar, A.; et al. Proteomic analysis of human vitreous humor. Clin. Proteom. 2014, 11, 29. [Google Scholar] [CrossRef] [PubMed]
- Koss, M.J.; Hoffmann, J.; Nguyen, N.; Pfister, M.; Mischak, H.; Mullen, W.; Husi, H.; Rejdak, R.; Koch, F.; Jankowski, J.; et al. Proteomics of vitreous humor of patients with exudative age-related macular degeneration. PLoS ONE 2014, 9, 1–11. [Google Scholar] [CrossRef] [PubMed]
- Loukovaara, S.; Nurkkala, H.; Tamene, F.; Gucciardo, E.; Liu, X.; Repo, P.; Lehti, K.; Varjosalo, M. Quantitative Proteomics Analysis of Vitreous Humor from Diabetic Retinopathy Patients. J. Proteome Res. 2015, 14, 5131–5143. [Google Scholar] [CrossRef] [PubMed]
- Reich, M.; Dacheva, I.; Nobl, M.; Siwy, J.; Schanstra, J.P.; Mullen, W.; Koch, F.H.J.J.; Kopitz, J.; Kretz, F.T.A.A.; Auffarth, G.U.; et al. Proteomic Analysis of Vitreous Humor in Retinal Vein Occlusion. PLoS ONE 2016, 11, e0158001. [Google Scholar] [CrossRef] [PubMed]
- Skeie, J.M.; Roybal, C.N.; Mahajan, V.B. Proteomic insight into the molecular function of the vitreous. PLoS ONE 2015, 10, 1–19. [Google Scholar] [CrossRef] [PubMed]
- Nobl, M.; Reich, M.; Dacheva, I.; Siwy, J.; Mullen, W.; Schanstra, J.P.; Choi, C.Y.; Kopitz, J.; Kretz, F.T.A.; Auffarth, G.U.; et al. Proteomics of vitreous in neovascular age-related macular degeneration. Exp. Eye Res. 2016, 146, 107–117. [Google Scholar] [CrossRef] [PubMed]
- Stone, J.; Maslim, J.; Valter-Kocsi, K.; Mervin, K.; Bowers, F.; Chu, Y.; Barnett, N.; Provis, J.; Lewis, G.; Fisher, S.K.; et al. Mechanisms of photoreceptor death and survival in mammalian retina. Prog. Retin. Eye Res. 1999, 18, 689–735. [Google Scholar] [CrossRef]
- Narayan, D.S.; Chidlow, G.; Wood, J.P.M.; Casson, R.J. Glucose metabolism in mammalian photoreceptor inner and outer segments. Clin. Exp. Ophthalmol. 2017, 45, 730–741. [Google Scholar] [CrossRef] [PubMed]
- Mandal, N.; Lewis, G.P.; Fisher, S.K.; Heegaard, S.; Prause, J.U.; la Cour, M.; Vorum, H.; Honoré, B. Protein changes in the retina following experimental retinal detachment in rabbits. Mol. Vis. 2011, 17, 2634–2648. [Google Scholar] [PubMed]
- Bolaños, J.P.; Almeida, A.; Moncada, S. Glycolysis: A bioenergetic or a survival pathway? Trends Biochem. Sci. 2010, 35, 145–149. [Google Scholar] [CrossRef] [PubMed]
- Ganea, E.; Harding, J.J. Glutathione-related enzymes and the eye. Curr. Eye Res. 2006, 31, 1–11. [Google Scholar] [CrossRef] [PubMed]
- Bhosale, P.; Larson, A.J.; Frederick, J.M.; Southwick, K.; Thulin, C.D.; Bernstein, P.S. Identification and characterization of a Pi isoform of glutathione S-transferase (GSTP1) as a zeaxanthin-binding protein in the macula of the human eye. J. Biol. Chem. 2004, 279, 49447–49454. [Google Scholar] [CrossRef] [PubMed]
- Lee, W.-H.; Joshi, P.; Wen, R. Glutathione S-Transferase Pi Isoform (GSTP1) expression in murine retina increases with developmental maturity. In Advances in Experimental Medicine and Biology; Bowes Rickman, C., LaVail, M.M., Anderson, R.E., Grimm, C., Hollyfield, J., Ash, J., Eds.; Springer: Cham, Switzerland, 2014; Volume 854, pp. 23–30. ISBN 978-3-319-17120-3. [Google Scholar]
- Aït-Ali, N.; Fridlich, R.; Millet-Puel, G.; Clérin, E.; Delalande, F.; Jaillard, C.; Blond, F.; Perrocheau, L.; Reichman, S.; Byrne, L.C.; et al. Rod-derived cone viability factor promotes cone survival by stimulating aerobic glycolysis. Cell 2015, 161, 817–832. [Google Scholar] [CrossRef] [PubMed]
- Chertov, A.O.; Holzhausen, L.; Kuok, I.T.; Couron, D.; Parker, E.; Linton, J.D.; Sadilek, M.; Sweet, I.R.; Hurley, J.B. Roles of glucose in photoreceptor survival. J. Biol. Chem. 2011, 286, 34700–34711. [Google Scholar] [CrossRef] [PubMed]
- Li, M.; Li, H.; Jiang, P.; Liu, X.; Xu, D.; Wang, F. Investigating the pathological processes of rhegmatogenous retinal detachment and proliferative vitreoretinopathy with metabolomics analysis. Mol. Biosyst. 2014, 10, 1055–1062. [Google Scholar] [CrossRef] [PubMed]
- Vadlapatla, R.K.; Vadlapudi, A.D.; Mitra, A.K. Hypoxia-inducible factor-1 (HIF-1): A potential target for intervention in ocular neovascular diseases. Curr. Drug Targets 2013, 14, 919–935. [Google Scholar] [CrossRef] [PubMed]
- Semenza, G.L. Hypoxia-inducible factor 1: Control of oxygen homeostasis in health and disease. Pediatr. Res. 2001, 49, 614–617. [Google Scholar] [CrossRef] [PubMed]
- Kannan, R.; Sreekumar, P.G.; Hinton, D.R. Novel roles for α-crystallins in retinal function and disease. Prog. Retin. Eye Res. 2012, 31, 576–604. [Google Scholar] [CrossRef] [PubMed]
- Yao, J.; Liu, X.; Yang, Q.; Zhuang, M.; Wang, F.; Chen, X.; Hang, H.; Zhang, W.; Liu, Q. Proteomic analysis of the aqueous humor in patients with wet age-related macular degeneration. Proteom. Clin. Appl. 2013, 7, 550–560. [Google Scholar] [CrossRef] [PubMed]
- Garrido, C.; Gurbuxani, S.; Ravagnan, L.; Kroemer, G. Heat Shock Proteins: Endogenous Modulators of Apoptotic Cell Death. Biochem. Biophys. Res. Commun. 2001, 286, 433–442. [Google Scholar] [CrossRef] [PubMed]
- Kayama, M.; Nakazawa, T.; Thanos, A.; Morizane, Y.; Murakami, Y.; Theodoropoulou, S.; Abe, T.; Vavvas, D.; Miller, J.W. Heat shock protein 70 (HSP70) is critical for the photoreceptor stress response after retinal detachment via modulating anti-apoptotic Akt kinase. Am. J. Pathol. 2011, 178, 1080–1091. [Google Scholar] [CrossRef] [PubMed]
- Urbak, L.; Vorum, H. Heat Shock Proteins in the Human Eye. Int. J. Proteom. 2010, 2010, 1–8. [Google Scholar] [CrossRef] [PubMed]
- Inamdar, S.M.; Lankford, C.K.; Laird, J.G.; Novbatova, G.; Tatro, N.; Whitmore, S.S.; Scheetz, T.E.; Baker, S.A. Analysis of 14-3-3 isoforms expressed in photoreceptors. Exp. Eye Res. 2018, 170, 108–116. [Google Scholar] [CrossRef] [PubMed]
- Nakano, K.; Chen, J.; Tarr, G.E.; Yoshida, T.; Flynn, J.M.; Bitensky, M.W. Rethinking the role of phosducin: Light-regulated binding of phosducin to 14-3-3 in rod inner segments. Proc. Natl. Acad. Sci. USA 2001, 98, 4693–4698. [Google Scholar] [CrossRef] [PubMed]
- Hayasaka, S. Lysosomal enzymes in ocular tissues and diseases. Surv. Ophthalmol. 1983, 27, 245–258. [Google Scholar] [CrossRef]
- Mahon, G.J.; Anderson, H.R.; Gardiner, T.A.; McFarlane, S.; Archer, D.B.; Stitt, A.W. Chloroquine causes lysosomal dysfunction in neural retina and RPE: Implications for retinopathy. Curr. Eye Res. 2004, 28, 277–284. [Google Scholar] [CrossRef] [PubMed]
- Quintyn, J.C.; Brasseur, G. Subretinal fluid in primary rhegmatogenous retinal detachment: Physiopathology and composition. Surv. Ophthalmol. 2004, 49, 96–108. [Google Scholar] [CrossRef] [PubMed]
- Hayasaka, S.; Hara, S.; Mizuno, K. Lysosomal Enzymes in Subretinal Fluid. Albrecht Graefes Arch. Klin. Exp. Ophthalmol. 1976, 20, 13–20. [Google Scholar] [CrossRef]
- Im, E.; Kazlauskas, A. The role of cathepsins in ocular physiology and pathology. Exp. Eye Res. 2007, 84, 383–388. [Google Scholar] [CrossRef] [PubMed]
- Molday, R.S.; Moritz, O.L. Photoreceptors at a glance. J. Cell Sci. 2015, 128, 4039–4045. [Google Scholar] [CrossRef] [PubMed]
- Wensel, T.G. Signal transducing membrane complexes of photoreceptor outer segments. Vis. Res. 2008, 48, 2052–2061. [Google Scholar] [CrossRef] [PubMed]
- Zhou, X.E.; Melcher, K.; Xu, H.E. Structure and activation of rhodopsin. Acta Pharmacol. Sin. 2012, 33, 291–299. [Google Scholar] [CrossRef] [PubMed]
- Ridge, K.D.; Palczewski, K. Visual rhodopsin sees the light: Structure and mechanism of G protein signaling. J. Biol. Chem. 2007, 282, 9297–9301. [Google Scholar] [CrossRef] [PubMed]
- Clack, J.W.; Springmeyer, M.L.; Clark, C.R.; Witzmann, F.A. Transducin subunit stoichiometry and cellular distribution in rod outer segments. Cell Biol. Int. 2006, 30, 829–835. [Google Scholar] [CrossRef] [PubMed]
- Murakami, Y.; Notomi, S.; Hisatomi, T.; Nakazawa, T.; Ishibashi, T.; Miller, J.W.; Vavvas, D.G. Photoreceptor cell death and rescue in retinal detachment and degenerations. Prog. Retin. Eye Res. 2013, 37, 114–140. [Google Scholar] [CrossRef] [PubMed]
- Arroyo, J.G.; Yang, L.; Bula, D.; Chen, D.F. Photoreceptor apoptosis in human retinal detachment. Am. J. Ophthalmol. 2005, 139, 605–610. [Google Scholar] [CrossRef] [PubMed]
- Lo, A.C.Y.; Woo, T.T.Y.; Wong, R.L.M.; Wong, D. Apoptosis and other cell death mechanisms after retinal detachment: Implications for photoreceptor rescue. Ophthalmologica 2011, 226, 10–17. [Google Scholar] [CrossRef] [PubMed]
- Okada, M.; Matsumura, M.; Ogino, N.; Honda, Y. Müller cells in detached human retina express glial fibrillary acidic protein and vimentin. Graefes Arch. Clin. Exp. Ophthalmol. 1990, 228, 467–474. [Google Scholar] [CrossRef] [PubMed]
- Lewis, G.P.; Fisher, S.K. Up-Regulation of Glial Fibrillary Acidic Protein in Response to Retinal Injury: Its Potential Role in Glial Remodeling and a Comparison to Vimentin Expression. Int. Rev. Cytol. 2003, 230, 263–290. [Google Scholar] [CrossRef] [PubMed]
- Nakazawa, T.; Takeda, M.; Lewis, G.P.; Cho, K.-S.; Jiao, J.; Wilhelmsson, U.; Fisher, S.K.; Pekny, M.; Chen, D.F.; Miller, J.W. Attenuated Glial Reactions and Photoreceptor Degeneration after Retinal Detachment in Mice Deficient in Glial Fibrillary Acidic Protein and Vimentin. Investig. Opthalmol. Vis. Sci. 2007, 48, 2760. [Google Scholar] [CrossRef] [PubMed]
- Verardo, M.R.; Lewis, G.P.; Takeda, M.; Linberg, K.A.; Byun, J.; Luna, G.; Wilhelmsson, U.; Pekny, M.; Chen, D.F.; Fisher, S.K. Abnormal reactivity of Müller cells after retinal detachment in mice deficient in GFAP and vimentin. Investig. Ophthalmol. Vis. Sci. 2008, 49, 3659–3665. [Google Scholar] [CrossRef] [PubMed]
- Quintyn, J.C.; Pereira, F.; Hellot, M.F.; Brasseur, G.; Coquerel, A. Concentration of neuron-specific enolase and S100 protein in the subretinal fluid of rhegmatogenous retinal detachment. Graefes Arch. Clin. Exp. Ophthalmol. 2005, 20, 20. [Google Scholar] [CrossRef] [PubMed]
- Dunker, S.; Sadun, A.A.; Sebag, J. Neuron specific enolase in retinal detachment. Curr. Eye Res. 2001, 23, 382–385. [Google Scholar] [CrossRef] [PubMed]
- Athanasiou, D.; Aguilà, M.; Bevilacqua, D.; Novoselov, S.S.; Parfitt, D.A.; Cheetham, M.E. The cell stress machinery and retinal degeneration. FEBS Lett. 2013, 587, 2008–2017. [Google Scholar] [CrossRef] [PubMed]
- Sebag, J. Vitreous; Sebag, J., Ed.; Springer: New York, NY, USA, 2014; ISBN 978-1-4939-1086-1. [Google Scholar]
- Morescalchi, F.; Duse, S.; Gambicorti, E.; Romano, M.R.; Costagliola, C.; Semeraro, F. Proliferative Vitreoretinopathy after eye injuries: An overexpression of growth factors and cytokines leading to a retinal keloid. Mediat. Inflamm. 2013, 2013. [Google Scholar] [CrossRef] [PubMed]
- Sadaka, A.; Giuliari, G.P. Proliferative vitreoretinopathy: Current and emerging treatments. Clin. Ophthalmol. 2012, 6, 1325–1333. [Google Scholar] [CrossRef] [PubMed]
- Yu, J.; Peng, R.; Chen, H.; Cui, C.; Ba, J.; Wang, F. Kininogen 1 and insulin-like growth factor binding protein 6: Candidate serum biomarkers of proliferative vitreoretinopathy. Clin. Exp. Optom. 2014, 97, 72–79. [Google Scholar] [CrossRef] [PubMed]
- Kersten, E.; Paun, C.C.; Schellevis, R.L.; Hoyng, C.B.; Delcourt, C.; Lengyel, I.; Peto, T.; Ueffing, M.; Klaver, C.C.W.; Dammeier, S.; et al. Systemic and ocular fluid compounds as potential biomarkers in age-related macular degeneration. Surv. Ophthalmol. 2017, 1–31. [Google Scholar] [CrossRef] [PubMed]
- Sydorova, M.; Lee, M.S. Vascular Endothelial Growth Factor Levels in Vitreous and Serum of Patients with either Proliferative Diabetic Retinopathy or Proliferative Vitreoretinopathy. Ophthalmic Res. 2005, 37, 188–190. [Google Scholar] [CrossRef] [PubMed]
- Yoshimura, T.; Sonoda, K.; Sugahara, M.; Mochizuki, Y.; Enaida, H.; Oshima, Y.; Ueno, A.; Hata, Y.; Yoshida, H.; Ishibashi, T. Comprehensive analysis of inflammatory immune mediators in vitreoretinal diseases. PLoS ONE 2009, 4, e8158. [Google Scholar] [CrossRef] [PubMed]
- Shao, J.; Xin, Y.; Li, R.; Fan, Y. Vitreous and serum levels of transthyretin (TTR) in high myopia patients are correlated with ocular pathologies. Clin. Biochem. 2011, 44, 681–685. [Google Scholar] [CrossRef] [PubMed]
- Maier, R.; Weger, M.; Haller-Schober, E.-M.; El-Shabrawi, Y.; Wedrich, A.; Theisl, A.; Aigner, R.; Barth, A.; Haas, A. Multiplex bead analysis of vitreous and serum concentrations of inflammatory and proangiogenic factors in diabetic patients. Mol. Vis. 2008, 14, 637–643. [Google Scholar] [PubMed]
- Zheng, B.; Li, T.; Chen, H.; Xu, X.; Zheng, Z. Correlation between ficolin-3 and vascular endothelial growth factor-to-pigment epithelium-derived factor ratio in the vitreous of eyes with proliferative diabetic retinopathy. Am. J. Ophthalmol. 2011, 152, 1039–1043. [Google Scholar] [CrossRef] [PubMed]
- Mesquita, J.; Castro Sousa, J.P.; Tavares-Ratado, P.; Vaz-Pereira, S.; Neves, A.; Rocha, A.S.; Santos, F.; Passarinha, L.; Tomaz, C. Comparison of serum and vitreous PIGF in diabetic retinopathy patients and non-diabetic patients. Investig. Ophthalmol. Vis. Sci. 2015, 56, 5179. [Google Scholar]
- Mesquita, J.; e Sousa, J.P.C.; Vaz-Pereira, S.; Neves, A.; Passarinha, L.; Tomaz, C. Quantitative analysis and correlation of VEGF-A and VEGF-B in serum and vitreous humor of patients with proliferative vs non-proliferative ocular disease. Investig. Ophthalmol. Vis. Sci. 2017, 58, 604. [Google Scholar]
- Mesquita, J.; Castro de Sousa, J.; Vaz-Pereira, S.; Neves, A.; Tavares-Ratado, P.; Santos, F.M.; Passarinha, L.A.; Tomaz, C.T. VEGF-B Levels in the Vitreous of Diabetic and Non-Diabetic Patients with Ocular Diseases and Its Correlation with Structural Parameters. Med. Sci. 2017, 5, 17. [Google Scholar] [CrossRef] [PubMed]
- Paradela, A.; Mariscotti, J.F.; Navajas, R.; Ramos-Fernández, A.; Albar, J.P.; García-del Portillo, F. Inverse regulation in the metabolic genes pckA and metE revealed by proteomic analysis of the Salmonella RcsCDB regulon. J. Proteome Res. 2011, 10, 3386–3398. [Google Scholar] [CrossRef] [PubMed]
- Mateos, J.; Carneiro, I.; Corrales, F.; Elortza, F.; Paradela, A.; del Pino, M.S.; Iloro, I.; Marcilla, M.; Mora, M.I.; Valero, L.; et al. Multicentric study of the effect of pre-analytical variables in the quality of plasma samples stored in biobanks using different complementary proteomic methods. J. Proteom. 2017, 150, 109–120. [Google Scholar] [CrossRef] [PubMed]
- Uniprot. Available online: http://www.uniprot.org/ (accessed on 22 March 2014).
- STRING: Functional Protein Association Networks. Available online: https://string-db.org/ (accessed on 27 November 2017).
- Szklarczyk, D.; Franceschini, A.; Wyder, S.; Forslund, K.; Heller, D.; Huerta-Cepas, J.; Simonovic, M.; Roth, A.; Santos, A.; Tsafou, K.P.; Kuhn, M.; et al. STRING v10: Protein–protein interaction networks, integrated over the tree of life. Nucleic Acids Res. 2015, 43, D447–D452. [Google Scholar] [CrossRef] [PubMed]
- Reactome Pathway Database. Available online: https://reactome.org/ (accessed on 26 March 2018).
- KEGG: Kyoto Encyclopedia of Genes and Genomes. Available online: http://www.kegg.jp/kegg/ (accessed on 26 March 2018).


| Demographic and Clinical Characteristics | RRD 1 (n = 8) | MEM 1 (n = 7) | |
|---|---|---|---|
| Demographic characteristics of patients | Gender 2 | M = 3; F = 5 | M = 3; F = 4 |
| Age (MD ± SD) | 64 ± 7 | 76 ± 5 | |
| Age (range) | 52–69 | 69–84 | |
| Eye Submitted to PPV 3 | LE = 3; RE = 5 | LE = 5; RE = 2 | |
| Characterization of retinal detachment | Macula-off/Macula-in | 5/3 | |
| Extent of retinal detachment (n/ntotal) 4 | |||
| 1 quadrant | 3/8 | ||
| 2 quadrants | 2/8 | ||
| 3 quadrants | 2/8 | ||
| 4 quadrants | 1/8 | ||
| Multiple detachments (n/ntotal) 4 | 4/8 | ||
| Characterization of vitreous samples | Protein concentration (µg/µL, MD ± SD) | 3.12 ± 2.96 | 2.66 ± 1.63 |
| iTRAQ label | 116 (n = 4) | 114 (n = 4) | |
| Validation by Western blotting | n = 4 | n = 3 | |
| Accession | Description | Gene | Score | Number of Peptides (Total/Unique) | Coverage | RRD/MEM Ratio 1 |
|---|---|---|---|---|---|---|
| P06727 | Apolipoprotein A-IV | APOA4 | 2834 | 119/3 | 49.7 | 0.002 *** |
| P02753 | Retinol-binding protein 4 | RBP4 | 222 | 10/1 | 10.4 | 0.003 *** |
| O95447 | Lebercilin-like protein | LCA5L | 25 | 2/0 | 2.2 | 0.003 *** |
| P50213 | Isocitrate dehydrogenase [NAD] subunit alpha, mitochondrial | IDH3A | 35 | 2/0 | 2.7 | 0.004 *** |
| Q96BN8 | Ubiquitin thioesterase otulin | FAM105B | 28 | 2/0 | 2.0 | 0.005 *** |
| Q8NBP7 | Proprotein convertase subtilisin/kexin type 9 | PCSK9 | 32 | 2/0 | 3.2 | 0.038 *** |
| P01011 | Alpha-1-antichymotrypsin | SERPINA3 | 1786 | 63/2 | 23.4 | 0.040 *** |
| P02748 | Complement component C9 | C9 | 1126 | 47/3 | 13.4 | 0.058 *** |
| P02655 | Apolipoprotein C-II | APOC2 | 214 | 6/2 | 20.4 | 0.110 *** |
| P02656 | Apolipoprotein C-III | APOC3 | 319 | 10/1 | 26.3 | 0.139 *** |
| Q9HAZ2 | PR domain zinc finger protein 16 | PRDM16 | 28 | 2/0 | 0.5 | 0.162 *** |
| P43652 | Afamin | AFM | 1336 | 45/7 | 13.2 | 0.162 *** |
| P02750 | Leucine-rich alpha-2-glycoprotein | LRG1 | 1108 | 39/5 | 24.6 | 0.177 *** |
| Q6UXB8 | Peptidase inhibitor 16 | PI16 | 234 | 11/3 | 4.7 | 0.211 *** |
| P13646 | Keratin, type I cytoskeletal 13 | KRT13 | 440 | 12/5 | 16.0 | 0.230 *** |
| P35542 | Serum amyloid A-4 protein | SAA4 | 129 | 4/1 | 13.9 | 0.241 *** |
| Q15166 | Serum paraoxonase/lactonase 3 | PON3 | 109 | 5/0 | 4.5 | 0.255 *** |
| P20941 | Phosducin | PDC | 47 | 2/0 | 5.3 | 221.22 *** |
| P14550 | Alcohol dehydrogenase [NADP(+)] | AKR1A1 | 67 | 2/2 | 11.1 | 173.64 *** |
| P08100 | Rhodopsin | RHO | 432 | 15/1 | 11.1 | 23.646 *** |
| P10523 | S-arrestin | SAG | 1469 | 56/5 | 30.5 | 16.032 *** |
| P18545 | Retinal rod rhodopsin-sensitive cGMP 3,5-cyclic phosphodiesterase subunit gamma | PDE6G | 32 | 2/0 | 10.3 | 15.606 *** |
| P11488 | Guanine nucleotide-binding protein G(t) subunit alpha-1 | GNAT1 | 62 | 2/0 | 4.3 | 15.144 *** |
| Q9UHI8 | A disintegrin and metalloproteinase with thrombospondin motifs 1 | ADAMTS1 | 188 | 4/1 | 2.2 | 14.086 *** |
| O00560 | Syntenin-1 | SDCBP | 496 | 19/1 | 20.1 | 14.012 *** |
| P11166 | Solute carrier family 2, facilitated glucose transporter member 1 | SLC2A1 | 49 | 3/1 | 5.1 | 13.116 *** |
| Q17R60 | Interphotoreceptor matrix proteoglycan 1 | IMPG1 | 1108 | 35/8 | 9.5 | 11.116 *** |
| O43490 | Prominin-1 | PROM1 | 304 | 11/5 | 5.4 | 10.761 *** |
| P69905 | Hemoglobin subunit alpha | HBA1 | 417 | 14/3 | 24.1 | 10.528 *** |
| P51674 | Neuronal membrane glycoprotein M6-a | GPM6A | 133 | 4/2 | 7.6 | 9.061 *** |
| P62873 | Guanine nucleotide-binding protein G(I)/G(S)/G(T) subunit beta-1 | GNB1 | 332 | 13/6 | 11.2 | 8.579 *** |
| P12277 | Creatine kinase B-type | CKB | 415 | 12/5 | 12.7 | 8.576 *** |
| Q9BZV3 | Interphotoreceptor matrix proteoglycan 2 | IMPG2 | 302 | 15/1 | 4.0 | 8.451 *** |
| P16499 | Rod cGMP-specific 3′,5′-cyclic phosphodiesterase subunit alpha | PDE6A | 243 | 11/5 | 2.8 | 8.274 *** |
| P43320 | Beta-crystallin B2 | CRYBB2 | 775 | 26/4 | 37.4 | 7.078 *** |
| P62979 | Ubiquitin-40S ribosomal protein S27a | RPS27A | 247 | 5/1 | 10.3 | 6.897 *** |
| P68871 | Hemoglobin subunit beta | HBB | 343 | 13/1 | 32.3 | 6.812 *** |
| P09104 | Gamma-enolase | ENO2 | 720 | 24/0 | 14.4 | 6.478 *** |
| P02489 | Alpha-crystallin A chain | CRYAA | 122 | 5/1 | 27.7 | 6.345 *** |
| P31025 | Lipocalin-1 | LCN1 | 192 | 7/1 | 16.1 | 6.178 *** |
| P07900 | Heat shock protein HSP 90-alpha | HSP90AA1 | 414 | 12/3 | 5.6 | 6.171 *** |
| P02511 | Alpha-crystallin B chain | CRYAB | 108 | 3/1 | 22.3 | 5.648 *** |
| P02042 | Hemoglobin subunit delta | HBD | 173 | 7/2 | 23.8 | 5.595 *** |
| P09467 | Fructose-1,6-bisphosphatase 1 | FBP1 | 55 | 3/1 | 4.7 | 5.308 *** |
| P63104 | 14-3-3 protein zeta/delta | YWHAZ | 455 | 11/6 | 10.5 | 5.127 *** |
| Q12931 | Heat shock protein 75 kDa, mitochondrial | TRAP1 | 87 | 3/0 | 2.0 | 5.027 *** |
| P18669 | Phosphoglycerate mutase 1 | PGAM1 | 310 | 12/5 | 16.6 | 4.998 *** |
| P09455 | Retinol-binding protein 1 | RBP1 | 50 | 2/0 | 8.9 | 4.680 *** |
| P36222 | Chitinase-3-like protein 1 | CHI3L1 | 1472 | 55/5 | 27.1 | 4.635 *** |
| Q06830 | Peroxiredoxin-1 | PRDX1 | 234 | 9/3 | 8.8 | 4.531 *** |
| P37837 | Transaldolase | TALDO1 | 116 | 5/3 | 10.4 | 4.388 *** |
| P09972 | Fructose-bisphosphate aldolase C | ALDOC | 818 | 28/6 | 24.3 | 4.286 *** |
| P31949 | Protein S100-A11 | S100A11 | 38 | 2/0 | 8.6 | 4.258 *** |
| Experimental Set-up | Number of Identified Proteins 1 | Number of Proteins Exclusively Identified | Reference |
|---|---|---|---|
| HAPs depletion 2D-LC-MS/MS (TripleTOF 5600) | 1030 | 222 | Present study |
| HAPs depletion IEX, SDS-PAGE, MALDI-TOF/TOF | 127 | 63 | [19] |
| CE-MS (micro-TOF MS) | 101 | - | [35] |
| CE-MS (micro-TOF MS) | 94 | - | [33] |
| 2D-LC-MS/MS (LTQ Velos) | 1575 2 | 653 2 | [34] |
| RP-LC-ESI-MS/MS (Orbitrap Elite hybrid MS) | 2482 | 1696 | [32] |
| CE-MS (micro-TOF MS) | 96 | - | [31] |
| HAPs depletion SCX, SDS-PAGE, and OFFGEL, RP-LC-MS/MS (LTQ-OrbitrapVelos) | 1201 | 324 | [30] |
| SDS-PAGE and IEF, RP-LC-MS/MS (LTQ-Orbitrap XL MS) | 1110 | 302 | [29] |
| SDS-PAGE, LC-MS/MS (LTQ) | 249 | 13 | [28] |
| HAPs depletion 2DE, MALDI-TOF SDS-PAGE, LC-MALDI-TOF/TOF, and LC-MS/MS | 455 | 54 | [27] |
| 2DE, LC-Q-TOF/TOF (QTOF2) | 13 | - | [26] |
| SDS-PAGE, MALDI-TOF | 12 | - | [25] |
| 2DE, LC-Q-TOF/TOF, and MALDI-TOF | 18 | - | [24] |
| 2DE, MALDI-TOF, and LC-MS/MS (LCQ DECA) IEX, LC-MS/MS (LCQ DECA) | 54 | 19 | [23] |
© 2018 by the authors. Licensee MDPI, Basel, Switzerland. This article is an open access article distributed under the terms and conditions of the Creative Commons Attribution (CC BY) license (http://creativecommons.org/licenses/by/4.0/).
Share and Cite
Santos, F.M.; Gaspar, L.M.; Ciordia, S.; Rocha, A.S.; Castro e Sousa, J.P.; Paradela, A.; Passarinha, L.A.; Tomaz, C.T. iTRAQ Quantitative Proteomic Analysis of Vitreous from Patients with Retinal Detachment. Int. J. Mol. Sci. 2018, 19, 1157. https://doi.org/10.3390/ijms19041157
Santos FM, Gaspar LM, Ciordia S, Rocha AS, Castro e Sousa JP, Paradela A, Passarinha LA, Tomaz CT. iTRAQ Quantitative Proteomic Analysis of Vitreous from Patients with Retinal Detachment. International Journal of Molecular Sciences. 2018; 19(4):1157. https://doi.org/10.3390/ijms19041157
Chicago/Turabian StyleSantos, Fátima Milhano, Leonor Mesquita Gaspar, Sergio Ciordia, Ana Sílvia Rocha, João Paulo Castro e Sousa, Alberto Paradela, Luís António Passarinha, and Cândida Teixeira Tomaz. 2018. "iTRAQ Quantitative Proteomic Analysis of Vitreous from Patients with Retinal Detachment" International Journal of Molecular Sciences 19, no. 4: 1157. https://doi.org/10.3390/ijms19041157