Article

Cell-Specific PEAR1 Methylation Studies Reveal a Locus that Coordinates Expression of Multiple Genes

1
Department of Cardiovascular Sciences, Center for Molecular and Vascular Biology, University of Leuven, 3000 Leuven, Belgium
2
Department of Epidemiology and Prevention, IRCCS Istituto Neurologico Mediterraneo Neuromed, Via dell’Elettronica, 86077 Pozzilli (IS), Italy
*
Author to whom correspondence should be addressed.
Int. J. Mol. Sci. 2018, 19(4), 1069; https://doi.org/10.3390/ijms19041069
Submission received: 15 February 2018 / Revised: 19 March 2018 / Accepted: 28 March 2018 / Published: 3 April 2018
(This article belongs to the Special Issue DNA Methylation)

Abstract

:
Chromosomal interactions connect distant enhancers and promoters on the same chromosome, activating or repressing gene expression. PEAR1 encodes the Platelet-Endothelial Aggregation Receptor 1, a contact receptor involved in platelet function and megakaryocyte and endothelial cell proliferation. PEAR1 expression during megakaryocyte differentiation is controlled by DNA methylation at its first CpG island. We identified a PEAR1 cell-specific methylation sensitive region in endothelial cells and megakaryocytes that showed strong chromosomal interactions with ISGL20L2, RRNAD1, MRLP24, HDGF and PRCC, using available promoter capture Hi-C datasets. These genes are involved in ribosome processing, protein synthesis, cell cycle and cell proliferation. We next studied the methylation and expression profile of these five genes in Human Umbilical Vein Endothelial Cells (HUVECs) and megakaryocyte precursors. While cell-specific PEAR1 methylation corresponded to variability in expression for four out of five genes, no methylation change was observed in their promoter regions across cell types. Our data suggest that PEAR1 cell-type specific methylation changes may control long distance interactions with other genes. Further studies are needed to show whether such interaction data might be relevant for the genome-wide association data that showed a role for non-coding PEAR1 variants in the same region and platelet function, platelet count and cardiovascular risk.

Graphical Abstract

1. Introduction

The identification of long-range interactions between chromosome regions, separated by more than 100,000 bases led to the discovery of intra-chromosomal loops that juxtapose downstream enhancers close to several promoter regions. These chromosomal interactions play a key role in gene expression control [1], as they can often allow or impede interactions between the promoters and their closed target genes in the intervening DNA sequence [2,3,4,5,6,7,8,9,10,11]. Sequence-specific DNA-binding proteins may guide this process by directly repositioning these loci to relevant chromatin compartments [12,13,14,15,16]. These architectural proteins (i.e., CTCF, cohesin, etc.) are genome-wide bound to promoter-genome interactions and may interfere with gene expression through several mechanisms [17,18,19,20,21] including those that depend on DNA methylation and, moreover, such long-distance control can be coordinated in a cell-specific manner. DNA methylation at promoters and CpG islands is traditionally known to inhibit target gene expression by regulating the binding of transcription modulators to the promoter [22,23]. However, more and more examples of DNA methylation-dependent increases in gene expression are being described [24,25,26,27]. Of note, long-range interactions between CpGs and target genes have been reported [28,29]. Recently, the function of trans or long-range actions of CpG methylation has been revealed by a genome-wide study, performed on various cancer types. In this analysis, the correlation between DNA methylation at distal regulatory regions and long-range target gene expression was shown to be significantly stronger than the correlation with the nearby promoter methylation [30].
Recently, also thanks to the effort of several genomic consortia (BLUEPRINT [31,32], ROADMAP, ENCODE [33], The International Human Epigenome Consortium (IHEC) [34]) promoter capture Hi-C was used to unravel such interactions and this has been applied with success to interpret several of the non-coding disease- and trait-associated variants [35,36,37,38,39,40]. By using maps of long-range loops between enhancers and promoters it was possible to identify genes that are regulated by a disease-associated noncoding variant. These variants are in fact often located in regions at a considerable distance from an annotated gene or are in the close proximity of DNAse I hypersensitive loci [41], suggesting they might regulate gene transcription by altering the function of distal regulatory elements. This is also the case of long-range contacts in human blood cell types, where over 2500 potential disease genes were combined with a database of distal disease-associated variants [41].
PEAR1 encodes for the Platelet-Endothelial Aggregation Receptor 1, a contact receptor particularly expressed in platelets, megakaryocytes and endothelial cells [42,43,44]. Many genetic studies, including GWAS studies, have reported PEAR1 common genetic variants to be important for both platelet and endothelial cell function variability [45,46,47,48,49,50,51,52]. Interestingly, particular attention has been devoted to rs12041331, a variant located in the first intron of the gene and known to be coupled to PEAR1 DNA methylation changes [53]. This variant has been associated with variability of platelet aggregation (before and after anti-platelet therapy) [48,51,52], cardiovascular outcomes [46], PLT and MPV [54]. Beyond this studies, more recent attempts looking for new and more rare variants in the region [47] or taking advantage of larger sample size and exome Chip coverage [54,55], both failed in identifying any coding missense or nonsense variant that could explain or add to the previously identified genetic signal. Therefore, the regulatory potential of rs12041331 region in the PEAR1 locus is still open for investigation.
The PEAR1 gene structure includes an enhancer region, where rs12041331 is located, preceded by a CpG island containing several CTCF binding sites [53], these elements all contributing to regulate PEAR1 expression in megakaryocytes [53,56]. We here aimed to study the DNA methylation profile of PEAR1 in endothelial cells in order to compare it with the known profile in megakaryocyte precursors [53]. We narrowed a region in PEAR1 immediately upstream of rs12041331 that displays a cell-specific methylation pattern and interacts with multiple genes involved in protein synthesis and in cell proliferation that were found using available promoter capture HiC data for blood and endothelial cells.

2. Results

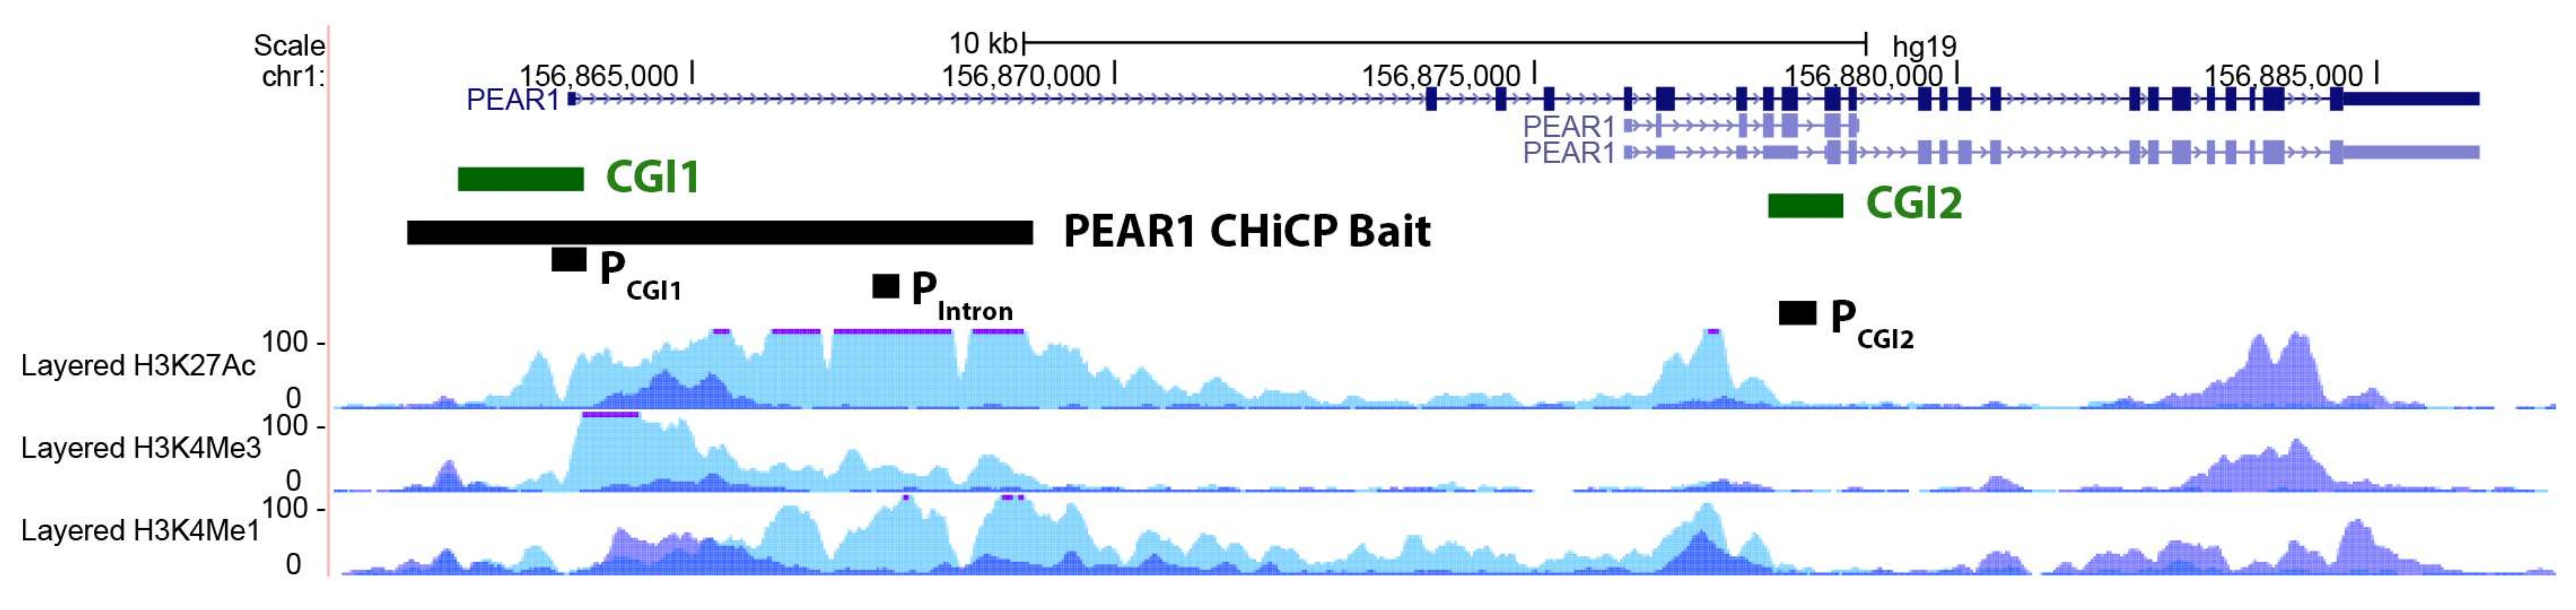
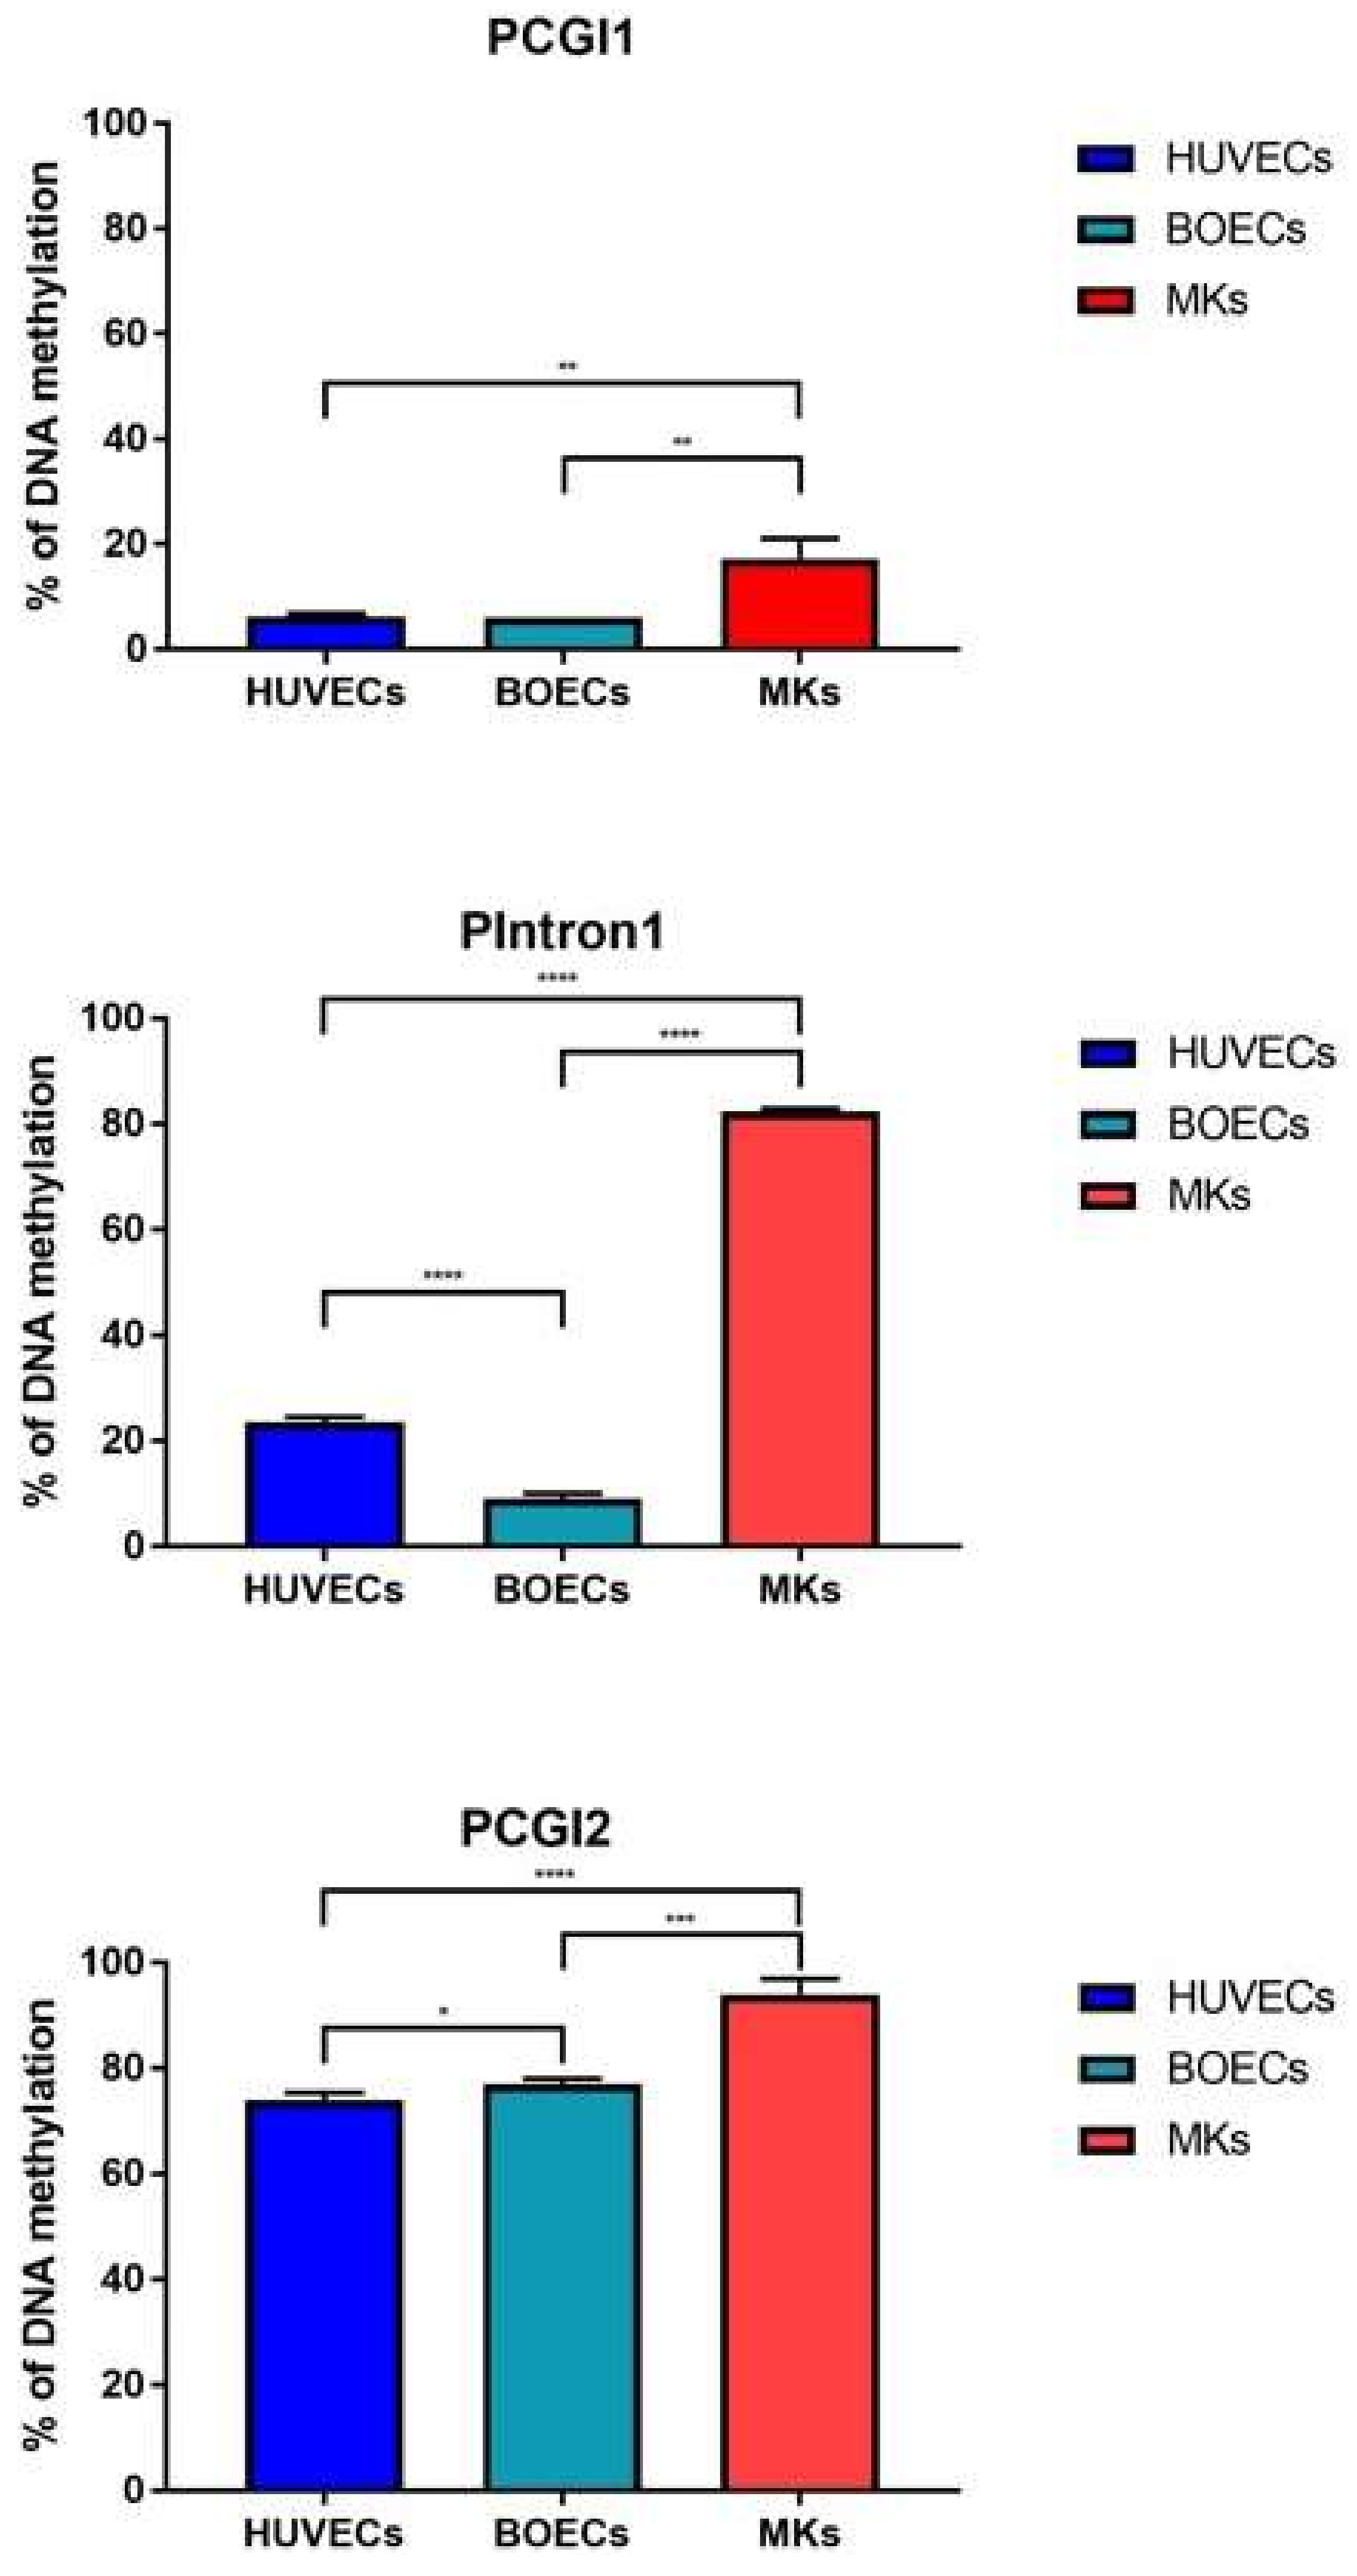
2.1. PEAR1 Hypermethylation in Megakaryocytes but Not Endothelial Cells

PEAR1 methylation was studied in megakaryocytes (MKs) and the endothelial cell lines Human Umbilical Endothelial cell (HUVECs) and Blood Outgrowth Endothelial cells (BOECs) for three different regions of the gene being the CpG Island 1 (PCGI1), the intron 1 (Pintron1) and the CpG Island 2 (PCGI2), as previously described [53] (Figure 1). Single CpG methylation values are reported in Supplemental Table S1. MKs showed significant hypermethylation for all the three regions when compared to both HUVECs and BOECs (Figure 2) but the most profound difference in methylation was detected for the intron 1 PEAR1 region. (Figure 1) This region shows enrichment for histone modifications H3K4Me1 and H3K27Ac, with particular higher deposition in HUVECs (light blue peaks in Figure 1). Active enhancers are in general co-marked by H3K4Me1 and H3K27Ac. [57,58,59].

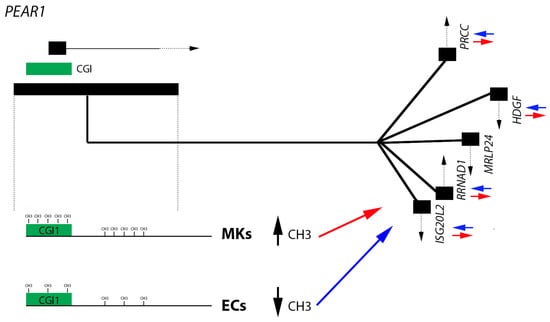
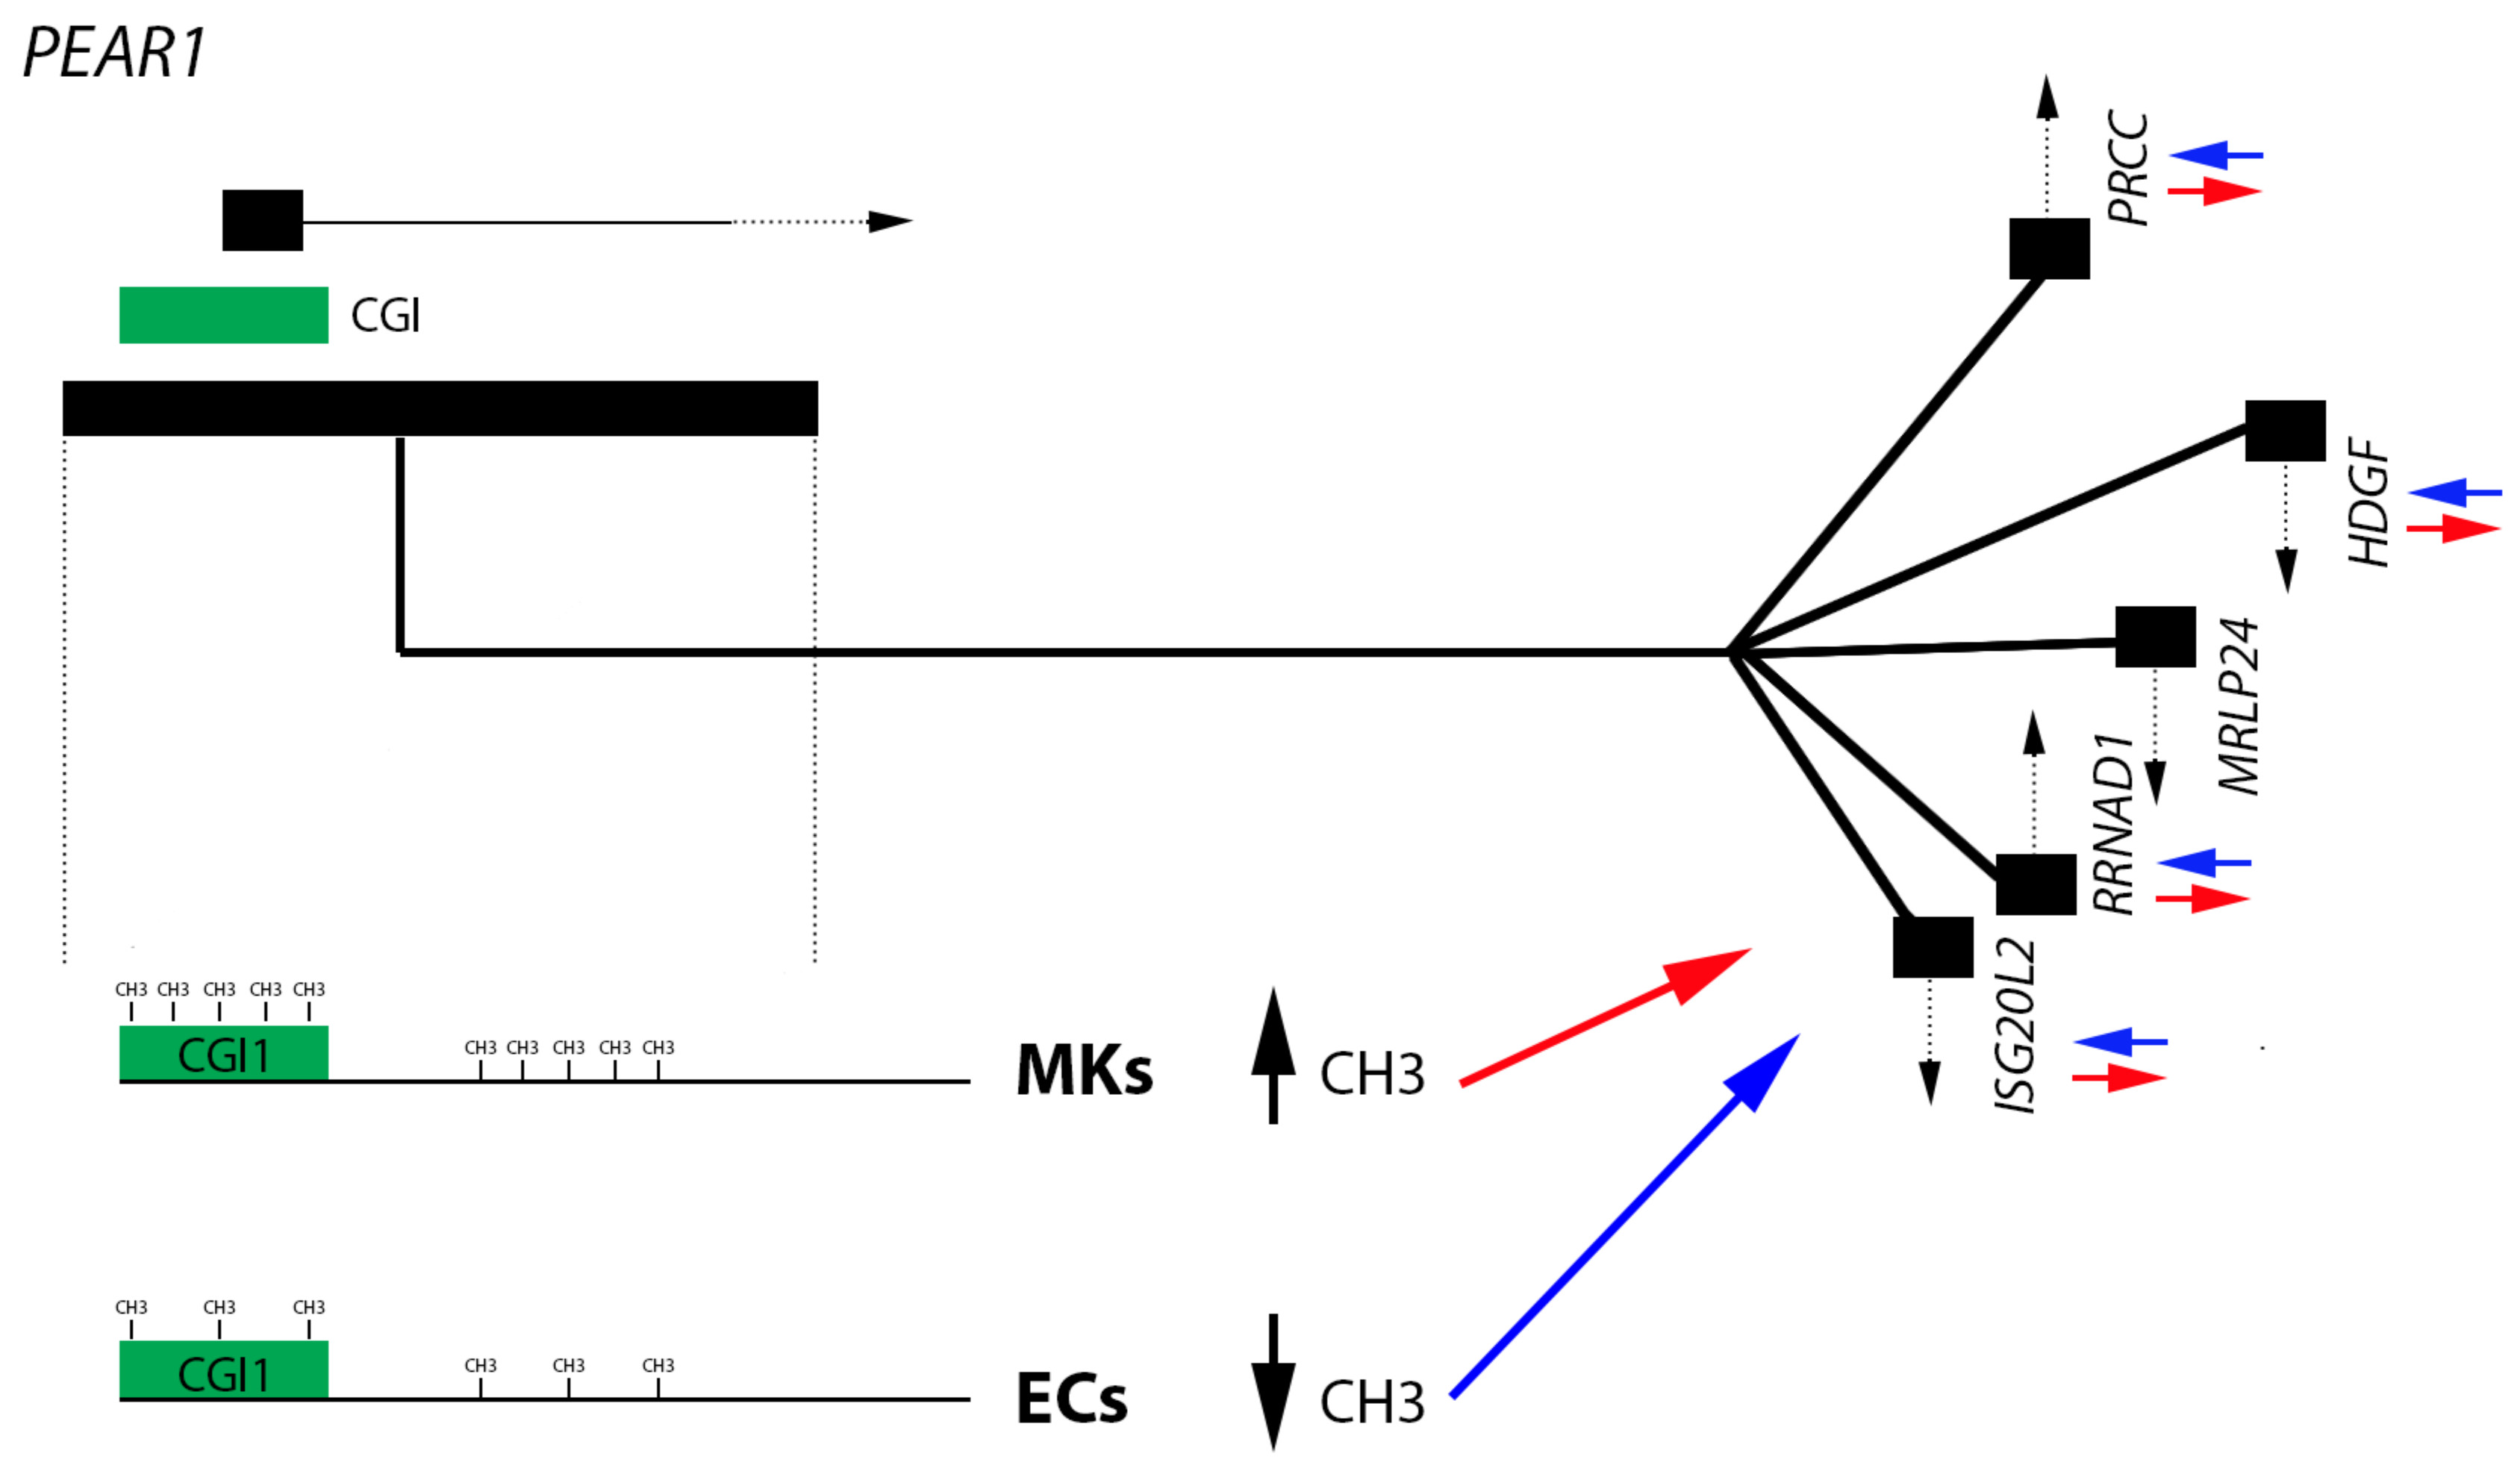
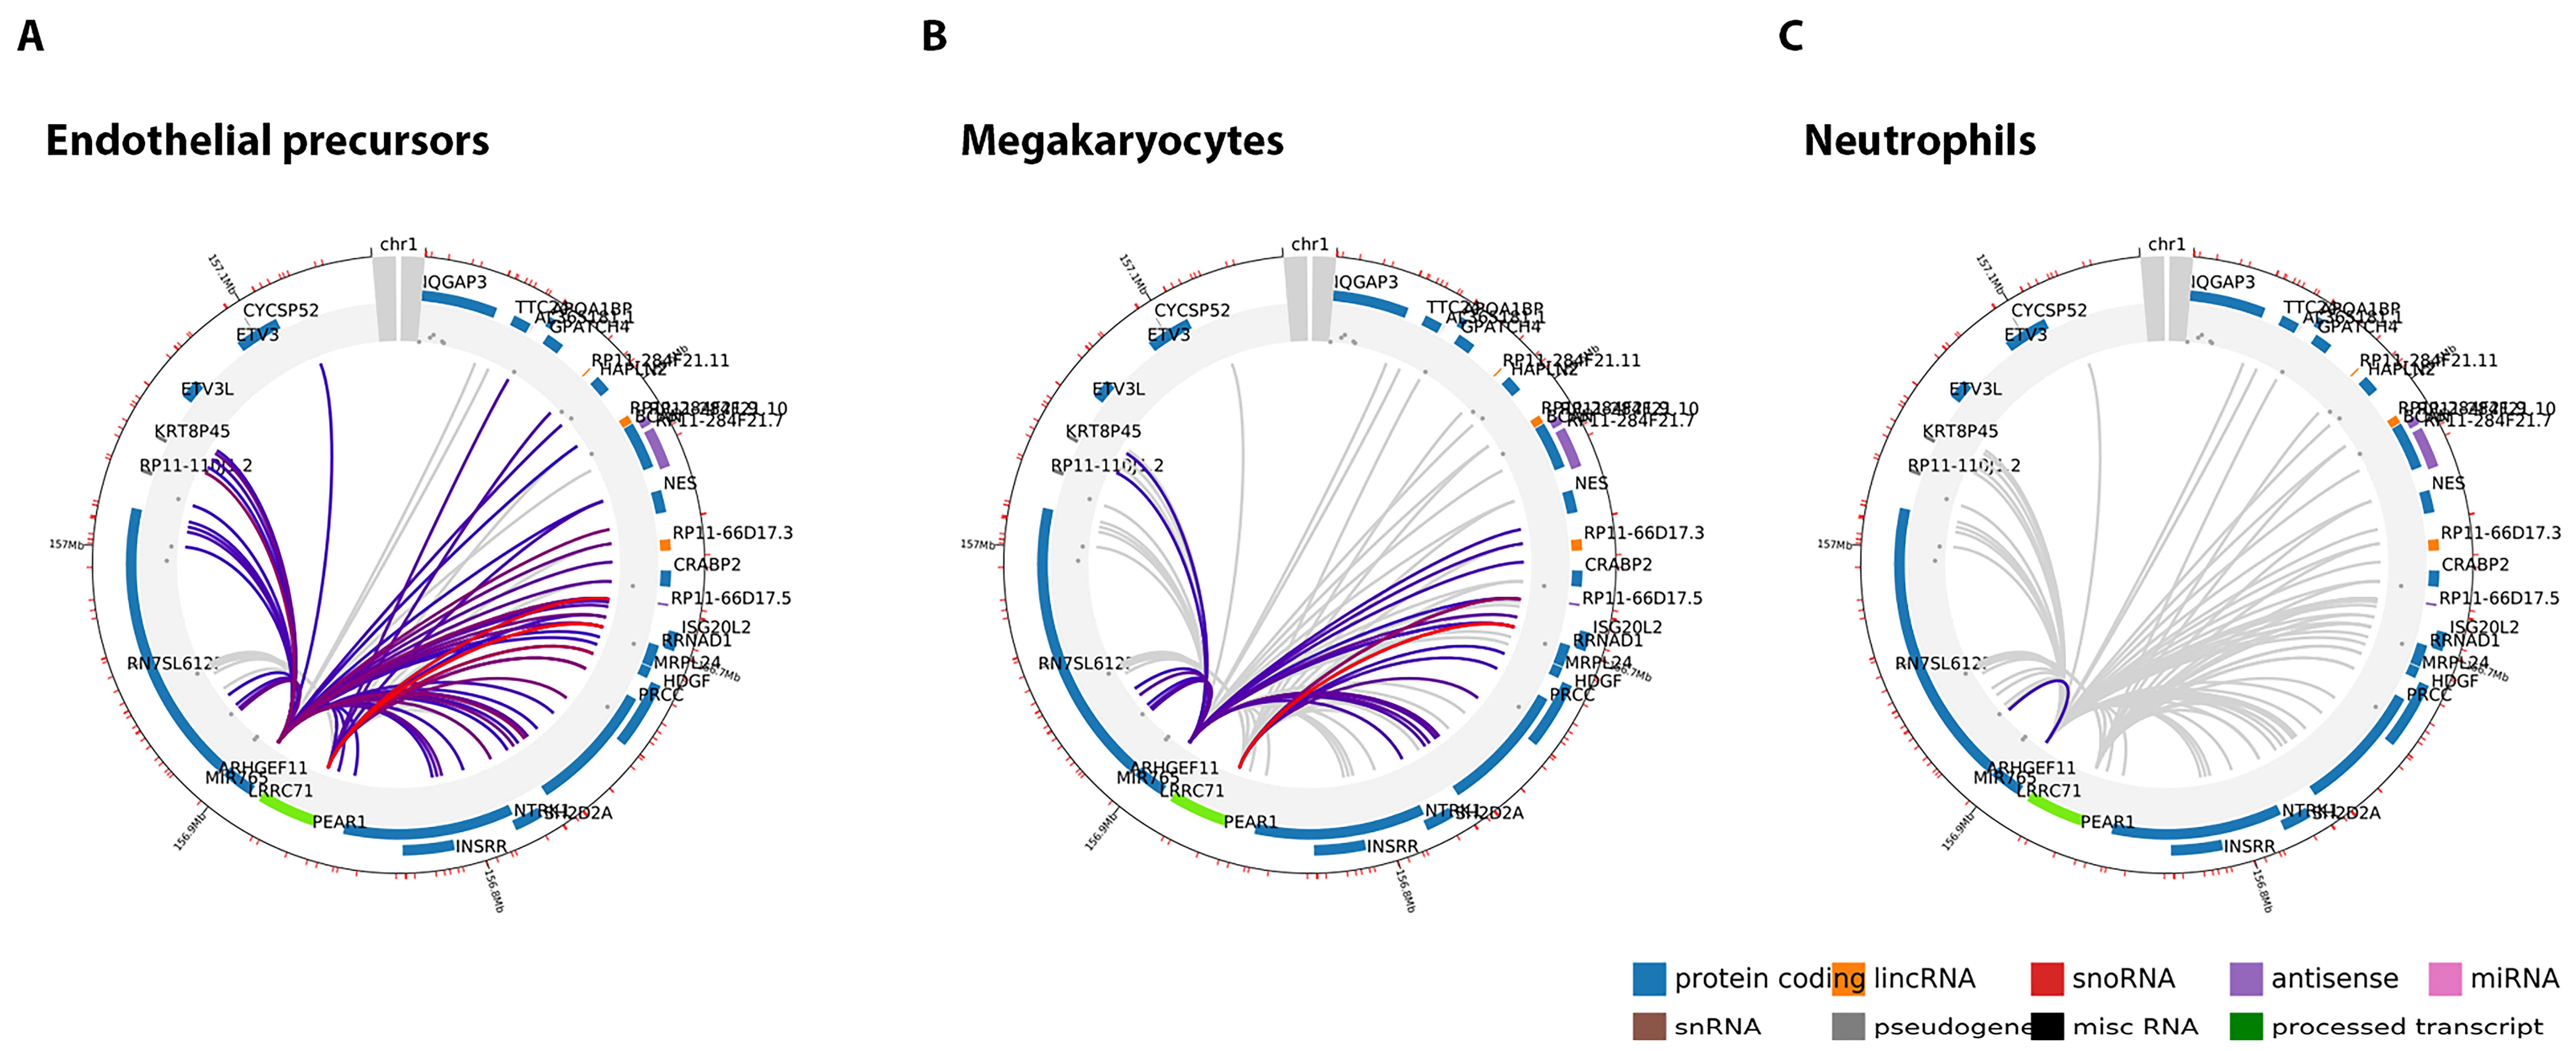
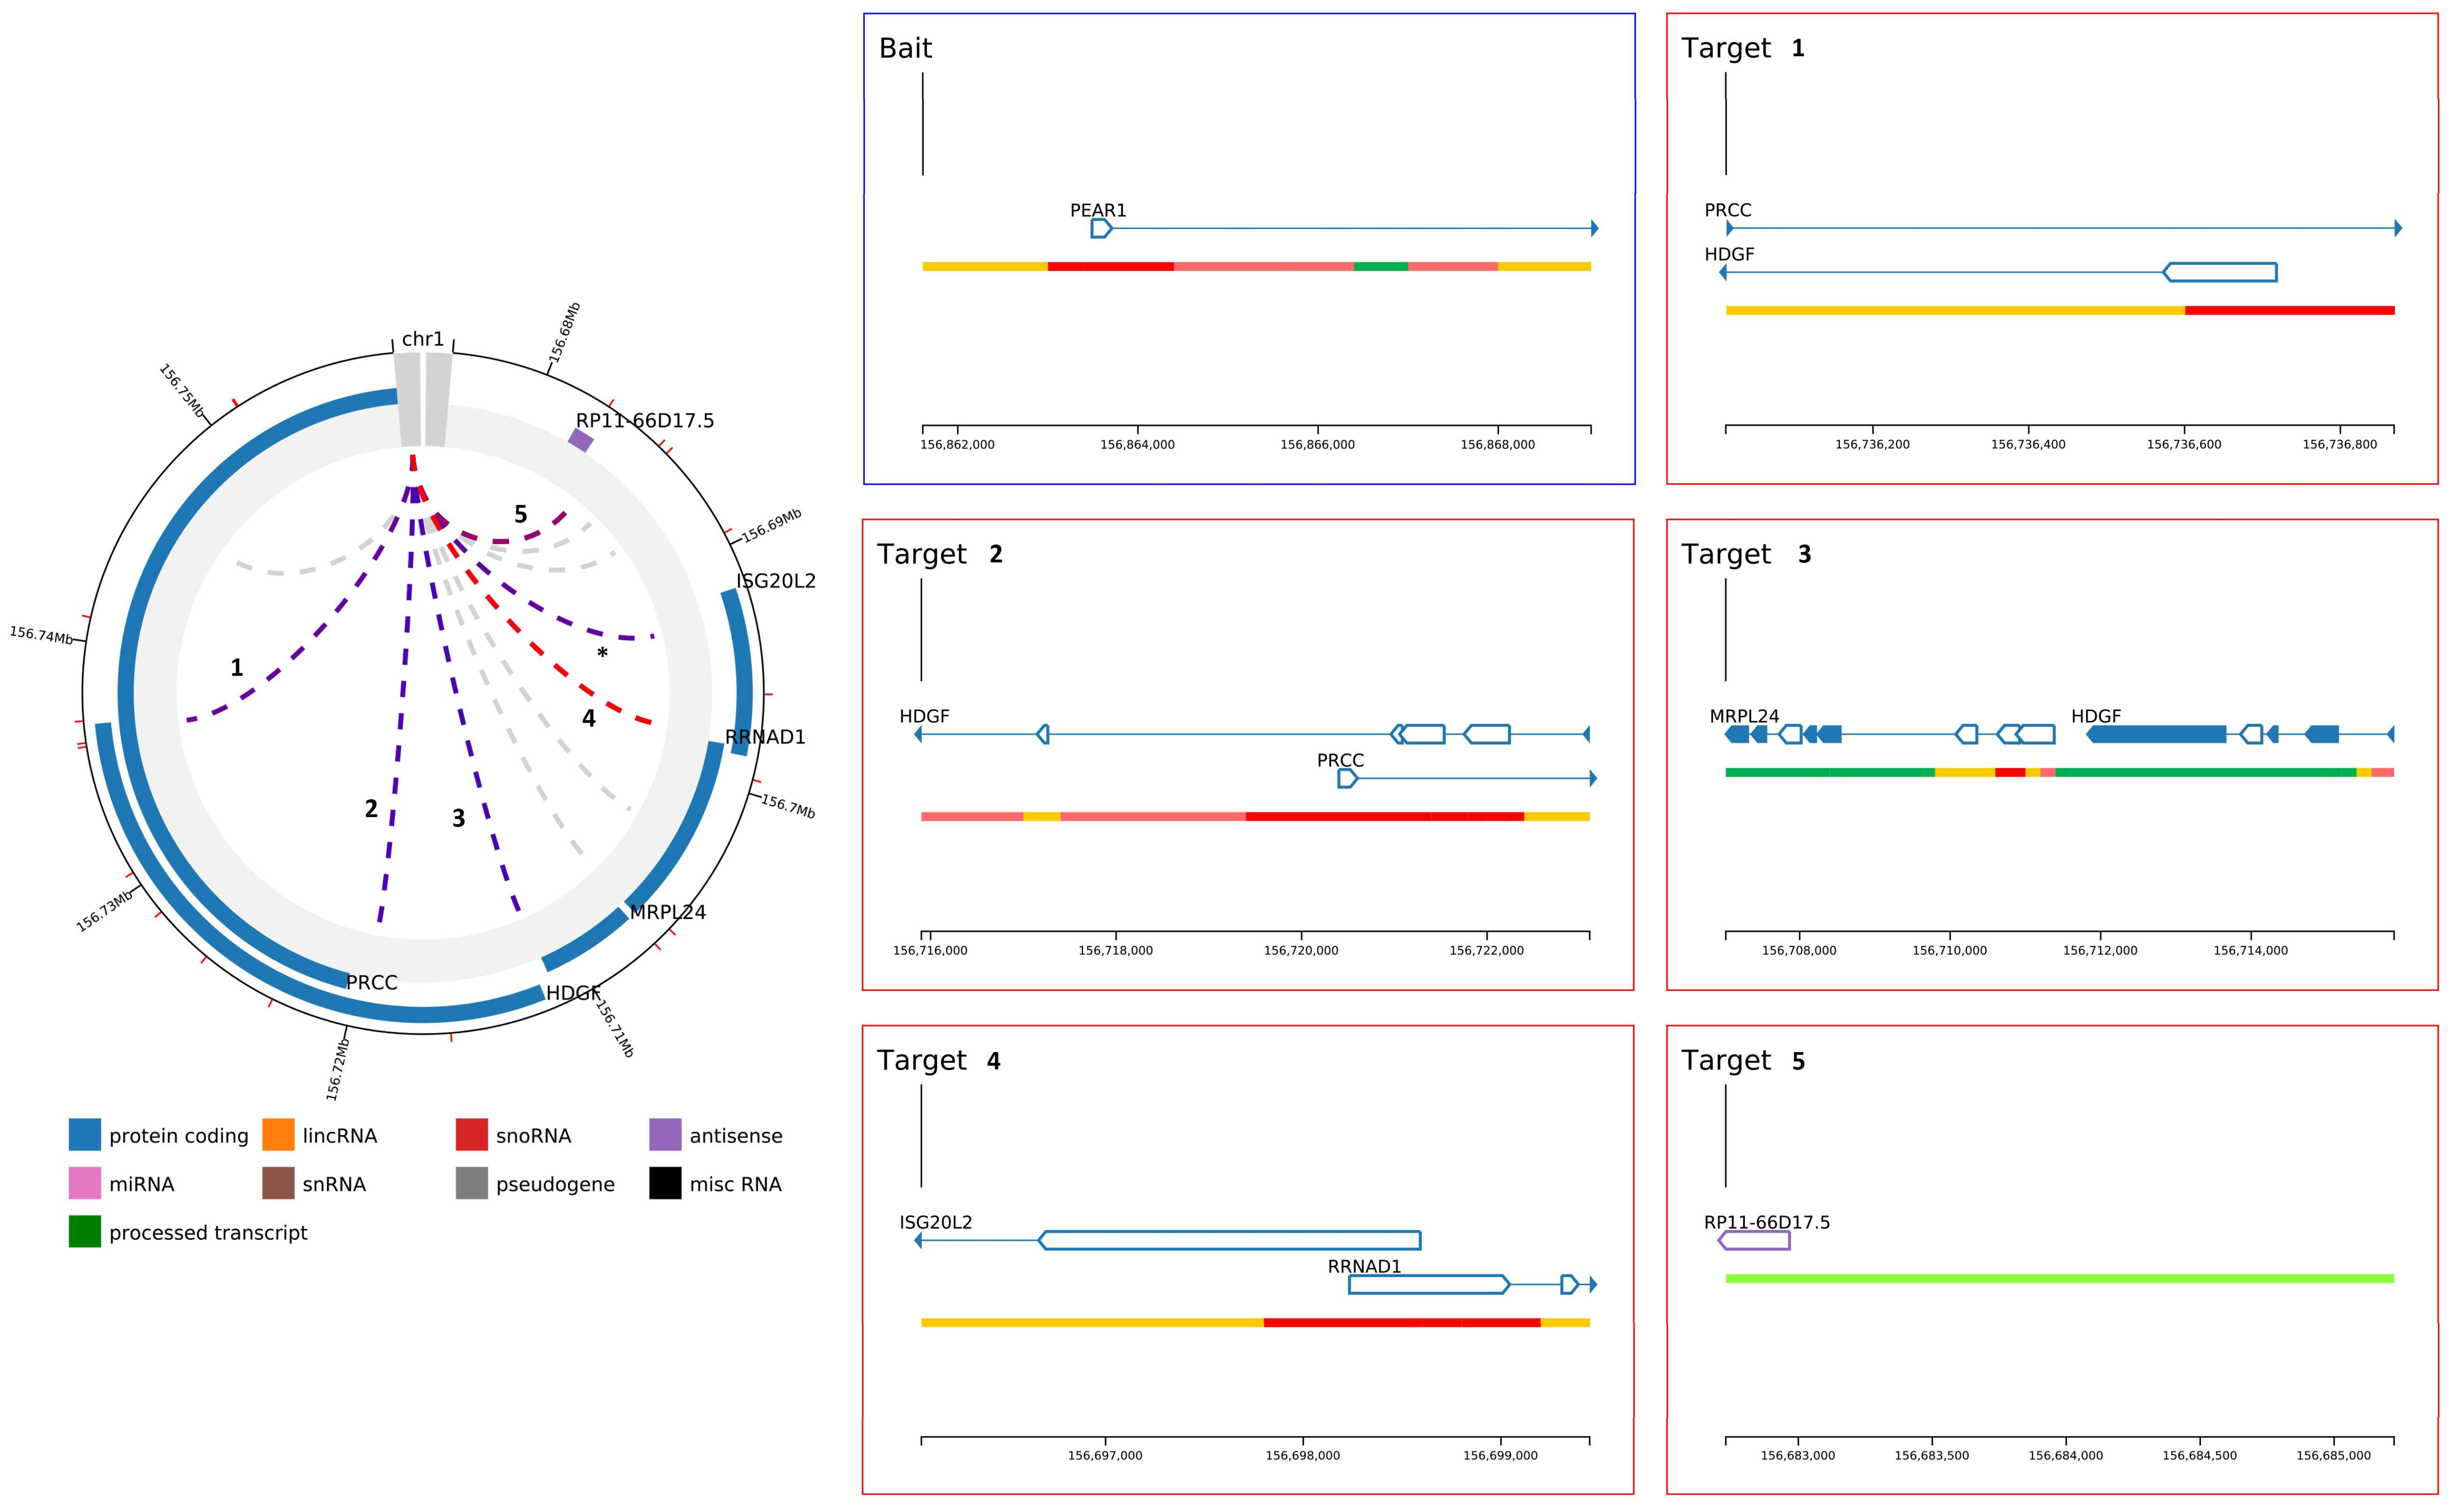
2.2. PEAR1 Associated Long-Distance Chromosomal Interactions in Endothelial Cells and Megakaryocytes

The methylation region Pintron1 is located within an enhancer [53] and together with the PCGI1 region plays a role in the regulation of PEAR1 expression. Because of its specific genomic context, we aimed at understanding whether this region is important in chromosomal interactions and this specifically for endothelial cells and megakaryocytes. To study such interactions, we have used available data obtained from promoter capture Hi-C (PCHi-C) experiments that can be visualized using the CHiCP web tool (www.chicp.org) [60] PCHi-C studies reveal the physical interaction between distal DNA regulatory elements and gene promoters at a genome wide scale and these studies have profiled such interactions in several blood cell types [32], including endothelial precursors and megakaryocytes. Therefore, the complete PEAR1 regulatory region comprising the methylated intron region (chr1:156,863,319–156,863,757, Assembly 2009) was imputed in this database to search for possible specific chromosome interactions. This region partially overlaps with a 7.48 Kb region (chr1:156,861,611–156,869,031) (Figure 1) that was used as bait in the PCHi-C studies that produced the endothelial and megakaryocyte PEAR1-specific interactome datasets and is depicted in Figure 3. For both cell types, the PEAR1 regulatory region is highly connected to the promoter regions of five different genes being ISG20L2, RRNAD1, PRCC, HDGF and MRPL24 and a region that gives rise to a long non-coding RNA with an unknown function (RP11-66D17.5) (Figure 4). Details on these interactions are reported in Table 1. Interestingly, these interactions were not observed in neutrophils (Figure 3C), monocytes or B cells (data not shown). These PEAR1 interacting genes appeared to be involved in ribosome processing and protein synthesis, cell cycle and proliferation (Table 2) and are mostly identified with Gene Ontology (GO) terms belonging to the transcription regulation pathway.
All the PEAR1 interacting loci, identified in these five genes (Table 1), overlap with CpG islands located approximatively at the beginning of each gene, suggesting that the interaction might depend on and be influenced by the degree of DNA methylation (Figure 4 and Figure 5).

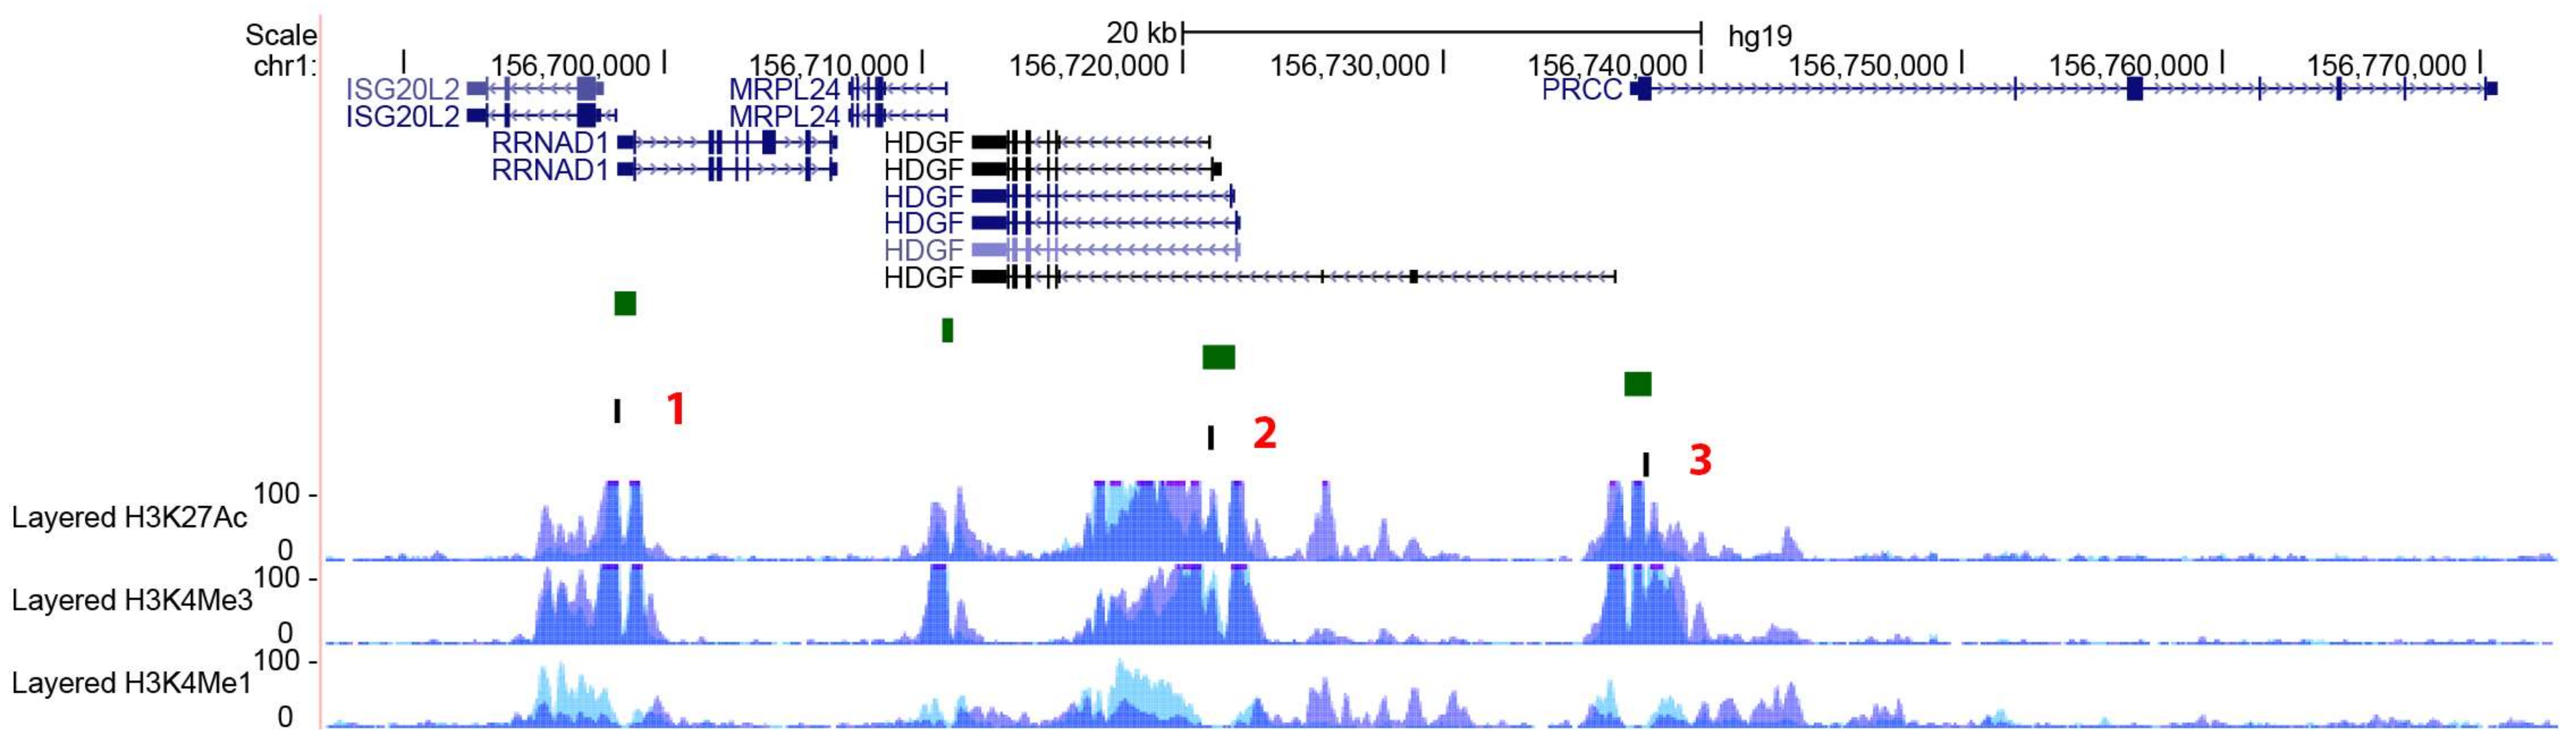
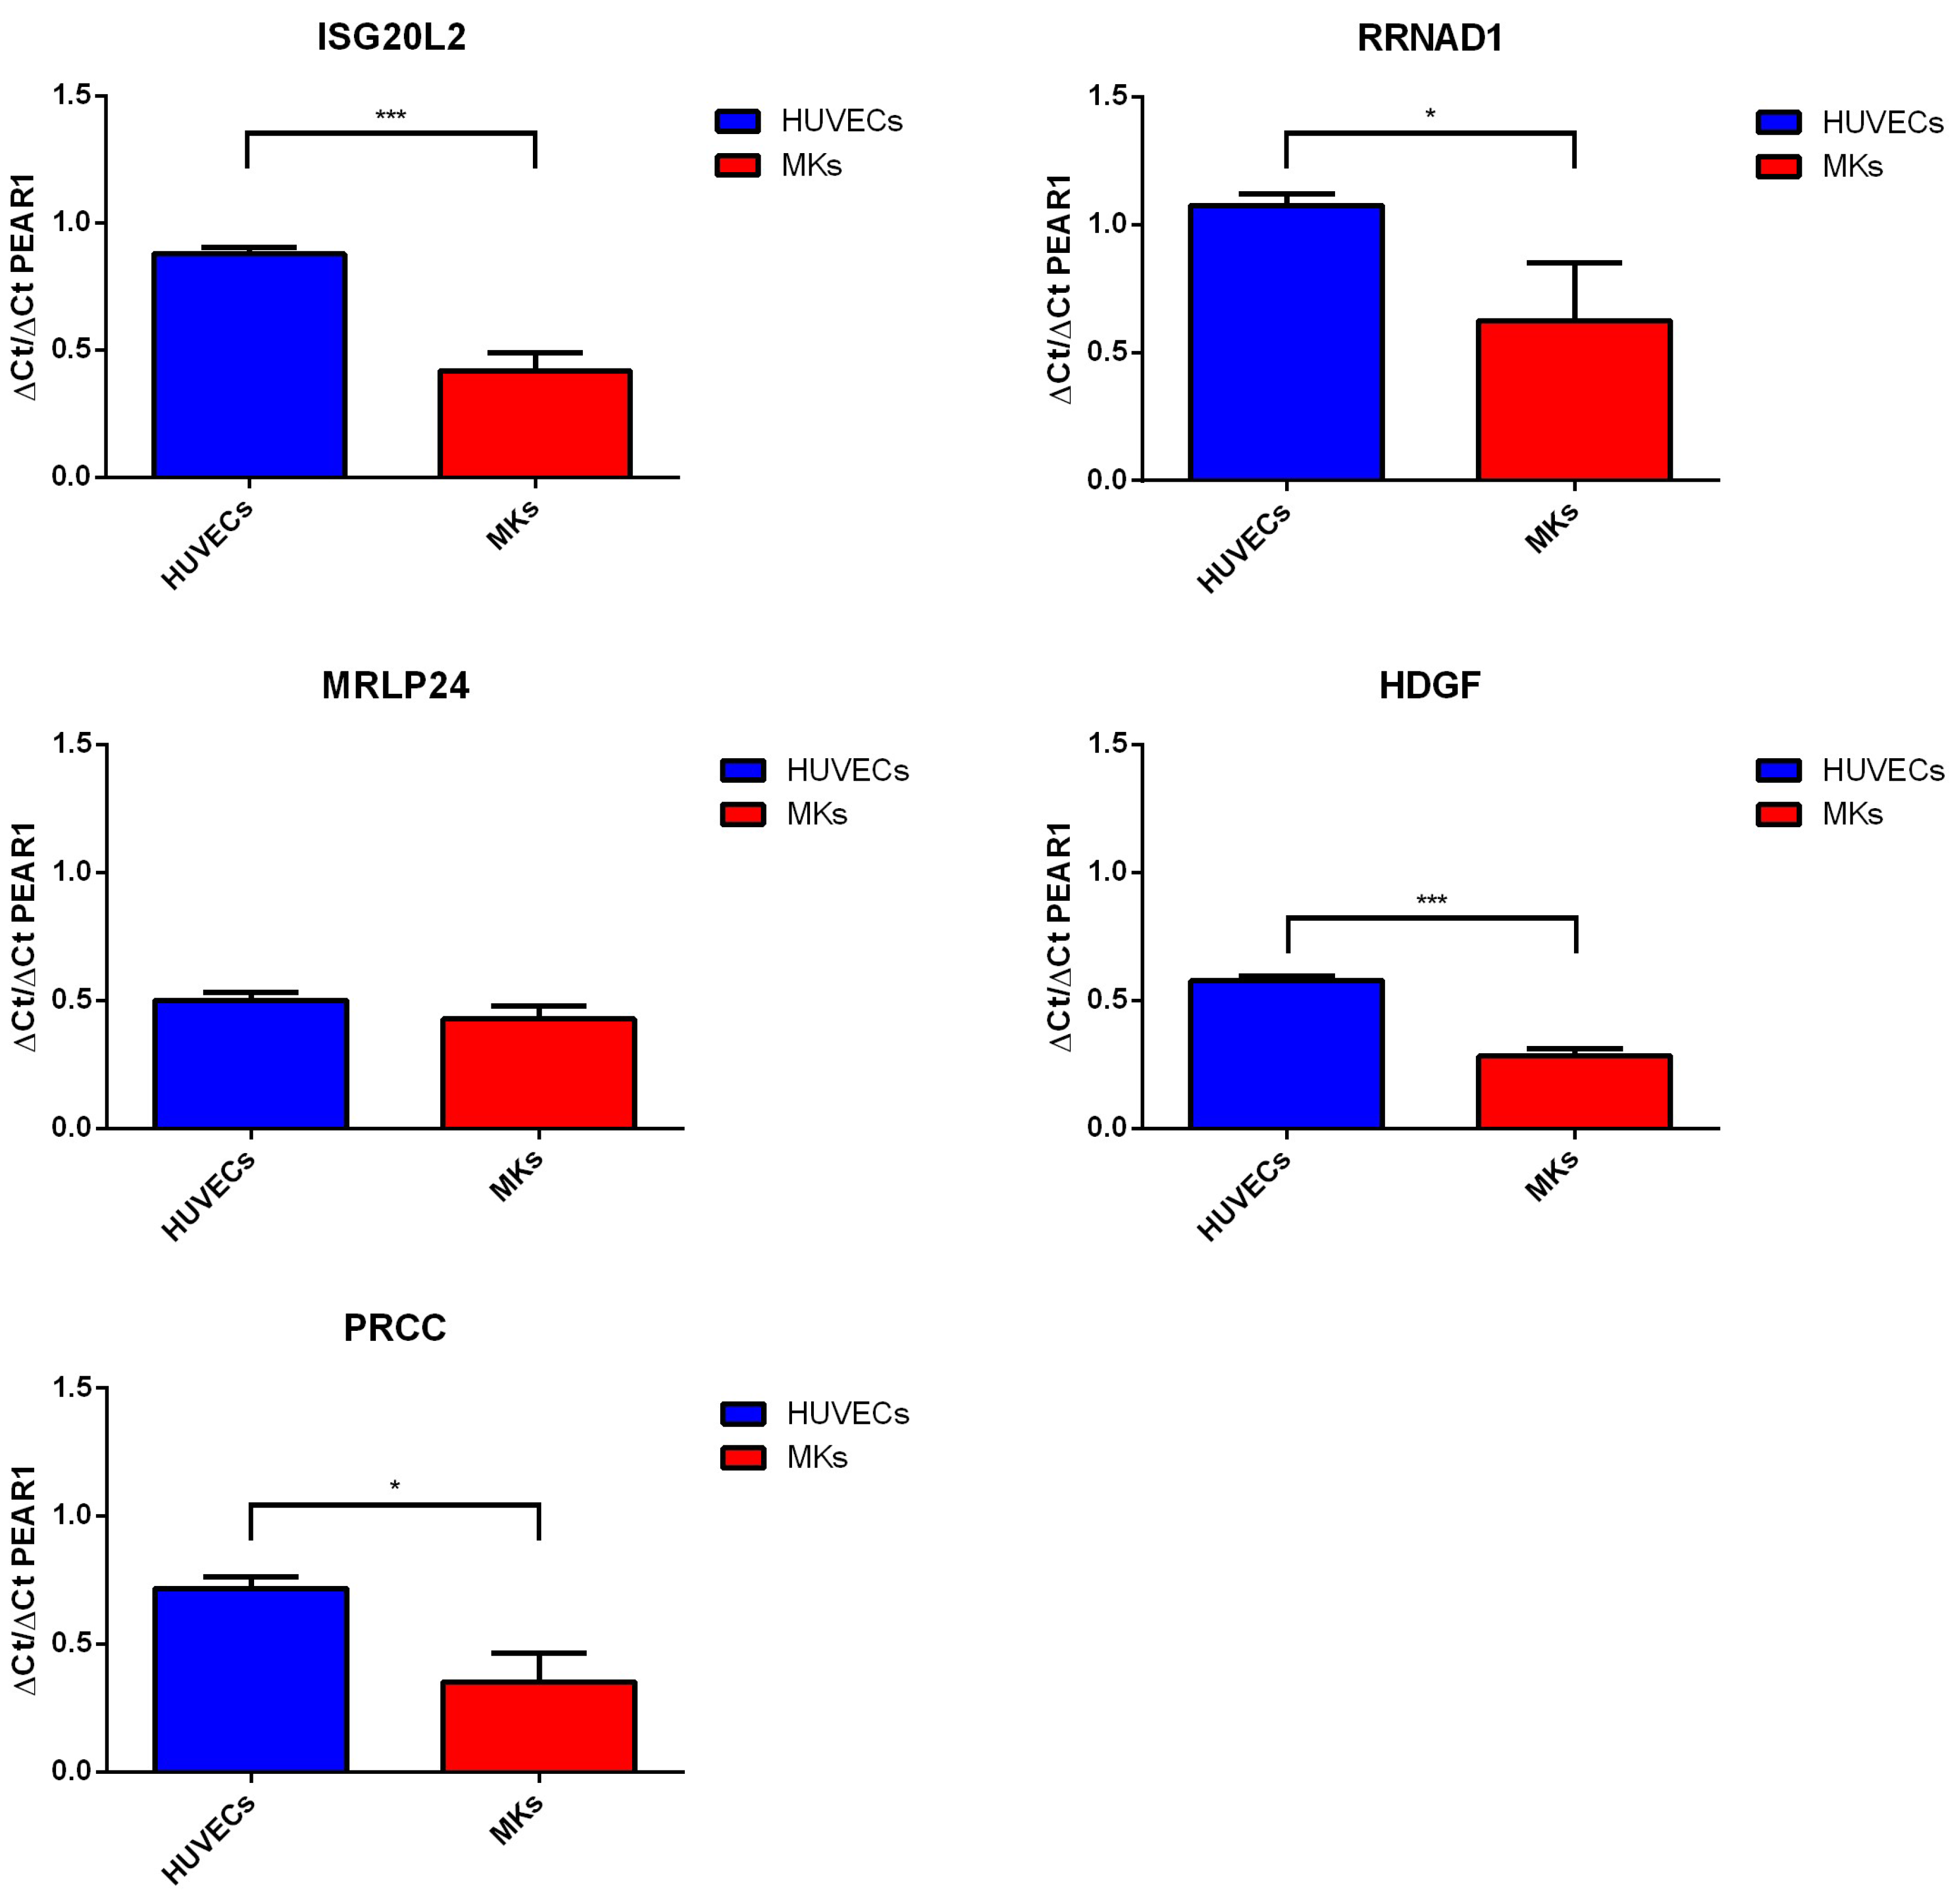
2.3. Gene Methylation and Expression Profile of PEAR1-Interacting Genes in Endothelial Cells and Megakaryocytes

To investigate whether DNA methylation at the PEAR1-interacting genes could play a role in cell-specific gene regulation, we profiled the methylation status of 3 additional loci located in the promotor CpG islands of RNNAD1 and ISG20L2, HDGF and PRCC (Figure 5) in both HUVECs and MK precursors. Due to technical reasons depending on the locus characteristics, it was not possible to design an assay to study the methylation of MRPL24. Details of the Sequenom assays used are reported in Supplemental Table S2. All these CpG regions remained completely unmethylated in both the cell types (data not shown). In addition to that and contrary to PEAR1 methylation that significantly changes during megakaryopoiesis using in vitro differentiation assay [53], the CpG island for RNNAD1/ISG20L2, HDGF and PRCC remained unmethylated without any changes during MK differentiation.
To investigate whether PEAR1 methylation differences in HUVECs and MK precursors could influence distal gene expression through a possible interaction with PEAR1 CGI1 and the intron 1 region, we studied PEAR1, ISGL20L2, RNNAD1, MRLP24, HDGF and PRCC expression in the same sample sets. Gene fold increase values normalized to GAPDH expression are reported in Supplemental Table S3. PEAR1 expression was significantly higher in MKs versus HUVECs, following their specific methylation pattern. Therefore, we studied the relative expression of each gene to PEAR1 expression in both MKs and HUVECs (Figure 6). The ∆Ct/PEAR1-∆Ct ratio for ISGL20L2, RRNAD1, HDGF and PRCC was significantly lower in MKs compared to HUVECs, while no significant difference was observed for MRLP24 (Figure 6).

3. Discussion

We here show that the PEAR1 regulatory region encompassing both the promoter CpG island (CGI1) and the first intron-enhancer of the gene presents with significantly different methylation profiles when comparing endothelial cells with MKs. Moreover, this region is also highly connected to other genes, as based on chromosomal interaction data for endothelial cells and MKs.
The PEAR1 DNA methylation profile in HUVECs, BOECs and MKs mostly differs at CGI1 and intron 1 of the gene. PEAR1 expression in MKs partially depends upon changes of methylation at CGI1 and high methylation corresponds to high PEAR1 expression [53]. Our current experiments show that PEAR1 expression in MKs is higher than in HUVECs, in line with the cell-specific PEAR1 methylation profiles (Figure 2 and Figure 6).
By studying the methylation of PEAR1 in HUVECs, BOECs and MKs, we were able to identify a region involved in several enhancer-promoter interactions in endothelial cells and MKs. The same region is also part of a MK specific super enhancer recently identified by Peterson and colleagues in the framework of a genome-wide long-range interactions study [61]. In this study, PEAR1 was found to interact with 7 different genes, 5 of which correspond to our identified PEAR1-interacting loci. Interestingly, three of the characterized PEAR1 enhancer-interacting genes are involved in important processes related to transcription and protein synthesis (Table 2). ISG20L2, RRNAD1 and MRPL24 play a role in ribosomal RNA (rRNA) processing and ribosome biogenesis in the cell (ISG20L2 and RRNAD1) [62] or in the mitochondria (MRLP24). Gene expression and consequent protein synthesis highly correlate with cell differentiation and proliferation. Several studies have shown that precursors cells contain in general a much higher amount of RNA, normalized to the amount of DNA, compared to specialized cells [63,64]. Transcription profiling studies have revealed that most differentiated cell types express only 10–20% of their genes compared to the 30–60% of embryonic stem cells (ESCs). This pattern is in line with the evidence that cell differentiation moves the chromatin from an open, accessible state up to a more lineage-specific gene expression determined by epigenetic modifications of various types, including DNA methylation [64,65]. In accordance with this evidence, the PEAR1 interactions with chromosome 1 found, do not involve more mature cell type such as neutrophils (Figure 3).
Two other chromosome contacts with PEAR1 involve two genes whose abnormal expression is reported to lead to growth of several tumours [66,67,68,69,70]. PRCC is involved in mRNA splicing and reported to have a role in cell cycle delay. HDGF encodes for a protein with DNA-binding mitogenic activity involved in cell proliferation and differentiation and is extensively described to be an angiogenic factor in several organs and tumours [71,72,73,74,75]. PEAR1 is known to affect cell proliferation in both megakaryocyte precursors and endothelial cells through the PI3KP3/Akt pathway [43,44] and is involved in neo-angiogenesis [44]. However, so far, no reported data have been shown to link PEAR1 to cancer development and progression. PEAR1 interactions with HDGF and PRCC might modulate their cancer-related role and open up for future research of PEAR1 in the tumour biology field. In many instances genome-wide disease- and cell trait-associated variants are located in regulatory regions that act distally to influence the expression of other genes [32,35,36,37,38,39,40]. Interestingly, two of the PEAR1 variants most associated with platelet function and also in linkage disequilibrium with each other, rs12566888 and rs12041331 [45,46,47,48,49,50,51,52,76], are located in the close proximity of the PEAR1 region involved in chromosome interactions, at 16 and 683 bp of distance from the downstream limit, respectively. Based on our data, future studies should interrogate whether common variants in the PEAR1 region identified by our analysis, are associated with cancer incidence or progression.
In conclusion, our data suggest that PEAR1 is not only important as gene encoding for a very well-known contact receptor [42,77,78,79] but might also mediate chromosome interactions with genes involved in protein synthesis, cell proliferation and cancer progression through DNA methylation-dependent mechanisms.

4. Material and Methods

4.1. Human HUVECs, BOECs and CD34+ Stem Cell Isolation and Differentiation In Vitro

Human Umbilical Vein Endothelial cells (HUVECs), Blood Outgrowth Endothelial cells (BOECs) and Megakaryocytes precursors were isolated from healthy donors and growth in culture as described [43,44,53,80]. HUVECs were freshly isolated from human umbilical veins of healthy volunteers, the day after birth, following a modification of the method of Jaffe et al. [81] Cells were extracted using 0.2% collagenase type 1 (Gibco, Life Technologies, Ghent, Belgium), seeded on gelatine-coated (0.1%) culture dishes in EBM-2 containing EGM-2 BulletKit (Lonza, Walkersville, MD, USA) and cultured (37 °C and 5% CO2) until they reached confluence. Formal permission for the isolation of HUVECs was given by the Ethics Committee of the Leuven University Hospitals via isolation of human umbilical cords (Ref. No. ML8663—Approval S54528): informed consent was signed by each mother.
BOECs were isolated from blood of healthy volunteers, as reported previously [44,82]. Briefly, peripheral blood samples were diluted two-fold in PBS and centrifuged on Ficoll Paque (GE Healthcare, 17-440-02, Little Chalfont, UK). Buffy coats were pooled and centrifuged multiple times in PBS. Pellets were resuspended in Endothelial Basal Medium-2 (EBM-2; Lonza) medium and seeded on collagen type-I coated dishes (37 °C, 5% CO2) for 30 days (medium was changed daily during the first week and every 2 days thereafter) after which outgrowing colonies were pooled and passaged. After 20–30 days, typical cobble-stone-like colonies appeared and were plated again to reach confluence. BOECs used in this study were harvested at passage 3 after seeding and showed clear endothelial morphology (cobblestone and Weibel-Palade bodies) and phenotype (positive for CD31, VEGR2, CD34, VWF, VE-Cadherin, eNOS). Informed consent was given for the isolation of the blood samples and also this study was granted by the Ethics Committee of the Leuven University Hospitals.
Human CD34+ hematopoietic stem cells (HSCs) were separated by magnetic cell sorting from buffy coats isolated from healthy donor peripheral blood (Milteny Biotech, Auburn, CA, USA) and cultured using a protocol described in [53]. The cultured CD34+ cells were harvested on days 0, 7 and 14 of differentiation.
All harvested HUVECs, BOECs and CD34+ cells were washed in Dulbecco phosphate-buffered saline (PBS), pelleted and snap-frozen in liquid nitrogen and stored at −80 °C for further DNA and RNA extraction.

4.2. DNA Methylation Analysis

Bisulphite treatment was conducted on 1 μg of genomic DNA using the Methyl Detector kit (Active Motif, Carlsbad, CA, USA) according to the manufacturer’s instructions, except for the incubation protocol during the conversion, performed for a total of 16h as described [83]. Amplicons to study PEAR1 are already described [53]. Amplicons to study RNNAD1 and ISG20L2, HDGF and PRCC methylation were designed using the Sequenom (Agena) EpiDesigner software (http://www.epidesigner.com/). Primers and amplicons characteristics are reported in Supplemental Table S2. All PCR amplifications were performed in triplicate. For the CpG- specific analysis, when the triplicate measurements had a SD equal to or greater than 10%, data were discarded. Sequenom (Agena) peaks with reference intensity above 2, overlapping and duplicate units were excluded from the analysis [84,85].

4.3. CHiCP Analysis

Data on PEAR1 chromosome interactions in endothelial precursors, megakaryocytes and neutrophils were retrieved from the Capture HiC Plotter (CHiCP, London, UK, www.chicp.org) [60] using data from Javierre et al. [32]. This dataset contains PCHi-C data from 17 blood specific primary cell types (with at least 3 biological replicates) that forms a catalogue of the interactomes of 31,253 annotated promoters. PEAR1 region chr1:156,863,319–156,863,757 (Assembly 2009) identified in the methylation study was used to search for interaction baits in the database of the endothelial precursors, megakaryocyte and neutrophils interactomes. After identification of the PEAR1 overlapping bait region present in the CHiCP database, PEAR1 interactions in endothelial precursors, MKs and neutrophils were considered in the following analysis when their interaction score was above 5.

4.4. Gene Expression Analysis

Total RNA from HUVECs and MK precursors (day 14) was extracted using TRIzol (Invitrogen, Carlsbad, CA, USA) and cDNA was synthetized following the manufacturer’s instructions (Promega Corporation, Fitchburg, WI, USA). Gene expression for ISG20L2, RRNAD1, MRPL24, HDGF, PRCC and PEAR1 was measured using IDT PrimeTime qPCR Primers (Hs.PT.58.39252767, Hs.PT.58.21044077, Hs.PT.58.39042018, Hs.PT.58.97775, Hs.PT.58.21039953 and Hs.PT.58.40290082, respectively) and in-house designed primers for GAPDH (Forward primer: 5′-CTCAGACACCATGGGGAAG-3′ and Reverse primer: 5′-ACGGTGCCATGGAATTTGCC-3′) combined with SYBR green intercalating dye from Life Technologies. Gene expression data were analysed as ratio between each gene’s expression normalized to GAPDH and PEAR1 expression normalized to GAPDH.

Supplementary Materials

Supplementary materials can be found at https://www.mdpi.com/1422-0067/19/4/1069/s1.

Acknowledgments

This work was supported by the “Fonds voor Wetenschappelijk Onderzoek (FWO) Vlaanderen” grant G0A6514N and 1508715N, by the “Programmafinanciering KU Leuven (PF/10/014).” B.I. was a FWO post-doctoral fellow (12M2715N).

Author Contributions

B.I. designed and performed experiments, analysed data and wrote the manuscript; F.N. analysed data and contributed to the bioinformatic analysis; K.C. performed experiments; K.F. and M.F.H. designed experiments and revised the manuscript.

Conflicts of Interest

The authors declare no competing financial interests.

References

  1. Bulger, M.; Groudine, M. Functional and mechanistic diversity of distal transcription enhancers. Cell 2011, 144, 327–339. [Google Scholar] [CrossRef] [PubMed]
  2. Lopes, S.; Lewis, A.; Hajkova, P.; Dean, W.; Oswald, J.; Forne, T.; Murrell, A.; Constancia, M.; Bartolomei, M.; Walter, J.; et al. Epigenetic modifications in an imprinting cluster are controlled by a hierarchy of DMRs suggesting long-range chromatin interactions. Hum. Mol. Genet. 2003, 12, 295–305. [Google Scholar] [CrossRef] [PubMed]
  3. Sasaki, H.; Ishihara, K.; Kato, R. Mechanisms of Igf2/H19 imprinting: DNA methylation, chromatin and long-distance gene regulation. J. Biochem. 2000, 127, 711–715. [Google Scholar] [CrossRef] [PubMed]
  4. Weber, M.; Hagege, H.; Murrell, A.; Brunel, C.; Reik, W.; Cathala, G.; Forne, T. Genomic imprinting controls matrix attachment regions in the Igf2 gene. Mol. Cell. Biol. 2003, 23, 8953–8959. [Google Scholar] [CrossRef] [PubMed]
  5. Carvajal, J.J.; Cox, D.; Summerbell, D.; Rigby, P.W. A BAC transgenic analysis of the Mrf4/Myf5 locus reveals interdigitated elements that control activation and maintenance of gene expression during muscle development. Development 2001, 128, 1857–1868. [Google Scholar] [PubMed]
  6. Carter, D.; Chakalova, L.; Osborne, C.S.; Dai, Y.F.; Fraser, P. Long-range chromatin regulatory interactions in vivo. Nat. Genet. 2002, 32, 623–626. [Google Scholar] [CrossRef] [PubMed]
  7. Spitz, F.; Gonzalez, F.; Duboule, D. A global control region defines a chromosomal regulatory landscape containing the HoxD cluster. Cell 2003, 113, 405–417. [Google Scholar] [CrossRef]
  8. Sagai, T.; Hosoya, M.; Mizushina, Y.; Tamura, M.; Shiroishi, T. Elimination of a long-range cis-regulatory module causes complete loss of limb-specific Shh expression and truncation of the mouse limb. Development 2005, 132, 797–803. [Google Scholar] [CrossRef] [PubMed]
  9. Jeong, Y.; El-Jaick, K.; Roessler, E.; Muenke, M.; Epstein, D.J. A functional screen for sonic hedgehog regulatory elements across a 1 Mb interval identifies long-range ventral forebrain enhancers. Development 2006, 133, 761–772. [Google Scholar] [CrossRef] [PubMed]
  10. Pennacchio, L.A.; Ahituv, N.; Moses, A.M.; Prabhakar, S.; Nobrega, M.A.; Shoukry, M.; Minovitsky, S.; Dubchak, I.; Holt, A.; Lewis, K.D.; et al. In Vivo enhancer analysis of human conserved non-coding sequences. Nature 2006, 444, 499–502. [Google Scholar] [CrossRef] [PubMed]
  11. Ragoczy, T.; Telling, A.; Sawado, T.; Groudine, M.; Kosak, S.T. A genetic analysis of chromosome territory looping: Diverse roles for distal regulatory elements. Chromosome Res. 2003, 11, 513–525. [Google Scholar] [CrossRef] [PubMed]
  12. Francastel, C.; Walters, M.C.; Groudine, M.; Martin, D.I. A functional enhancer suppresses silencing of a transgene and prevents its localization close to centrometric heterochromatin. Cell 1999, 99, 259–269. [Google Scholar] [CrossRef]
  13. Schubeler, D.; Francastel, C.; Cimbora, D.M.; Reik, A.; Martin, D.I.; Groudine, M. Nuclear localization and histone acetylation: A pathway for chromatin opening and transcriptional activation of the human beta-globin locus. Genes Dev. 2000, 14, 940–950. [Google Scholar] [PubMed]
  14. Gerasimova, T.I.; Byrd, K.; Corces, V.G. A chromatin insulator determines the nuclear localization of DNA. Mol. Cell 2000, 6, 1025–1035. [Google Scholar] [CrossRef]
  15. Carmo-Fonseca, M.; Platani, M.; Swedlow, J.R. Macromolecular mobility inside the cell nucleus. Trends Cell Biol. 2002, 12, 491–495. [Google Scholar] [CrossRef]
  16. Carmo-Fonseca, M. The contribution of nuclear compartmentalization to gene regulation. Cell 2002, 108, 513–521. [Google Scholar] [CrossRef]
  17. Phillips-Cremins, J.E.; Sauria, M.E.; Sanyal, A.; Gerasimova, T.I.; Lajoie, B.R.; Bell, J.S.; Ong, C.T.; Hookway, T.A.; Guo, C.; Sun, Y.; et al. Architectural protein subclasses shape 3D organization of genomes during lineage commitment. Cell 2013, 153, 1281–1295. [Google Scholar] [CrossRef] [PubMed]
  18. Hadjur, S.; Williams, L.M.; Ryan, N.K.; Cobb, B.S.; Sexton, T.; Fraser, P.; Fisher, A.G.; Merkenschlager, M. Cohesins form chromosomal cis-interactions at the developmentally regulated IFNG locus. Nature 2009, 460, 410–413. [Google Scholar] [CrossRef] [PubMed]
  19. Mishiro, T.; Ishihara, K.; Hino, S.; Tsutsumi, S.; Aburatani, H.; Shirahige, K.; Kinoshita, Y.; Nakao, M. Architectural roles of multiple chromatin insulators at the human apolipoprotein gene cluster. EMBO J. 2009, 28, 1234–1245. [Google Scholar] [CrossRef] [PubMed]
  20. Nativio, R.; Wendt, K.S.; Ito, Y.; Huddleston, J.E.; Uribe-Lewis, S.; Woodfine, K.; Krueger, C.; Reik, W.; Peters, J.M.; Murrell, A. Cohesin is required for higher-order chromatin conformation at the imprinted IGF2-H19 locus. PLoS Genet. 2009, 5, e1000739. [Google Scholar] [CrossRef] [PubMed] [Green Version]
  21. Handoko, L.; Xu, H.; Li, G.; Ngan, C.Y.; Chew, E.; Schnapp, M.; Lee, C.W.; Ye, C.; Ping, J.L.; Mulawadi, F.; et al. CTCF-mediated functional chromatin interactome in pluripotent cells. Nat. Genet. 2011, 43, 630–638. [Google Scholar] [CrossRef] [PubMed]
  22. Klose, R.J.; Bird, A.P. Genomic DNA methylation: The mark and its mediators. Trends Biochem. Sci. 2006, 31, 89–97. [Google Scholar] [CrossRef] [PubMed]
  23. Cedar, H.; Bergman, Y. Programming of DNA methylation patterns. Annu. Rev. Biochem. 2012, 81, 97–117. [Google Scholar] [CrossRef] [PubMed]
  24. Unoki, M.; Nakamura, Y. Methylation at CpG islands in intron 1 of EGR2 confers enhancer-like activity. FEBS Lett. 2003, 554, 67–72. [Google Scholar] [CrossRef]
  25. Shen, Y.; Takahashi, M.; Byun, H.M.; Link, A.; Sharma, N.; Balaguer, F.; Leung, H.C.; Boland, C.R.; Goel, A. Boswellic acid induces epigenetic alterations by modulating DNA methylation in colorectal cancer cells. Cancer Biol. Ther. 2012, 13, 542–552. [Google Scholar] [CrossRef] [PubMed]
  26. Xu, J.; Pope, S.D.; Jazirehi, A.R.; Attema, J.L.; Papathanasiou, P.; Watts, J.A.; Zaret, K.S.; Weissman, I.L.; Smale, S.T. Pioneer factor interactions and unmethylated CpG dinucleotides mark silent tissue-specific enhancers in embryonic stem cells. Proc. Natl. Acad. Sci. USA 2007, 104, 12377–12382. [Google Scholar] [CrossRef] [PubMed]
  27. Uhm, T.G.; Lee, S.K.; Kim, B.S.; Kang, J.H.; Park, C.S.; Rhim, T.Y.; Chang, H.S.; Kim do, J.; Chung, I.Y. CpG methylation at GATA elements in the regulatory region of CCR3 positively correlates with CCR3 transcription. Exp. Mol. Med. 2012, 44, 268–280. [Google Scholar] [CrossRef] [PubMed]
  28. Kurukuti, S.; Tiwari, V.K.; Tavoosidana, G.; Pugacheva, E.; Murrell, A.; Zhao, Z.; Lobanenkov, V.; Reik, W.; Ohlsson, R. CTCF binding at the H19 imprinting control region mediates maternally inherited higher-order chromatin conformation to restrict enhancer access to Igf2. Proc. Natl. Acad. Sci. USA 2006, 103, 10684–10689. [Google Scholar] [CrossRef] [PubMed]
  29. Court, F.; Camprubi, C.; Garcia, C.V.; Guillaumet-Adkins, A.; Sparago, A.; Seruggia, D.; Sandoval, J.; Esteller, M.; Martin-Trujillo, A.; Riccio, A.; et al. The PEG13-DMR and brain-specific enhancers dictate imprinted expression within the 8q24 intellectual disability risk locus. Epigenet. Chromatin 2014, 7, 5. [Google Scholar] [CrossRef] [PubMed]
  30. Aran, D.; Sabato, S.; Hellman, A. DNA methylation of distal regulatory sites characterizes dysregulation of cancer genes. Genome Biol. 2013, 14, R21. [Google Scholar] [CrossRef] [PubMed]
  31. Chen, L.; Ge, B.; Casale, F.P.; Vasquez, L.; Kwan, T.; Garrido-Martin, D.; Watt, S.; Yan, Y.; Kundu, K.; Ecker, S.; et al. Genetic Drivers of Epigenetic and Transcriptional Variation in Human Immune Cells. Cell 2016, 167, 1398.e24–1414.e24. [Google Scholar] [CrossRef] [PubMed]
  32. Javierre, B.M.; Burren, O.S.; Wilder, S.P.; Kreuzhuber, R.; Hill, S.M.; Sewitz, S.; Cairns, J.; Wingett, S.W.; Varnai, C.; Thiecke, M.J.; et al. Lineage-Specific Genome Architecture Links Enhancers and Non-coding Disease Variants to Target Gene Promoters. Cell 2016, 167, 1369.e19–1384.e19. [Google Scholar] [CrossRef] [PubMed]
  33. The ENCODE Project Consortium. An integrated encyclopedia of DNA elements in the human genome. Nature 2012, 489, 57–74. [Google Scholar] [CrossRef]
  34. Stunnenberg, H.G.; International Human Epigenome, C.; Hirst, M. The International Human Epigenome Consortium: A Blueprint for Scientific Collaboration and Discovery. Cell 2016, 167, 1145–1149. [Google Scholar] [CrossRef] [PubMed]
  35. Davison, L.J.; Wallace, C.; Cooper, J.D.; Cope, N.F.; Wilson, N.K.; Smyth, D.J.; Howson, J.M.; Saleh, N.; Al-Jeffery, A.; Angus, K.L.; et al. Long-range DNA looping and gene expression analyses identify DEXI as an autoimmune disease candidate gene. Hum. Mol. Genet. 2012, 21, 322–333. [Google Scholar] [CrossRef] [PubMed]
  36. Dryden, N.H.; Broome, L.R.; Dudbridge, F.; Johnson, N.; Orr, N.; Schoenfelder, S.; Nagano, T.; Andrews, S.; Wingett, S.; Kozarewa, I.; et al. Unbiased analysis of potential targets of breast cancer susceptibility loci by Capture Hi-C. Genome Res. 2014, 24, 1854–1868. [Google Scholar] [CrossRef] [PubMed]
  37. Martin, P.; McGovern, A.; Orozco, G.; Duffus, K.; Yarwood, A.; Schoenfelder, S.; Cooper, N.J.; Barton, A.; Wallace, C.; Fraser, P.; et al. Capture Hi-C reveals novel candidate genes and complex long-range interactions with related autoimmune risk loci. Nat. Commun. 2015, 6, 10069. [Google Scholar] [CrossRef] [PubMed]
  38. Mifsud, B.; Tavares-Cadete, F.; Young, A.N.; Sugar, R.; Schoenfelder, S.; Ferreira, L.; Wingett, S.W.; Andrews, S.; Grey, W.; Ewels, P.A.; et al. Mapping long-range promoter contacts in human cells with high-resolution capture Hi-C. Nat. Genet. 2015, 47, 598–606. [Google Scholar] [CrossRef] [PubMed]
  39. Smemo, S.; Tena, J.J.; Kim, K.H.; Gamazon, E.R.; Sakabe, N.J.; Gomez-Marin, C.; Aneas, I.; Credidio, F.L.; Sobreira, D.R.; Wasserman, N.F.; et al. Obesity-associated variants within FTO form long-range functional connections with IRX3. Nature 2014, 507, 371–375. [Google Scholar] [CrossRef] [PubMed]
  40. Stadhouders, R.; Aktuna, S.; Thongjuea, S.; Aghajanirefah, A.; Pourfarzad, F.; van Ijcken, W.; Lenhard, B.; Rooks, H.; Best, S.; Menzel, S.; et al. HBS1L-MYB intergenic variants modulate fetal hemoglobin via long-range MYB enhancers. J. Clin. Investig. 2014, 124, 1699–1710. [Google Scholar] [CrossRef] [PubMed]
  41. Maurano, M.T.; Humbert, R.; Rynes, E.; Thurman, R.E.; Haugen, E.; Wang, H.; Reynolds, A.P.; Sandstrom, R.; Qu, H.; Brody, J.; et al. Systematic localization of common disease-associated variation in regulatory DNA. Science 2012, 337, 1190–5119. [Google Scholar] [CrossRef] [PubMed]
  42. Kauskot, A.; Di Michele, M.; Loyen, S.; Freson, K.; Verhamme, P.; Hoylaerts, M.F. A novel mechanism of sustained platelet alphaIIbbeta3 activation via PEAR1. Blood 2012, 119, 4056–4065. [Google Scholar] [CrossRef] [PubMed]
  43. Kauskot, A.; Vandenbriele, C.; Louwette, S.; Gijsbers, R.; Tousseyn, T.; Freson, K.; Verhamme, P.; Hoylaerts, M.F. PEAR1 attenuates megakaryopoiesis via control of the PI3K/PTEN pathway. Blood 2013, 121, 5208–5217. [Google Scholar] [CrossRef] [PubMed]
  44. Vandenbriele, C.; Kauskot, A.; Vandersmissen, I.; Criel, M.; Geenens, R.; Craps, S.; Luttun, A.; Janssens, S.; Hoylaerts, M.F.; Verhamme, P. Platelet endothelial aggregation receptor-1: A novel modifier of neoangiogenesis. Cardiovasc. Res. 2015. [Google Scholar] [CrossRef] [PubMed]
  45. Faraday, N.; Yanek, L.R.; Yang, X.P.; Mathias, R.; Herrera-Galeano, J.E.; Suktitipat, B.; Qayyum, R.; Johnson, A.D.; Chen, M.H.; Tofler, G.H.; et al. Identification of a specific intronic PEAR1 gene variant associated with greater platelet aggregability and protein expression. Blood 2011, 118, 3367–3375. [Google Scholar] [CrossRef] [PubMed]
  46. Lewis, J.P.; Ryan, K.; O’Connell, J.R.; Horenstein, R.B.; Damcott, C.M.; Gibson, Q.; Pollin, T.I.; Mitchell, B.D.; Beitelshees, A.L.; Pakzy, R.; et al. Genetic variation in PEAR1 is associated with platelet aggregation and cardiovascular outcomes. Circ. Cardiovasc. Genet. 2013, 6, 184–192. [Google Scholar] [CrossRef] [PubMed]
  47. Kim, Y.; Suktitipat, B.; Yanek, L.R.; Faraday, N.; Wilson, A.F.; Becker, D.M.; Becker, L.C.; Mathias, R.A. Targeted deep resequencing identifies coding variants in the PEAR1 gene that play a role in platelet aggregation. PLoS ONE 2013, 8, e64179. [Google Scholar] [CrossRef] [PubMed]
  48. Wurtz, M.; Nissen, P.H.; Grove, E.L.; Kristensen, S.D.; Hvas, A.M. Genetic determinants of on-aspirin platelet reactivity: Focus on the influence of PEAR1. PLoS ONE 2014, 9, e111816. [Google Scholar] [CrossRef] [PubMed]
  49. Qayyum, R.; Becker, L.C.; Becker, D.M.; Faraday, N.; Yanek, L.R.; Leal, S.M.; Shaw, C.; Mathias, R.; Suktitipat, B.; Bray, P.F. Genome-wide association study of platelet aggregation in African Americans. BMC Genet. 2015, 16, 58. [Google Scholar] [CrossRef] [PubMed]
  50. Peng, L.L.; Zhao, Y.Q.; Zhou, Z.Y.; Jin, J.; Zhao, M.; Chen, X.M.; Chen, L.Y.; Cai, Y.F.; Li, J.L.; Huang, M. Associations of MDR1, TBXA2R, PLA2G7 and PEAR1 genetic polymorphisms with the platelet activity in Chinese ischemic stroke patients receiving aspirin therapy. Acta Pharmacol. Sin. 2016, 37, 1442–1448. [Google Scholar] [CrossRef] [PubMed]
  51. Backman, J.D.; Yerges-Armstrong, L.M.; Horenstein, R.B.; Newcomer, S.; Shaub, S.; Morrisey, M.; Donnelly, P.; Drolet, M.; Tanner, K.; Pavlovich, M.A.; et al. Prospective Evaluation of Genetic Variation in Platelet Endothelial Aggregation Receptor 1 Reveals Aspirin-Dependent Effects on Platelet Aggregation Pathways. Clin. Transl. Sci. 2017. [Google Scholar] [CrossRef] [PubMed]
  52. Li, M.; Hu, Y.; Wen, Z.; Li, H.; Hu, X.; Zhang, Y.; Zhang, Z.; Xiao, J.; Tang, J.; Chen, X. Association of PEAR1 rs12041331 polymorphism and pharmacodynamics of ticagrelor in healthy Chinese volunteers. Xenobiotica 2017, 1–9. [Google Scholar] [CrossRef] [PubMed]
  53. Izzi, B.; Pistoni, M.; Cludts, K.; Akkor, P.; Lambrechts, D.; Verfaillie, C.; Verhamme, P.; Freson, K.; Hoylaerts, M.F. Allele-specific DNA methylation reinforces PEAR1 enhancer activity. Blood 2016, 128, 1003–1012. [Google Scholar] [CrossRef] [PubMed]
  54. Eicher, J.D.; Chami, N.; Kacprowski, T.; Nomura, A.; Chen, M.H.; Yanek, L.R.; Tajuddin, S.M.; Schick, U.M.; Slater, A.J.; Pankratz, N.; et al. Platelet-Related Variants Identified by Exomechip Meta-analysis in 157,293 Individuals. Am. J. Hum. Genet. 2016, 99, 40–55. [Google Scholar] [CrossRef] [PubMed]
  55. Chen, M.H.; Yanek, L.R.; Backman, J.D.; Eicher, J.D.; Huffman, J.E.; Ben-Shlomo, Y.; Beswick, A.D.; Yerges-Armstrong, L.M.; Shuldiner, A.R.; O’Connell, J.R.; et al. Exome-chip meta-analysis identifies association between variation in ANKRD26 and platelet aggregation. Platelets 2017, 1–10. [Google Scholar] [CrossRef] [PubMed]
  56. Johnson, A.D. Pairing megakaryopoiesis methylation with PEAR1. Blood 2016, 128, 890–892. [Google Scholar] [CrossRef] [PubMed]
  57. Calo, E.; Wysocka, J. Modification of enhancer chromatin: What, how and why? Mol. Cell 2013, 49, 825–837. [Google Scholar] [CrossRef] [PubMed]
  58. Creyghton, M.P.; Cheng, A.W.; Welstead, G.G.; Kooistra, T.; Carey, B.W.; Steine, E.J.; Hanna, J.; Lodato, M.A.; Frampton, G.M.; Sharp, P.A.; et al. Histone H3K27ac separates active from poised enhancers and predicts developmental state. Proc. Natl. Acad. Sci. USA 2010, 107, 21931–21936. [Google Scholar] [CrossRef] [PubMed]
  59. Pekowska, A.; Benoukraf, T.; Zacarias-Cabeza, J.; Belhocine, M.; Koch, F.; Holota, H.; Imbert, J.; Andrau, J.C.; Ferrier, P.; Spicuglia, S. H3K4 tri-methylation provides an epigenetic signature of active enhancers. EMBO J. 2011, 30, 4198–4210. [Google Scholar] [CrossRef] [PubMed]
  60. Schofield, E.C.; Carver, T.; Achuthan, P.; Freire-Pritchett, P.; Spivakov, M.; Todd, J.A.; Burren, O.S. CHiCP: A web-based tool for the integrative and interactive visualization of promoter capture Hi-C datasets. Bioinformatics 2016, 32, 2511–2513. [Google Scholar] [CrossRef] [PubMed]
  61. Petersen, R.; Lambourne, J.J.; Javierre, B.M.; Grassi, L.; Kreuzhuber, R.; Ruklisa, D.; Rosa, I.M.; Tome, A.R.; Elding, H.; van Geffen, J.P.; et al. Platelet function is modified by common sequence variation in megakaryocyte super enhancers. Nat. Commun. 2017, 8, 16058. [Google Scholar] [CrossRef] [PubMed]
  62. Coute, Y.; Kindbeiter, K.; Belin, S.; Dieckmann, R.; Duret, L.; Bezin, L.; Sanchez, J.C.; Diaz, J.J. ISG20L2, a novel vertebrate nucleolar exoribonuclease involved in ribosome biogenesis. Mol. Cell. Proteomics MCP 2008, 7, 546–559. [Google Scholar] [CrossRef] [PubMed]
  63. Efroni, S.; Duttagupta, R.; Cheng, J.; Dehghani, H.; Hoeppner, D.J.; Dash, C.; Bazett-Jones, D.P.; Le Grice, S.; McKay, R.D.; Buetow, K.H.; et al. Global transcription in pluripotent embryonic stem cells. Cell Stem Cell 2008, 2, 437–447. [Google Scholar] [CrossRef] [PubMed]
  64. Eckfeldt, C.E.; Mendenhall, E.M.; Verfaillie, C.M. The molecular repertoire of the ‘almighty’ stem cell. Nat. Rev. Mol. Cell Biol. 2005, 6, 726–737. [Google Scholar] [CrossRef] [PubMed] [Green Version]
  65. Arney, K.L.; Fisher, A.G. Epigenetic aspects of differentiation. J. Cell Sci. 2004, 117, 4355–4363. [Google Scholar] [CrossRef] [PubMed]
  66. Shetty, A.; Dasari, S.; Banerjee, S.; Gheewala, T.; Zheng, G.; Chen, A.; Kajdacsy-Balla, A.; Bosland, M.C.; Munirathinam, G. Hepatoma-derived growth factor: A survival-related protein in prostate oncogenesis and a potential target for vitamin K2. Urol. Oncol. 2016, 34, 483.e1–483.e8. [Google Scholar] [CrossRef] [PubMed]
  67. Yang, G.Y.; Zhang, A.Q.; Wang, J.; Li, C.H.; Wang, X.Q.; Pan, K.; Zhou, C.; Dong, J.H. Hepatoma-derived growth factor promotes growth and metastasis of hepatocellular carcinoma cells. Cell Biochem. Funct. 2016, 34, 274–285. [Google Scholar] [CrossRef] [PubMed]
  68. Giri, K.; Pabelick, C.M.; Mukherjee, P.; Prakash, Y.S. Hepatoma derived growth factor (HDGF) dynamics in ovarian cancer cells. Apoptosis 2016, 21, 329–339. [Google Scholar] [CrossRef] [PubMed]
  69. Xiong, L.; Chen, X.; Liu, N.; Wang, Z.; Miao, B.; Gan, W.; Li, D.; Guo, H. PRCC-TFE3 dual-fusion FISH assay: A new method for identifying PRCC-TFE3 renal cell carcinoma in paraffin-embedded tissue. PLoS ONE 2017, 12, e0185337. [Google Scholar] [CrossRef] [PubMed]
  70. Medendorp, K.; van Groningen, J.J.; Vreede, L.; Hetterschijt, L.; Brugmans, L.; van den Hurk, W.H.; van Kessel, A.G. The renal cell carcinoma-associated oncogenic fusion protein PRCCTFE3 provokes p21 WAF1/CIP1-mediated cell cycle delay. Exp. Cell Res. 2009, 315, 2399–2409. [Google Scholar] [CrossRef] [PubMed]
  71. LeBlanc, M.E.; Wang, W.; Chen, X.; Ji, Y.; Shakya, A.; Shen, C.; Zhang, C.; Gonzalez, V.; Brewer, M.; Ma, J.X.; et al. The regulatory role of hepatoma-derived growth factor as an angiogenic factor in the eye. Mol. Vis. 2016, 22, 374–386. [Google Scholar] [PubMed]
  72. Zhao, W.Y.; Wang, Y.; An, Z.J.; Shi, C.G.; Zhu, G.A.; Wang, B.; Lu, M.Y.; Pan, C.K.; Chen, P. Downregulation of miR-497 promotes tumor growth and angiogenesis by targeting HDGF in non-small cell lung cancer. Biochem. Biophys. Res. Commun. 2013, 435, 466–471. [Google Scholar] [CrossRef] [PubMed]
  73. Li, S.Z.; Zhao, Y.B.; Cao, W.D.; Qu, Y.; Luo, P.; Zhen, H.N.; Chen, X.Y.; Yan, Z.F.; Fei, Z. The expression of hepatoma-derived growth factor in primary central nervous system lymphoma and its correlation with angiogenesis, proliferation and clinical outcome. Med. Oncol. 2013, 30, 622. [Google Scholar] [CrossRef] [PubMed]
  74. Shih, T.C.; Tien, Y.J.; Wen, C.J.; Yeh, T.S.; Yu, M.C.; Huang, C.H.; Lee, Y.S.; Yen, T.C.; Hsieh, S.Y. MicroRNA-214 downregulation contributes to tumor angiogenesis by inducing secretion of the hepatoma-derived growth factor in human hepatoma. J. Hepatol. 2012, 57, 584–591. [Google Scholar] [CrossRef] [PubMed]
  75. Thirant, C.; Galan-Moya, E.M.; Dubois, L.G.; Pinte, S.; Chafey, P.; Broussard, C.; Varlet, P.; Devaux, B.; Soncin, F.; Gavard, J.; et al. Differential proteomic analysis of human glioblastoma and neural stem cells reveals HDGF as a novel angiogenic secreted factor. Stem Cells 2012, 30, 845–853. [Google Scholar] [CrossRef] [PubMed]
  76. Fisch, A.S.; Yerges-Armstrong, L.M.; Backman, J.D.; Wang, H.; Donnelly, P.; Ryan, K.A.; Parihar, A.; Pavlovich, M.A.; Mitchell, B.D.; O’Connell, J.R.; et al. Genetic Variation in the Platelet Endothelial Aggregation Receptor 1 Gene Results in Endothelial Dysfunction. PLoS ONE 2015, 10, e0138795. [Google Scholar] [CrossRef] [PubMed]
  77. Sun, Y.; Vandenbriele, C.; Kauskot, A.; Verhamme, P.; Hoylaerts, M.F.; Wright, G.J. A human platelet receptor protein microarray identifies FcepsilonR1alpha as an activating PEAR1 ligand. Mol. Cell. Proteomics MCP 2015. [Google Scholar] [CrossRef] [PubMed]
  78. Vandenbriele, C.; Sun, Y.; Criel, M.; Cludts, K.; Van Kerckhoven, S.; Izzi, B.; Vanassche, T.; Verhamme, P.; Hoylaerts, M.F. Dextran sulfate triggers platelet aggregation via direct activation of PEAR1. Platelets 2016, 27, 365–372. [Google Scholar] [CrossRef] [PubMed]
  79. Nanda, N.; Bao, M.; Lin, H.; Clauser, K.; Komuves, L.; Quertermous, T.; Conley, P.B.; Phillips, D.R.; Hart, M.J. Platelet endothelial aggregation receptor 1 (PEAR1), a novel epidermal growth factor repeat-containing transmembrane receptor, participates in platelet contact-induced activation. J. Biol. Chem. 2005, 280, 24680–24689. [Google Scholar] [CrossRef] [PubMed]
  80. Dauwe, D.; Pelacho, B.; Wibowo, A.; Walravens, A.S.; Verdonck, K.; Gillijns, H.; Caluwe, E.; Pokreisz, P.; van Gastel, N.; Carmeliet, G.; et al. Neovascularization Potential of Blood Outgrowth Endothelial Cells From Patients With Stable Ischemic Heart Failure Is Preserved. J. Am. Heart Assoc. 2016, 5, e002288. [Google Scholar] [CrossRef] [PubMed]
  81. Jaffe, E.A.; Nachman, R.L.; Becker, C.G.; Minick, C.R. Culture of human endothelial cells derived from umbilical veins. Identification by morphologic and immunologic criteria. J. Clin. Investig. 1973, 52, 2745–2756. [Google Scholar] [CrossRef] [PubMed]
  82. Van Beem, R.T.; Verloop, R.E.; Kleijer, M.; Noort, W.A.; Loof, N.; Koolwijk, P.; van der Schoot, C.E.; van Hinsbergh, V.W.; Zwaginga, J.J. Blood outgrowth endothelial cells from cord blood and peripheral blood: Angiogenesis-related characteristics in vitro. J. Thromb. Haemost. JTH 2009, 7, 217–226. [Google Scholar] [CrossRef] [PubMed]
  83. Izzi, B.; Binder, A.M.; Michels, K.B. Pyrosequencing Evaluation of Widely Available Bisulfite Conversion Methods: Considerations for Application. Med. Epigenet. 2014, 2, 28–36. [Google Scholar] [CrossRef] [PubMed] [Green Version]
  84. Izzi, B.; Decallonne, B.; Devriendt, K.; Bouillon, R.; Vanderschueren, D.; Levtchenko, E.; de Zegher, F.; Van den Bruel, A.; Lambrechts, D.; Van Geet, C.; et al. A new approach to imprinting mutation detection in GNAS by Sequenom EpiTYPER system. Clin. Chim. Acta 2010, 411, 2033–2039. [Google Scholar] [CrossRef] [PubMed]
  85. Izzi, B.; Francois, I.; Labarque, V.; Thys, C.; Wittevrongel, C.; Devriendt, K.; Legius, E.; Van den Bruel, A.; D’Hooghe, M.; Lambrechts, D.; et al. Methylation defect in imprinted genes detected in patients with an Albright’s hereditary osteodystrophy like phenotype and platelet Gs hypofunction. PLoS ONE 2012, 7, e38579. [Google Scholar] [CrossRef] [PubMed]
Figure 1. PEAR1 CHiCP bait overlaps with an enhancer region including PEAR1 CGI1 and intron 1. Exons are depicted as black boxes, introns as black lines. PCGI1, Pintron and PCGI2 indicate the regions analysed in the methylation study as described in material and methods and [53]. PEAR1 bait of 7.48 Kb (chr1:156,861,611–156,869,031) identified in the CHiCP analysis is represented as black box. Human Umbilical Vein Endothelial Cells (HUVECs) and K562 H3K4Me1, H3K4Me3 and H3K27Ac profiles are displayed as coloured overlaid histograms (light blue for HUVECs, purple for K562) in “auto-scale to data view” mode that takes the highest signal in the selected region as the 100% of the intensity and display all other signals accordingly (data produced by the Bernstein Lab at the Broad Institute and the UCSC and part of the ENCODE database). PEAR1 CHiCP bait overlaps with high deposition of the enhancer specific histone marker H3K4Me1 and the promoter specific H3K4Me3. High peaks of the open active chromatin specific histone mark H3K27Ac are also visible in the same region. Adapted from UCSC Browser.
Ijms 19 01069 g001
Figure 2. PEAR1 DNA methylation is higher in megakaryocyte precursors than in HUVECS or Blood Outgrowth Endothelial cells (BOECs). PEAR1 methylation profile in HUVECs, BOECs and Megakaryocytes (MK) precursors (indicated as “MKs”) analysed on at least 3 biological replicates (data reported as mean +/− SD). * p < 0.05, ** p < 0.001, *** p < 0.0001, **** p < 0.00001, unpaired t-test.
Ijms 19 01069 g002
Figure 3. Endothelial precursors and megakaryocytes share similar PEAR1 interactome. Circular overview of PEAR1 interactions in endothelial precursors (A); megakaryocytes (B) and neutrophils (C). Two baits are found in PEAR1 to show interactions, one at the beginning (7.48 Kb, chr1:156,861,611–156,869,031, Assembly 2009, displayed as black box in Figure 1) and one towards the end of the gene (21.26 Kb, chr1:156,881,919–156,903,177, Assembly 2009). Interacting genes are connected by lines and their names are reported on the circle together with their genomic context, defined by colours (protein coding in blue, lincRNA in orange, snoRNA in red, antisense transcript in purple, miRNA in pink, snRNA in brown, pseudogene in grey, miscRNA in black, processed transcripts in green). Interactions with score above 5 are represented with coloured lines with red being the colour referring to the top interactions. Grey lines represent interactions with score below 5, discarded from the analysis.
Ijms 19 01069 g003
Figure 4. Magnification of PEAR1 chromosome interactions in endothelial precursors and MKs. Magnification of shared PEAR1 chromosome interactions among endothelial precursors and MKs in the top left panel. Each interaction is indicated with a number and the correspondent magnification displayed in the right panel reporting gene names, regions of interactions and direction of transcription. *: PEAR1 interaction that involved a second region of the gene corresponding to location chr1:156,881,919–156,903,177 and not covering PEAR1 enhancer region analysed in this study.
Ijms 19 01069 g004
Figure 5. PEAR1-interacting genes. Exons are depicted as black boxes, introns as black lines. 1, 2 and 3 in red indicate the regions analysed in the methylation study as described in material and methods and [53] to cover the ISG20L2/RRNAD1, HDGF and PRCC CpG islands (depicted as green boxes). H3K4Me1, H3K4Me3 and H3K27Ac profiles are displayed as coloured overlaid histograms (light blue for HUVECs, purple for K562) in “auto-scale to data view” mode that takes the highest signal in the selected region as the 100% of the intensity and display all other signals accordingly (data produced by the Bernstein Lab at the Broad Institute and the UCSC and part of the ENCODE database). All regions included in the methylation study show high deposition of the enhancer specific histone marker H3K4Me1 and the promoter specific H3K4Me3. High peaks of the open active chromatin specific histone mark H3K27Ac are also visible in the same regions. Adapted from UCSC Browser.
Ijms 19 01069 g005
Figure 6. PEAR1 interacting gene expression. ISG20L2, RRNAD1, MRLP24, HDGF, PRCC and PEAR1 expression via quantitative RT-PCR in HUVECs and MK precursors (day 14) from at least 3 biological replicates (mean +/− SD). For each gene data are expressed as “fold” increase relative to GAPDH expression and presented as ratio vs. PEAR1-GAPDH ∆Ct. * p-value < 0.05, *** p-value < 0.0001, unpaired t-test. Details on assays used are reported in Materials and Methods.
Ijms 19 01069 g006
Table 1. PEAR1 interacting genes.
PEAR1 BaitEndothelial PrecursorsLocation of TargetSize TargetName TargetScoreGenomic Context
chr1:156,861,611–156,869,031 (7.42 KB) chr1:156,696,068–156,699,4493.38 KBISG20L2 and RRNAD130.34protein coding
chr1:156,682,729–156,685,2242.50 KBRP11-66D17.517.66antisense
chr1:156,707,018–156,715,8998.88 KBMRPL24 and HDGF13.62protein coding
chr1:156,715,900–156,723,1067.21 KBPRCC and HDGF10.71protein coding
chr1:156,736,011–156,736,8690.86 KBPRCC and HDGF10.15protein coding
chr1:156,557,122–156,562,6605.54 KBAPOA1BP and AL365181.17.8protein coding and miRNA
chr1:156,582,371–156,589,7667.39 KBRP11-284F21.11 and HAPLN26.65lincRNA and protein coding
chr1:156,622,326–156,650,01527.69 KBRP11-284F21.7 and BCAN and NES6.18antisense and protein coding
MegakaryocytesLocation of TargetSize TargetName TargetScoreGenomic Context
chr1:156,696,068–156,699,4493.38 KBISG20L2 and RRNAD122.64protein coding
chr1:156,682,729–156,685,2242.50 KBRP11-66D17.511.97antisense
chr1:156,736,011–156,736,8690.86 KBPRCC and HDGF7.86protein coding
chr1:156,715,900–156,723,1067.21 KBPRCC and HDGF6.18protein coding
chr1:156,707,018–156,715,8998.88 KBMRPL24 and HDGF5.81protein coding
Nucleotide positions according to the February 2009 human reference sequence (NCBI GRCh37/hg19) produced by the International Human Genome Sequencing Consortium.
Table 2. Gene Ontology (GO) terms of PEAR1 interacting genes.
Gene NameProtein NameGene Ontology (GO)—Biological Processes
ISG20L2Interferon Stimulated Exonuclease Gene 20 Like 2rRNA processing (GO:0006364); ribosome biogenesis (GO:0042254); nucleic acid phosphodiester bond hydrolysis (GO:0090305); RNA phosphodiester bond hydrolysis, exonucelolytic (GO:0090503).
RRNAD1Ribosomal RNA Adenine Dimethylase Domain Containing 1rRNA methylation (GO:0031167); methylation (GO:0032259).
PRCCPapillary Renal Cell Carcinoma (Translocation-Associated)mRNA splicing, via spliceosome (GO:0000398); cell cycle (GO:0007049); mitotic cell cycle checkpoint (GO:0007093).
HDGFHeparin Binding Growth Factornegative regulation of transcription from RNA polymerase II promoter (GO:0000122); transcription, DNA templated (GO:00006351); regulation of transcription (GO:0006355); signal transduction (GO:0007165); cell proliferation (GO:0008283).
MRPL24Mitochondrial Ribosomal Protein L24translation (GO:0070126); Mitochondrial translation elongation(GO:0070125); mitochondrial translation termination (GO:0070126)

