Fenugreek (Trigonella Foenum-Graecum) Seed Flour and Diosgenin Preserve Endothelium-Dependent Arterial Relaxation in a Rat Model of Early-Stage Metabolic Syndrome


 , ,
, ,
Abstract
:
1. Introduction
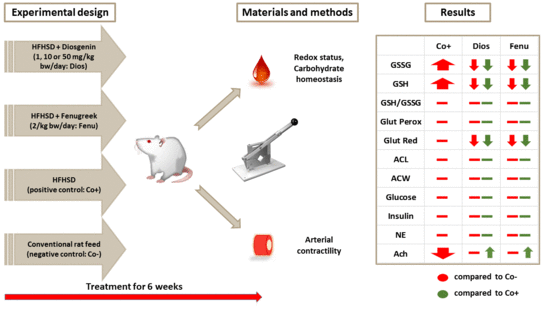
2. Results
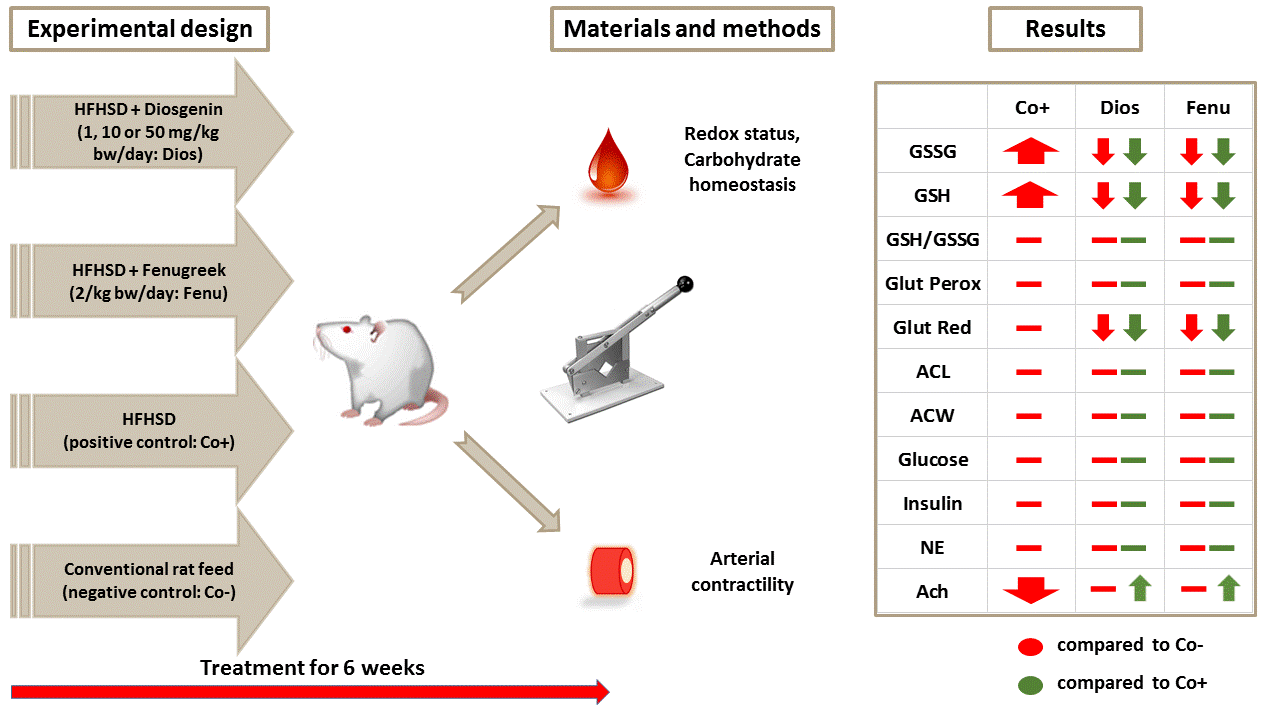
2.1. Characteristics of the Animal Model
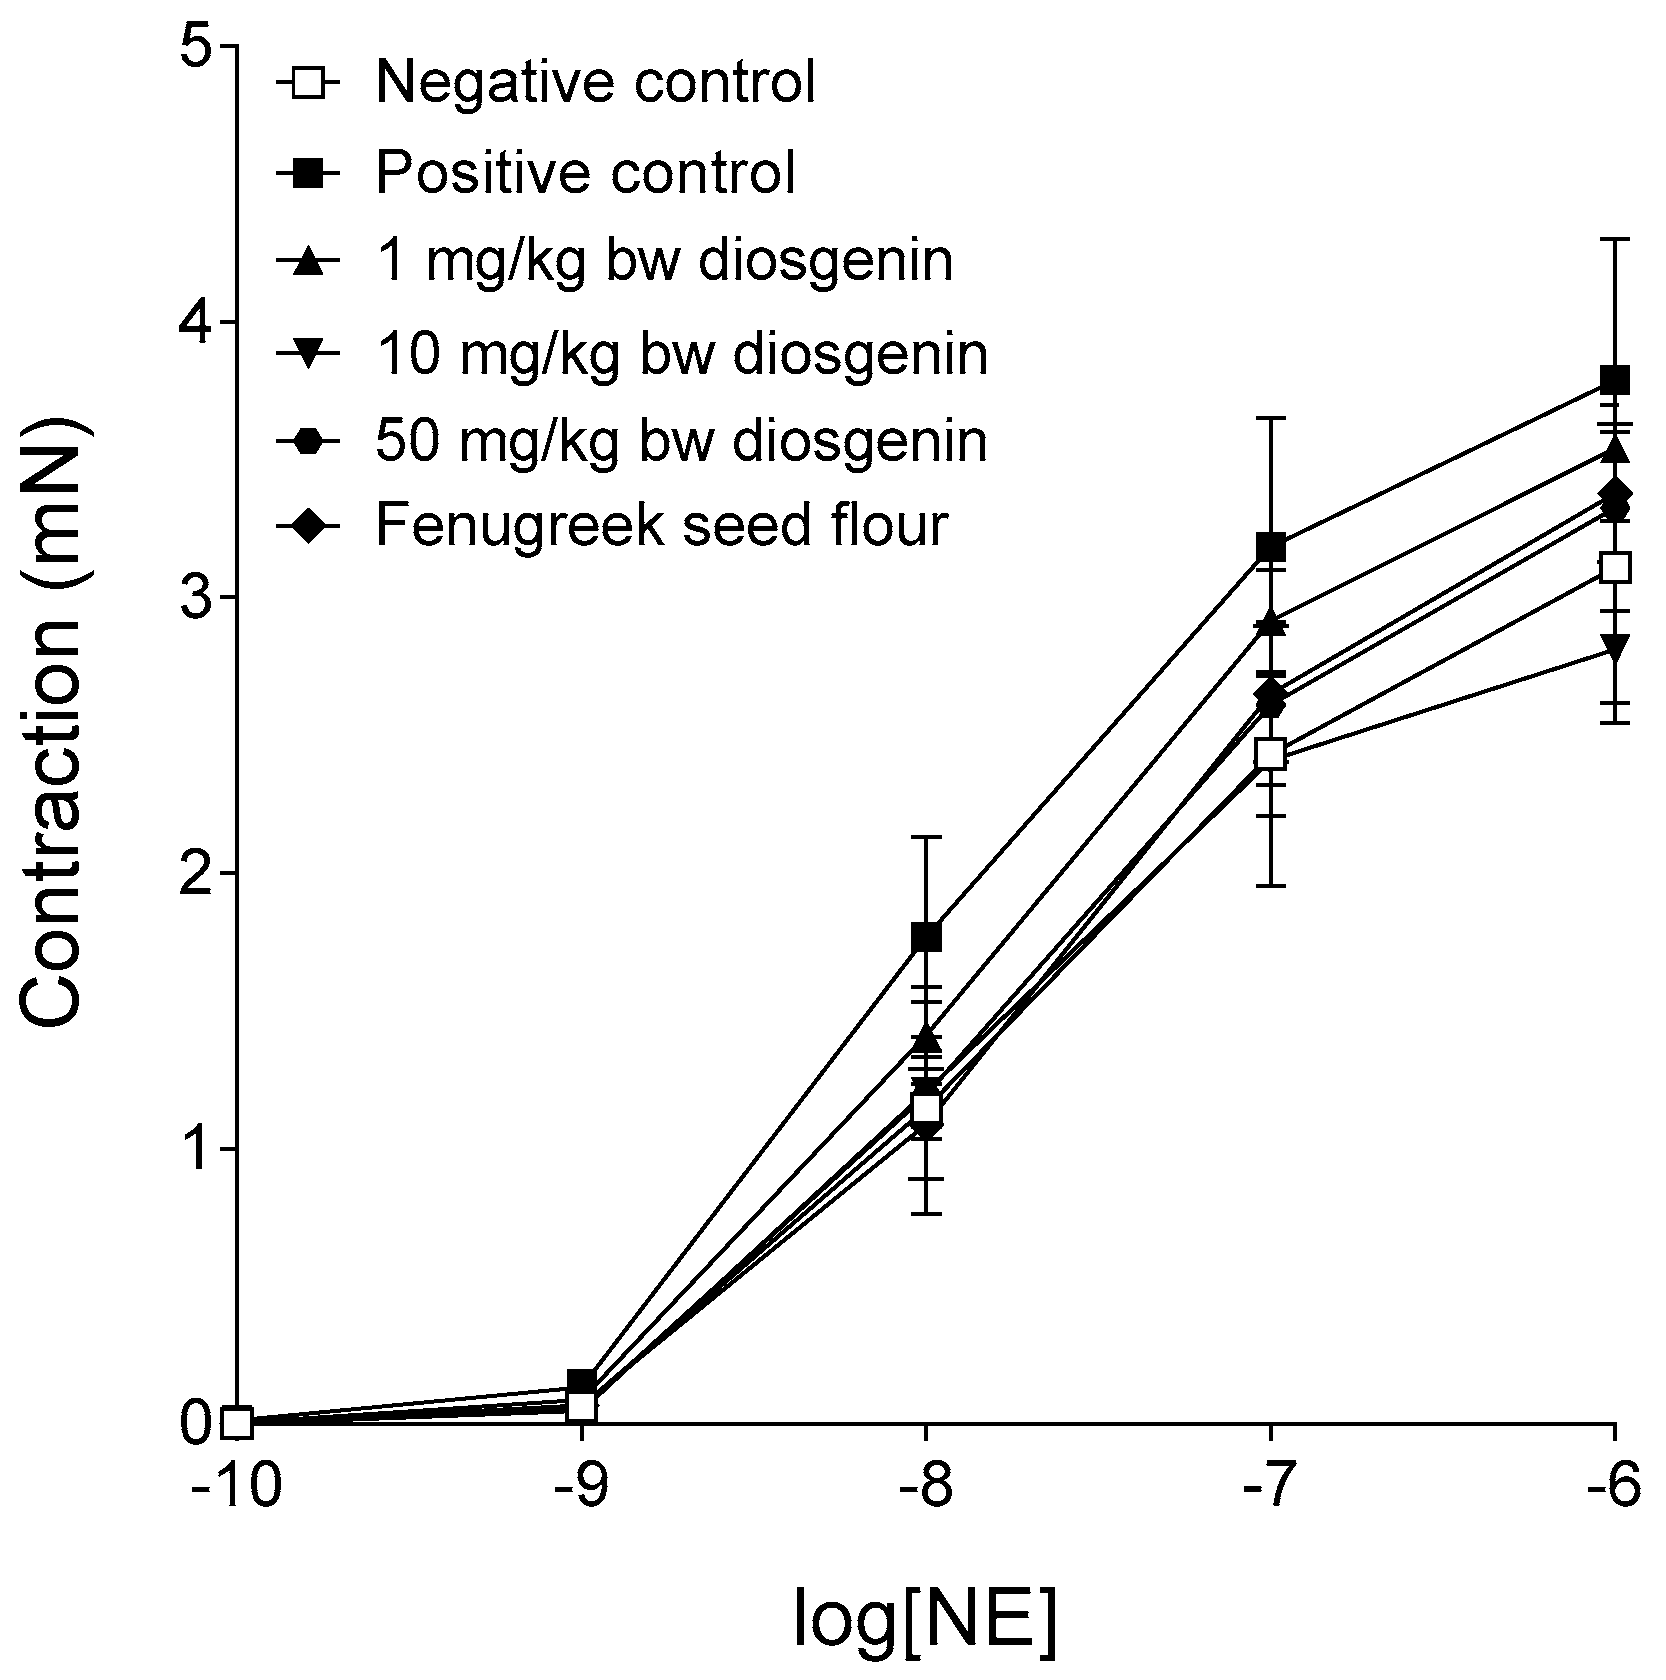
2.2. Response to Norepinephrine
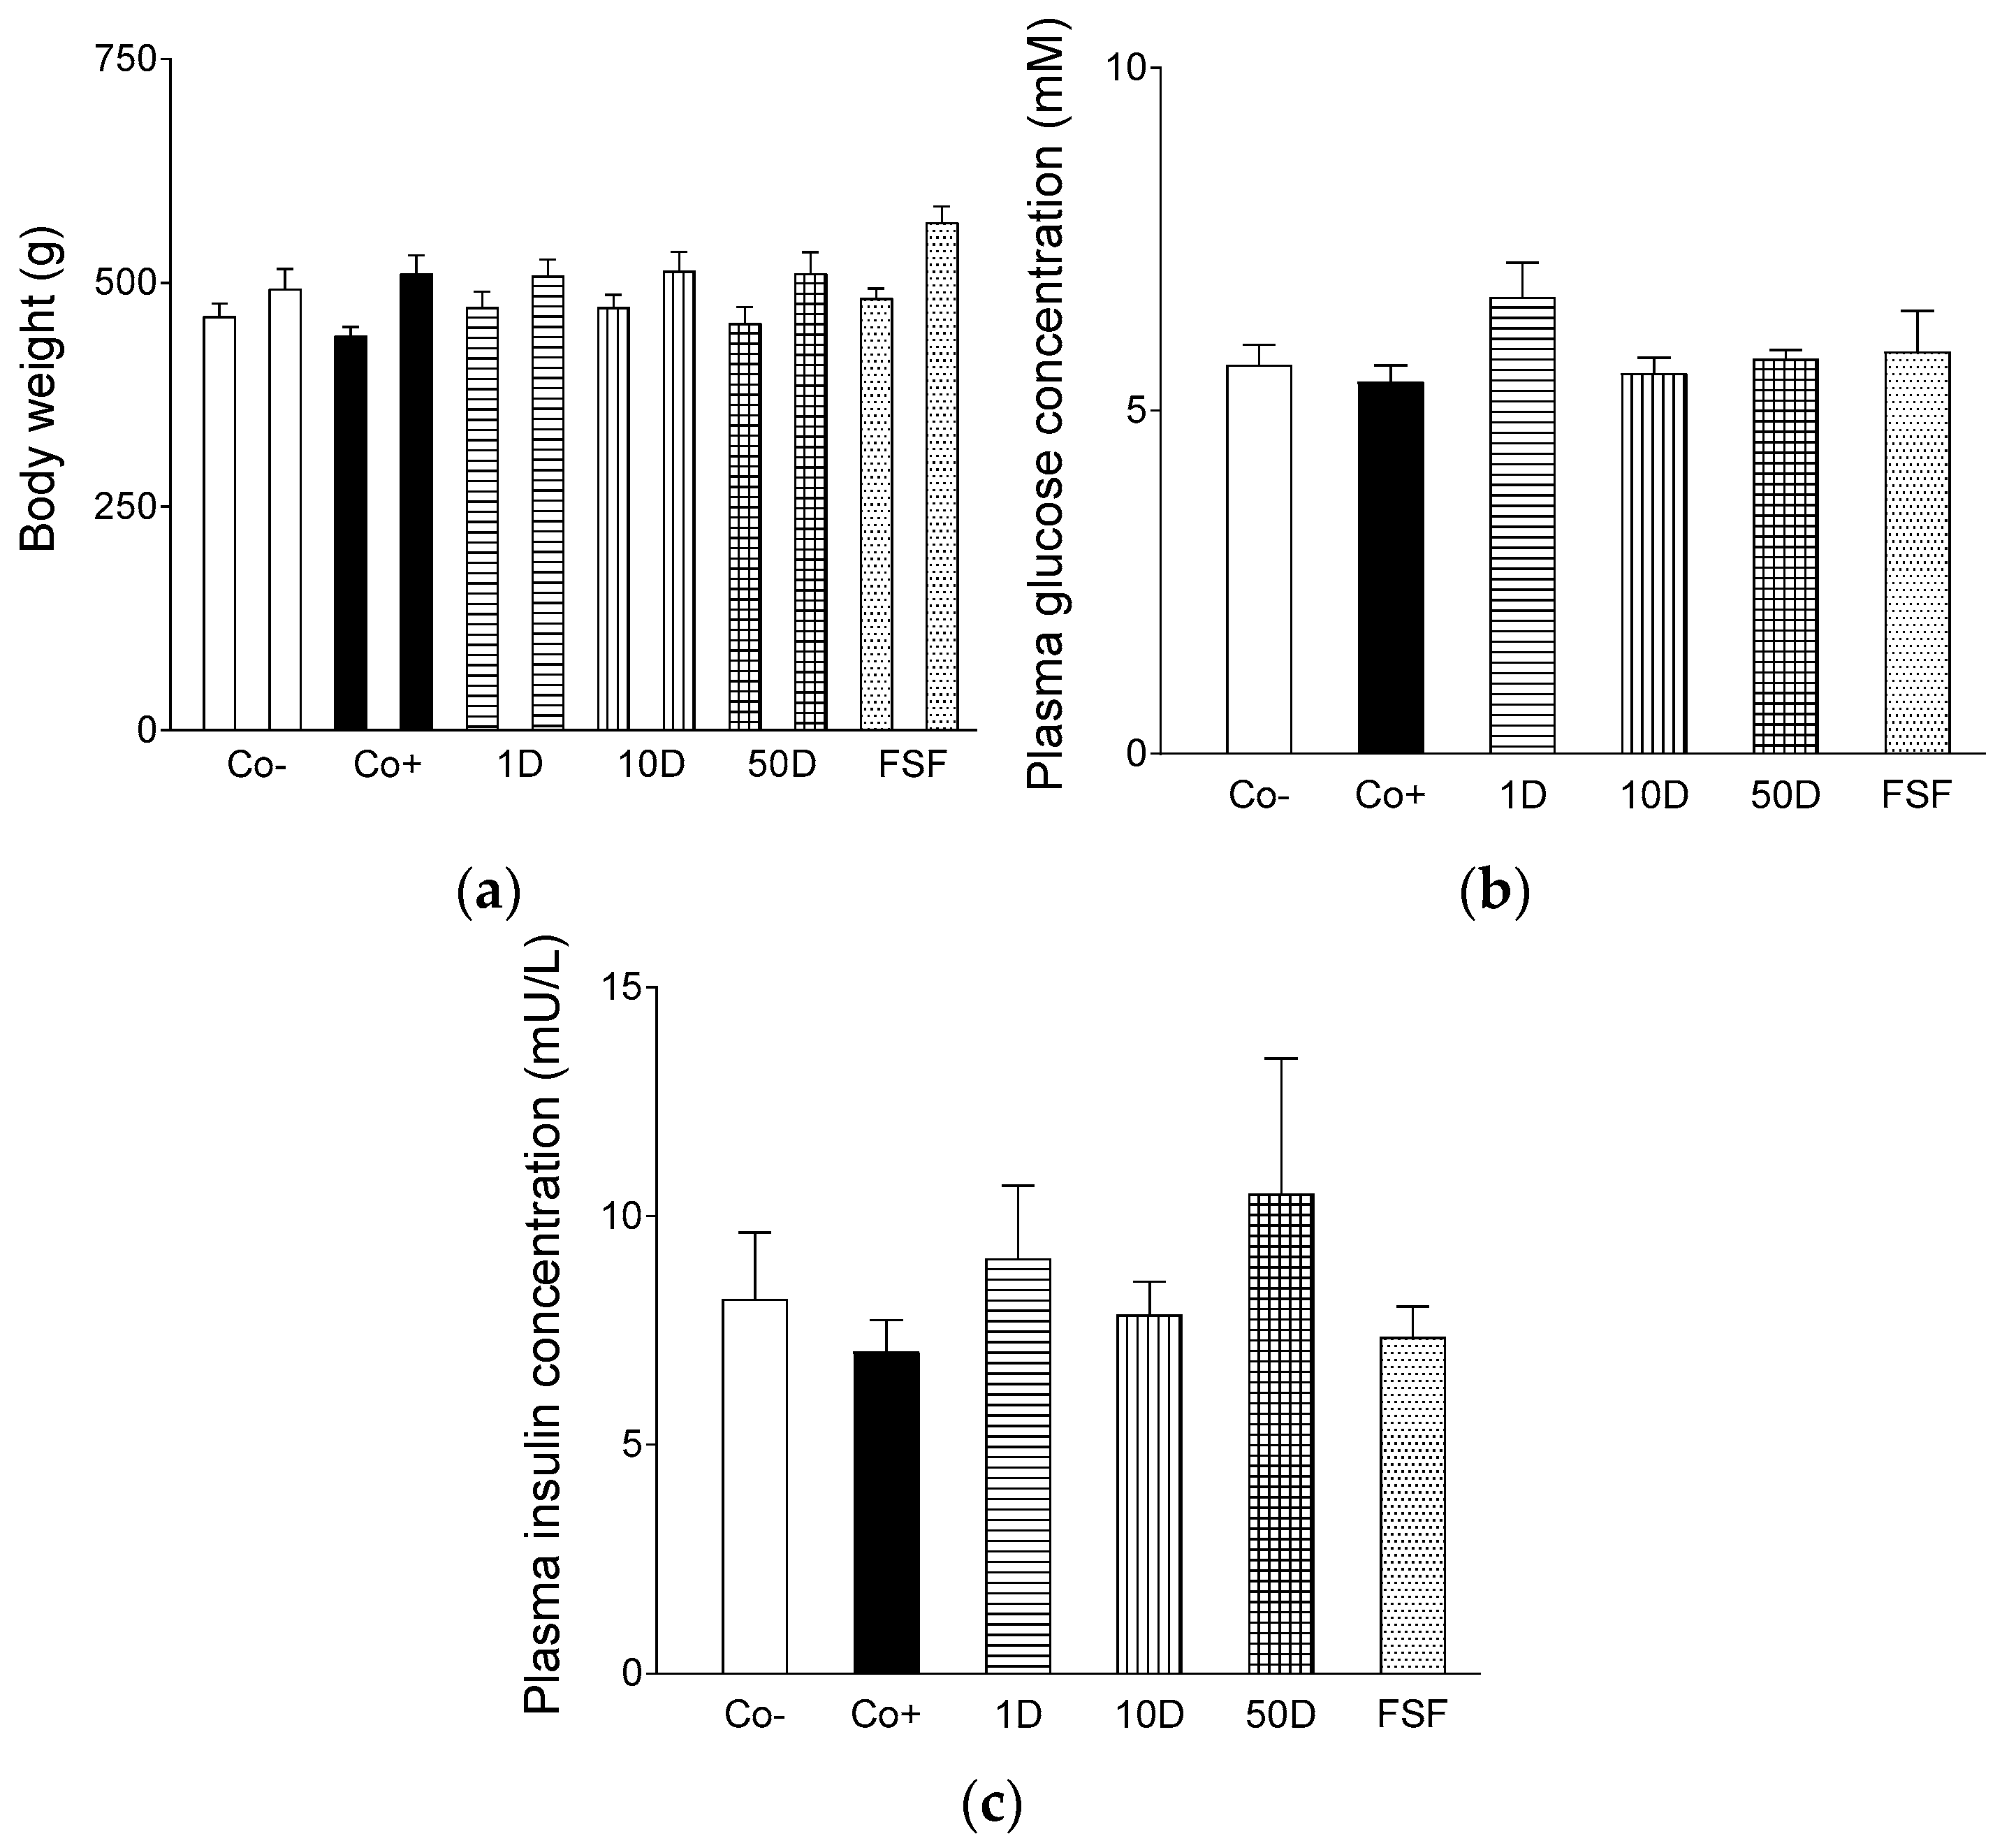
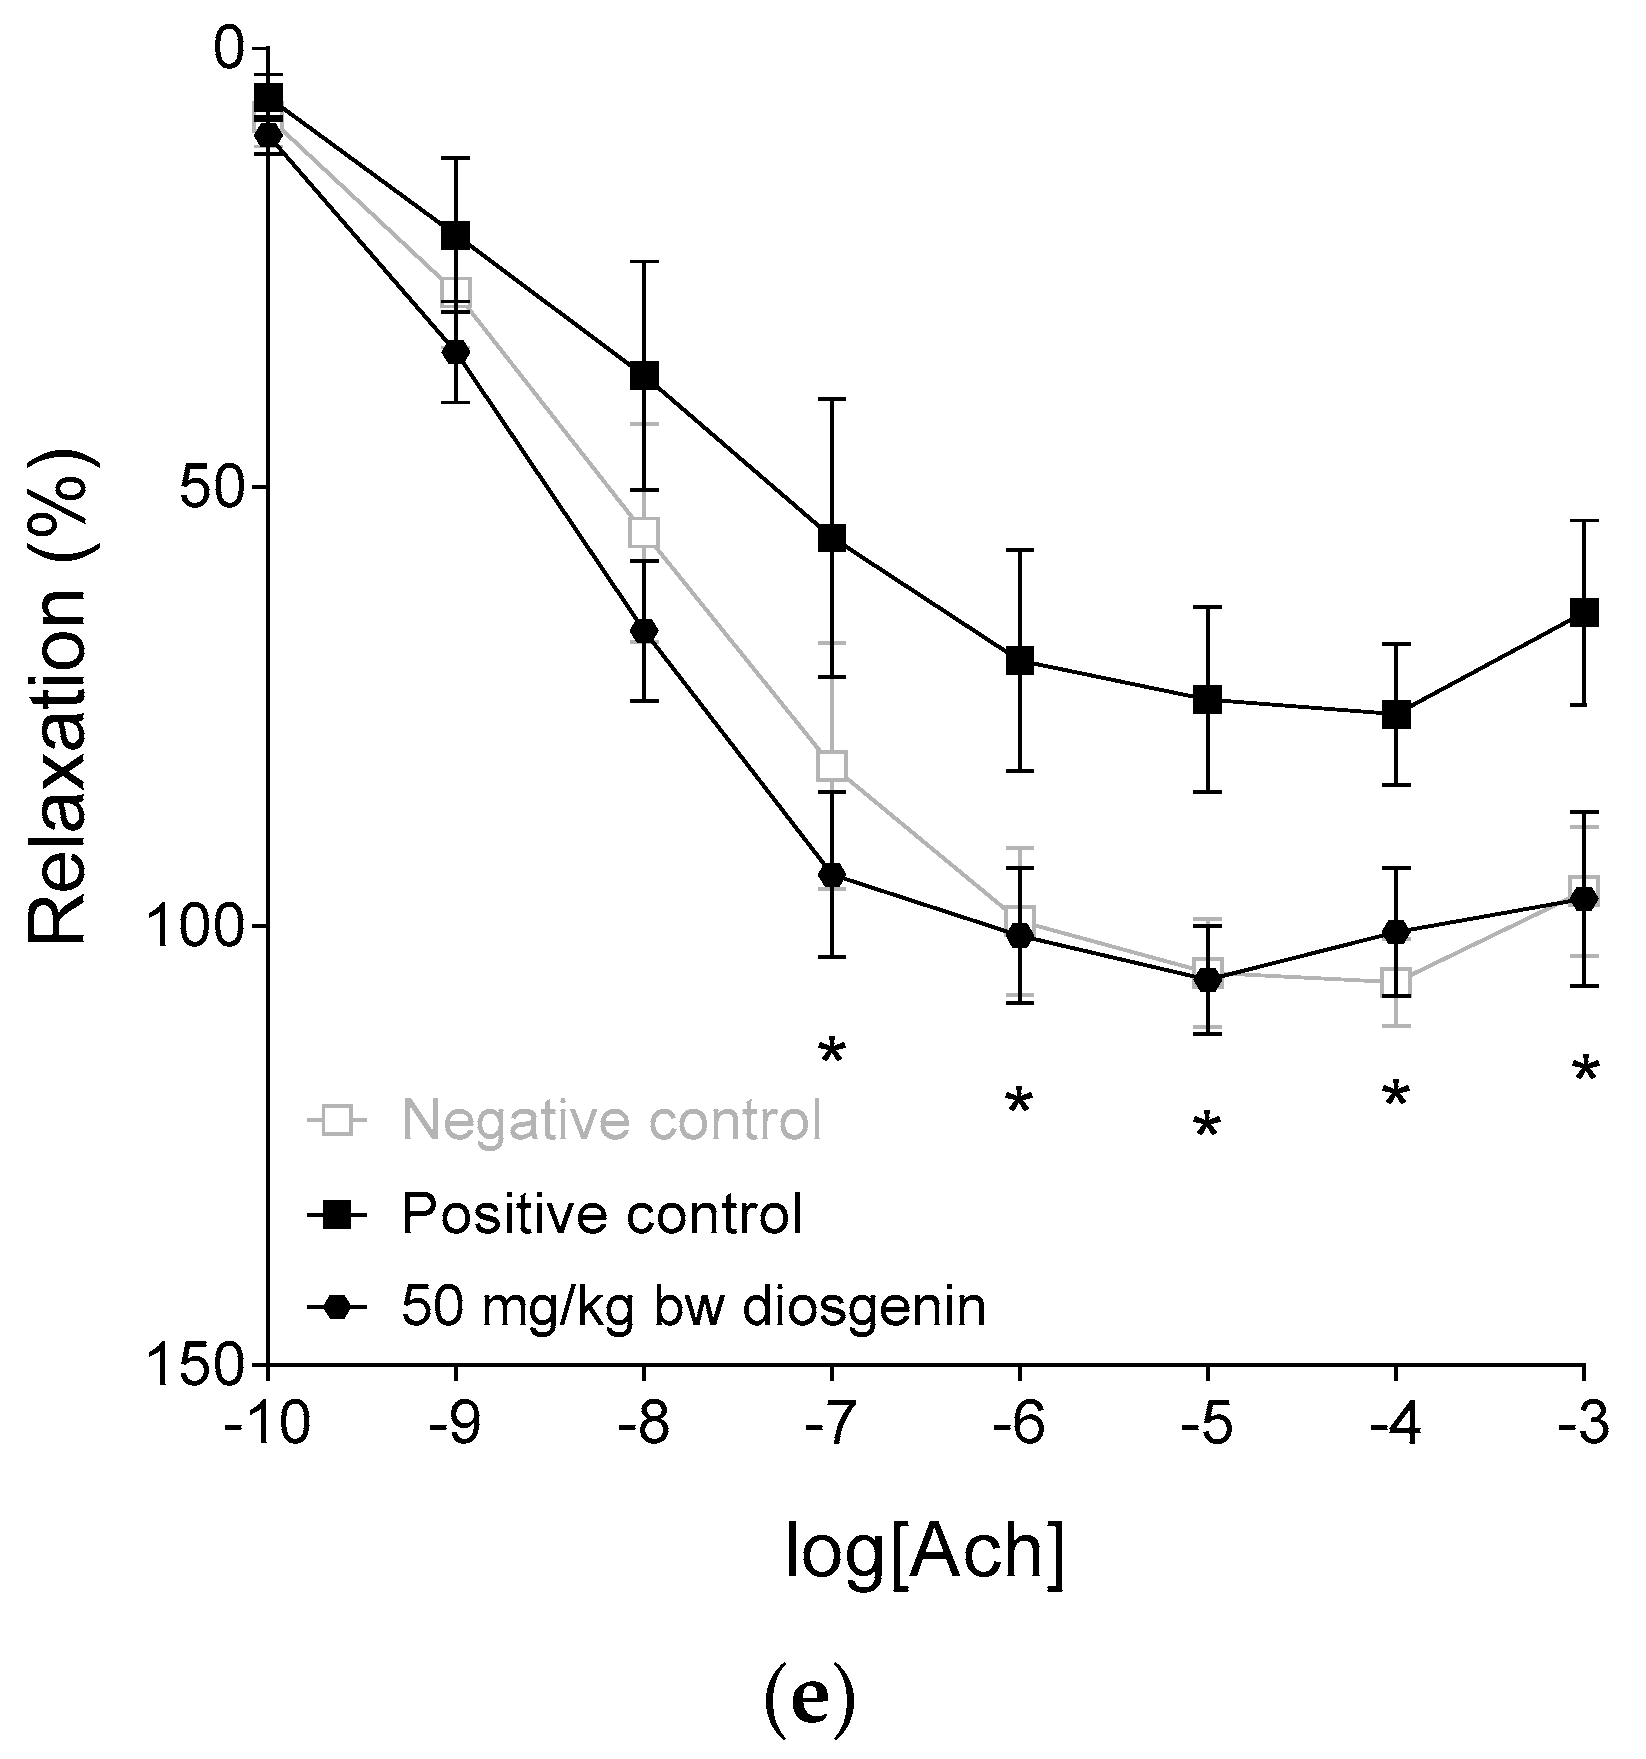
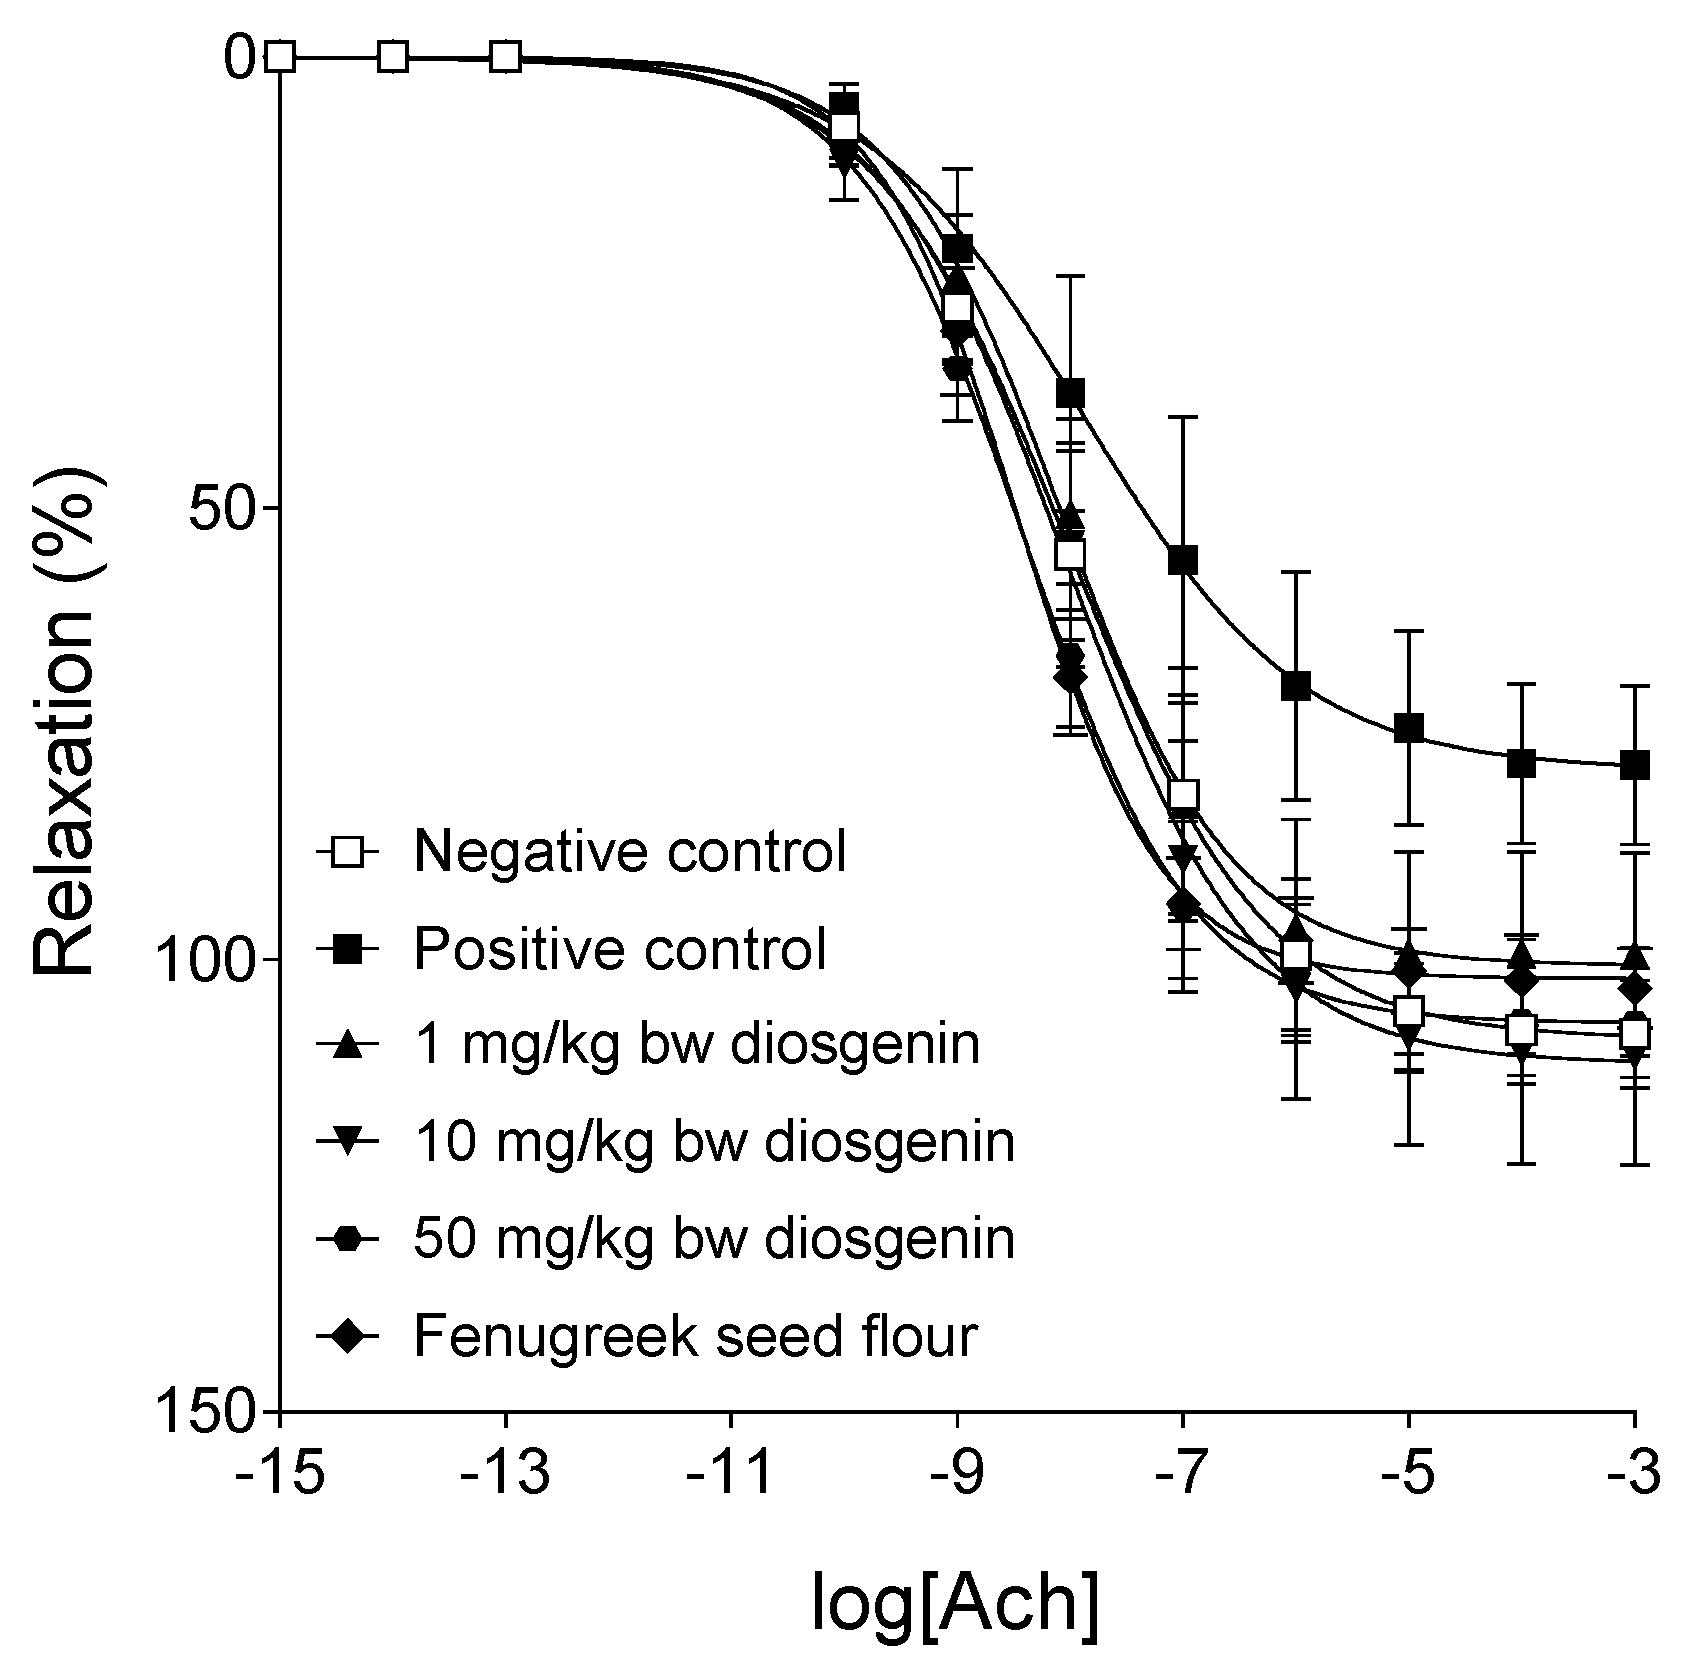
2.3. Response to Acetylcholine
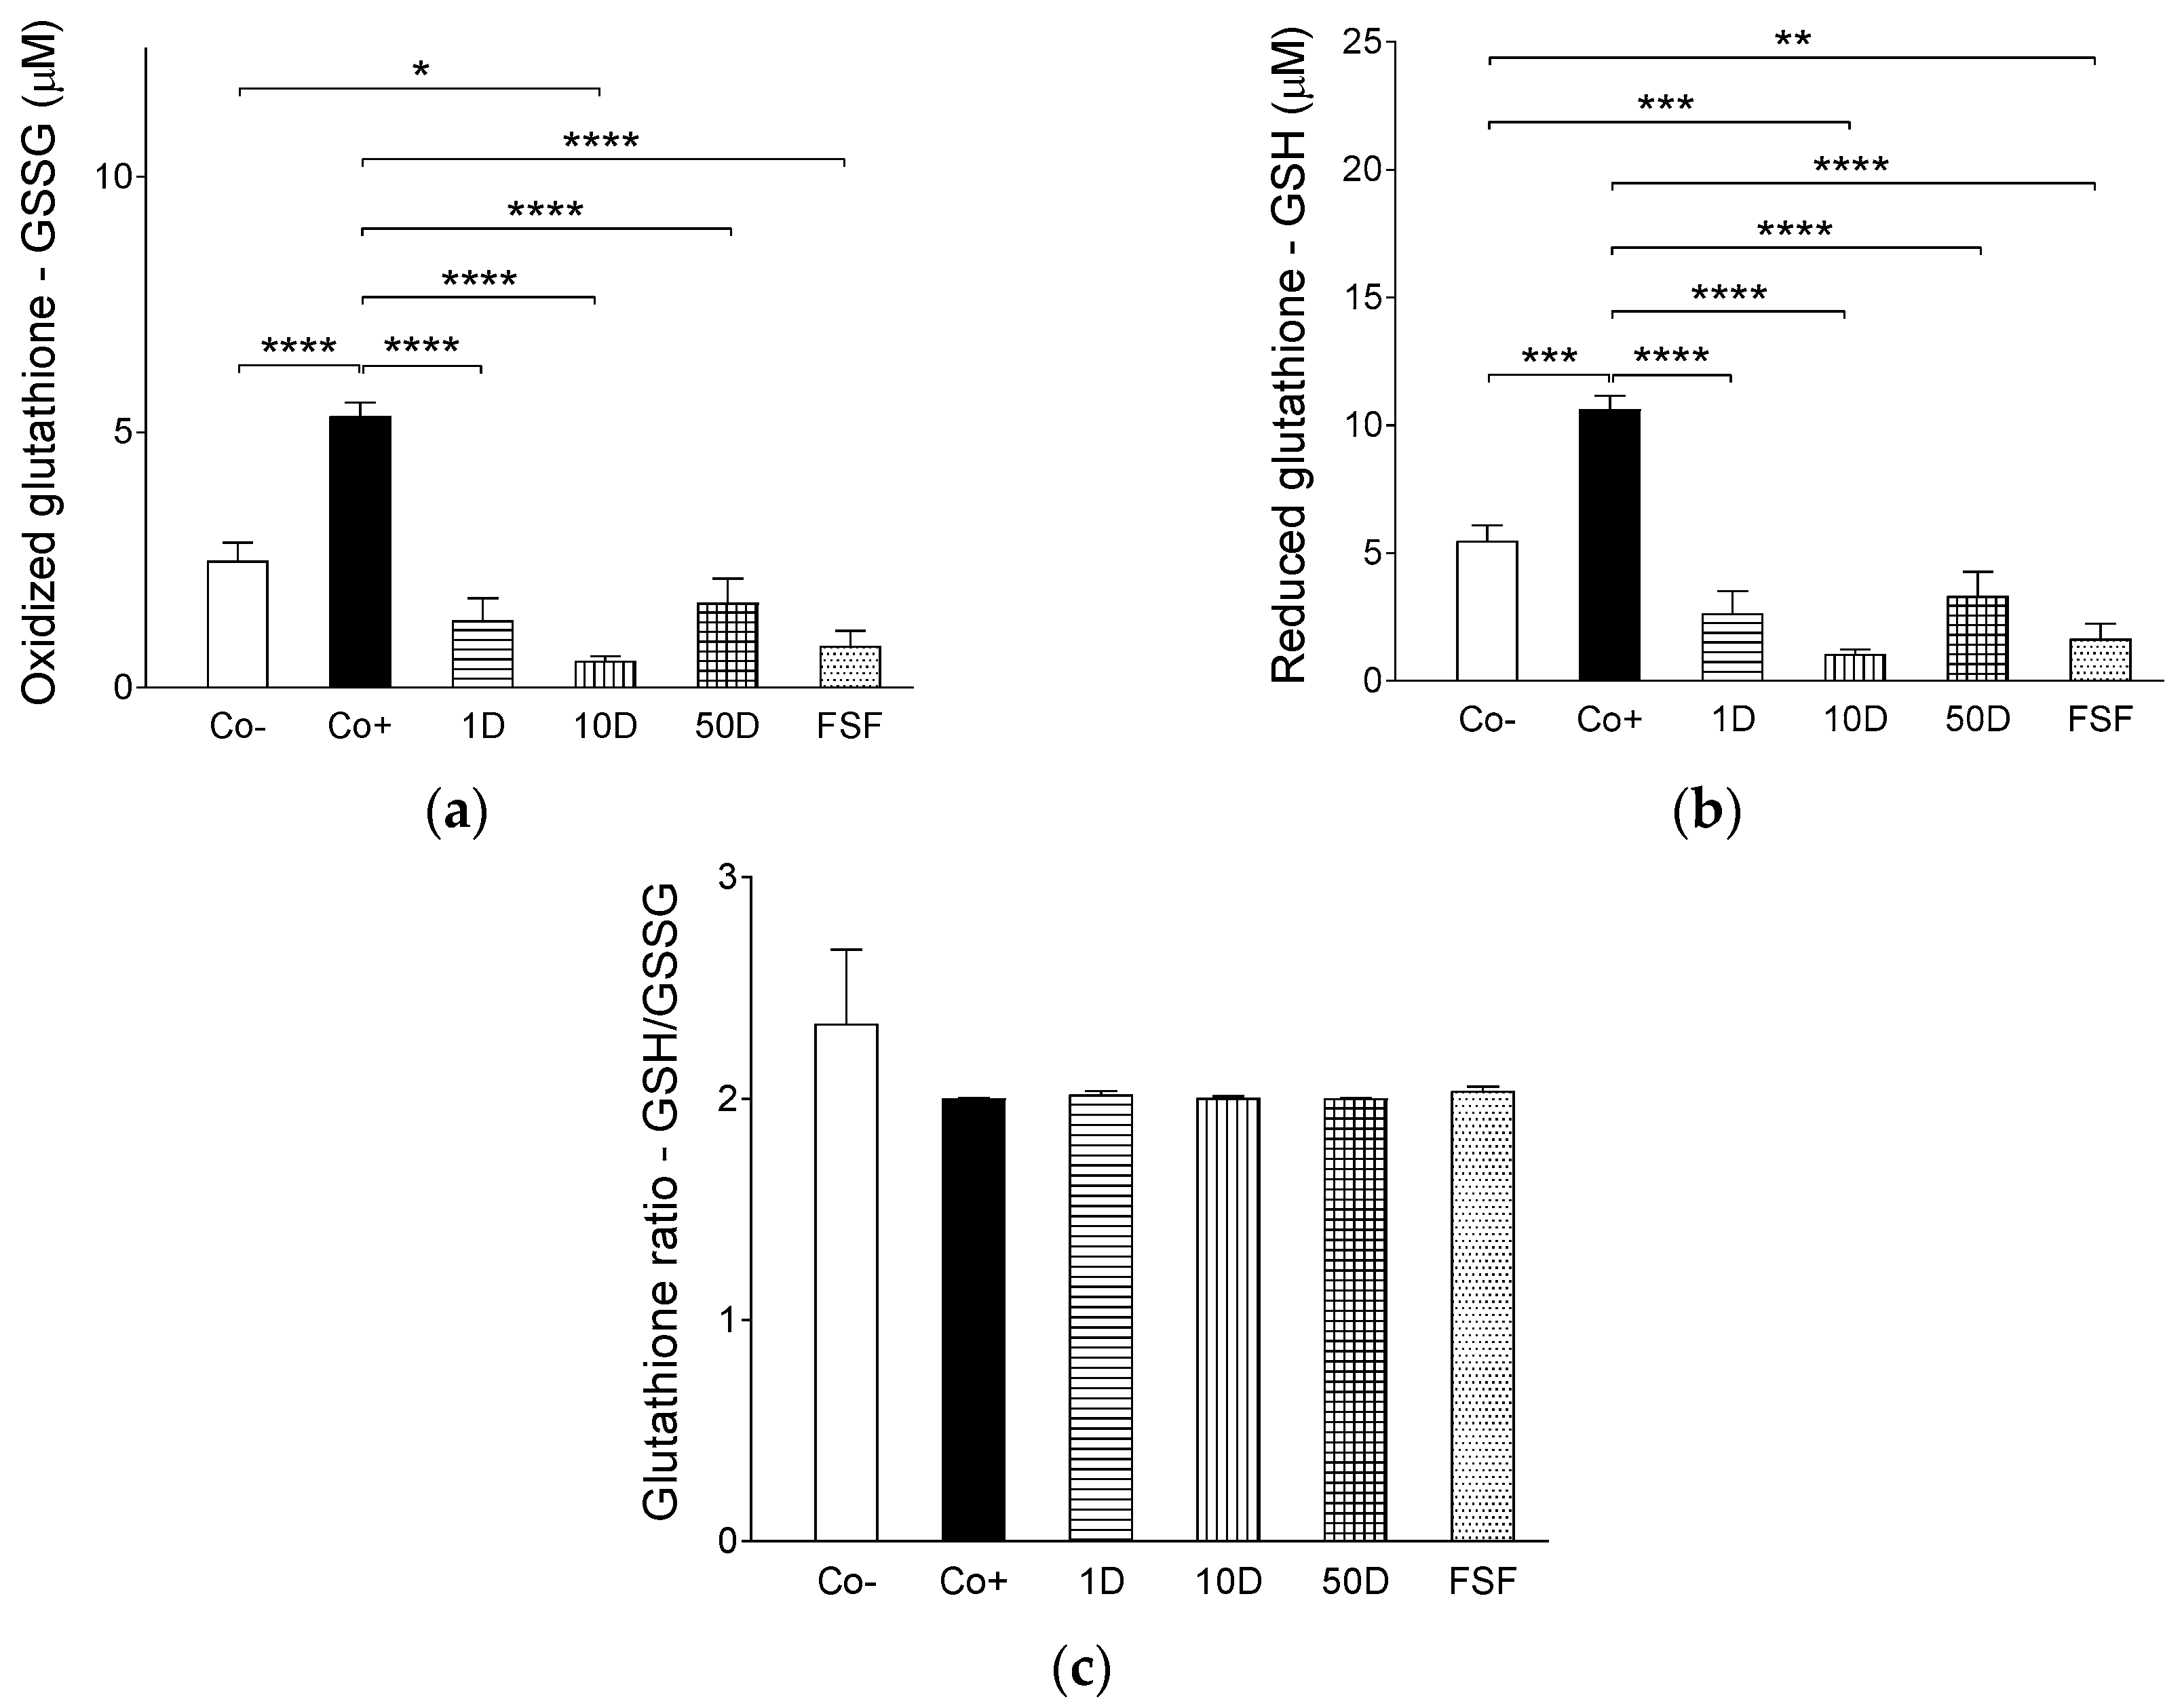
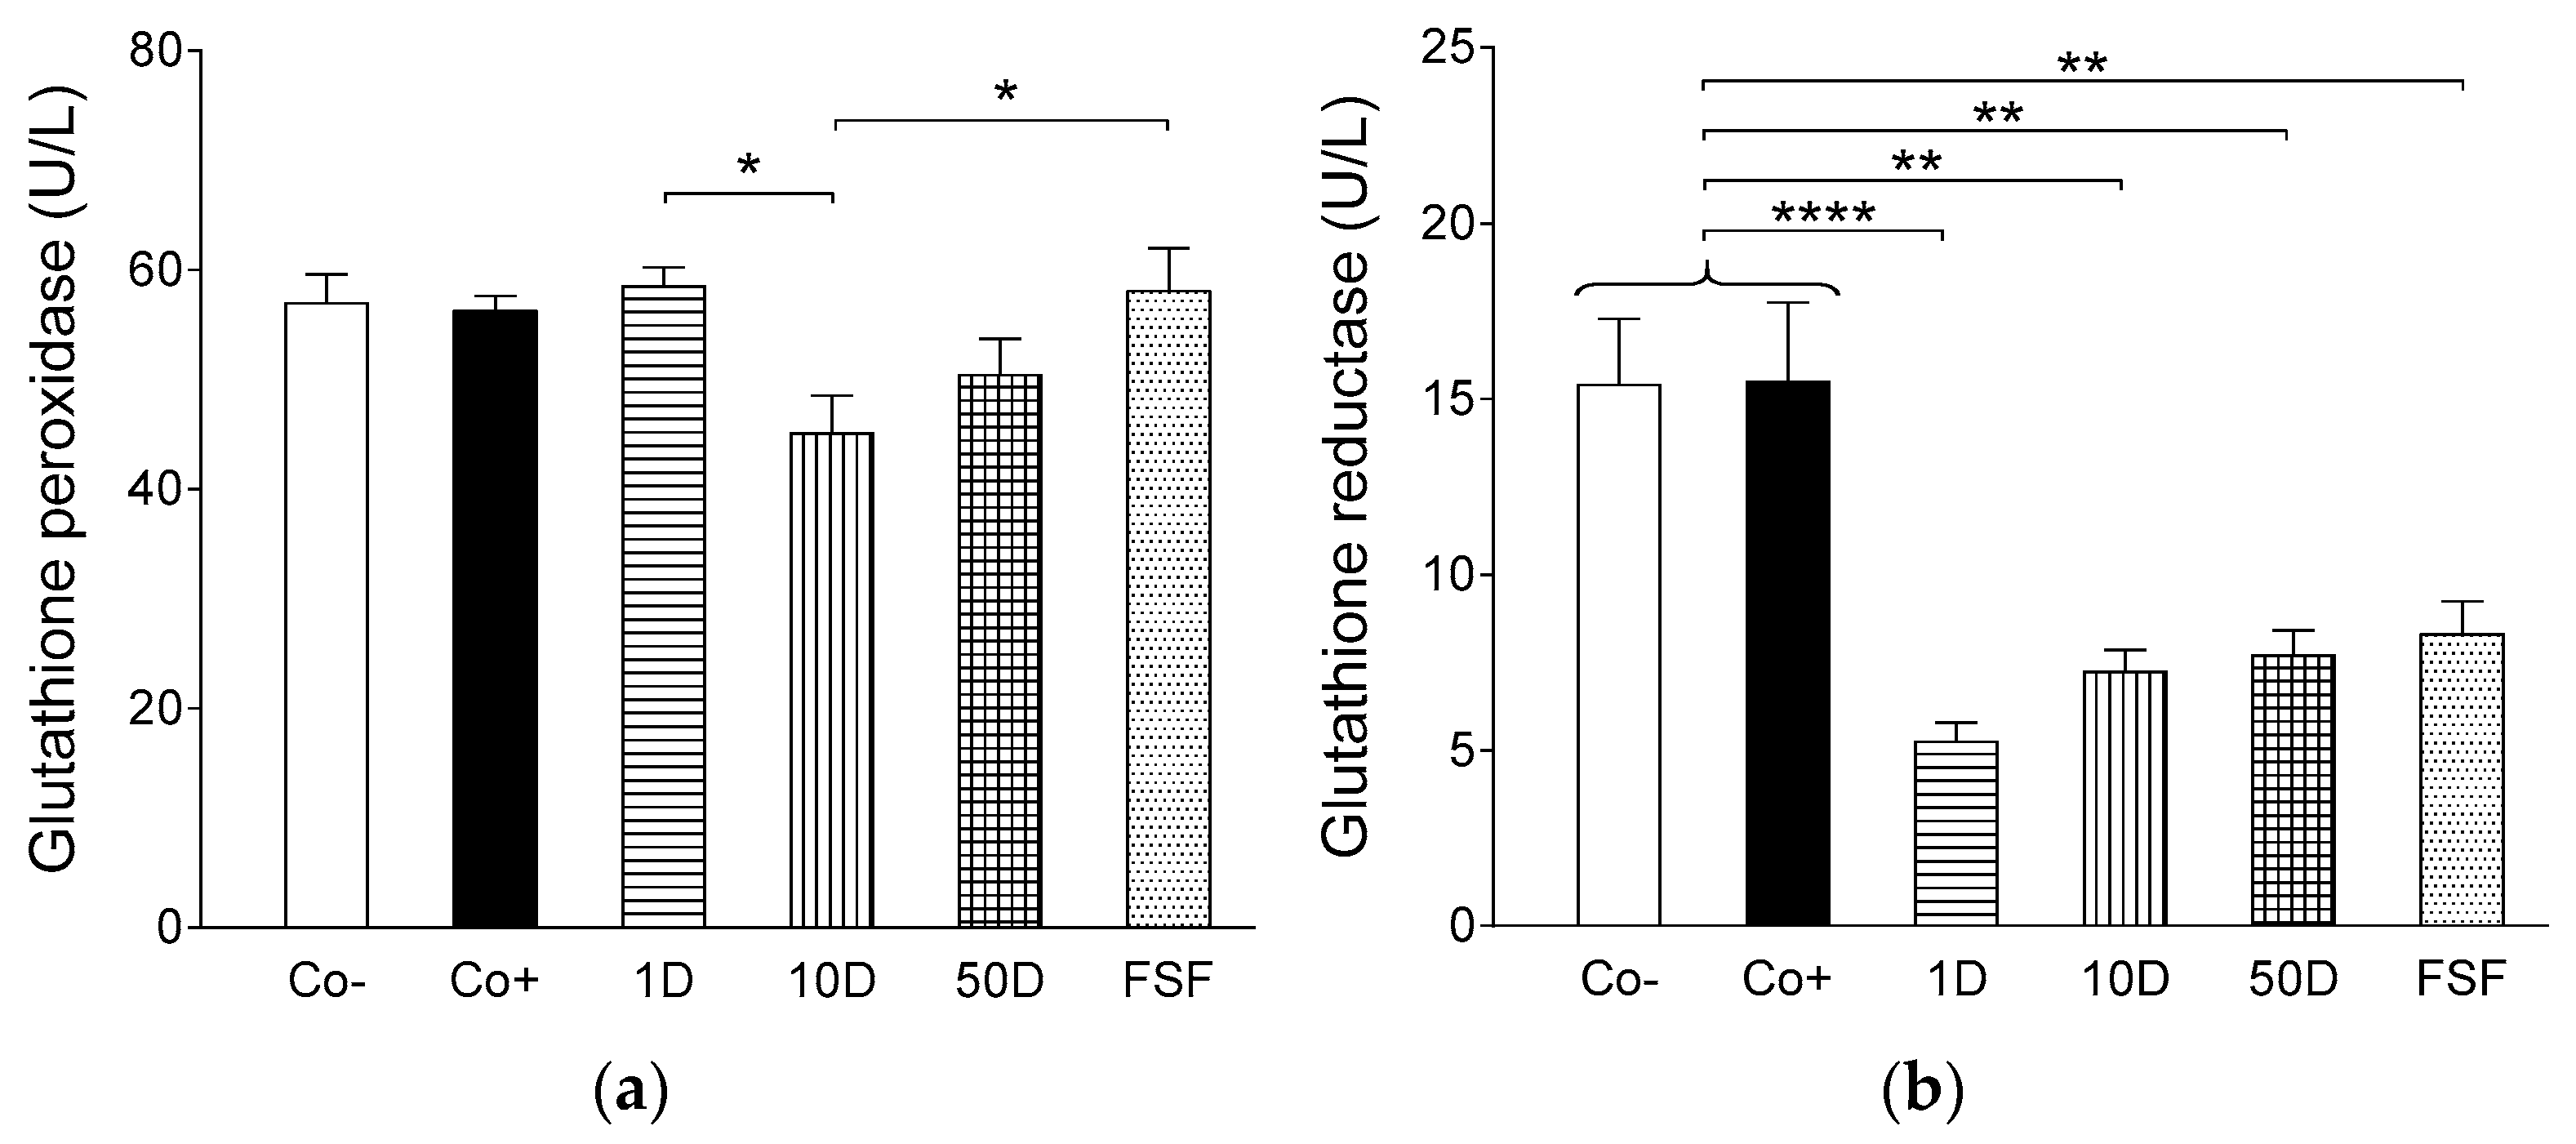
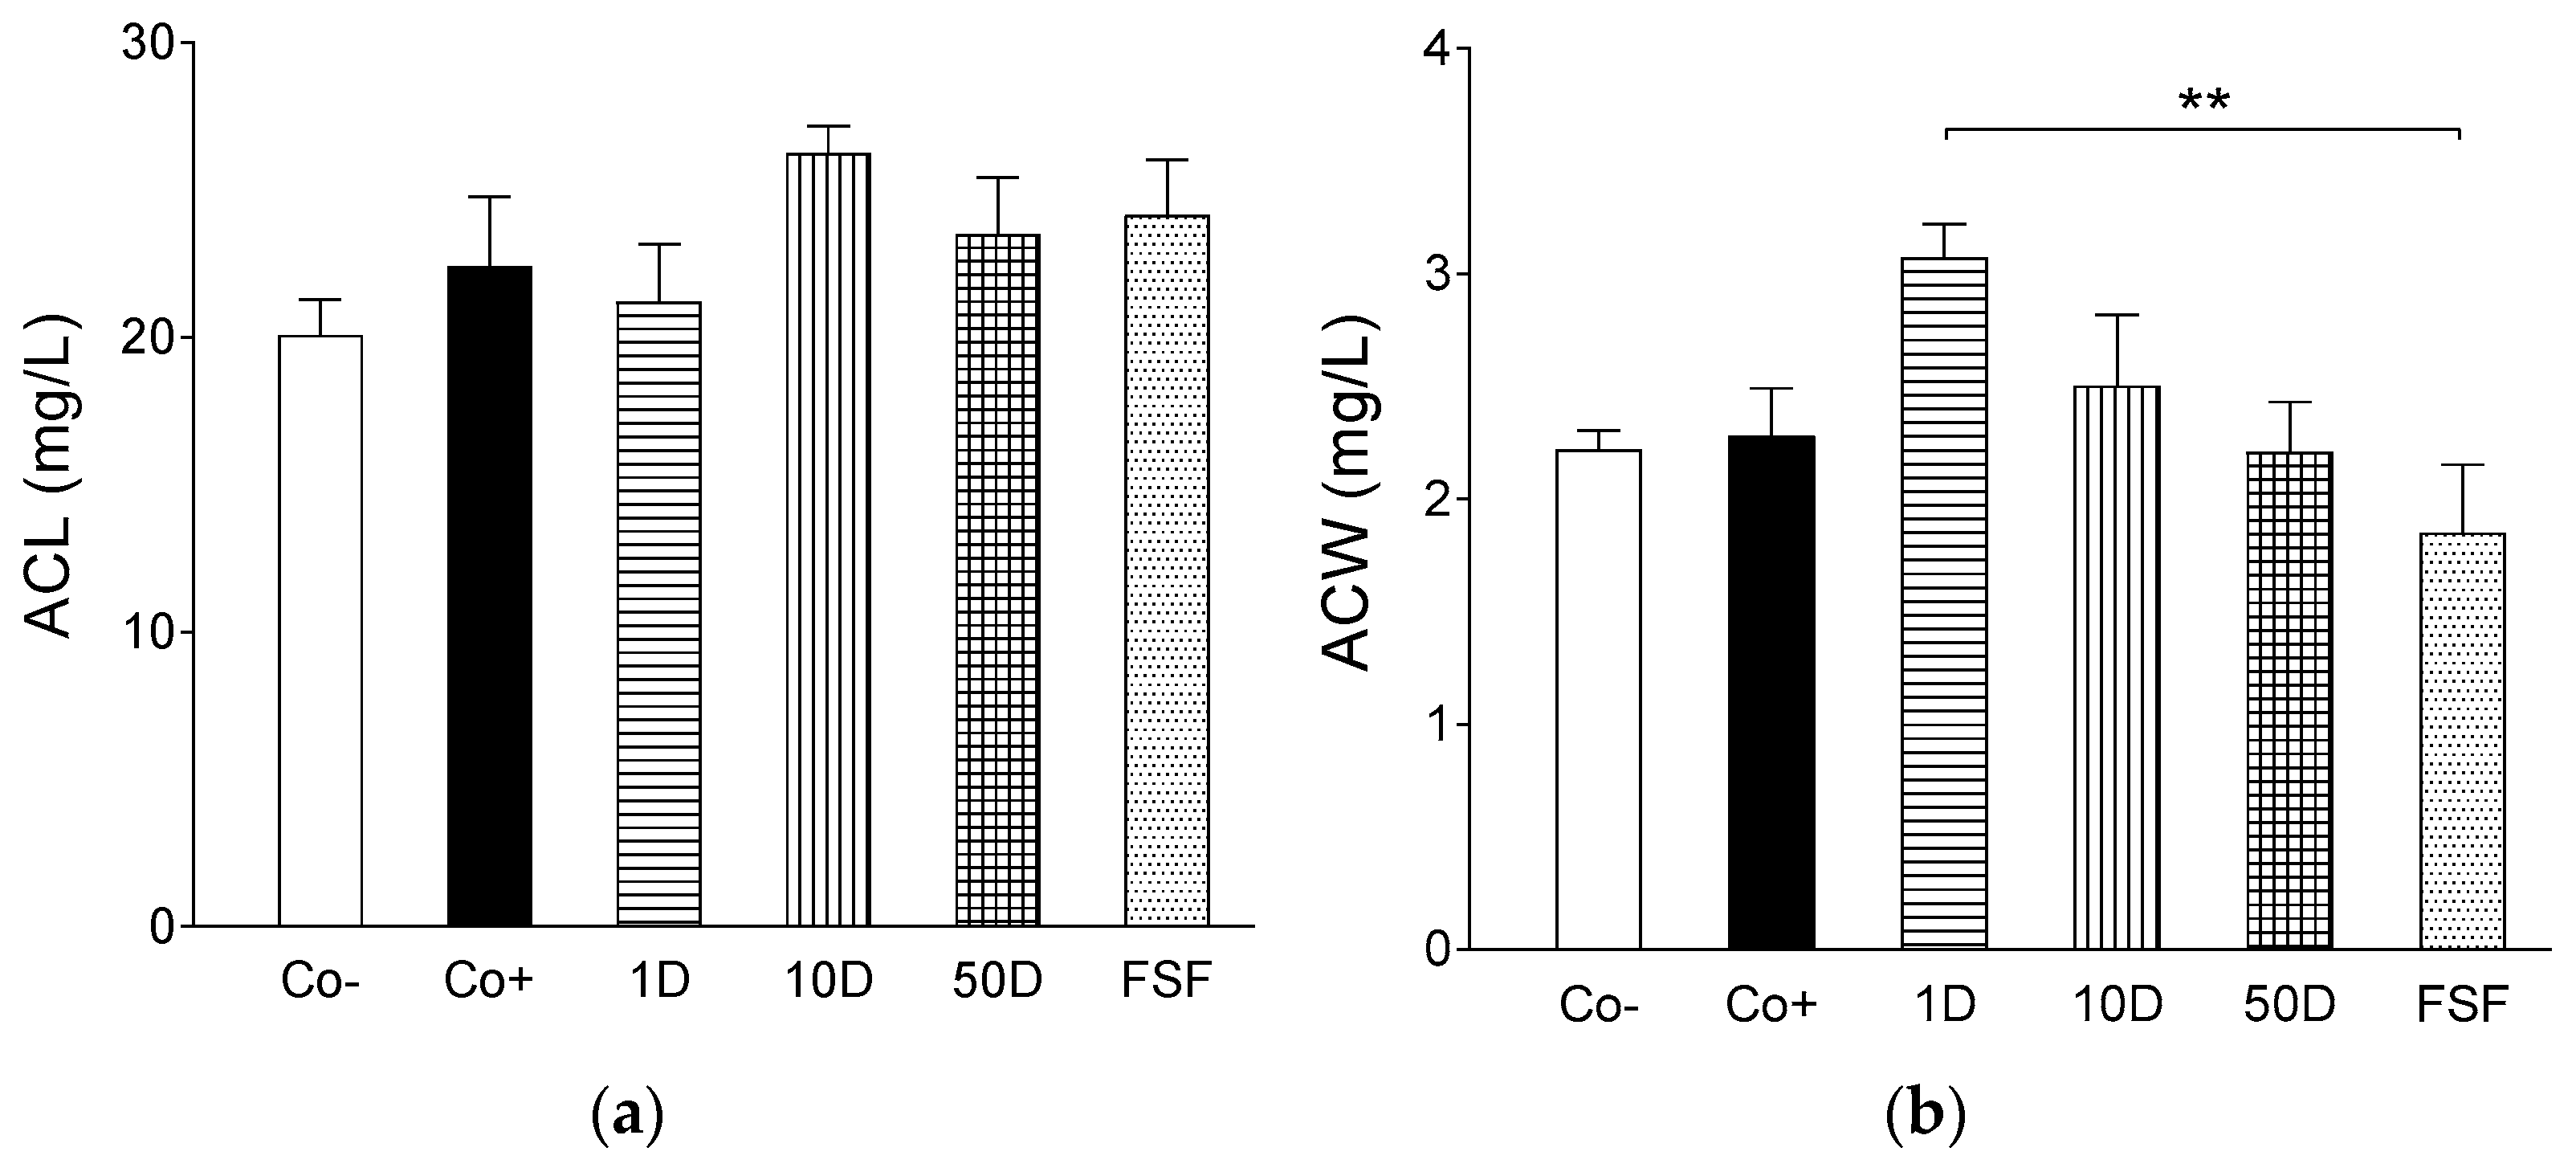
2.4. Results of Assays for Blood Redox Status
3. Discussion
4. Materials and Methods
4.1. Materials
4.2. Animals and Protocols
4.3. Protocol of the Functional Assay
4.4. Determination of Reduced (GSH) and Oxidized (GSSG) Glutathione
4.5. Determination of Glutathione Peroxidase
4.6. Determination of Glutathione Reductase
4.7. Determination of Antioxidant Capacity of Water-Soluble Compounds (ACW)
4.8. Determination of Antioxidant Capacity of Lipid-Soluble Compounds (ACL)
4.9. Data Processing and Analysis
Acknowledgments
Author Contributions
Conflicts of Interest
Abbreviations
| 4-OH-Ile | 4-hydroxyisoleucine |
| ACC | acetyl-CoA carboxylase |
| Ach | acetylcholine |
| ACL | lipid soluble antioxidant capacity |
| Act | protein kinase B (PKB) |
| AMPK | adenosine monophosphate-activated protein kinase |
| AWS | water soluble antioxidant capacity |
| bw | body weight |
| cGMP | cyclic guanosine monophosphate |
| CHOP | CCAAT-enhancer-binding homologous protein |
| CVD | cardiovascular diseases |
| ED | endothelial dysfunction |
| eNOS | endothelial nitric oxide synthase |
| FFA | free fatty acid |
| GLUT4 | glucose transporter 4 |
| GSH | reduced glutathione (glutathione) |
| GSSG | oxidized glutathione (glutathione disulfide) |
| HDL | high-density lipoprotein |
| HFHSD | high-fat, high-sugar diet |
| ICAM | intracellular adhesion molecule |
| IKK-β | inhibitor of nuclear factor kappa-B kinase subunit beta |
| iNOS | inducible nitric oxide synthase |
| IRS1 | insulin receptor substrate 1 |
| IκB | inhibitor of kappa B |
| LDL | low-density lipoprotein |
| LXRa | liver X receptor-a |
| MAPK | mitogen-activated protein kinase |
| MetS | metabolic syndrome |
| mRNA | messenger ribonucleic acid |
| NAFLD | non-alcoholic fatty liver disease |
| NE | norepinephrine |
| NF-κB | nuclear factor kappa-light-chain-enhancer of activated B cells |
| nNOS | neuronal nitric oxide synthase |
| NO | nitric oxide |
| NOS | nitric oxide synthase |
| PGI2 | prostacyclin |
| PI3K | phosphatidylinositol-4,5-bisphosphate 3-kinase |
| PPRγ | peroxisome proliferator-activated receptor gamma |
| RAAS | renin-angiotensin-aldosterone system |
| RNS | reactive nitrogen species |
| ROS | reactive oxygen species |
| SEM | standard error of the mean |
| SREBPs | sterol regulatory element-binding proteins |
| T2DM | type 2 diabetes mellitus |
| TNF-α | tumor necrosis factor alpha |
| VCAM | vascular cell adhesion molecule |
Appendix A


| Co− | Co+ | 1D | 10D | 50D | FSF | |
|---|---|---|---|---|---|---|
| Emax | 108.11 ± 6.05 | 79.66 ± 8.6 * | 100.58 ± 11.31 | 111.12 ± 11.9 | 107.80 ± 5.56 # | 101.84 ± 4.43 # |
| logEC50 | −7.94 ± 0.32 | −7.65 ± 0.54 | −7.95 ± 0.25 | −7.95 ± 0.23 | −8.3 ± 0.23 | −8.45 ± 0.14 |
| n | 0.67 ± 0.07 | 0.68 ± 0.07 | 0.73 ± 0.08 | 0.65 ± 0.07 | 0.64 ± 0.04 | 0.85 ± 0.1 |
References
- Grundy, S.M.; Cleeman, J.I.; Daniels, S.R.; Donato, K.A.; Eckel, R.H.; Franklin, B.A.; Gordon, D.J.; Krauss, R.M.; Savage, P.J.; Smith, S.C., Jr.; et al. Diagnosis and management of the metabolic syndrome: An American Heart Association/National Heart, Lung, and Blood Institute Scientific Statement. Circulation 2005, 112, 2735–2752. [Google Scholar] [CrossRef] [PubMed]
- Alberti, K.G.; Zimmet, P.; Shaw, J.; IDF Epidemiology Task Force Consensus Group. The metabolic syndrome—A new worldwide definition. Lancet 2005, 366, 1059–1062. [Google Scholar] [CrossRef]
- Alberti, K.G.; Eckel, R.H.; Grundy, S.M.; Zimmet, P.Z.; Cleeman, J.I.; Donato, K.A.; Fruchart, J.C.; James, W.P.; Loria, C.M.; Smith, S.C., Jr.; et al. Harmonizing the metabolic syndrome: A joint interim statement of the International Diabetes Federation Task Force on Epidemiology and Prevention; National Heart, Lung, and Blood Institute; American Heart Association; World Heart Federation; International Atherosclerosis Society; and International Association for the Study of Obesity. Circulation 2009, 120, 1640–1645. [Google Scholar] [PubMed]
- Klein, B.E.; Klein, R.; Lee, K.E. Components of the metabolic syndrome and risk of cardiovascular disease and diabetes in Beaver Dam. Diabetes Care 2002, 25, 1790–1794. [Google Scholar] [CrossRef] [PubMed]
- Schachinger, V.; Zeiher, A.M. Atherosclerosis-associated endothelial dysfunction. Z. Kardiol. 2000, 89 (Suppl. 9), IX70–IX74. [Google Scholar] [CrossRef]
- Beckman, J.A.; Creager, M.A.; Libby, P. Diabetes and atherosclerosis: Epidemiology, pathophysiology, and management. JAMA 2002, 287, 2570–2581. [Google Scholar] [CrossRef] [PubMed]
- Vane, J.R.; Anggard, E.E.; Botting, R.M. Regulatory functions of the vascular endothelium. N. Engl. J. Med. 1990, 323, 27–36. [Google Scholar] [PubMed]
- Meyers, M.R.; Gokce, N. Endothelial dysfunction in obesity: Etiological role in atherosclerosis. Curr. Opin. Endocrinol. Diabetes Obes. 2007, 14, 365–369. [Google Scholar] [CrossRef] [PubMed]
- Polovina, M.M.; Potpara, T.S. Endothelial dysfunction in metabolic and vascular disorders. Postgrad. Med. 2014, 126, 38–53. [Google Scholar] [CrossRef] [PubMed]
- Félétou, M. The endothelium, Part I: Multiple functions of the endothelial cells—Focus on endothelium-derived vasoactive mediators. in Colloquium Series on Integrated Systems Physiology: From Molecule to Function. Morgan Claypool Life Sci. 2011, 3, 306. [Google Scholar]
- Dharmashankar, K.; Widlansky, M.E. Vascular endothelial function and hypertension: Insights and directions. Curr. Hypertens. Rep. 2010, 12, 448–455. [Google Scholar] [CrossRef] [PubMed]
- Konukoglu, D.; Uzun, H. Endothelial Dysfunction and Hypertension. Adv. Exp. Med. Biol 2017, 956, 511–540. [Google Scholar] [PubMed]
- Deedwania, P.C. Mechanisms of endothelial dysfunction in the metabolic syndrome. Curr. Diabetes Rep. 2003, 3, 289–292. [Google Scholar] [CrossRef]
- Hsueh, W.A.; Lyon, C.J.; Quinones, M.J. Insulin resistance and the endothelium. Am. J. Med. 2004, 117, 109–117. [Google Scholar] [CrossRef] [PubMed]
- Fuller, S.; Stephens, J.M. Diosgenin, 4-hydroxyisoleucine, and fiber from fenugreek: Mechanisms of actions and potential effects on metabolic syndrome. Adv. Nutr. 2015, 6, 189–197. [Google Scholar] [CrossRef] [PubMed]
- Mahdavi, M.R.; Roghani, M.; Baluchnejadmojarad, T. Mechanisms responsible for the vascular effect of aqueous Trigonella foenum-graecum leaf extract in diabetic rats. Indian J. Pharmacol. 2008, 40, 59–63. [Google Scholar] [PubMed]
- Vaez Mahdavi, M.R.; Roghani, M.; Baluchnejadmojarad, T. The Role of Adrenergic and Angiotensinergic Systems in Vascular Effect of Alcoholic of Extract Trigonella foenum-graecum Seed in Diabetic Rats. Iran. J. Pharm. Res. 2011, 10, 83–88. [Google Scholar] [PubMed]
- Chen, Y.; Xu, X.; Zhang, Y.; Liu, K.; Huang, F.; Liu, B.; Kou, J. Diosgenin regulates adipokine expression in perivascular adipose tissue and ameliorates endothelial dysfunction via regulation of AMPK. J. Steroid Biochem. Mol. Biol. 2016, 155 Pt A, 155–165. [Google Scholar] [CrossRef] [PubMed]
- Manivannan, J.; Balamurugan, E.; Silambarasan, T.; Raja, B. Diosgenin improves vascular function by increasing aortic eNOS expression, normalize dyslipidemia and ACE activity in chronic renal failure rats. Mol. Cell. Biochem. 2013, 384, 113–120. [Google Scholar] [CrossRef] [PubMed]
- Manivannan, J.; Barathkumar, T.R.; Sivasubramanian, J.; Arunagiri, P.; Raja, B.; Balamurugan, E. Diosgenin attenuates vascular calcification in chronic renal failure rats. Mol. Cell. Biochem. 2013, 378, 9–18. [Google Scholar] [CrossRef] [PubMed]
- Pari, L.; Monisha, P.; Mohamed Jalaludeen, A. Beneficial role of diosgenin on oxidative stress in aorta of streptozotocin induced diabetic rats. Eur. J. Pharmacol. 2012, 691, 143–150. [Google Scholar] [CrossRef] [PubMed]
- Manivannan, J.; Shanthakumar, J.; Arunagiri, P.; Raja, B.; Balamurugan, E. Diosgenin interferes coronary vasoconstriction and inhibits osteochondrogenic transdifferentiation of aortic VSMC in CRF rats. Biochimie 2014, 102, 183–187. [Google Scholar] [CrossRef] [PubMed]
- Roghani-Dehkordi, F.; Roghani, M.; Baluchnejadmojarad, T. Diosgenin Mitigates Streptozotocin Diabetes-induced Vascular Dysfunction of the Rat Aorta: The Involved Mechanisms. J. Cardiovasc. Pharmacol. 2015, 66, 584–592. [Google Scholar] [CrossRef] [PubMed]
- Choi, K.W.; Park, H.J.; Jung, D.H.; Kim, T.W.; Park, Y.M.; Kim, B.O.; Sohn, E.H.; Moon, E.Y.; Um, S.H.; Rhee, D.K.; et al. Inhibition of TNF-alpha-induced adhesion molecule expression by diosgenin in mouse vascular smooth muscle cells via downregulation of the MAPK, Akt and NF-kappaB signaling pathways. Vasc. Pharmacol. 2010, 53, 273–280. [Google Scholar] [CrossRef] [PubMed]
- Marques, C.; Meireles, M.; Norberto, S.; Leite, J.; Freitas, J.; Pestana, D.; Faria, A.; Calhau, C. High-fat diet-induced obesity Rat model: A comparison between Wistar and Sprague-Dawley Rat. Adipocyte 2016, 5, 11–21. [Google Scholar] [CrossRef] [PubMed]
- Wang, Y.; Wang, P.Y.; Qin, L.Q.; Davaasambuu, G.; Kaneko, T.; Xu, J.; Murata, S.; Katoh, R.; Sato, A. The development of diabetes mellitus in Wistar rats kept on a high-fat/low-carbohydrate diet for long periods. Endocrine 2003, 22, 85–92. [Google Scholar] [CrossRef]
- Buchwalow, I.B.; Podzuweit, T.; Samoilova, V.E.; Wellner, M.; Haller, H.; Grote, S.; Aleth, S.; Boecker, W.; Schmitz, W.; Neumann, J. An in situ evidence for autocrine function of NO in the vasculature. Nitric Oxide 2004, 10, 203–212. [Google Scholar] [CrossRef] [PubMed]
- Denninger, J.W.; Marletta, M.A. Guanylate cyclase and the .NO/cGMP signaling pathway. Biochim. Biophys. Acta 1999, 1411, 334–350. [Google Scholar] [CrossRef]
- Fukumura, D.; Gohongi, T.; Kadambi, A.; Izumi, Y.; Ang, J.; Yun, C.O.; Buerk, D.G.; Huang, P.L.; Jain, R.K. Predominant role of endothelial nitric oxide synthase in vascular endothelial growth factor-induced angiogenesis and vascular permeability. Proc. Natl. Acad. Sci. USA 2001, 98, 2604–2609. [Google Scholar] [CrossRef] [PubMed]
- Lei, J.; Vodovotz, Y.; Tzeng, E.; Billiar, T.R. Nitric oxide, a protective molecule in the cardiovascular system. Nitric Oxide 2013, 35, 175–185. [Google Scholar] [CrossRef] [PubMed]
- Guber, S.; Ebrahimian, T.; Heidari, M.; Eliopoulos, N.; Lehoux, S. Endothelial nitric oxide synthase overexpressing human early outgrowth cells inhibit coronary artery smooth muscle cell migration through paracrine functions. Sci. Rep. 2018, 8, 877. [Google Scholar] [CrossRef] [PubMed]
- Lubos, E.; Handy, D.E.; Loscalzo, J. Role of oxidative stress and nitric oxide in atherothrombosis. Front. Biosci. 2008, 13, 5323–5344. [Google Scholar] [CrossRef] [PubMed]
- Roe, N.D.; Ren, J. Nitric oxide synthase uncoupling: A therapeutic target in cardiovascular diseases. Vasc. Pharmacol. 2012, 57, 168–172. [Google Scholar] [CrossRef] [PubMed]
- Luo, S.; Lei, H.; Qin, H.; Xia, Y. Molecular mechanisms of endothelial NO synthase uncoupling. Curr. Pharm. Design 2014, 20, 3548–3553. [Google Scholar] [CrossRef]
- Karbach, S.; Wenzel, P.; Waisman, A.; Munzel, T.; Daiber, A. eNOS uncoupling in cardiovascular diseases-the role of oxidative stress and inflammation. Curr. Pharm. Design 2014, 20, 3579–3594. [Google Scholar] [CrossRef]
- Dalle-Donne, I.; Rossi, R.; Colombo, G.; Giustarini, D.; Milzani, A. Protein S-glutathionylation: A regulatory device from bacteria to humans. Trends Biochem. Sci. 2009, 34, 85–96. [Google Scholar] [CrossRef] [PubMed]
- Lapenna, D.; de Gioia, S.; Ciofani, G.; Mezzetti, A.; Ucchino, S.; Calafiore, A.M.; Napolitano, A.M.; Di Ilio, C.; Cuccurullo, F. Glutathione-related antioxidant defenses in human atherosclerotic plaques. Circulation 1998, 97, 1930–1934. [Google Scholar] [CrossRef] [PubMed]
- Tharaheswari, M.; Jayachandra Reddy, N.; Kumar, R.; Varshney, K.C.; Kannan, M.; Sudha Rani, S. Trigonelline and diosgenin attenuate ER stress, oxidative stress-mediated damage in pancreas and enhance adipose tissue PPARgamma activity in type 2 diabetic rats. Mol. Cell. Biochem. 2014, 396, 161–174. [Google Scholar] [CrossRef] [PubMed]
- Saravanan, G.; Ponmurugan, P.; Deepa, M.A.; Senthilkumar, B. Modulatory effects of diosgenin on attenuating the key enzymes activities of carbohydrate metabolism and glycogen content in streptozotocin-induced diabetic rats. Can. J. Diabetes 2014, 38, 409–414. [Google Scholar] [CrossRef] [PubMed]
- Kalailingam, P.; Kannaian, B.; Tamilmani, E.; Kaliaperumal, R. Efficacy of natural diosgenin on cardiovascular risk, insulin secretion, and beta cells in streptozotocin (STZ)-induced diabetic rats. Phytomedicine 2014, 21, 1154–1161. [Google Scholar] [CrossRef] [PubMed]
- Uemura, T.; Hirai, S.; Mizoguchi, N.; Goto, T.; Lee, J.Y.; Taketani, K.; Nakano, Y.; Shono, J.; Hoshino, S.; Tsuge, N.; et al. Diosgenin present in fenugreek improves glucose metabolism by promoting adipocyte differentiation and inhibiting inflammation in adipose tissues. Mol. Nutr. Food Res. 2010, 54, 1596–1608. [Google Scholar] [CrossRef] [PubMed]
- Sangeetha, M.K.; ShriShri Mal, N.; Atmaja, K.; Sali, V.K.; Vasanthi, H.R. PPAR’s and Diosgenin a chemico biological insight in NIDDM. Chem. Biol. Interact. 2013, 206, 403–410. [Google Scholar] [CrossRef] [PubMed]
- Lim, S.; Meigs, J.B. Ectopic fat and cardiometabolic and vascular risk. Int. J. Cardiol. 2013, 169, 166–176. [Google Scholar] [CrossRef] [PubMed]
- Morelli, M.; Gaggini, M.; Daniele, G.; Marraccini, P.; Sicari, R.; Gastaldelli, A. Ectopic fat: The true culprit linking obesity and cardiovascular disease? Thromb. Haemost. 2013, 110, 651–660. [Google Scholar] [CrossRef] [PubMed]
- Horton, J.D.; Goldstein, J.L.; Brown, M.S. SREBPs: Activators of the complete program of cholesterol and fatty acid synthesis in the liver. J. Clin. Investig. 2002, 109, 1125–1131. [Google Scholar] [CrossRef] [PubMed]
- Edwards, P.A.; Kast, H.R. Anisfeld, A.M. BAREing it all: The adoption of LXR and FXR and their roles in lipid homeostasis. J. Lipid Res. 2002, 43, 2–12. [Google Scholar] [PubMed]
- Uemura, T.; Goto, T.; Kang, M.S.; Mizoguchi, N.; Hirai, S.; Lee, J.Y.; Nakano, Y.; Shono, J.; Hoshino, S.; Taketani, K.; et al. Diosgenin, the main aglycon of fenugreek, inhibits LXRalpha activity in HepG2 cells and decreases plasma and hepatic triglycerides in obese diabetic mice. J. Nutr. 2011, 141, 17–23. [Google Scholar] [CrossRef] [PubMed]
- Cheng, S.; Liang, S.; Liu, Q.; Deng, Z.; Zhang, Y.; Du, J.; Zhang, Y.; Li, S.; Cheng, B.; Ling, C. Diosgenin prevents high-fat diet-induced rat non-alcoholic fatty liver disease through the AMPK and LXR signaling pathways. Int. J. Mol. Med. 2018, 41, 1089–1095. [Google Scholar] [CrossRef] [PubMed]
- Esfandiarei, M.; Lam, J.T.; Yazdi, S.A.; Kariminia, A.; Dorado, J.N.; Kuzeljevic, B.; Syyong, H.T.; Hu, K.; van Breemen, C. Diosgenin Modulates Vascular Smooth Muscle Cell. Function by Regulating Cell. Viability, Migration, and Calcium Homeostasis. J. Pharmacol. Exp. Ther. 2011, 336, 925–939. [Google Scholar] [CrossRef] [PubMed]
- Dias, K.L.; Correia Nde, A.; Pereira, K.K.; Barbosa-Filho, J.M.; Cavalcante, K.V.; Araújo, I.G.; Silva, D.F.; Guedes, D.N.; Neto Mdos, A.; Bendhack, L.M.; et al. Mechanisms involved in the vasodilator effect induced by diosgenin in rat superior mesenteric artery. Eur. J. Pharmacol. 2007, 574, 172–178. [Google Scholar] [CrossRef] [PubMed]
- Liu, K.; Zhao, W.; Gao, X.; Huang, F.; Kou, J.; Liu, B. Diosgenin ameliorates palmitate-induced endothelial dysfunction and insulin resistance via blocking IKKβ and IRS-1 pathways. Atherosclerosis 2012, 223, 350–358. [Google Scholar] [CrossRef] [PubMed]
- Sauvaire, Y.; Petit, P.; Broca, C.; Manteghetti, M.; Baissac, Y.; Fernandez-Alvarez, J.; Gross, R.; Roye, M.; Leconte, A.; Gomis, R.; et al. 4-Hydroxyisoleucine: A novel amino acid potentiator of insulin secretion. Diabetes 1998, 47, 206–210. [Google Scholar] [CrossRef] [PubMed]
- Broca, C.; Gross, R.; Petit, P.; Sauvaire, Y.; Manteghetti, M.; Tournier, M.; Masiello, P.; Gomis, R.; Ribes, G. 4-Hydroxyisoleucine: Experimental evidence of its insulinotropic and antidiabetic properties. Am. J. Physiol. 1999, 277 Pt 1, E617–E623. [Google Scholar] [CrossRef] [PubMed]
- Broca, C.; Manteghetti, M.; Gross, R.; Baissac, Y.; Jacob, M.; Petit, P.; Sauvaire, Y.; Ribes, G. 4-Hydroxyisoleucine: Effects of synthetic and natural analogues on insulin secretion. Eur. J. Pharmacol. 2000, 390, 339–345. [Google Scholar] [CrossRef]
- Broca, C.; Breil, V.; Cruciani-Guglielmacci, C.; Manteghetti, M.; Rouault, C.; Derouet, M.; Rizkalla, S.; Pau, B.; Petit, P.; Ribes, G.; et al. Insulinotropic agent ID-1101 (4-hydroxyisoleucine) activates insulin signaling in rat. Am. J. Physiol. Endocrinol. Metab. 2004, 287, E463–E471. [Google Scholar] [CrossRef] [PubMed]
- Jaiswal, N.; Maurya, C.K.; Venkateswarlu, K.; Sukanya, P.; Srivastava, A.K.; Narender, T.; Tamrakar, A.K. 4-Hydroxyisoleucine stimulates glucose uptake by increasing surface GLUT4 level in skeletal muscle cells via phosphatidylinositol-3-kinase-dependent pathway. Eur. J. Nutr. 2012, 51, 893–898. [Google Scholar] [CrossRef] [PubMed]
- Yu, H.; Wu, M.; Lu, F.R.; Xie, J.; Zheng, N.; Qin, Y.; Gao, F.; Du, W.; Jian, L.M. Effect of Trigonella foenum-graecum 4-hydroxyisoleucine on high-glucose induced insulin resistance in 3T3-L1 adipocytes of mice. Chin. J. Integr. Tradit. West. Med. 2013, 33, 1394–1399. [Google Scholar]
- Gao, F.; Du, W.; Zafar, M.I.; Shafqat, R.A.; Jian, L.; Cai, Q.; Lu, F. 4-Hydroxyisoleucine ameliorates an insulin resistant-like state in 3T3-L1 adipocytes by regulating TACE/TIMP3 expression. Drug Des. Dev. Ther. 2015, 9, 5727–5736. [Google Scholar] [CrossRef] [PubMed]
- Hannan, J.M.; Ali, L.; Rokeya, B.; Khaleque, J.; Akhter, M.; Flatt, P.R.; Abdel-Wahab, Y.H. Soluble dietary fibre fraction of Trigonella foenum-graecum (fenugreek) seed improves glucose homeostasis in animal models of type 1 and type 2 diabetes by delaying carbohydrate digestion and absorption, and enhancing insulin action. Br. J. Nutr. 2007, 97, 514–521. [Google Scholar] [CrossRef] [PubMed]
- Hamden, K.; Jaouadi, B.; Carreau, S.; Bejar, S.; Elfeki, A. Inhibitory effect of fenugreek galactomannan on digestive enzymes related to diabetes, hyperlipidemia, and liver-kidney dysfunctions. Biotechnol. Bioprocess. Eng. 2010, 15, 407–413. [Google Scholar] [CrossRef]
- Eastwood, M.; Kritchevsky, D. Dietary fiber: How did we get where we are? Annu. Rev. Nutr 2005, 25, 1–8. [Google Scholar] [CrossRef] [PubMed]
- Verma, N.; Usman, K.; Patel, N.; Jain, A.; Dhakre, S.; Swaroop, A.; Bagchi, M.; Kumar, P.; Preuss, H.G.; Bagchi, D. A multicenter clinical study to determine the efficacy of a novel fenugreek seed (Trigonella foenum-graecum) extract (Fenfuro) in patients with type 2 diabetes. Food Nutr. Res. 2016, 60, 32382. [Google Scholar] [CrossRef] [PubMed]
- Drolet, M.-C.; Plante, E.; Battistini, B.; Couet, J.; Arsenault, M. Early endothelial dysfunction in cholesterol-fed rabbits: A non-invasive in vivo ultrasound study. Cardiovasc. Ultrasound 2004, 2, 10. [Google Scholar] [CrossRef] [PubMed] [Green Version]
- Garcia-Prieto, C.F.; Hernández-Nuño, F.; Rio, D.D.; Ruiz-Hurtado, G.; Aránguez, I.; Ruiz-Gayo, M.; Somoza, B.; Fernández-Alfonso, M.S. High-fat diet induces endothelial dysfunction through a down-regulation of the endothelial AMPK-PI3K-Akt-eNOS pathway. Mol. Nutr. Food Res. 2015, 59, 520–532. [Google Scholar] [PubMed]
- Chinen, I.; Shimabukuro, M.; Yamakawa, K.; Higa, N.; Matsuzaki, T.; Noguchi, K.; Ueda, S.; Sakanashi, M.; Takasu, N. Vascular lipotoxicity: Endothelial dysfunction via fatty-acid-induced reactive oxygen species overproduction in obese Zucker diabetic fatty rats. Endocrinology 2007, 148, 160–165. [Google Scholar] [CrossRef] [PubMed]
- Li, H.; Li, H.; Bao, Y.; Zhang, X.; Yu, Y. Free fatty acids induce endothelial dysfunction and activate protein kinase C and nuclear factor-kappaB pathway in rat aorta. Int. J. Cardiol. 2011, 152, 218–224. [Google Scholar] [CrossRef] [PubMed]
- Schächinger, V.; Britten, M.B.; Zeiher, A.M. Prognostic Impact of Coronary Vasodilator Dysfunction on Adverse Long-Term Outcome of Coronary Heart Disease. Circulation 2000, 101, 1899–1906. [Google Scholar] [CrossRef] [PubMed]
- Bertoluci, M.C.; Cé, G.V.; da Silva, A.M.; Wainstein, M.V.; Boff, W.; Puñales, M. Endothelial dysfunction as a predictor of cardiovascular disease in type 1 diabetes. World J. Diabetes 2015, 6, 679–692. [Google Scholar] [CrossRef] [PubMed]
- Vázquez-Rey, E.; Kaski, J.C. Cardiovascular Syndrome X and Endothelial Dysfunction. Rev. Española de Cardiol. (Engl. Ed.) 2003, 56, 181–192. [Google Scholar] [CrossRef]
- Furchgott, R.F.; Zawadzki, J.V. The obligatory role of endothelial cells in the relaxation of arterial smooth muscle by acetylcholine. Nature 1980, 288, 373–376. [Google Scholar] [CrossRef] [PubMed]
- Palmer, R.M.; Ferrige, A.; Moncada, S. Nitric oxide release accounts for the biological activity of endothelium-derived relaxing factor. Nature 1987, 327, 524–526. [Google Scholar] [CrossRef] [PubMed]
- Buchwalow, I.B.; Cacanyiova, S.; Neumann, J.; Samoilova, V.E.; Boecker, W.; Kristek, F. The role of arterial smooth muscle in vasorelaxation. Biochem. Biophys. Res. Commun. 2008, 377, 504–507. [Google Scholar] [CrossRef] [PubMed]
- Azevedo, L.C.; Pedro, M.A.; Souza, L.C.; de Souza, H.P.; Janiszewski, M.; da Luz, P.L.; Laurindo, F.R. Oxidative stress as a signaling mechanism of the vascular response to injury: The redox hypothesis of restenosis. Cardiovasc. Res. 2000, 47, 436–445. [Google Scholar] [CrossRef]
- Motulsky, H.; Christopoulos, A. Fitting Models to Biological Data Using Linear and Nonlinear Regression: A Practical Guide to Curve Fitting; Oxford University Press: Oxford, UK, 2004. [Google Scholar]
- Gesztelyi, R.; Zsuga, J.; Kemeny-Beke, A.; Varga, B.; Juhasz, B.; Tosaki, A. The Hill equation and the origin of quantitative pharmacology. Arch. Hist. Exact Sci. 2012, 66, 427–438. [Google Scholar] [CrossRef]


© 2018 by the authors. Licensee MDPI, Basel, Switzerland. This article is an open access article distributed under the terms and conditions of the Creative Commons Attribution (CC BY) license (http://creativecommons.org/licenses/by/4.0/).
Share and Cite
Szabó, K.; Gesztelyi, R.; Lampé, N.; Kiss, R.; Remenyik, J.; Pesti-Asbóth, G.; Priksz, D.; Szilvássy, Z.; Juhász, B. Fenugreek (Trigonella Foenum-Graecum) Seed Flour and Diosgenin Preserve Endothelium-Dependent Arterial Relaxation in a Rat Model of Early-Stage Metabolic Syndrome. Int. J. Mol. Sci. 2018, 19, 798. https://doi.org/10.3390/ijms19030798
Szabó K, Gesztelyi R, Lampé N, Kiss R, Remenyik J, Pesti-Asbóth G, Priksz D, Szilvássy Z, Juhász B. Fenugreek (Trigonella Foenum-Graecum) Seed Flour and Diosgenin Preserve Endothelium-Dependent Arterial Relaxation in a Rat Model of Early-Stage Metabolic Syndrome. International Journal of Molecular Sciences. 2018; 19(3):798. https://doi.org/10.3390/ijms19030798
Chicago/Turabian StyleSzabó, Katalin, Rudolf Gesztelyi, Nóra Lampé, Rita Kiss, Judit Remenyik, Georgina Pesti-Asbóth, Dániel Priksz, Zoltán Szilvássy, and Béla Juhász. 2018. "Fenugreek (Trigonella Foenum-Graecum) Seed Flour and Diosgenin Preserve Endothelium-Dependent Arterial Relaxation in a Rat Model of Early-Stage Metabolic Syndrome" International Journal of Molecular Sciences 19, no. 3: 798. https://doi.org/10.3390/ijms19030798