Article

Novel Clofarabine-Based Combinations with Polyphenols Epigenetically Reactivate Retinoic Acid Receptor Beta, Inhibit Cell Growth, and Induce Apoptosis of Breast Cancer Cells

by
Katarzyna Lubecka
1,*,
Agnieszka Kaufman-Szymczyk
1,
Barbara Cebula-Obrzut
2,
Piotr Smolewski
2,
Janusz Szemraj
3 and
Krystyna Fabianowska-Majewska
4
1
Department of Biomedical Chemistry, Medical University of Lodz, 92-215 Lodz, Poland
2
Department of Experimental Hematology, Medical University of Lodz, 93-510 Lodz, Poland
3
Department of Medical Biochemistry, Medical University of Lodz, 92-215 Lodz, Poland
4
Faculty of Medicine, Lazarski University, 02-662 Warsaw, Poland
*
Author to whom correspondence should be addressed.
Int. J. Mol. Sci. 2018, 19(12), 3970; https://doi.org/10.3390/ijms19123970
Submission received: 12 November 2018 / Revised: 6 December 2018 / Accepted: 8 December 2018 / Published: 10 December 2018
(This article belongs to the Special Issue Cancer Epigenetics 2018)

Abstract

:
An epigenetic component, especially aberrant DNA methylation pattern, has been shown to be frequently involved in sporadic breast cancer development. A growing body of literature demonstrates that combination of agents, i.e. nucleoside analogues with dietary phytochemicals, may provide enhanced therapeutic effects in epigenetic reprogramming of cancer cells. Clofarabine (2-chloro-2′-fluoro-2′-deoxyarabinosyladenine, ClF), a second-generation 2′-deoxyadenosine analogue, has numerous anti-cancer effects, including potential capacity to regulate epigenetic processes. Our present study is the first to investigate the combinatorial effects of ClF (used at IC50 concentration) with epigallocatechin-3-gallate (EGCG, tea catechin) or genistein (soy phytoestrogen), at physiological concentrations, on breast cancer cell growth, apoptosis, and epigenetic regulation of retinoic acid receptor beta (RARB) transcriptional activity. In MCF7 and MDA-MB-231 cells, RARB promoter methylation and expression of RARB, modifiers of DNA methylation reaction (DNMT1, CDKN1A, TP53), and potential regulator of RARB transcription, PTEN, were estimated using methylation-sensitive restriction analysis (MSRA) and quantitative real-time polymerase chain reaction (qPCR), respectively. The combinatorial exposures synergistically or additively inhibited the growth and induced apoptosis of breast cancer cells, followed by RARB hypomethylation with concomitant multiple increase in RARB, PTEN, and CDKN1A transcript levels. Taken together, our results demonstrate the ability of ClF-based combinations with polyphenols to promote cancer cell death and reactivate DNA methylation-silenced tumor suppressor genes in breast cancer cells with different invasive potential.

Graphical Abstract

1. Introduction

Breast cancer is a heterogeneous disease that constitutes the second most prevalent cancer in the world and major epidemiological problem [1]. Due to the increasing incidence and death rates of breast tumors among women worldwide, there is a desperate call for development of new effective strategies of early detection, prevention, and therapy. Over 30% of sporadic breast cancer cases have been shown to result from a variety of modifiable environmental and social factors, including sedentary lifestyle, poor dietary habits, obesity, cigarette smoking, and exogenous hormones. It implies that dysregulated epigenetic code seems to play a pivotal role in sporadic breast cancer development [2]. Epigenetic processes, which include mainly DNA methylation, covalent histone modifications, and regulation by non-coding RNAs, are involved in determining the transcriptional activity of certain genes. In cancerous cells, aberrant epigenetic marks may lead to silencing of tumor suppressor genes and concomitantly to overexpression of oncogenes and prometastatic genes [3,4,5,6,7]. Among variety of the mechanisms by which breast tumor growth occurs, there is one that is potentially reversible, DNA methylation-mediated silencing of tumor suppressor genes. The number of tumor suppressor genes have been shown to act as negative regulators of intracellular oncogenic signaling pathways [3,4,6,7,8,9,10,11]. Thus, discovering new complex strategies of epigenetic therapy to target and reactivate these genes in cancer cells seems really promising.
Nucleoside analogues constitute an important group among new anti-cancer epigenetic drugs. The synthetic nucleosides as antimetabolites in DNA and/or RNA synthesis have been successfully introduced not only into therapy of hematological malignancies and viral infections, but more often into treatment of solid tumors [3,4,6,8,9,10,11,12,13,14,15,16,17]. Epigenetic anti-cancer therapy focused on inhibiting DNA methylation processes includes different strategies. Specific inhibitors of DNA methyltransferases (DNMTs, the enzymes catalyzing DNA methylation reaction), such as azacitidine and decitabine (DAC), need to be mentioned. Upon incorporation into DNA, these cytidine analogues inhibit DNMT activity and cause hypomethylation and upregulation of certain tumor suppressor genes [8,9,12]. Alternative approach refers to compounds, such as cladribine (2-chloro-2′-deoxyadenosine, 2CdA), fludarabine (2-fluoroarabinosyladenine, F-ara-A), and clofarabine (2-chloro-2′-fluoro-2′-deoxyarabinosyladenine, ClF), which interfere with one carbon metabolism and inhibit the activity of S-adenosyl-l-homocysteine (SAH) hydrolase. The following changes in SAH and S-adenosyl-l-methionine (SAM, methyl group donor) levels, i.e., SAH accumulation and SAM pool depletion, cause disruption in active methyl cycle and subsequent inhibition of DNA methylation reaction [15,18,19,20,21].
Due to many limitations of epigenetic monotherapy, a growing number of anti-cancer nucleoside analogue-based combinatorial strategies focused on remodeling of aberrant DNA methylation patterns have been developed and are currently under investigation [4,6,10,11,16,17]. Our recent discoveries [4] support the enhanced chemotherapeutic potential of the combinations of dietary bioactive compounds with conventional drugs in epigenetic anti-cancer therapy [4,6,10,11]. We showed previously that ClF used in combination with sulforaphane (SFN, an isothiocyanate from broccoli, brussels sprouts, and cabbage), demonstrated potent growth inhibitory activity in human breast cancer cells and led to robust hypomethylation and upregulation of RARB (retinoic acid receptor beta) and PTEN (phosphatase and tensin homologue) tumor suppressor genes, especially in mildly malignant breast cancer cells [4]. These two tumor suppressor genes, DNA methylation-silenced in breast cancer [22,23,24,25,26] have been chosen to investigate the chemopreventive potential of tested ClF-based combinations with different bioactive phytochemicals. RARB is a tumor suppressor protein that modulates cell proliferation and differentiation, cell cycle progression, and apoptosis [27]. RARB can act as an effective suppressor of transcriptional activity of AP-1 (activator protein 1) protein complex [28,29]. PTEN encodes protein involved in downregulation of intracellular oncogenic signaling pathways, such as phosphoinositide 3-kinase (PI3K)/AKT and mitogen-activated protein kinase (MAPK)/AP-1 [30,31]. AP-1 is a transcription factor positively regulating DNMT1 (DNA methyltransferase 1) gene encoding the main enzyme responsible for catalysis of DNA methylation reaction [31]. Thus, the proteins encoded by RARB and PTEN, that are negative regulators of AP-1, might be indirectly involved in DNMT1 downregulation [32,33]. Moreover, Lefebvre and colleagues documented that RARB expression may be further induced by PTEN [34].
Numerous studies have been set to get a better understanding of novel epigenetic chemopreventive approaches with usage of dietary phytochemicals in cancer [4,6,10,11,35,36]. Certain bioactive polyphenols, especially when used at low doses that are within the range of physiological concentrations, have been shown to exert substantial anti-cancer effects through remodeling of the epigenetic marks rather than robust alterations in the epigenome, frequently observed for synthetic pharmacological agents such as DAC [4,6,7,10,11,12,35,36,37]. Therefore, in the present study, we investigated the effects of ClF in combination with well-known and widely studied polyphenols: Epigallocatechin gallate (EGCG, tea catechin) or genistein (soy phytoestrogen), potent inhibitors of DNA methyltransferases (DNMTs) and modulators of histone modifications [38], on RARB methylation and expression in well-defined in vitro model of human breast cancer cell lines with different invasive potential. MCF7 (mildly malignant, ER-positive, wild-type p53; functional deletion in the caspase 3 (CASP3) gene) and MDA-MB-231 (malignant, ER-negative, mutant p53) breast cancer cell lines were chosen as an in vitro experimental model of human solid tumors.
Moreover, in an effort to understand some of epigenetic mechanisms underlying any changes in RARB transcriptional activity upon the tested combinatorial exposures in breast cancer cells, we assessed expression levels of known DNA methylation modifiers, DNMT1, CDKN1A (p21), and TP53, as well as potential regulator of RARB transcription, PTEN. TP53 is a tumor suppressor relevant for regulation of cellular growth, cell cycle and apoptosis. TP53 gene encodes p53 protein that acts as a transcription factor for a numerous p53-inducible genes, i.a. positively affecting CDKN1A [39,40] and downregulating DNMT1 [41]. It has been reported, that during DNA replication, p21 tumor suppressor encoded by CDKN1A competes with DNMT1 for the same binding site on proliferating cell nuclear antigen (PCNA, homotrimeric ring surrounding DNA), which disrupts DNMT1/PCNA complex formation and subsequently may cause inhibition of DNA methylation reaction [42,43].
The selected polyphenols, EGCG and genistein, have been shown to reverse DNA methylation-mediated silencing of tumor suppressor genes and inhibit growth and promote death of breast, cervical, esophageal, and/or prostate cancer cells [44,45]. The presence of catechol group in the structure of EGCG play a key role in inhibiting DNMT activity. EGCG is an excellent substrate for the methylation reaction mediated by cathecol-O-methyltransferase (COMT). Followed by COMT-mediated methylation reactions, SAM pool depletion and SAH formation have been observed, and SAH accumulation is a potent reverse inhibitor of DNA methylation [46]. Moreover, this tea constituent was demonstrated to directly interact with the catalytic site of DNMT1 [45]. The epigenetic activity of genistein, a potent phytoestrogen, can be attributed to their ability to stimulate CDKN1A via estrogen response elements (ERE) within its promoter [47], as well as to repress AP-1 transcriptional activity [48] or PTEN upregulation [49]. In 2014 Xie and colleagues, using molecular modeling, demonstrated that genistein may directly interact with the catalytic domain of DNMT1, and competitively inhibit the binding of hemimethylated DNA to this domain [50].
Our present study is the first to investigate the combinatorial effects of ClF (used at IC50 concentration) with polyphenols, EGCG, or genistein used at the range of physiological concentrations, on breast cancer cell growth, apoptosis, and epigenetic regulation of transcriptional activity of DNA methylation-silenced tumor suppressor genes, such as RARB and PTEN.

2. Results and Discussion

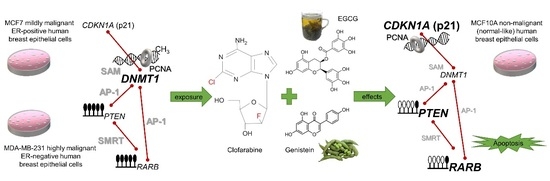
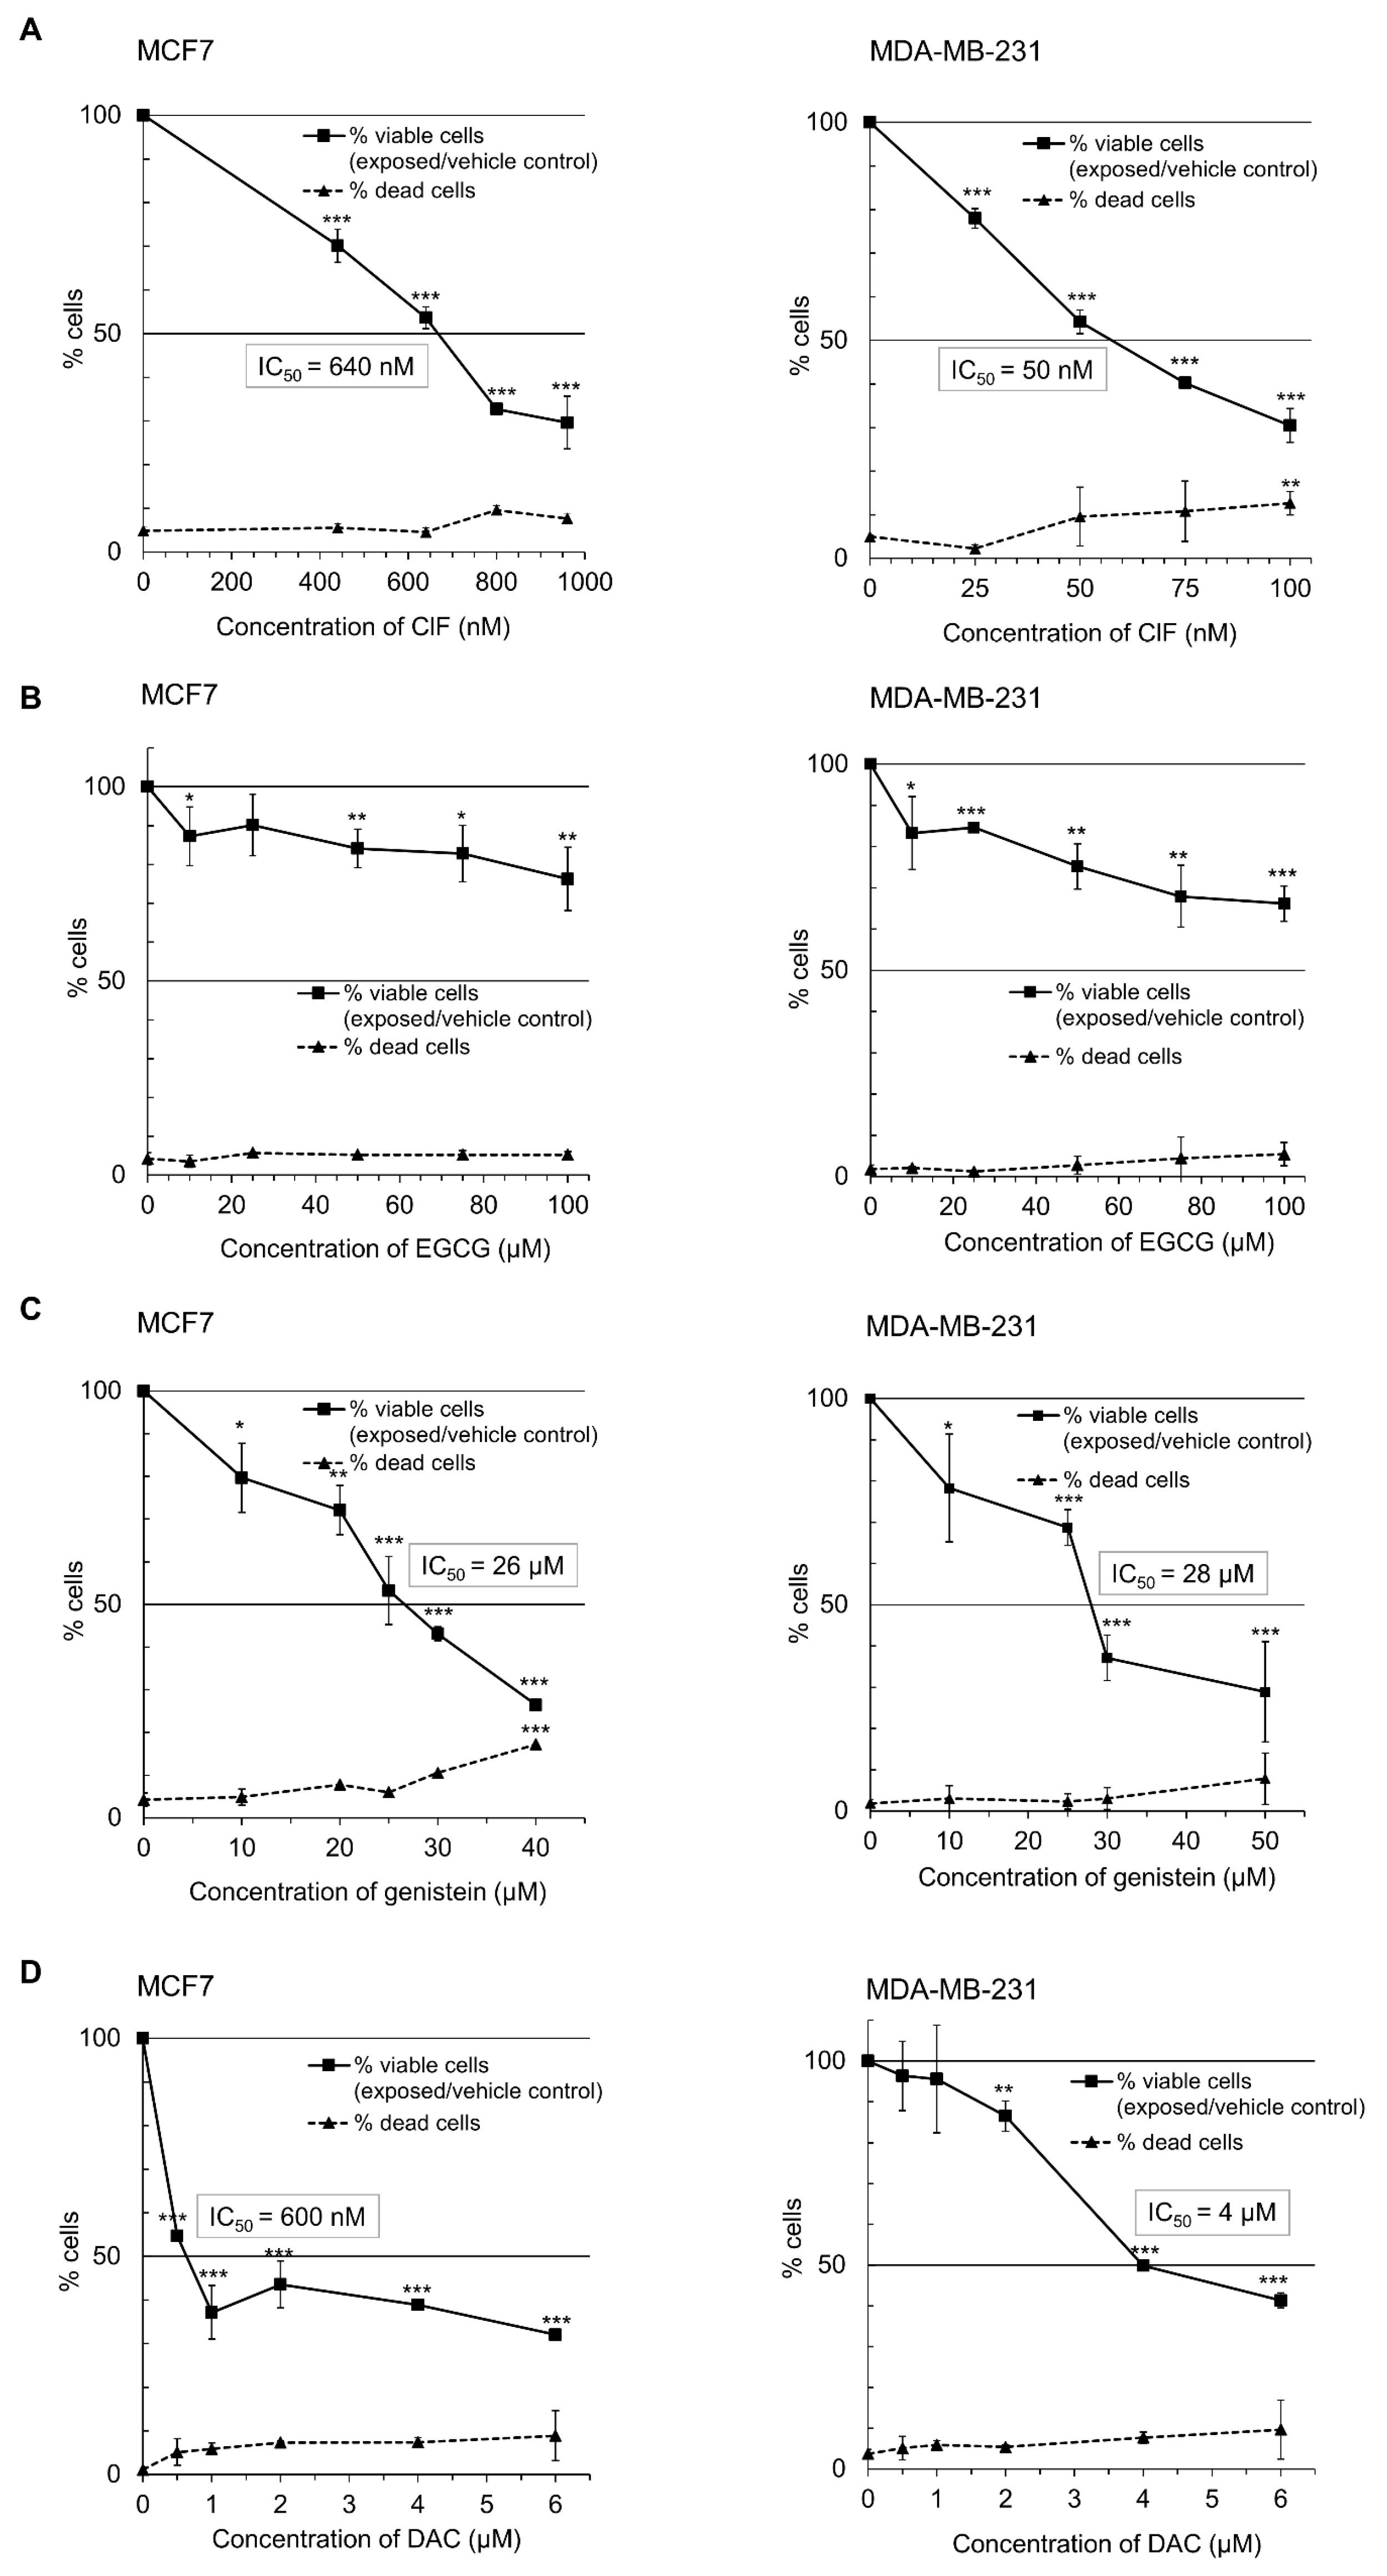
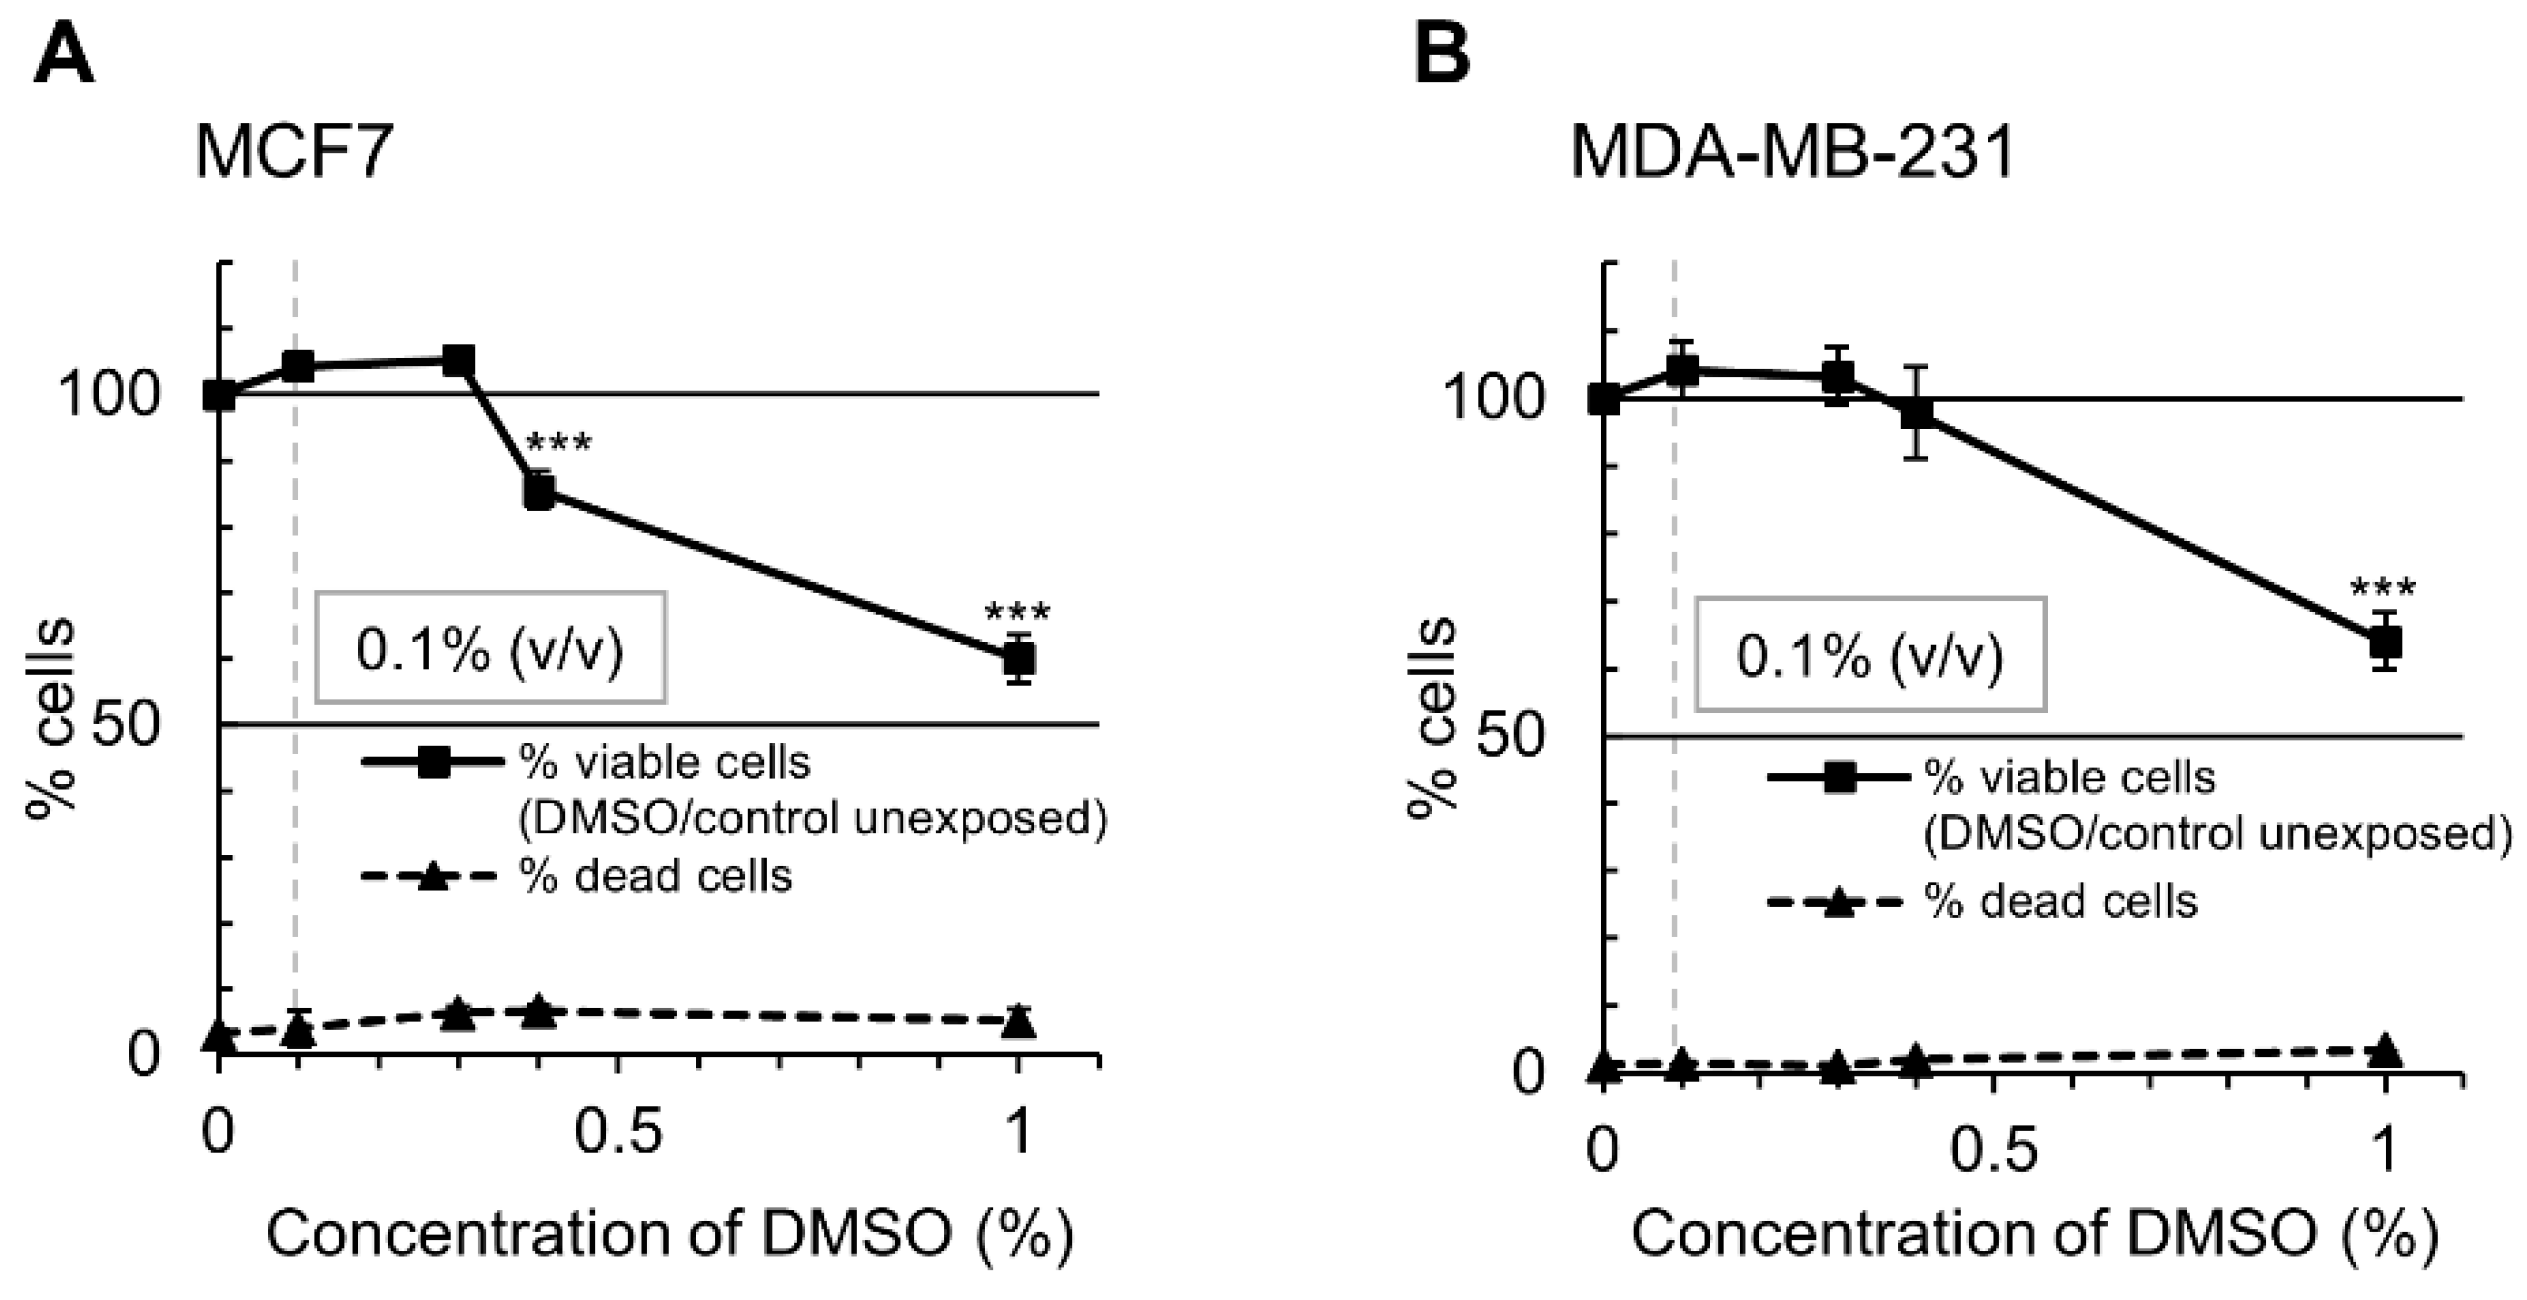
2.1. ClF-Based Combinations with Polyphenols Inhibits Breast Cancer Cell Growth

Our findings demonstrate that all the tested compounds, ClF, EGCG, and genistein, decrease breast cancer cell growth with low toxicity. As measured by trypan blue exclusion test, they inhibit MCF7 and MDA-MB-231 cell viability in a dose-dependent manner (Figure 1).
Following 4 days-exposure, ClF concentrations leading to 50% decrease in the number of viable cells (IC50) were determined as 640 nM in non-invasive MCF7 cells and 50 nM in highly invasive MDA-MB-231 cells (Figure 1A) [3]. The number of dead cells did not exceed 10% regardless of cell invasiveness indicating low cytotoxicity level of ClF used at IC50 concentrations (Figure 1A). Noticeably, ClF reduced viability of malignant ER-negative MDA-MB-231 cells by 50% at over 10-fold lower concentration (IC50 = 50 nM) compared with mildly malignant ER-positive MCF7 cells (IC50 = 640 nM) [3] (Figure 1A). Varying ClF efficacy with respect to the level of cell growth inhibitory properties could be expected due to the varying characteristics of each cell line.
These observations may be associated with different p53 status. MCF7 cells express wild-type p53, while in MDA-MB-231 cells p53 is mutated [39]. However, in our previous and present studies no significant changes in TP53 expression were observed upon ClF exposure in either of the cell lines [3]. Another potential explanation is that MCF7 cells possess a functional deletion of the caspase 3 (CASP3) gene [51].
Moreover, it has been demonstrated that responsiveness to the clinically important nucleoside analogues may be critically determined by deoxycytidine kinase (DCK) expression. This enzyme is required to convert the inactive prodrugs into their pharmacologically active forms [15,52]. In 2012, Geutjes and colleagues reported that DCK is expressed at higher levels in breast cancer patients that are at high risk of recurrence and having poor clinical outcome. The DCK overexpression in these patients was strongly correlated with a favorable response to nucleoside analogues [52]. In support of this, a causal relationship between DCK levels and sensitivity to the nucleoside analogues in breast cancer cell lines was reported as well [52].
Interestingly, in 2015 Abramczyk and colleagues showed the significant difference in the number of cytoplasmic lipid droplets in non-malignant (normal-like) MCF10A mammary epithelial cells and mildly malignant MCF7 or malignant MDA-MB-231 breast epithelial cells. They found around 2 and 4 times more cytoplasmic lipid droplets in MCF7 and MDA-MB-231, respectively, compared to MCF10A cells [53]. Together with lipophilic properties of ClF [15] and almost two-fold higher proliferation rate in MDA-MB-231 versus MCF7 cells [3], it may partly explain greater bioavailability of the drug in invasive MDA-MB-231 cells.
EGCG and genistein exerted similar effects towards non-invasive and invasive breast cancer cells (Figure 1B,C). Upon 4 days-exposure to EGCG at the concentration range to 100 µM, IC50 concentrations have not been achieved regardless of cell invasiveness (Figure 1B). Genistein administration led to 50% decrease in the number of viable cells (IC50) at the 26–28 µM concentrations both in non-invasive ER-positive MCF7 and highly invasive ER-negative MDA-MB-231 cells (Figure 1C).
It is important to notice that any variances between different studies investigating the effects of the selected polyphenols on cellular viability of MCF7 and MDA-MB-231 cells may be associated with different cell culture conditions. For example, preparation of stock solutions of the tested compounds with usage of different type of solvent and its final concentration, i.e., water or DMSO for EGCG, and DMSO or ethanol for genistein. Moreover, different than recommended culture media, i.e., RPMI-1640 or DMEM medium instead of EMEM or L-15 media for MCF7 and MDA-MB-231 cells, respectively. Different schedules and durations of cell exposure to the mentioned compounds may affect the extent of their anti-proliferative activity as well [50,54,55,56].
Combination of EGCG with ClF significantly enhanced inhibition of cell growth in both MCF7 and MDA-MB-231 cells as compared with ClF alone (Table 1A,B), according to CompuSyn software analysis [57]. This synergistic effect was achieved at only 10 µM concentration of EGCG that reflects physiologically relevant EGCG levels in humans (Figure 1B; Table 1A,B) [38]. Additive decrease in the number of viable cells was also observed in both cell lines after combinatorial ClF and genistein (10 µM) exposure compared with ClF alone (Table 1A,B).

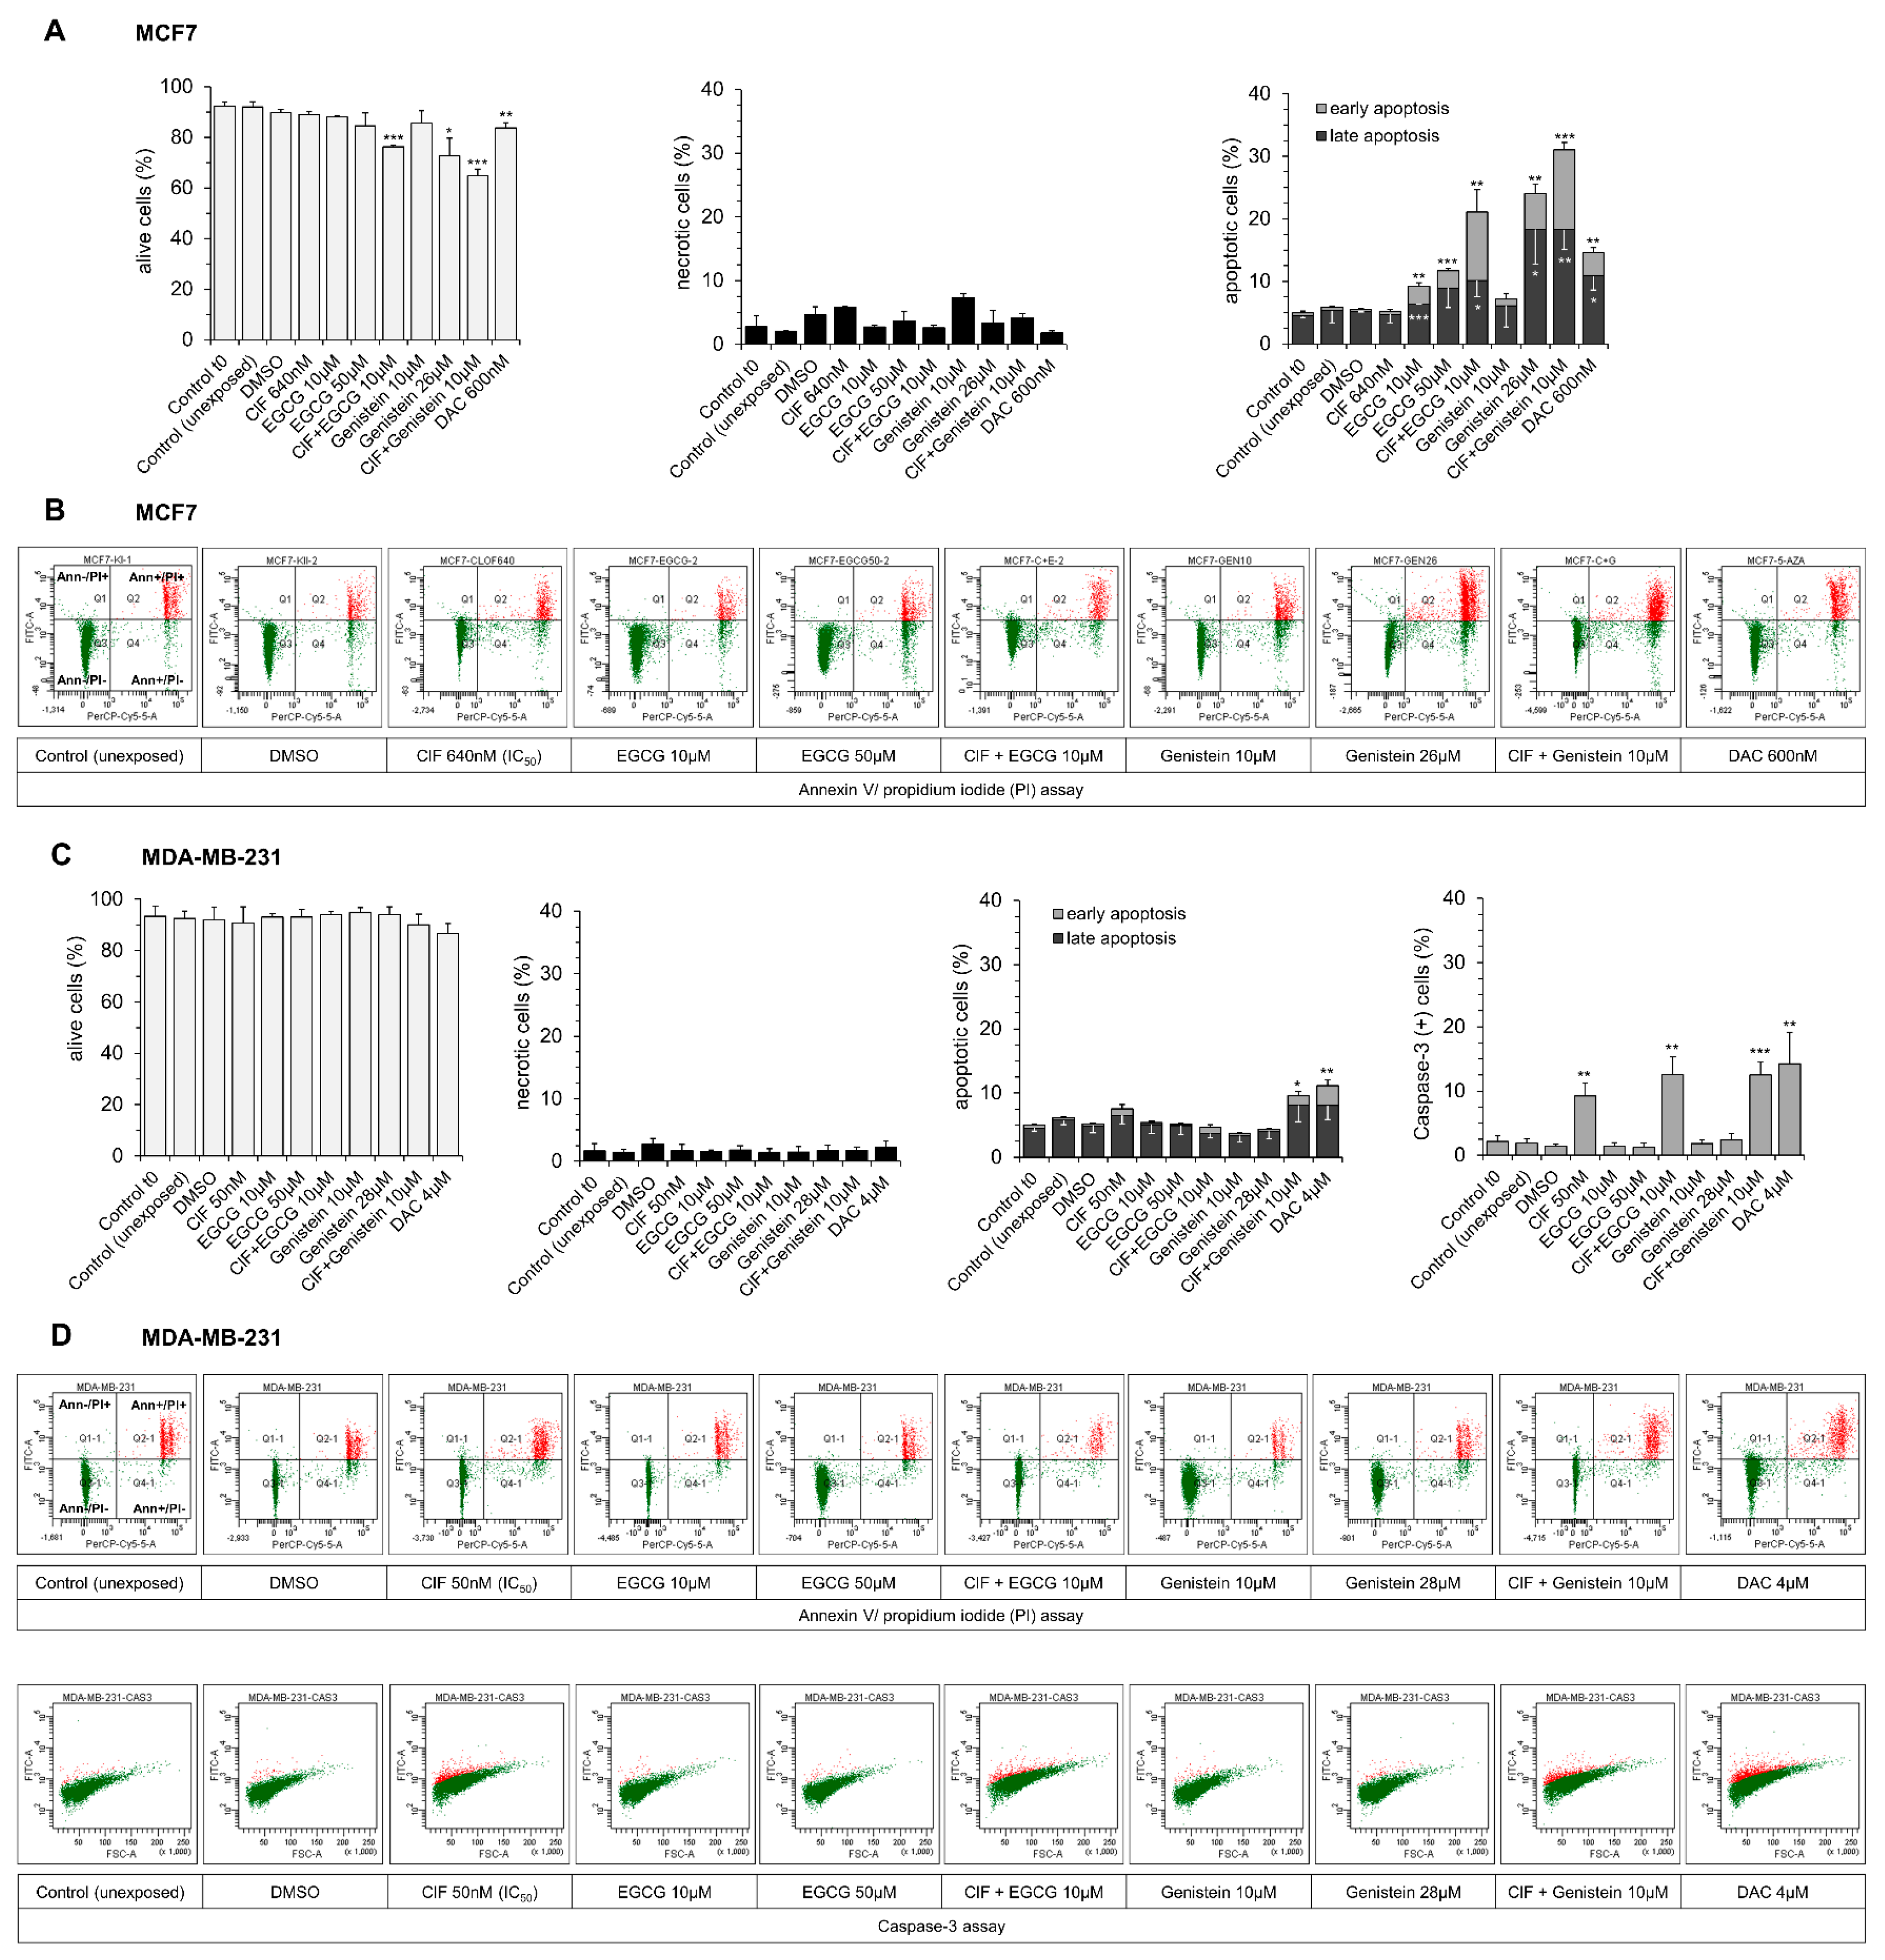
2.2. Both EGCG and Genistein Enhances ClF Pro-Apoptotic Effects Mostly in Mildly Malignant MCF7 Cells

A dose-dependent increase in the number of apoptotic MCF7 cells from 5% in the vehicle control to 9% and 12% in the samples incubated with EGCG used alone at 10 µM and 50 µM concentrations, respectively, was determined upon 4 days-exposure (Figure 2A,B). This observation was not associated with caspase 3 activation (data not shown), which is consistent with Jänicke’s report showing lack of functional caspase 3 in MCF7 cells [51]. It may indicate that the tested polyphenol induces apoptosis through caspase-independent pathway in this cell line. Huang and colleagues demonstrated that EGCG-induced apoptosis of MCF7 cells may be associated with Bcl-2 downregulation [55].
In invasive MDA-MB-231 cells that express caspase 3, EGCG did not increase either apoptotic cell rate (Figure 2C,D) or caspase 3 activity (Figure 2C,D), indicating no effect on caspase-dependent or caspase-independent apoptotic pathway. Moreover, lack of functionally active p53 in MDA-MB-231 cells may account for their resistance to EGCG pro-apoptotic effects (Figure 2C,D). Hong and colleagues observed that EGCG inhibits the growth and induces apoptosis of malignant MDA-MB-231 cells through inactivation of β-catenin signaling pathway, but at much higher dose of EGCG equal to 200 µM [56].
Upon 4 days-exposure to genistein used alone, we observed more profound dose-dependent increase in the number of apoptotic MCF7 cells, from 5% in the vehicle control to 7% and 24% in the samples incubated with 10 µM and 26 µM concentrations, respectively (Figure 2A,B).
Similarly to EGCG, genistein did not increase either apoptotic cell rate or caspase 3 activity in MDA-MB-231 cells (Figure 2C,D). These results are consistent with the report of Xu and Loo, showing that even after 6 days of incubation with 50 μM genistein, only MCF7, but not MDA-MB-231 cells, showed morphological signs of apoptosis [58].
In our previous study, we found 10 µM SFN in combination with ClF to work well together at increasing apoptosis in mildly malignant MCF7 cells [4]. Therefore, we chose to assess pro-apoptotic effects of novel ClF-based combinations with selected polyphenols, EGCG, and genistein, at the same 10 µM concentration, that is at the range of their physiologically relevant levels in humans [38].
In MCF7 cells, both EGCG (10 µM) and genistein (10 µM) significantly enhanced pro-apoptotic effects of ClF (IC50) after 4 days-exposure. The number of apoptotic cells increases from 5% after ClF alone to 21% and 31% after combinatorial ClF + EGCG and ClF + Genistein administration, respectively (Figure 2A,B).
In MDA-MB-231 cells, EGCG in combination with ClF did not change significantly ClF effects on cell death (Figure 2C,D). Although, ClF in combination with genistein caused slight increase in the number of apoptotic MDA-MB-231 cells, from 7% after ClF alone to 10% upon combinatorial exposure (Figure 2C,D). Interestingly, upon 4 days-incubation with the tested combinations, almost 13% of all MDA-MB-231 cells showed active caspase 3, whereas after ClF alone approximately 9% of all MDA-MB-231 bound antibodies against caspase 3 (Figure 2C,D). It may indicate the initiation of early stage of caspase-dependent apoptotic pathway in invasive MDA-MB-231 cells (Figure 2C,D).
In both cell lines, combinatorial ClF and EGCG or genistein did not cause cell necrosis as measured by flow cytometry (Figure 2).
DAC used at IC50 concentrations caused significant induction of apoptosis in both MCF7 (about 15% of apoptotic cells) and MDA-MB-231 (over 11% of apoptotic cells) cells (Figure 2). Upon DAC exposure, almost 14% of all MDA-MB-231 cells showed active caspase 3 (Figure 2C,D), which might suggest caspase-dependent induction of apoptosis in this highly malignant breast cancer cell line. In both cell lines, DAC did not cause a relevant increase in cell necrosis rate (Figure 2).

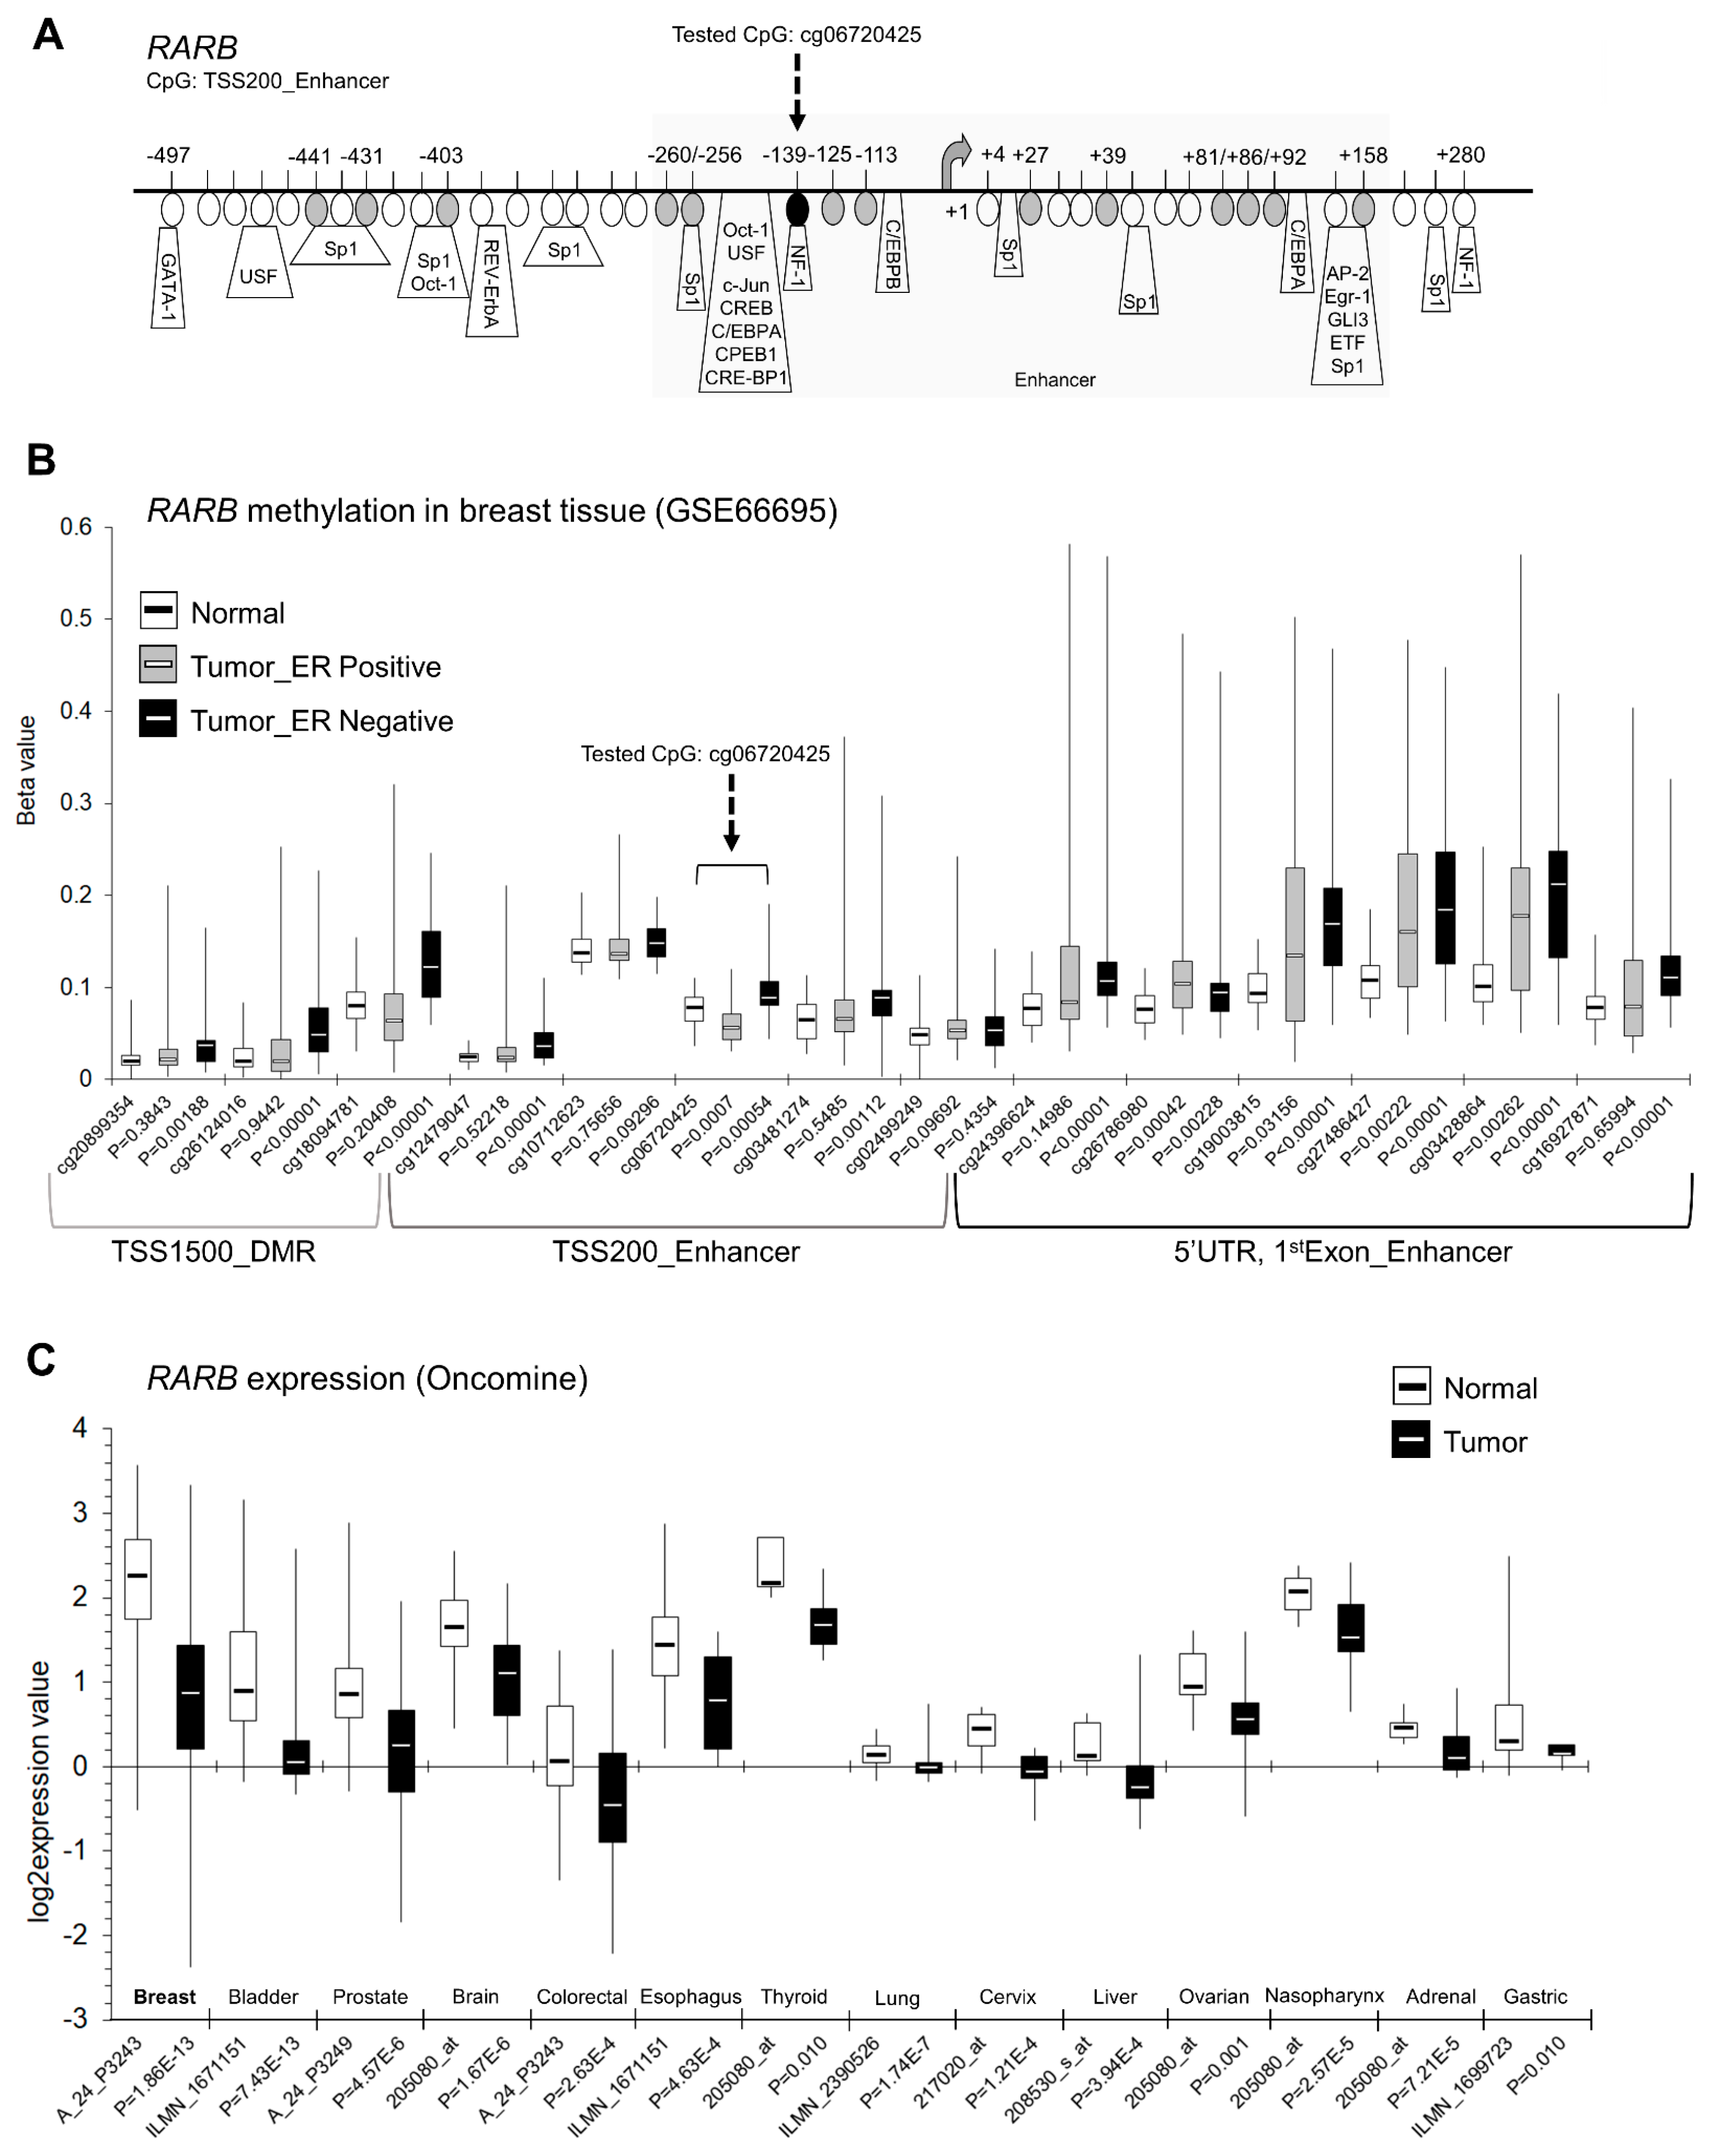
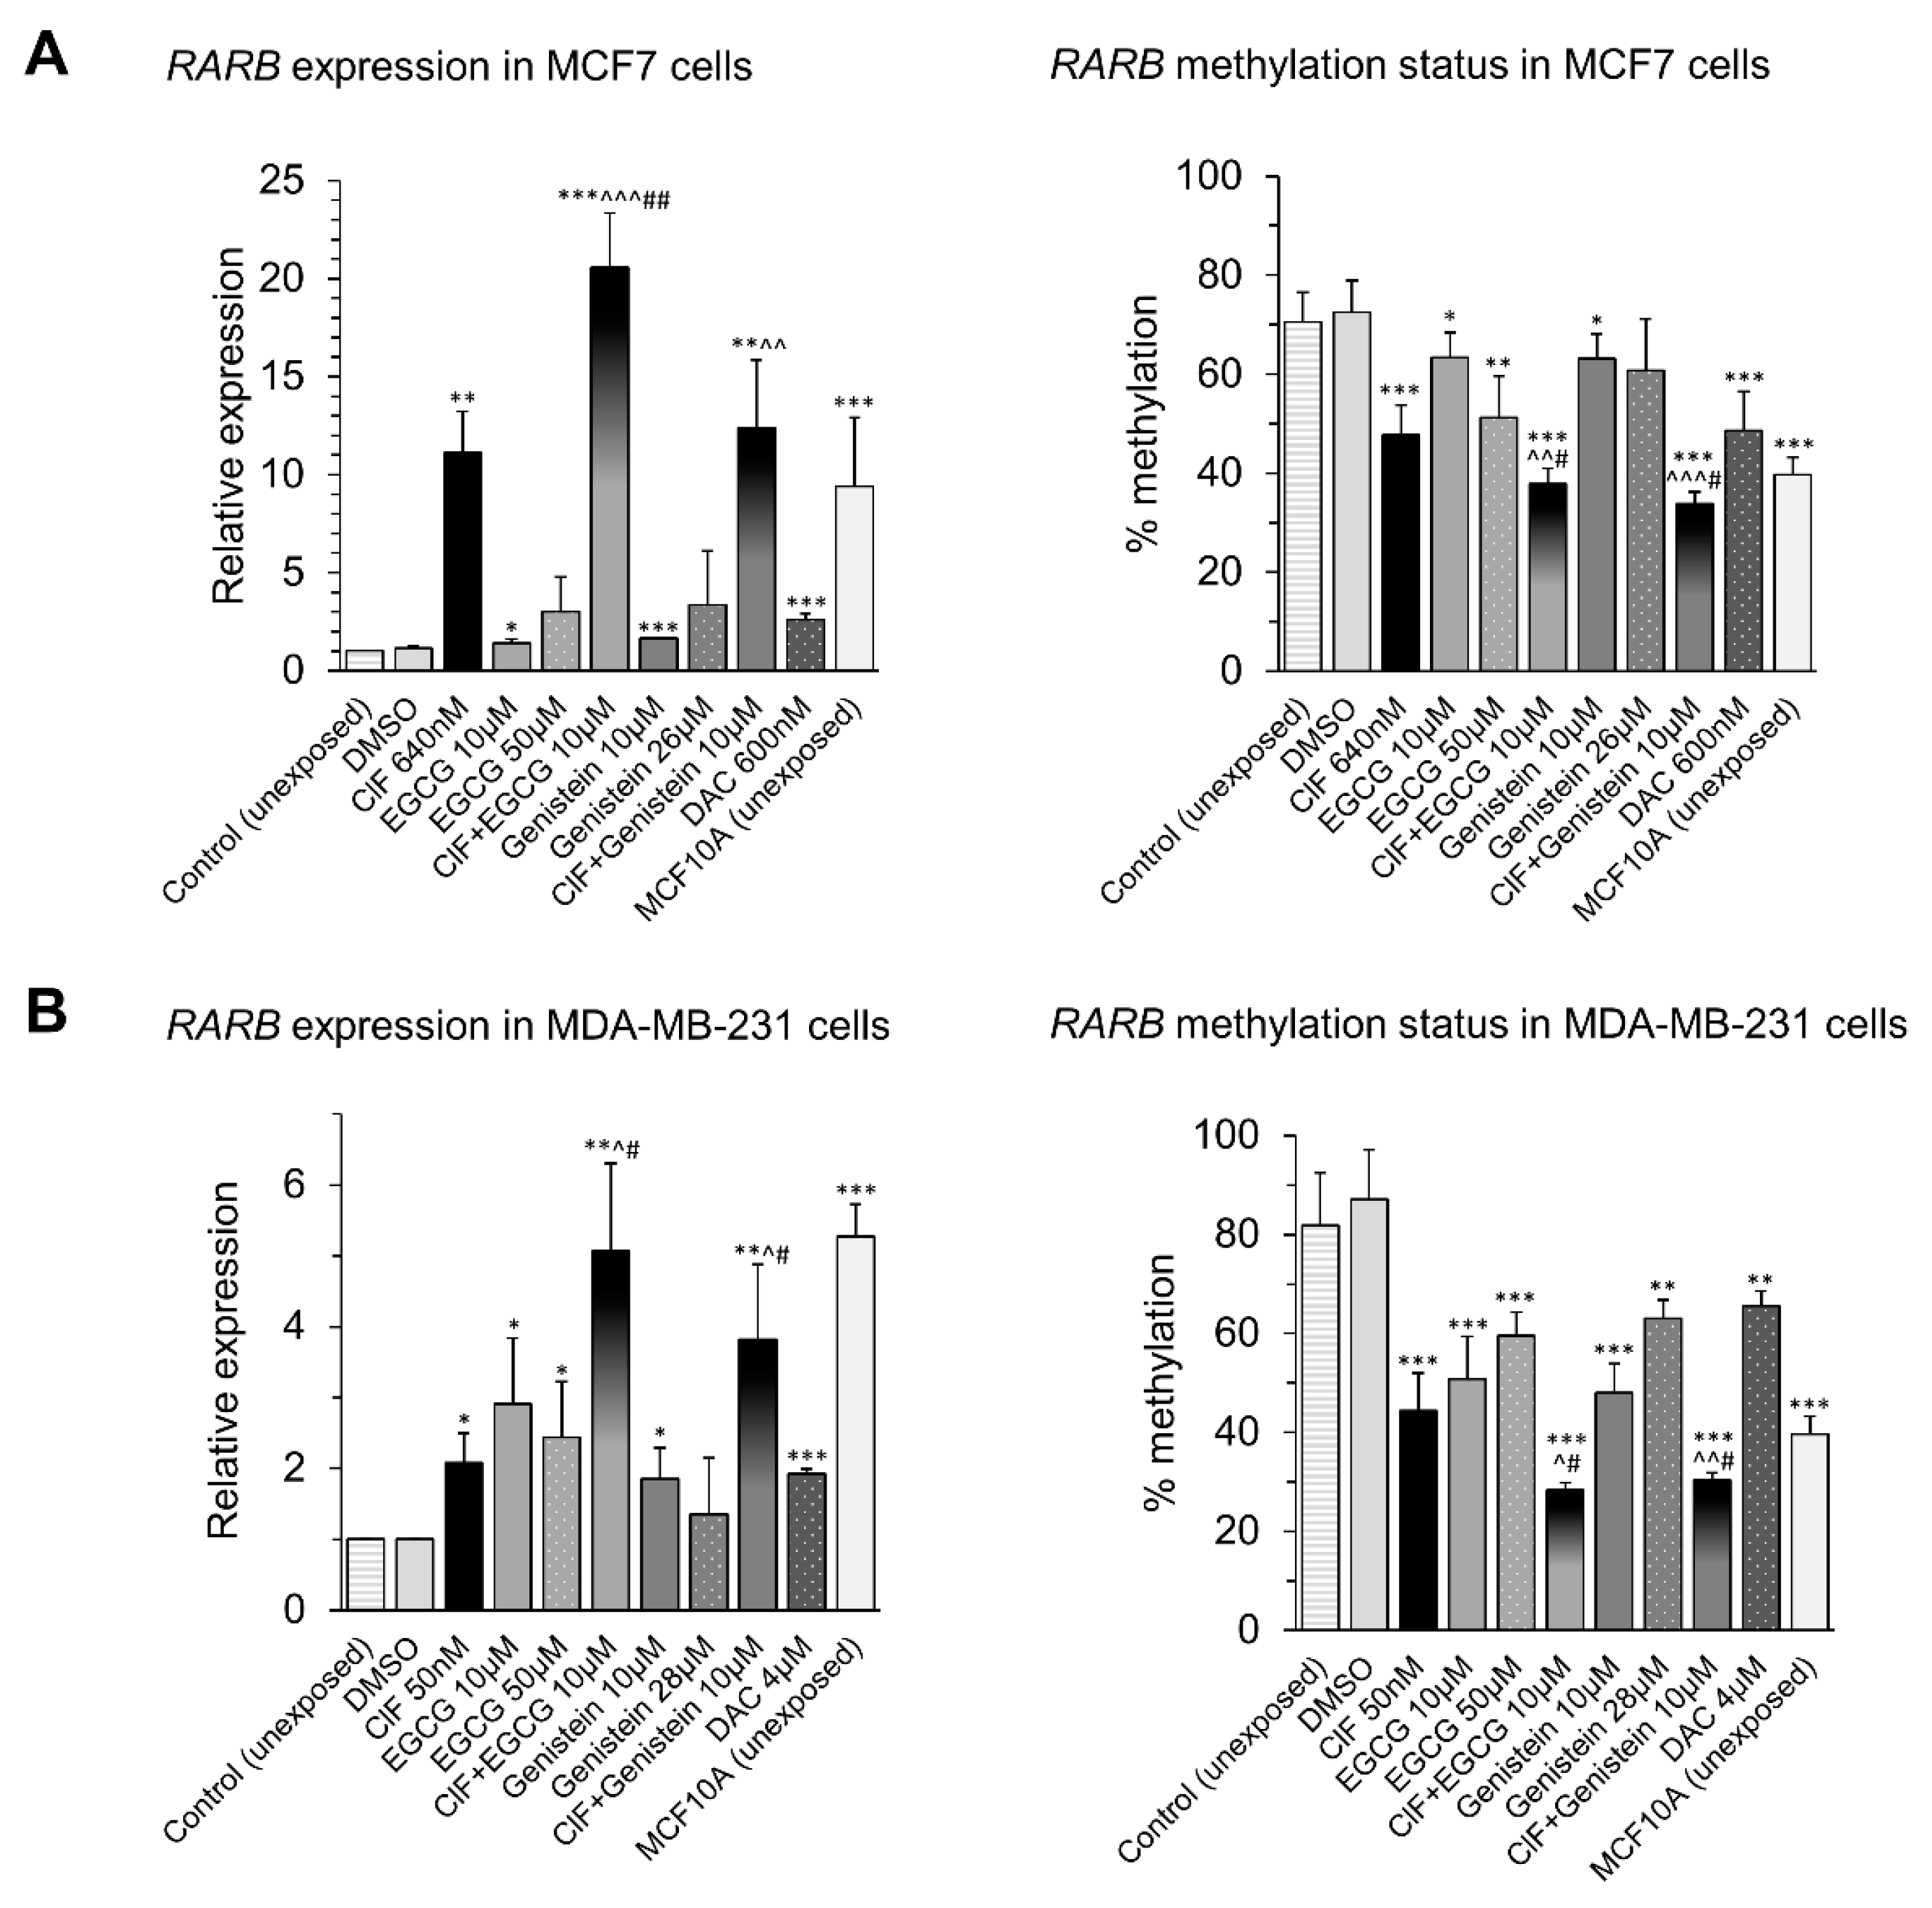
2.3. ClF, EGCG, and Genistein Used Alone and in Combinations Exert Profound Effects on RARB Promoter Methylation and Expression in Breast Cancer Cells

We showed recently that ClF used alone and in combination with SFN demonstrated potent growth inhibitory activity in human breast cancer cells and led to robust hypomethylation and upregulation of DNA methylation-silenced RARB tumor suppressor gene with concomitant DNMT1 downregulation and CDKN1A upregulation, especially at early stage of breast cancer development [4]. Therefore, we decided to examine the effect of novel ClF-based combinations with polyphenols on RARB transcriptional activity and determine if there are any alterations in DNA methylation levels within its proximal promoter region. In an effort to understand some of the mechanisms underlying our observations we next assessed exposure-mediated changes in the expression of known epigenetic modifiers, DNMT1, CDKN1A, and TP53.
According to publicly available Illumina 450K data (GSE66695), the RARB proximal promoter region is shown to be hypermethylated both in ER-positive and ER-negative breast tumors as compared with normal tissue (Figure 3B). The higher extent of RARB hypermethylation was observed in ER-negative tumors (Figure 3B). Moreover, Oncomine data indicate that RARB is transcriptionally silenced in many types of cancers, with breast cancer at the forefront (Figure 3C). The detailed map in Figure 3A demonstrates the exact position of the tested CpG site, cg06720425 (marked in black) within RARB enhancer of its promoter region (−139 bp from transcription start site, TSS) and 13 neighboring CpGs covered on Illumina 450K microarray platform (marked in gray, from −441 bp to +158 bp in relation to TSS) (Figure 3A). Putative transcription factor binding sites are depicted on the gene map, as predicted using TransFac (Figure 3A). The number of binding sites for DNA methylation-sensitive transcription factors within the tested RARB promoter fragment enhanced its potential regulatory role in RARB transcription (Figure 3A) [22,27].
Both EGCG and genistein as the potent DNMTs inhibitors can act as effective modulators of DNA methylation processes in cancer cells [38]. Fang and colleagues, as well as Khan and colleagues, observed EGCG-mediated hypomethylation of RARB promoter and its upregulation in human cervical, esophageal, colon, and prostate cancers [59,60]. According to Fang’s and Sundaram’s reports, genistein induced DNA methylation-mediated reactivation of RARB both in esophageal, prostate, and cervical cancers [44,61]. In our current studies, we identified a role of EGCG and genistein in regulation of promoter methylation and expression of RARB tumor suppressor gene in human breast cancer cells with different invasive potential (Figure 4).
Four days-exposure of MCF7 cells to the tested compounds used alone, ClF, EGCG, and genistein, led to significant increases in RARB mRNA levels, the highest upon ClF (11-fold increase) (Figure 4A, left panel). The dose-dependent RARB re-expression (from 1.4-fold to 3.4-fold increases in RARB mRNA levels) after EGCG (10 and 50 µM) and genistein (10 and 26 µM) administration were observed in MCF7 cells (Figure 4A, left panel). RARB transcriptional reactivation was accompanied by significant decrease in RARB promoter methylation by approximately 10–25%. Again, the highest changes were observed followed by MCF7 cells incubation with ClF (Figure 4A, right panel). RARB promoter methylation was attenuated by around 10–22% at both concentrations of EGCG and genistein (Figure 4A, right panel). These observations in MCF7 cells (Figure 4A) indicate that the tested compounds may regulate RARB transcription at least partly through its promoter methylation at non-invasive stage of breast cancer. Noticeably, DAC (600 nM) used in our present study as a reference agent, acting as a potent DNMTs inhibitor, led to similar decrease in RARB promoter methylation as ClF (by 24–25% after ClF or DAC), but it was associated with only 2.6-fold increase in RARB expression comparing to 11-fold increase upon ClF exposure (Figure 4A).
In invasive MDA-MB-231 cells, the tested compounds used alone caused relevant RARB upregulation, at the range of 1.4–2.9-fold changes in RARB transcript levels. The strongest alterations were observed upon 10 µM EGCG exposure (2.9-fold increase compared to 2.1-fold increase after ClF) (Figure 4B, left panel). The effects on RARB transcriptional activity and its promoter methylation did not show a dose-dependent pattern. Both EGCG and genistein at 10 µM concentration attenuated RARB promoter methylation by 36% and 39% that was associated with 2.9- and 1.9-fold increase in gene expression, respectively (Figure 4B). However, 50 µM EGCG and 28 µM genistein reduced RARB promoter methylation by 28% and 24%, increasing gene expression by only 140% (2.4-fold increase) and 40%, respectively (Figure 4B). 4 days-exposure of MDA-MB-231 cells to 4 µM DAC led to the lowest decrease in RARB promoter methylation compared to other tested compounds. The methylation state of RARB promoter changed from 73% in vehicle control to 66% after DAC exposure, elevating RARB mRNA level by 90% (1.9-fold increase) (Figure 4B).
The extent of hypomethylation induced by the tested compounds used alone was more robust in MDA-MB-231 cells where basal level of RARB promoter methylation in unexposed cells is higher compared with MCF7 cells. RARB promoter fragment is methylated at 70% in MCF7 and at 82% in MDA-MB-231 cells (Figure 4A,B, right panels). Moreover, taking into account that DNA methylation is a postreplicative modification, almost 2-fold higher proliferation rate of MDA-MB-231 versus MCF7 cells may account for stronger manifestation of methylation alterations caused by the tested chemicals in this cell line [3].
In MCF7 cells, both ClF-based combinations with EGCG and genistein enhances the inhibitory effect of ClF on RARB promoter methylation after 4 days-exposure (Figure 4A, right panel). The methylation level drops from 48% after ClF alone (73% in vehicle control) to 38% and 34% after ClF + EGCG and ClF + Genistein combinations, respectively (Figure 4A, right panel). These changes in methylation marks correlate with stronger induction of RARB expression, especially after combinatorial ClF and EGCG administration (Figure 4A, left panel). Interestingly, this combined exposure leads to over 20-fold increase in RARB mRNA level which is highly relevant compared to 11-fold overexpression after ClF alone (Figure 4A, left panel). This robust effect on RARB expression does not coincide with enhancement of hypomethylation level within RARB promoter (Figure 4). It suggests the involvement of another mechanisms in the combined effects of ClF and EGCG on RARB transcription.
Similarly to mildly malignant MCF7 cells, in highly malignant MDA-MB-231 cells, both EGCG and genistein in combination with ClF cause additional changes in both RARB promoter methylation and gene expression (Figure 4B). The methylation level decreases from 44% after ClF alone (87% in vehicle control) to 28% and 30% after ClF + EGCG and ClF + Genistein combinations, respectively (Figure 4B, right panel). These changes in promoter methylation marks are associated with enhanced induction of RARB expression, but to a lesser extent than in MCF7 cells (Figure 4B, left panel). In MDA-MB-231 cells, the combined exposures, ClF + EGCG and ClF + Genistein, lead to 5-fold and almost 4-fold increases in RARB mRNA level, respectively, which are around 3–4 times lower compared to over 20-fold or 12-fold overexpression after combinatorial administrations in MCF7 cells (Figure 4A,B, left panels). The more robust RARB upregulation induced by the tested ClF-based combinations with polyphenols in MCF7 cells compared to MDA-MB-231 cells, may be explained by 2 times lower basal level of RARB transcript in unexposed MCF7 cells than in unexposed MDA-MB-231 cells, as compared with unexposed non-malignant (normal-like) MCF10A cells (Figure 4A,B, left panels). It may also indicate some distinct mechanisms of the combined exposures in non-invasive compared to invasive breast cancer cells.
It is worth pointing out that the observed RARB methylation drops and expression rises, followed by the tested combinatorial exposures both in MCF7 and MDA-MB-231 breast cancer cells, alter “cancer-specific” RARB methylation and expression states towards “normal-like” RARB methylation and expression levels determined in unexposed non-malignant mammary epithelial MCF10A cells (Figure 4).

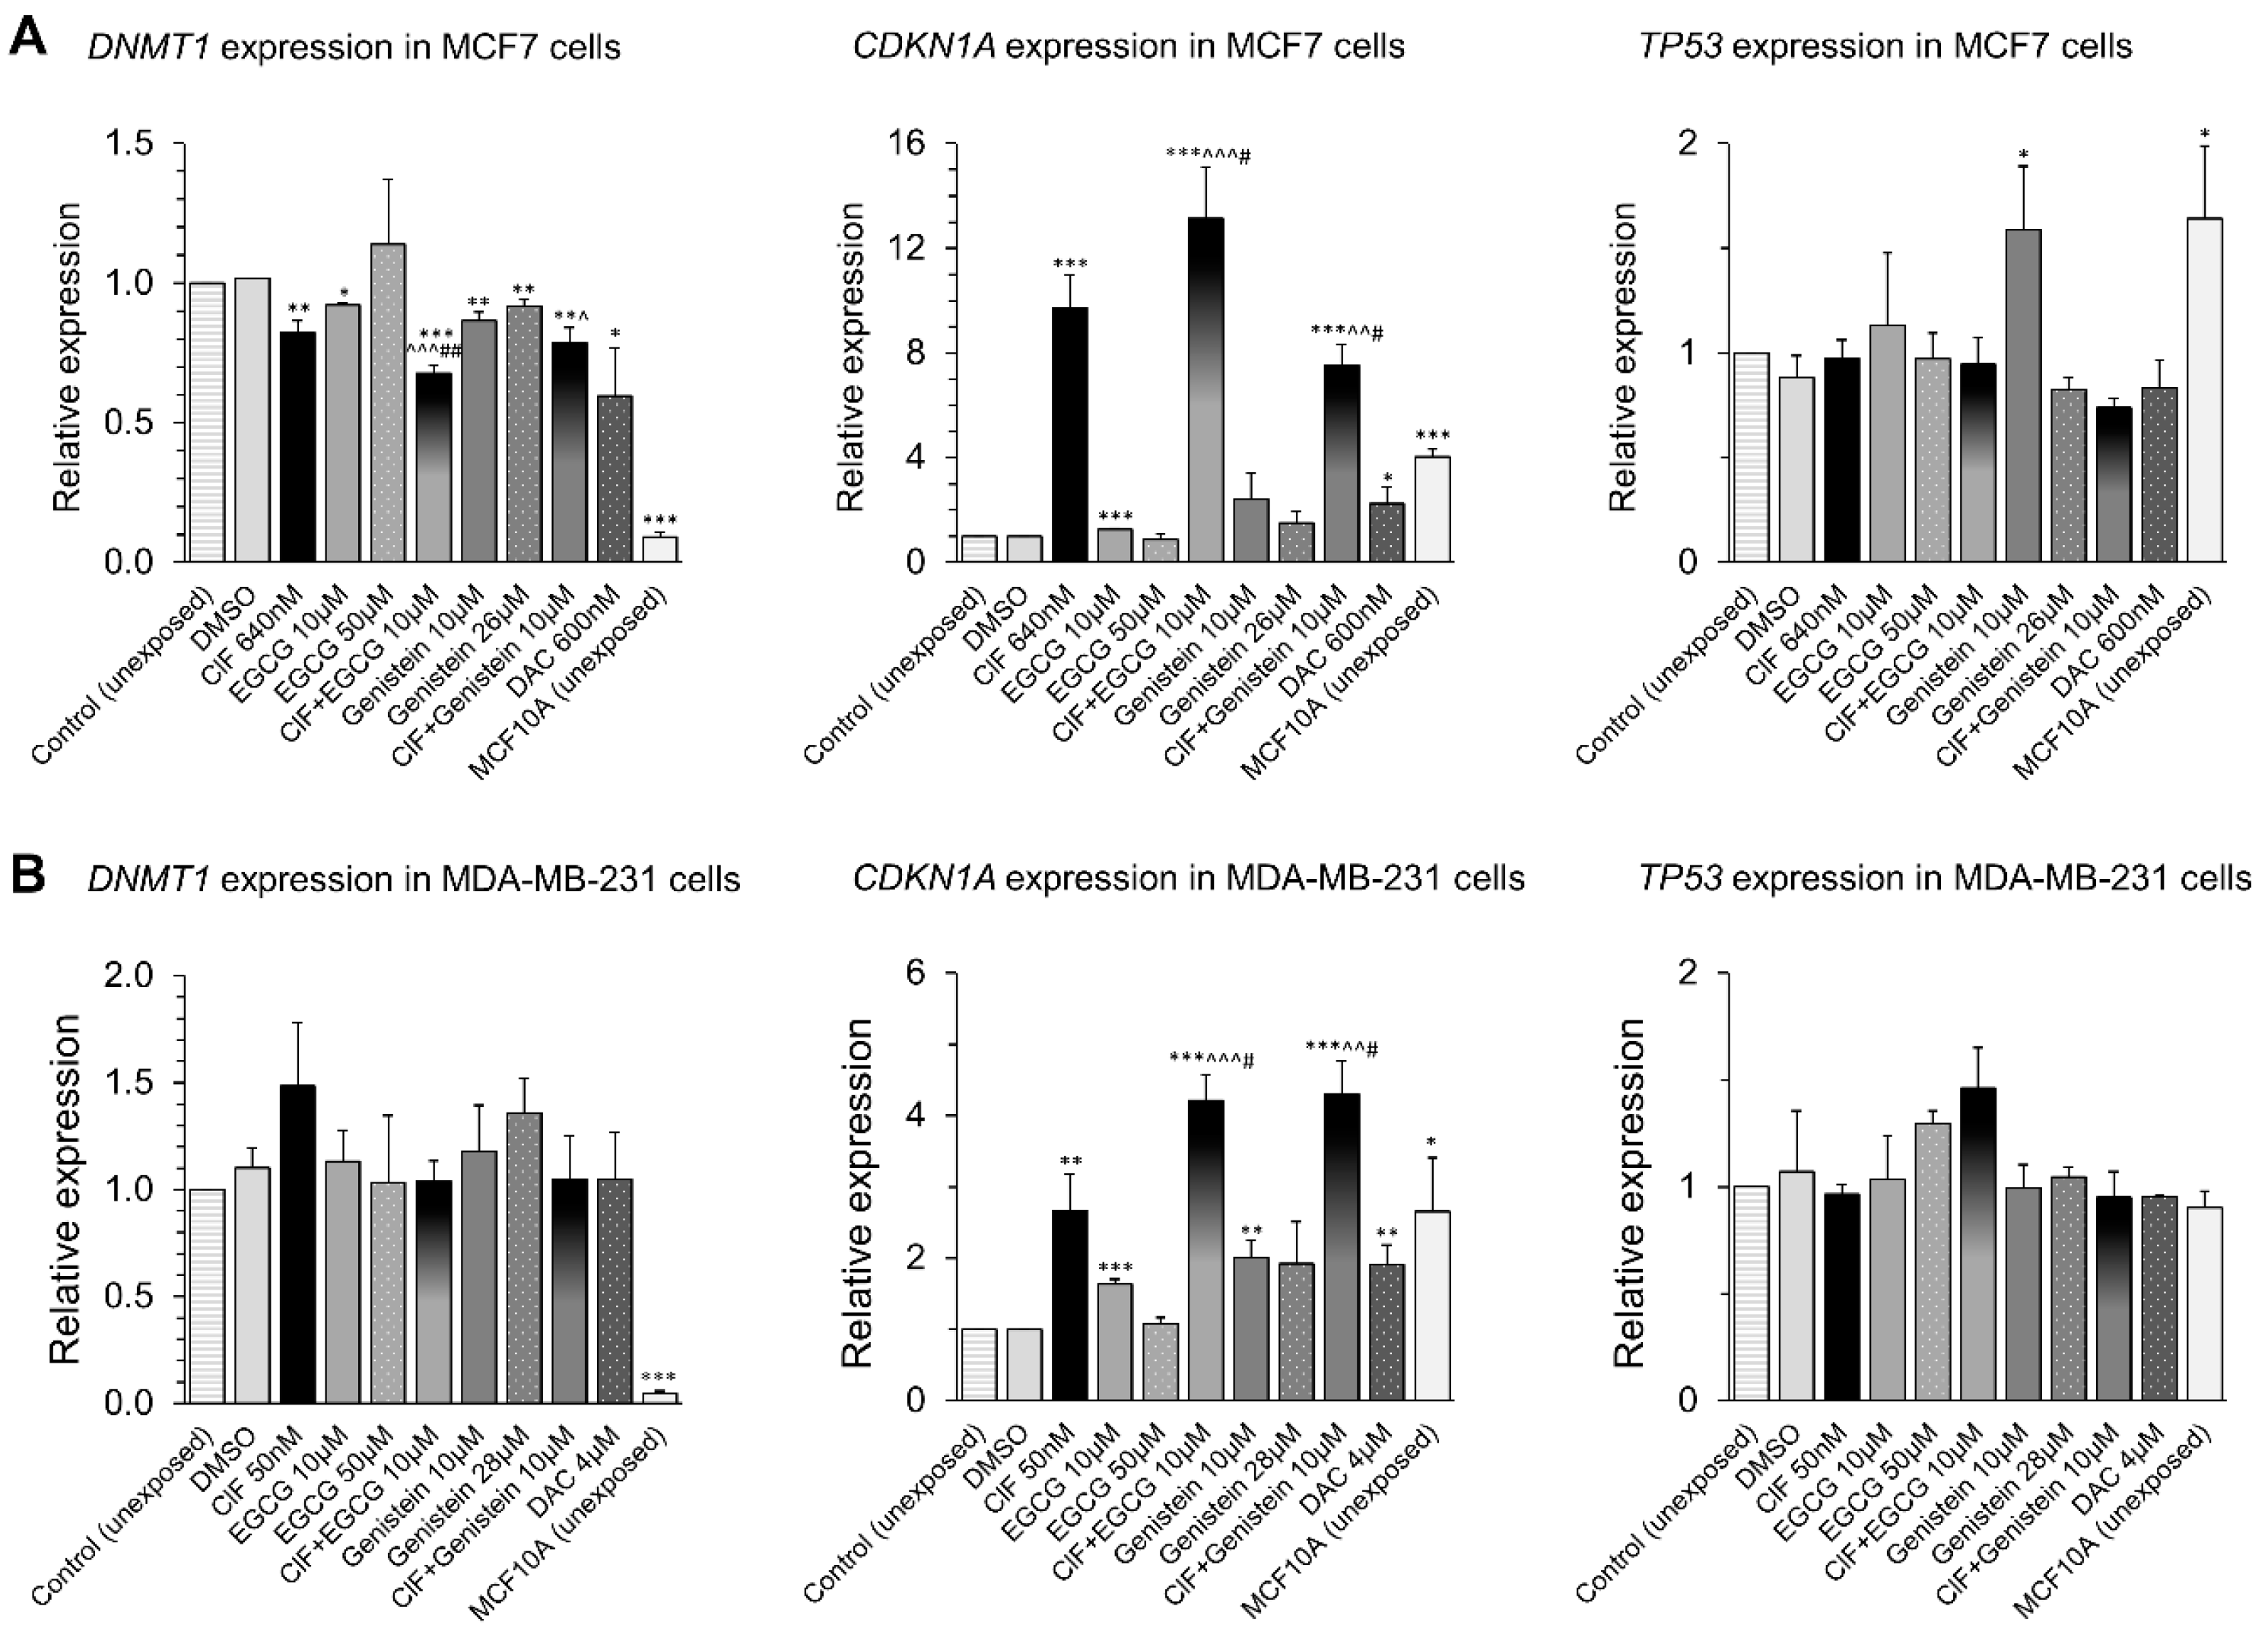
2.4. RARB Transcriptional Reactivation in Response to the ClF Combinations with Polyphenols Is Associated with Robust CDKN1A Upregulation

In an effort to gain better understanding of the epigenetic mechanisms involved in the changes in RARB transcriptional activity induced by the ClF-based combinations with the tested polyphenols, we determined changes in the expression of known epigenetic modifiers, DNMT1, CDKN1A, and TP53 (Figure 5).
In MCF7 cells, both EGCG and genistein used alone at 10 µM concentration significantly increased CDKN1A expression by 1.3-fold and 2.4-fold, respectively, upon 4 days-exposure (Figure 5A, middle panel). As p53 protein encoded by TP53 tumor suppressor gene was shown to act as a transcription factor regulating CDKN1A expression [62], we also examined the effect of the tested polyphenols on TP53 expression (Figure 5, right panel). Increase in TP53 mRNA levels by almost 60% was observed only at 10 µM genistein concentration, but not at higher concentration of this polyphenol (Figure 5A, right panel). Interestingly, the higher polyphenol concentration, the lower CDKN1A induction or no significant changes were observed, which corresponded with TP53 expression. This suggests that 4 days-exposure to low dose (10 µM) genistein regulates CDKN1A transcription through p53-dependent pathway in MCF7 cells [62], and that ClF and EGCG at the tested concentration range may involve p53-independent pathway in these cells [15,55].
As both EGCG and genistein, potent DNMTs inhibitors, led to changes in DNA methylation and expression of RARB tumor suppressor gene with concomitant CDKN1A upregulation in MCF7 cells, we expected to detect significant changes in DNMT1 expression (Figure 5A, left panel). We observed that 4 days-exposure to EGCG and genistein used alone cause significant 10% and 13% decrease in DNMT1 transcript level mostly at 10 µM concentration, which is consistent with changes in CDKN1A expression upon these exposures (Figure 5A). ClF and DAC used alone led to significant 20% and 40% DNMT1 downregulation in MCF7 cells, although not reaching the DNMT1 expression level determined in unexposed non-malignant (normal-like) MCF10A cells (Figure 5A).
When MCF7 cells were exposed to ClF in combination with EGCG, the effect on CDKN1A expression increased as compared to ClF alone, from 9.7-fold change after ClF alone to 13.1-fold change upon ClF + EGCG exposure, that was associated with enhanced DNMT1 downregulation by another 14% compared to ClF alone (Figure 5A, middle panel). Surprisingly, despite of relevant 10 µM genistein-mediated changes in CDKN1A and TP53 expression, 20% reduction in DNMT1 transcript level detected in ClF exposed cells was maintained and not enhanced upon the combinatorial administration (Figure 5A).
In MDA-MB-231 cells that express mutant p53, both EGCG and genistein used alone, only at 10 µM concentrations significantly increased CDKN1A expression by 60% and 100%, respectively (Figure 5B, middle panel), suggesting regulation of p53-independent pathway. Similarly to MCF7 cells, CDKN1A up-regulation was less profound when the polyphenols were used at higher concentrations (50 µM EGCG and 28 µM genistein) (Figure 5A, middle panel). Concomitantly, no suppression of DNMT1 transcription was observed with a slight tendency for mRNA to increase at higher genistein dose as well as ClF used alone (Figure 5B, left panel).
The combinations of ClF and polyphenols in MDA-MB-231 cells resulted in over 4-fold induction of CDKN1A whereas exposure to ClF alone caused only 2.7-fold upregulation (Figure 5B, middle panel). It strongly suggests that the tested polyphenols and ClF are involved in regulation of CDKN1A through p53-independent pathway, presumably affecting the same elements of the pathway. As no significant alterations in DNMT1 expression has been observed upon combinatorial exposures in MDA-MB-231 cells, it may suggest the involvement of another regulatory mechanisms of DNA methylation reaction.
Noticeably, the CDKN1A expression rises observed upon combinatorial exposures both in MCF7 and MDA-MB-231 cells, not only altered “cancer-specific” CDKN1A expression states towards “normal-like” CDKN1A expression levels determined in MCF10A cells, but even 2–3 times exceeded the “normal-like” CDKN1A expression pattern (Figure 4). As CDKN1A gene encodes p21 protein that competes with DNMT1 for the same binding site on PCNA during DNA replication, it can disturb in DNMT1/PCNA complex formation and affect DNMT1 activity and the rate of DNA methylation reaction [42,43] (Figure 6).

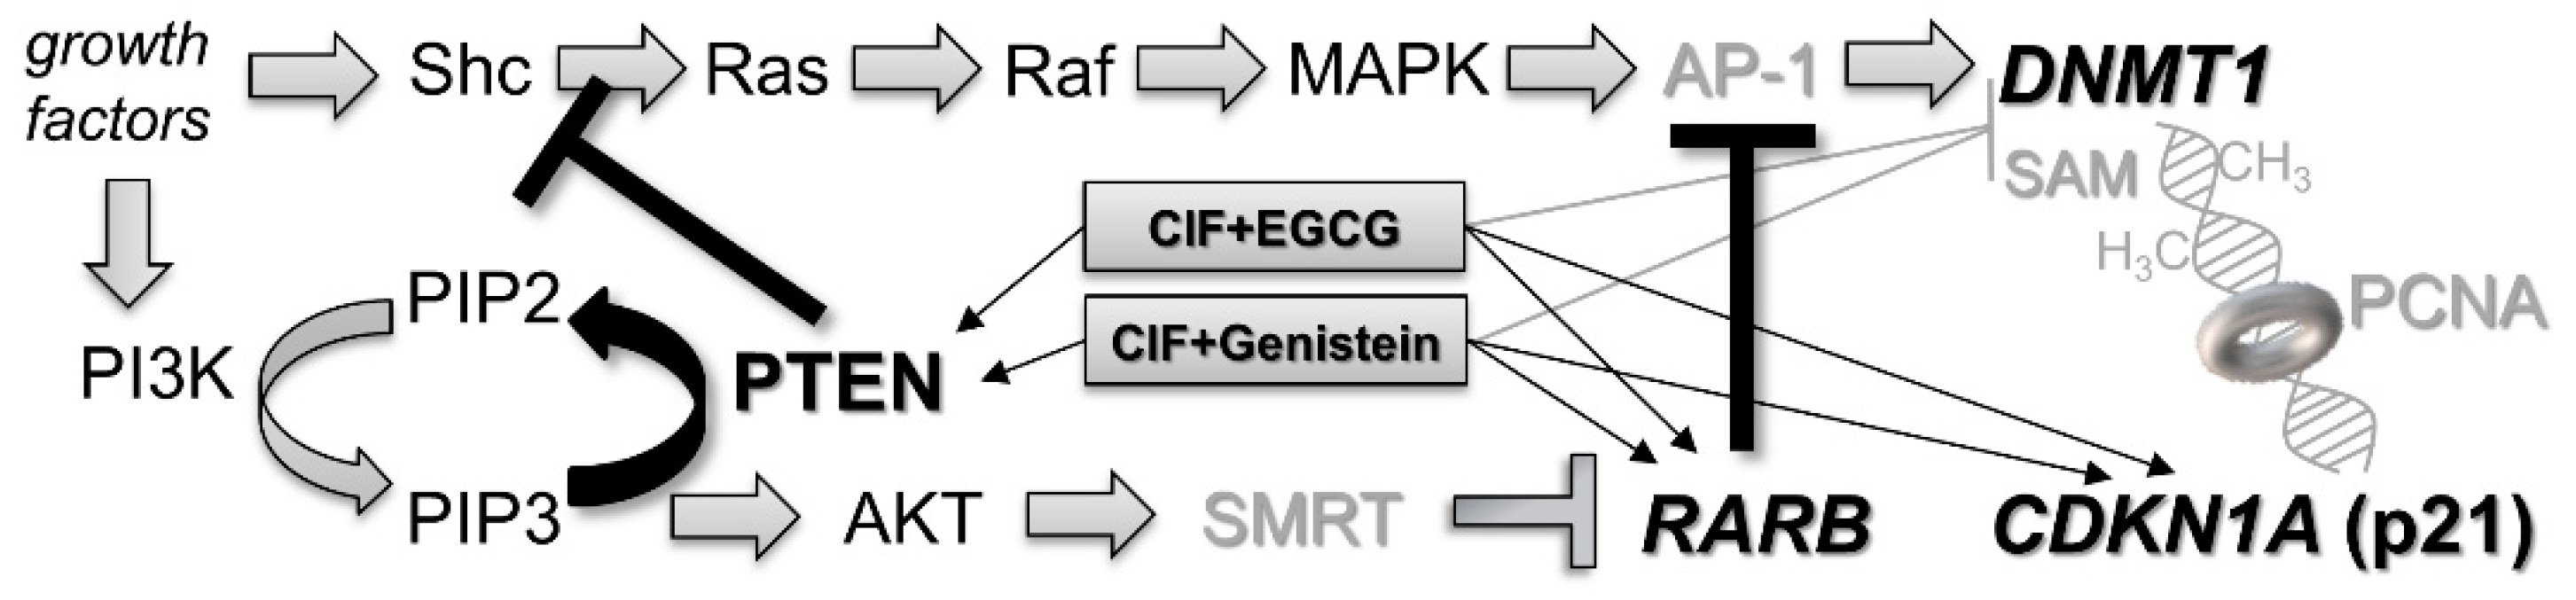
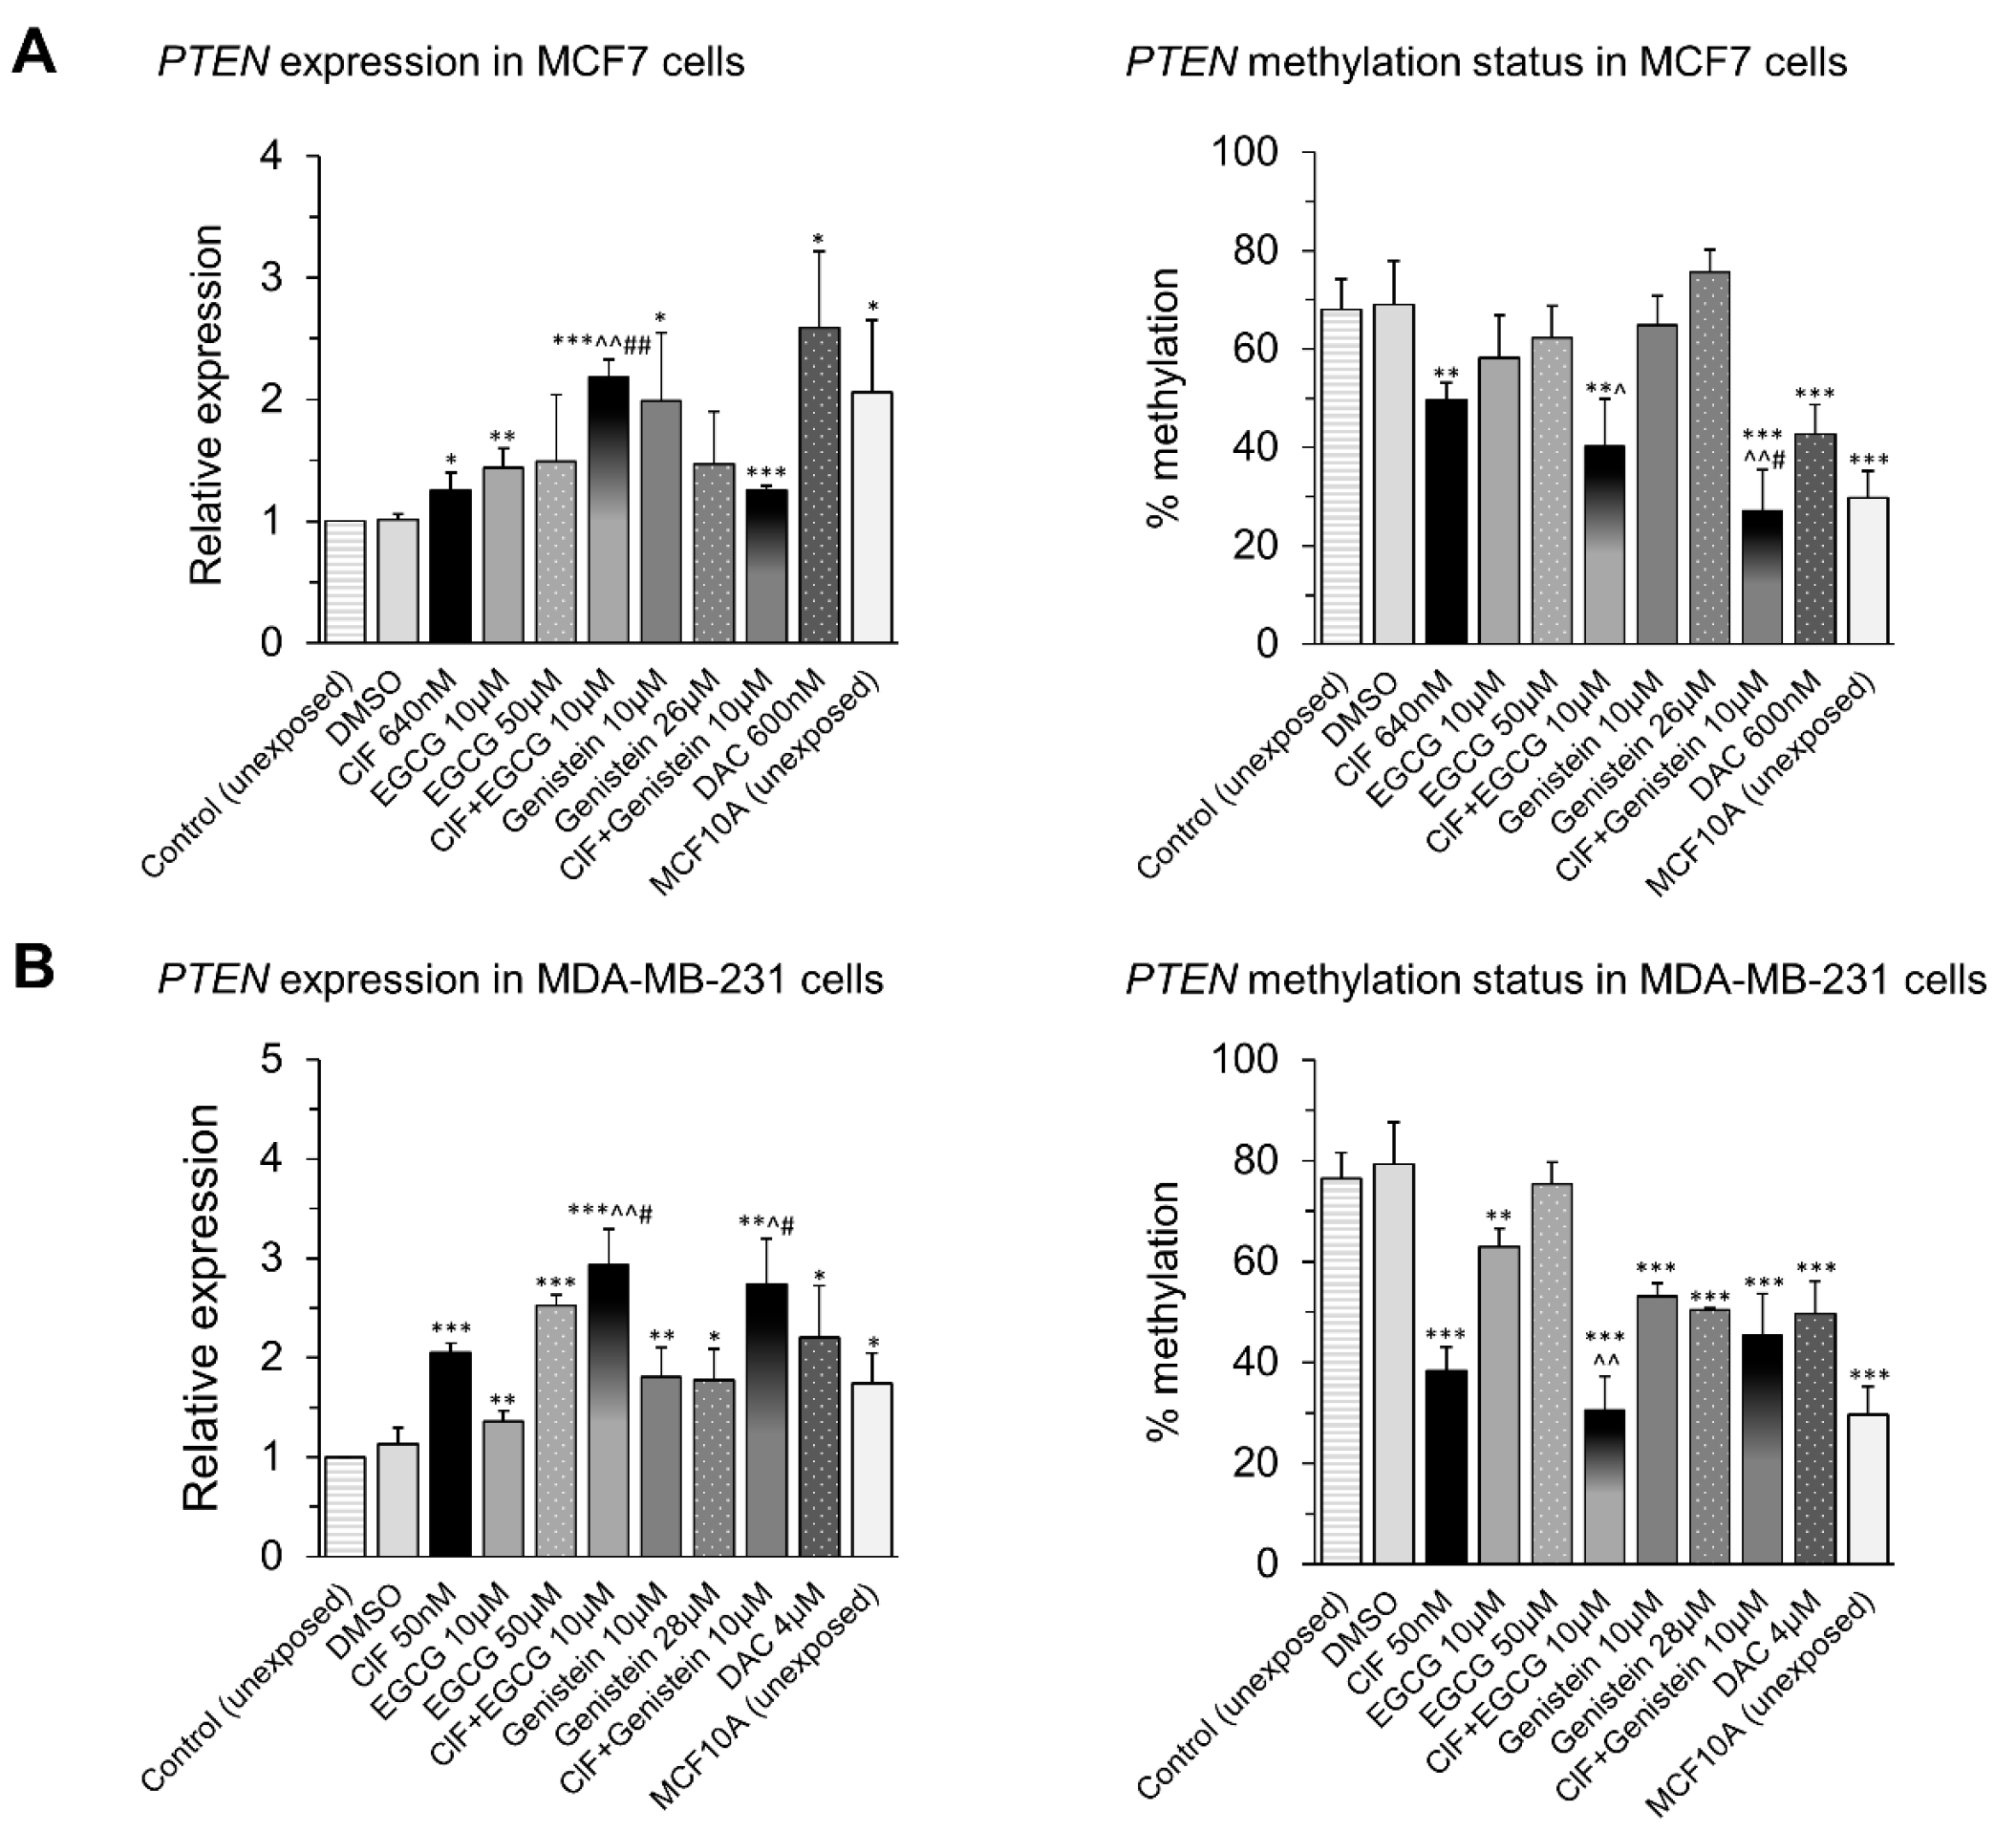
2.5. PTEN Upregulation upon Combinatorial Exposures Is Partly Involved in Robust RARB Transcriptional Reactivation

As in both MCF7 and MDA-MB-231, the robust effect on RARB expression upon combinatorial ClF + EGCG and ClF + Genistein exposures does not coincide with enhancement of hypomethylation level within RARB promoter (Figure 4), it may suggest the involvement of another mechanisms in the combinatorial effects on RARB transcription.
One of the possible mechanisms is downregulation of PI3K/AKT signaling pathway by PTEN. PTEN, a dual specificity phosphatidyl inositol triphosphate (PIP3) phosphatase, antagonizes AKT signaling, causing diminished AKT-mediated phosphorylation and activity of its downstream effector, corepressor mediator for retinoic and thyroid hormone receptors (SMRT). It blocks recruitment of SMRT to RARB promoter, increases histone H3 and H4 acetylation, and finally stimulates RARB expression [34] (Figure 6). Therefore, we examined mRNA and promoter methylation levels of PTEN after 4 days-incubation with the tested compounds used alone and in combinations in MCF7 and MDA-MB-231 cells (Figure 7).
Following 4 days-exposure to ClF-based combinations with polyphenols, ClF + EGCG or ClF + Genistein, in both MCF7 and MDA-MB-231 cells, we observed significant (enhanced compared to ClF used alone) PTEN upregulation that was partly associated with concomitant PTEN hypomethylation within the CpG island of its proximal promoter region (CpG site, -149 bp from TSS) [24,25], especially in the case of ClF combination with EGCG (Figure 7). The extent of changes in PTEN methylation and expression levels upon combinatorial exposures was more robust than after DAC used alone in both tested breast cancer cell lines (Figure 7). Moreover, similarly to RARB gene, the observed PTEN methylation drops and expression rises, followed by combinatorial exposures both in MCF7 and MDA-MB-231 breast cancer cells, alter “cancer-specific” PTEN methylation and expression states towards “normal-like” PTEN methylation and expression levels determined in unexposed non-malignant MCF10A cells (Figure 7). These observations indicate that enhanced PTEN reactivation may be partly responsible for robust RARB upregulation in breast cancer cells upon ClF-based combinations with EGCG or genistein (Figure 4 and Figure 7).

3. Conclusions

Upon 4 days of exposure, the combinations of ClF with EGCG or genistein caused synergistic or additive inhibition of cell growth and greater induction of apoptosis, followed by significant RARB hypomethylation with concomitant multiple increase in RARB, PTEN, and CDKN1A transcript levels, mostly in mildly malignant MCF7 breast cancer cells. Moreover, in these cells, the aforementioned observations were associated with significant DNMT1 downregulation. Our results support the role of combinatorial ClF and EGCG or genistein exposures in regulation of transcriptional activity of DNA methylation-silenced tumor suppressor genes, such as RARB and PTEN, which seem instrumental in breast cancer development.
Our current findings provide a relevant support behind the rationale to study ClF-based combinations with dietary polyphenols, such as EGCG and genistein, in more depth with regard to specific epigenetic mechanisms, including DNA methylation. Taken together, our results demonstrate the ability of ClF-based combinations with polyphenols to promote cancer cell death and reactivate DNA methylation-silenced tumor suppressor genes in human breast cancer cells with different invasive potential. We believe that further studies of combinatorial ClF and EGCG or genistein exposures may have translational significance through their potent chemopreventive activity against breast cancer.

4. Materials and Methods

4.1. Compounds

The tested nucleoside analogues, ClF and DAC, were purchased from Sigma-Aldrich (Poznan, Poland) and dissolved in water at the concentration of 1 mM. EGCG and genistein (Sigma-Aldrich, Poznan, Poland) were prepared in DMSO (Sigma-Aldrich, Poznan, Poland) (10 mM). All the solutions were stored at −20 °C.

4.2. Cell Culture

Human breast cancer cells, mildly malignant ER-positive MCF7 (ATCC HTB-22; tissue: Mammary gland, breast; derived from metastatic site: Pleural effusion; cell type: Epithelial; p53 wild-type; functional deletion in the caspase 3 (CASP3) gene) [51] and malignant ER-negative MDA-MB-231 (ECACC 92020424; tissue: Mammary gland, breast; derived from metastatic site: Pleural effusion; cell type: Epithelial; p53 mutant) were cultured according to American Type Culture Collection (ATCC, LGC Standards) and European Collection of Authenticated Cell Cultures (ECACC, Salisbury, UK) recommendations, respectively [3,4]. Non-malignant (normal-like) MCF10A cells (ATCC CRL-10317; tissue: Mammary gland, breast; cell type: Epithelial) were purchased in ATCC and cultured in basal medium, Mammary Epithelial Cell Growth Medium (MEGM) from Lonza AG (Warsaw, Poland) supplemented with additives from BulletKit (Lonza AG): hEGF (human epidermal growth factor), BPE (bovine pituitary extract), hydrocortisone, and human recombinant insulin. According to ATCC protocol, the gentamycin-amphotericin B mix provided with the kit has not been used in MCF10A cell culture. To prepare the complete growth medium, we added 1 U/mL 1 penicillin, 1 μg/mL 1 streptomycin (Gibco, Scotland, UK) and 100 ng/mL cholera toxin (Sigma-Aldrich, Poznan, Poland), purchased separately.
MCF7 and MDA-MB-231 cells were cultured in EMEM medium (MEM Eagle with Earle’s BSS, Lonza AG) and L15 medium (Leibovitz’s L15 medium, Lonza AG), respectively, supplemented with: 2 mM L-glutamine; 0.01 mg/mL bovine insulin (only for MCF7 cells) (Sigma-Aldrich, Poznan, Poland); 10% (and 15% for MDA-MB-231 cells) fetal bovine serum (FBS); 1 U/mL penicillin, and 1 μg/mL streptomycin (Gibco, Scotland, UK).
Cells were grown at 37 °C in a humidified atmosphere of 5% CO2, except for MDA-MB-231 cells incubated without CO2. Cells were subcultured every 3–4 days after reaching 70–80% confluency. For the experiments, MCF7, MDA-MB-231, and MCF10A cells were seeded at a low density of 22 × 103, 16 × 103, and 10 × 103/cm3, respectively. After 24 h, the tested compounds diluted in full fresh medium was added and the incubation of MCF7 and MDA-MB-231 was continued for 4 days. MCF10A human mammary epithelial cells were used as a non-malignant (normal-like) control.
MCF7 and MDA-MB-231 cells were cultured for 4 days with ClF, EGCG, and genistein at different concentrations and a dose leading to 50% inhibition of cell growth (IC50) was established (not achieved for EGCG). EGCG or genistein at 10 µM concentration reflecting physiologically relevant levels was then combined with ClF, applied at previously determined IC50 concentrations (640 nM in MCF7 and 50 nM in MDA-MB-231 cells) [3]. DMSO was used as a vehicle control at 0.1% (v/v) concentration (Figure 8). After incubations genomic DNA or total RNA were extracted and purified.
The MCF7 and MDA-MB-231 cells were also incubated with 5-aza-2′-deoxycytidine (decitabine, DAC) at IC50 concentrations previously determined as equal to 0.6 µM and 4 µM [9] (Figure 1D). This deoxycytidine analogue, acting as a potent DNMT1 inhibitor [12], was used in our studies as a reference agent (Figure 4, Figure 5 and Figure 7) and a positive control in cell viability and apoptosis assays [3,9] (Figure 1 and Figure 2).

4.3. Cell Viability and Apoptosis

Cell viability was measured by trypan blue (Sigma-Aldrich, Poznan, Poland) exclusion test and the cytostatic index (IC50) was determined. The number of viable cells after 4 days of exposure to CIF or EGCG or genistein or DAC was given as a percentage of viable cells in the vehicle control. The IC50 value represents the growth inhibitory concentration at which the compound causes 50% decrease in the number of viable cells compared with vehicle control after 4 days incubation. The number of dead cells that took up trypan blue was specified as the percentage of the total cell number. Cells were counted using Countess automated cell counter (Invitrogen, Life Technologies, Warsaw, Poland). The number of viable, necrotic, early, and late apoptotic cells was determined after 4 days compound exposure by flow cytometry analysis using annexin V/propidium iodide (PI) (FITC Annexin V Apoptosis Detection Kit, BD Pharmingen, Warsaw, Poland) staining according to the manufacturer’s protocol. Caspase-3 assay (Caspase-3 Assay Kit, BD Pharmingen, Warsaw, Poland) was performed to estimate its activity as a marker of the early stage of caspase-dependent apoptotic pathway in MDA-MB-231 cells (in MCF7 cells functional deletion in CASP3 gene) [51].

4.4. CompuSyn

The available online CompuSyn software (http://www.combosyn.com/) was used to determine the combinatorial effect of ClF and EGCG or genistein. A combination index (CI) value greater than 1 indicates antagonism, a value below 1 denotes synergism and a value at one indicates an additive effect of the compounds being tested [57].

4.5. DNA and RNA Isolation

Cellular DNA from human mammary epithelial cells was isolated after 20 h incubation of a cell lysate with proteinase K followed by extraction using phenol:chloroform:isoamyl alcohol (25:24:1) mixture (Sigma-Aldrich, Poznan, Poland) according to the manufacturer’s protocol. Pure DNA was resuspended in TE buffer and stored at −20 °C. Total RNA from cells was isolated using TRIZOL (Invitrogen, Life Technologies, Carlsbad, CA, USA) according to the manufacturer’s protocol. Isolated RNA was resuspended in water containing 1% DEPC (ribonuclease inhibitor) and stored at −70 °C.

4.6. Methylation-Sensitive Restriction Analysis (MSRA)

Methylation status of RARB and PTEN proximal promoter regions in MCF7, MDA-MB-231, and MCF10A mammary epithelial cells was estimated using methylation-sensitive restriction analysis (MSRA) according to Iwase’s method [63]. Genomic DNA (0.5 μg) isolated from control (unexposed) and exposed cells was incubated at 37 °C overnight with HpaII (20U) restriction enzyme (Fermentas, Vilnius, Lithuania) recognizing non-methylated C↓CGG sequence in RARB [22,23] and PTEN [24,25] promoter fragments. Specific promoter fragments were chosen for methylation analysis taking into consideration literature data, the analysis of promoter regions using CpGplot software (version r6, London, UK) [64], as well as the analysis of publicly available Illumina 450K data (GSE66695), which indicated the key role of these fragments in regulation of gene transcriptional activity. The fragment of RARB promoter includes two retinoic acid response elements (RAREs) and three methylation-sensitive CpG dinucleotide sequences located close to the RAREs [22]. PTEN promoter fragment encompasses one HpaII site near the binding sequence for AP-4 (activator protein-4) methylation-sensitive transcription factor [24,25]. A sample without the restriction enzyme and a sample digested with MspI (Fermentas) were incubated in the same conditions, and used as controls of digestion. After incubation, control and digested DNA were amplified using primers listed in Table 2, designed using free online tool for primer design Primer3 [65,66]. The reaction mixture for polymerase chain reaction (PCR) was prepared as described previously [10] and carried out in Tpersonal Thermal Cycler (Biometra, Goettingen, Germany) at 95 °C for 5 min, cycled 30 times for 1 min at 94 °C, 1 min at annealing temperature (Table 2) and 1 min at 70 °C, followed by 10 min extension at 72 °C. The amplified PCR products were fractioned on a 6% polyacrylamide gel, stained with ethidium bromide and visualised under UV illumination. Densitometry analysis of band intensity was performed using the QuantityOne software (Bio-Rad Laboratories Ltd., Watford, UK). Methylation level in each sample was expressed as a percentage of undigested DNA after comparison of band intensities for digested and undigested DNA from the same sample. Our assays did not include promoter methylation analysis of DNMT1, CDKN1A, and TP53. According to literature data, other epigenetic modifications and non-epigenetic mechanisms might be involved in regulation of transcriptional activity of these genes in breast tumors [33,67,68,69].

4.7. Quantitative Real-Time PCR (qPCR)

cDNA was synthesized using 2 μg of total RNA, 6 μL of random hexamers, 5 μL of oligo(dT)15, and ImProm-II reverse transcriptase (Promega, Mannheim, Germany). The mixture was incubated at 70 °C for 10 min and then reaction with ImProm-II reverse transcriptase (Promega, Mannheim, Germany) was conducted according to the manufacturer’s protocol. The samples were incubated under the following conditions: 5 min at 25 °C, 60 min at 42 °C, and 15 min at 70 °C. cDNA was stored at −20 °C. qPCR was carried out in the Rotor-Gene TG-3000 (Corbett Research, Sydney, Australia). The single reaction mixture contained the following: 2 μL of 10× PCR buffer (100 mM-Tris-HCl, pH 9.0; 500 mM-KCl; 1% Triton X-100), 2 mM MgCl2 (Promega, Mannheim, Germany), deoxyribonucleotide triphosphate mix (200 mM each; Promega, Mannheim, Germany), forward and reverse primers (200 nM each; IBB, Warsaw, Poland), 1 μL of 20× EvaGreen fluorescence dye (Biotium, Hayward, CA, USA), two units of Taq polymerase (Promega, Mannheim, Germany), and 1 μL of cDNA in a final volume of 20 μL [3]. The reaction mixture comprised primers listed in Table 3 that were designed using Primer3 (Cambridge, MA, USA) [65,66]. For expression analysis of RARB and PTEN, as well as DNMT1, CDKN1A, and TP53, the primers were established so that they overlapped splice junction, thereby avoiding the potential amplification of genomic DNA.
After an initial 2 min denaturation step at 94 °C, amplification consisted of fifty cycles was performed under the following conditions: 30 s at 94 °C, 15 s at annealing temperature (Table 3), and 30 s elongation at 72 °C. The relative expression of each tested gene was normalized to the geometric mean of three housekeeping genes, H3F3A (H3 histone family 3A), RPLP0 (60S acidic ribosomal protein P0), and RPS17 (40S ribosomal protein S17) [3], according to Pfaffl’s method [70].This combination of genes showed the most stable reference in previous reports [3,4,6,10,11,54,71,72].

4.8. Statistical Analysis

Statistical analysis of cell viability, apoptosis, MSRA, and qPCR assays was performed using the unpaired t-test with two-tailed distribution. Each value represents the mean ± SD of three independent experiments. The results were considered statistically significant when p < 0.05.

Author Contributions

K.L. and K.F.-M. conceived and designed the study; K.L. performed the experiments; A. K.-S. was involved in cell viability and apoptosis experiments, and B.C.-O. was involved in flow cytometry analysis; K.L. analyzed the data and wrote the manuscript; K.F.-M., J.S. and P.S. reviewed it. All the Authors reviewed and approved the final manuscript.

Funding

This research was funded by The National Science Centre in Poland, grant number DEC-2011/01/N/NZ2/01697, and partly by Medical University of Lodz, grant numbers 503/6-099-01/503-61-001, and 502-03/6-099-01/502-64-133, granted to Department of Biomedical Chemistry (Faculty of Health Sciences, Medical University of Lodz, Lodz Poland).

Acknowledgments

We would like to acknowledge the lab members of Department of Medical Biochemistry of Medical University of Lodz for their advice, help and support.

Conflicts of Interest

The authors declare no conflict of interest.

Abbreviations

ClFClofarabine, 2-chloro-2′-fluoro-2′-deoxyarabinosylade
DACDecitabine, 5-aza-2′-deoxycytidine
EGCG(−)-Epigallocatechin gallate

References

  1. Bray, F.; Ferlay, J.; Soerjomataram, I.; Siegel, R.L.; Torre, L.A.; Jemal, A. Global cancer statistics 2018: GLOBOCAN estimates of incidence and mortality worldwide for 36 cancers in 185 countries. CA Cancer J. Clin. 2018. [Google Scholar] [CrossRef] [PubMed]
  2. Danaei, G.; Vander Hoorn, S.; Lopez, A.D.; Murray, C.J.; Ezzati, M.; Comparative Risk Assessment collaborating group (Cancers). Causes of cancer in the world: Comparative risk assessment of nine behavioural and environmental risk factors. Lancet 2005, 366, 1784–1793. [Google Scholar] [CrossRef]
  3. Lubecka-Pietruszewska, K.; Kaufman-Szymczyk, A.; Stefanska, B.; Cebula-Obrzut, B.; Smolewski, P.; Fabianowska-Majewska, K. Clofarabine, a novel adenosine analogue, reactivates DNA methylation-silenced tumour suppressor genes and inhibits cell growth in breast cancer cells. Eur. J. Pharmacol. 2014, 723, 276–287. [Google Scholar] [CrossRef] [PubMed]
  4. Lubecka-Pietruszewska, K.; Kaufman-Szymczyk, A.; Stefanska, B.; Cebula-Obrzut, B.; Smolewski, P.; Fabianowska-Majewska, K. Sulforaphane alone and in combination with clofarabine epigenetically regulates the expression of DNA methylation-silenced tumour suppressor genes in human breast cancer cells. J. Nutrigenet. Nutrigenom. 2015, 8, 91–101. [Google Scholar] [CrossRef]
  5. Cheishvili, D.; Stefanska, B.; Yi, C.; Li, C.C.; Yu, P.; Arakelian, A.; Tanvir, I.; Khan, H.A.; Rabbani, S.; Szyf, M. A common promoter hypomethylation signature in invasive breast, liver and prostate cancer cell lines reveals novel targets involved in cancer invasiveness. Oncotarget 2015, 6, 33253–33268. [Google Scholar] [CrossRef] [PubMed] [Green Version]
  6. Lubecka, K.; Kaufman-Szymczyk, A.; Fabianowska-Majewska, K. Inhibition of breast cancer cell growth by the combination of clofarabine and sulforaphane involves epigenetically mediated CDKN2A upregulation. Nucleosides Nucleotides Nucleic Acids 2018, 37, 280–289. [Google Scholar] [CrossRef] [PubMed]
  7. Lubecka, K.; Kurzava, L.; Flower, K.; Buvala, H.; Zhang, H.; Teegarden, D.; Camarillo, I.; Suderman, M.; Kuang, S.; Andrisani, O.; et al. Stilbenoids remodel the DNA methylation patterns in breast cancer cells and inhibit oncogenic NOTCH signaling through epigenetic regulation of MAML2 transcriptional activity. Carcinogenesis 2016, 37, 656–668. [Google Scholar] [CrossRef] [PubMed] [Green Version]
  8. Krawczyk, B.; Fabianowska-Majewska, K. Alteration of DNA methylation status in K562 and MCF-7 cancer cell lines by nucleoside analogues. Nucleosides Nucleotides Nucleic Acids 2006, 25, 1029–1032. [Google Scholar] [CrossRef]
  9. Krawczyk, B.; Rudnicka, K.; Fabianowska-Majewska, K. The effects of nucleoside analogues on promoter methylation of selected tumor suppressor genes in MCF-7 and MDA-MB-231 breast cancer cell lines. Nucleosides Nucleotides Nucleic Acids 2007, 26, 1043–1046. [Google Scholar] [CrossRef]
  10. Stefanska, B.; Rudnicka, K.; Bednarek, A.; Fabianowska-Majewska, K. Hypomethylation and induction of retinoic acid receptor beta 2 by concurrent action of adenosine analogues and natural compounds in breast cancer cells. Eur. J. Pharmacol. 2010, 638, 47–53. [Google Scholar] [CrossRef] [PubMed]
  11. Stefanska, B.; Salamé, P.; Bednarek, A.; Fabianowska-Majewska, K. Comparative effects of retinoic acid, vitamin D and resveratrol alone and in combination with adenosine analogues on methylation and expression of phosphatase and tensin homologue tumour suppressor gene in breast cancer cells. Br. J. Nutr. 2012, 107, 781–790. [Google Scholar] [CrossRef] [PubMed]
  12. Christman, J.K. 5-Azacytidine and 5-aza-2′-deoxycytidine as inhibitors of DNA methylation: Mechanistic studies and their implications for cancer therapy. Oncogene 2002, 21, 5483–5495. [Google Scholar] [CrossRef] [PubMed]
  13. Faderl, S.; Gandhi, V.; Keating, M.J.; Jeha, S.; Plunkett, W.; Kantarjian, H.M. The role of clofarabine in hematologic and solid malignancies--development of a next-generation nucleoside analog. Cancer 2005, 103, 1985–1995. [Google Scholar] [CrossRef] [PubMed]
  14. Majda, K.; Kaufman-Szymczyk, A.; Lubecka-Pietruszewska, K.; Bednarek, A.; Fabianowska-Majewska, K. Influence of clofarabine on transcriptional activity of PTEN, APC, RARB2, ZAP70 genes in K562 cells. Anticancer Res. 2010, 30, 4601–4606. [Google Scholar] [PubMed]
  15. Majda, K.; Lubecka, K.; Kaufman-Szymczyk, A.; Fabianowska-Majewska, K. Clofarabine (2-chloro-2′-fluoro-2′-deoxyarabinosyladenine)-biochemical aspects of anticancer activity. Acta Pol. Pharm. 2011, 68, 459–466. [Google Scholar]
  16. Mannargudi, M.B.; Deb, S. Clinical pharmacology and clinical trials of ribonucleotide reductase inhibitors: Is it a viable cancer therapy? J. Cancer Res. Clin. Oncol. 2017, 143, 1499–1529. [Google Scholar] [CrossRef]
  17. Linnekamp, J.F.; Butter, R.; Spijker, R.; Medema, J.P.; van Laarhoven, H.W.M. Clinical and biological effects of demethylating agents on solid tumours—A systematic review. Cancer Treat. Rev. 2017, 54, 10–23. [Google Scholar] [CrossRef]
  18. Warzocha, K.; Fabianowska-Majewska, K.; Błoński, J.; Krakowski, E.; Robak, T. 2-chloro-deoxyadenosine inhibits activity of adenosine deaminase and S-adenosylhomocysteine hydrolase in patients with chronic lymphocytic leukemia. Eur. J. Cancer 1997, 33, 170–173. [Google Scholar] [CrossRef]
  19. Chiang, P.K. Biological effects of inhibitors of S-adenosylhomocysteine hydrolase. Pharmacol. Ther. 1998, 77, 115–134. [Google Scholar] [CrossRef]
  20. Fabianowska-Majewska, K.; Ruckemann, K.; Duley, J.A.; Simmonds, H.A. Effect of cladribine, fludarabine, and 5-aza-deoxycytidine on S-adenosylmethionine (SAM) and nucleotides pools in stimulated human lymphocytes. Adv. Exp. Med. Biol. 1998, 431, 531–535. [Google Scholar]
  21. Wyczechowska, D.; Fabianowska-Majewska, K. The effects of cladribine and fludarabine on DNA methylation in K562 cells. Biochem. Pharmacol. 2003, 65, 219–225. [Google Scholar] [CrossRef]
  22. Arapshian, A.; Kuppumbatti, Y.S.; Mira-y-Lopez, R. Methylation of conserved CpG sites neighboring the beta retinoic acid response element may mediate retinoic acid receptor beta gene silencing in MCF-7 breast cancer cells. Oncogene 2000, 19, 4066–4070. [Google Scholar] [CrossRef] [PubMed] [Green Version]
  23. Widschwendter, M.; Berger, M.; Hermann, M.; Müller, H.M.; Amberger, A.; Zeschnigk, M.; Widschwendter, A.; Abendstein, B.; Zeimet, A.G.; Daxenbichler, G.; et al. Methylation and silencing of the retinoic acid receptor-beta2 gene in breast cancer. J. Natl. Cancer Inst. 2000, 92, 826–832. [Google Scholar] [CrossRef] [PubMed]
  24. García, J.M.; Silva, J.; Peña, C.; Garcia, V.; Rodríguez, R.; Cruz, M.A.; Cantos, B.; Provencio, M.; España, P.; Bonilla, F. Promoter methylation of the PTEN gene is a common molecular change in breast cancer. Genes Chromosomes Cancer 2004, 41, 117–124. [Google Scholar] [CrossRef] [PubMed]
  25. Khan, S.; Kumagai, T.; Vora, J.; Bose, N.; Sehgal, I.; Koeffler, P.H.; Bose, S. PTEN promoter is methylated in a proportion of invasive breast cancers. Int. J. Cancer 2004, 112, 407–410. [Google Scholar] [CrossRef] [PubMed]
  26. Connolly, R.; Stearns, V. Epigenetics as a Therapeutic Target in Breast Cancer. J. Mammary Gland Biol. Neoplasia 2012, 17, 191–204. [Google Scholar] [CrossRef] [PubMed] [Green Version]
  27. Alvarez, S.; Germain, P.; Alvarez, R.; Rodríguez-Barrios, F.; Gronemeyer, H.; de Lera, A.R. Structure, function and modulation of retinoic acid receptor beta, a tumor suppressor. Int. J. Biochem. Cell Biol. 2007, 39, 1406–1415. [Google Scholar] [CrossRef]
  28. Lin, F.; Xiao, D.; Kolluri, S.K.; Zhang, X. Unique anti-activator protein-1 activity of retinoic acid receptor beta. Cancer Res. 2000, 60, 3271–3280. [Google Scholar]
  29. Yang, L.; Kim, H.T.; Munoz-Medellin, D.; Reddy, P.; Brown, P.H. Induction of retinoid resistance in breast cancer cells by overexpression of cJun. Cancer Res. 1997, 57, 4652–4661. [Google Scholar]
  30. Cantley, L.C.; Neel, B.G. New insights into tumor suppression: PTEN suppresses tumor formation by restraining the phosphoinositide 3-kinase/Akt pathway. Proc. Natl. Acad. Sci. USA 1999, 96, 4240–4245. [Google Scholar] [CrossRef]
  31. Gu, J.; Tamura, M.; Yamada, K.M. Tumor suppressor PTEN inhibits integrin- and growth factor-mediated mitogen-activated protein (MAP) kinase signaling pathways. J. Cell Biol. 1998, 143, 1375–1383. [Google Scholar] [CrossRef] [PubMed]
  32. Bigey, P.; Ramchandani, S.; Theberge, J.; Araujo, F.D.; Szyf, M. Transcriptional regulation of the human DNA Methyltransferase (DNMT1) gene. Gene 2000, 242, 407–418. [Google Scholar] [CrossRef]
  33. Qin, W.; Leonhardt, H.; Pichler, G. Regulation of DNA methyltransferase 1 by interactions and modifications. Nucleus 2011, 2, 392–402. [Google Scholar] [CrossRef] [PubMed] [Green Version]
  34. Lefebvre, B.; Brand, C.; Flajollet, S.; Lefebvre, P. Down-regulation of the tumour suppressor gene retinoic acid receptor beta2 through the phosphoinisitide 3- knase/Akt signaling pathway. Mol. Endocrinol. 2006, 20, 2109–2121. [Google Scholar] [CrossRef] [PubMed]
  35. Li, Y.; Buckhaults, P.; Cui, X.; Tollefsbol, T.O. Combinatorial epigenetic mechanisms and efficacy of early breast cancer inhibition by nutritive botanicals. Epigenomics 2016, 8, 1019–1037. [Google Scholar] [CrossRef] [PubMed]
  36. Gao, Y.; Tollefsbol, T.O. Combinational Proanthocyanidins and Resveratrol Synergistically Inhibit Human Breast Cancer Cells and Impact Epigenetic⁻Mediating Machinery. Int. J. Mol. Sci. 2018, 19, 2204. [Google Scholar] [CrossRef] [PubMed]
  37. Ateeq, B.; Unterberger, A.; Szyf, M.; Rabbani, S.A. Pharmacological inhibition of DNA methylation induces proinvasive and prometastatic genes in vitro and in vivo. Neoplasia 2008, 10, 266–278. [Google Scholar] [CrossRef]
  38. Khan, S.I.; Aumsuwan, P.; Khan, I.A.; Walker, L.A.; Dasmahapatra, A.K. Epigenetic events associated with breast cancer and their prevention by dietary components targeting the epigenome. Chem. Res. Toxicol. 2012, 25, 61–73. [Google Scholar] [CrossRef]
  39. Lacroix, M.; Toillon, R.A.; Leclercq, G. p53 and breast cancer, an update. Endocr. Relat. Cancer 2006, 13, 293–325. [Google Scholar] [CrossRef] [Green Version]
  40. Mirzayans, R.; Andrais, B.; Scott, A.; Murray, D. New insights into p53 signaling and cancer cell response to DNA damage: Implications for cancer therapy. J. Biomed. Biotechnol. 2012, 170325. [Google Scholar] [CrossRef]
  41. Peterson, E.J.; Bögler, O.; Taylor, S.M. p53-mediated repression of DNA methyltransferase 1 expression by specific DNA binding. Cancer Res. 2003, 63, 6579–6582. [Google Scholar] [PubMed]
  42. Chuang, L.S.; Ian, H.I.; Koh, T.W.; Ng, H.H.; Xu, G.; Li, B.F. Human DNA-(cytosine-5)-methyl-transferase-PCNA complex as a target for p21WAF1. Science 1997, 277, 1996–2000. [Google Scholar] [CrossRef] [PubMed]
  43. Iida, T.; Suetake, I.; Tajima, S.; Morioka, H.; Ohta, S.; Obuse, C.; Tsurimoto, T. PCNA clamp facilitates action of DNA cytosine methyltransferase 1 on hemimethylated DNA. Genes Cells 2002, 7, 997–1007. [Google Scholar] [CrossRef] [PubMed] [Green Version]
  44. Fang, M.Z.; Chen, D.; Sun, Y.; Jin, Z.; Christman, J.K.; Yang, C.S. Reversal of hypermethylation and reactivation of p16INK4a, RARβ, and MGMT genes by genistein and other isoflavones from soy. Clin. Cancer Res. 2005, 11, 7033–7041. [Google Scholar] [CrossRef] [PubMed]
  45. Fang, M.; Chen, D.; Yang, C.S. Dietary polyphenols may affect DNA methylation. J. Nutr. 2007, 137, 223S–228S. [Google Scholar] [CrossRef] [PubMed]
  46. Lee, W.J.; Zhu, B.T. Inhibition of DNA methylation by caffeic acid and chlorogenic acid, two common catechol-containing coffee polyphenols. Carcinogenesis 2006, 27, 269–277. [Google Scholar] [CrossRef] [PubMed]
  47. Matsumura, K.; Tanaka, T.; Kawashima, H.; Nakatani, T. Involvement of the estrogen receptor beta in genistein-induced expression of p21(waf1/cip1) in PC-3 prostate cancer cells. Anticancer Res. 2008, 28, 709–714. [Google Scholar]
  48. Pethe, V.; Shekhar, P.V. Estrogen inducibility of c-Ha-ras transcription in breast cancer cells. Identification of functional estrogen-responsive transcriptional regulatory elements in exon 1/intron 1 of the c-Ha-ras gene. J. Biol. Chem. 1999, 274, 30969–30978. [Google Scholar] [CrossRef]
  49. Chung, J.H.; Ostrowski, M.C.; Romigh, T.; Minaguchi, T.; Waite, K.A.; Eng, C. The ERK1/2 pathway modulates nuclear PTEN-mediated cell cycle arrest by cyclin D1 transcriptional regulation. Hum. Mol. Genet. 2006, 15, 2553–2559. [Google Scholar] [CrossRef]
  50. Xie, Q.; Bai, Q.; Zou, L.Y.; Zhang, Q.Y.; Zhou, Y.; Chang, H.; Yi, L.; Zhu, J.D.; Mi, M.T. Genistein inhibits DNA methylation and increases expression of tumor suppressor genes in human breast cancer cells. Genes Chromosomes Cancer 2014, 53, 422–431. [Google Scholar] [CrossRef]
  51. Jänicke, R.U.; Sprengart, M.L.; Wati, M.R.; Porter, A.G. Caspase-3 is required for DNA fragmentation and morphological changes associated with apoptosis. J. Biol. Chem. 1998, 273, 9357–9360. [Google Scholar] [CrossRef] [PubMed]
  52. Geutjes, E.J.; Tian, S.; Roepman, P.; Bernards, R. Deoxycytidine kinase is overexpressed in poor outcome breast cancer and determines responsiveness to nucleoside analogs. Breast Cancer Res. Treat. 2012, 131, 809–818. [Google Scholar] [CrossRef] [PubMed]
  53. Abramczyk, H.; Surmacki, J.; Kopeć, M.; Olejnik, A.K.; Lubecka-Pietruszewska, K.; Fabianowska-Majewska, K. The role of lipid droplets and adipocytes in cancer. Raman imaging of cell cultures: MCF10A, MCF7, and MDA-MB-231 compared to adipocytes in cancerous human breast tissue. Analyst 2015, 140, 2224–2235. [Google Scholar] [CrossRef] [PubMed]
  54. Lubecka-Pietruszewska, K.; Kaufman-Szymczyk, A.; Stefanska, B.; Fabianowska-Majewska, K. Folic acid enforces DNA methylation-mediated transcriptional silencing of PTEN, APC and RARbeta2 tumour suppressor genes in breast cancer. Biochem. Biophys. Res. Commun. 2013, 430, 623–628. [Google Scholar] [CrossRef] [PubMed]
  55. Huang, C.Y.; Han, Z.; Li, X.; Xie, H.H.; Zhu, S.S. Mechanism of EGCG promoting apoptosis of MCF-7 cell line in human breast cancer. Oncol. Lett. 2017, 14, 3623–3627. [Google Scholar] [CrossRef] [PubMed] [Green Version]
  56. Hong, O.Y.; Noh, E.M.; Jang, H.Y.; Lee, Y.R.; Lee, B.K.; Jung, S.H.; Kim, J.S.; Youn, H.J. Epigallocatechin gallate inhibits the growth of MDA-MB-231 breast cancer cells via inactivation of the β-catenin signaling pathway. Oncol. Lett. 2017, 14, 441–446. [Google Scholar] [CrossRef] [PubMed] [Green Version]
  57. Chou, T.C. Preclinical versus clinical drug combination studies. Leuk. Lymphoma 2008, 49, 2059–2080. [Google Scholar] [CrossRef]
  58. Xu, J.; Loo, G. Different effects of genistein on molecular markers related to apoptosis in two phenotypically dissimilar breast cancer cell lines. J. Cell Biochem. 2001, 82, 78–88. [Google Scholar] [CrossRef]
  59. Khan, M.A.; Hussain, A.; Sundaram, M.K.; Alalami, U.; Gunasekera, D.; Ramesh, L.; Hamza, A.; Quraishi, U. (−)-Epigallocatechin-3-gallate reverses the expression of various tumor-suppressor genes by inhibiting DNA methyltransferases and histone deacetylases in human cervical cancer cells. Oncol. Rep. 2015, 33, 1976–1984. [Google Scholar] [CrossRef]
  60. Fang, M.Z.; Wang, Y.; Ai, N.; Hou, Z.; Sun, Y.; Lu, H.; Welsh, W.; Yang, CS. Tea polyphenol (−)-epigallocatechin-3-gallate inhibits DNA methyltransferase and reactivates methylation-silenced genes in cancer cell lines. Cancer Res. 2003, 63, 7563–7570. [Google Scholar]
  61. Sundaram, M.K.; Ansari, M.Z.; Al Mutery, A.; Ashraf, M.; Nasab, R.; Rai, S.; Rais, N.; Hussain, A. Genistein Induces Alterations of Epigenetic Modulatory Signatures in Human Cervical Cancer Cells. Anticancer Agents Med. Chem. 2018, 18, 412–421. [Google Scholar] [CrossRef] [PubMed]
  62. Saramaki, A.; Banwell, C.M.; Campbell, M.J.; Carlberg, C. Regulation of the human p21(waf1/cip1) gene promoter via multiple binding sites for p53 and the vitamin D3 receptor. Nucleic Acids Res. 2006, 34, 543–554. [Google Scholar] [CrossRef] [PubMed]
  63. Iwase, H.; Omoto, Y.; Iwata, H.; Toyama, T.; Hara, Y.; Ando, Y.; Ito, Y.; Fujii, Y.; Kobayashi, S. DNA methylation analysis at distal and proximal promoter regions of the oestrogen receptor gene in breast cancers. Br. J. Cancer 1999, 80, 1982–1986. [Google Scholar] [CrossRef] [PubMed] [Green Version]
  64. Larsen, F.; Gundersen, G.; Lopez, R.; Prydz, H. CpG islands as gene markers in the human genome. Genomics 1992, 13, 1095–1107. [Google Scholar] [CrossRef]
  65. Koressaar, T.; Remm, M. Enhancements and modifications of primer design program Primer3. Bioinformatics 2007, 23, 1289–1291. [Google Scholar] [CrossRef] [PubMed] [Green Version]
  66. Untergrasser, A.; Cutcutache, I.; Koressaar, T.; Ye, J.; Faircloth, B.C.; Remm, M.; Rozen, S.G. Primer3—New capabilities and interfaces. Nucleic Acids Res. 2012, 40, e115. [Google Scholar] [CrossRef] [PubMed]
  67. Saldaña-Meyer, R.; Recillas-Targa, F. Transcriptional and epigenetic regulation of the p53 tumor suppressor gene. Epigenetics 2011, 6, 1068–1077. [Google Scholar] [CrossRef] [Green Version]
  68. Ying, J.; Srivastava, G.; Gao, Z.; Zhang, X.; Murray, P.; Ambinder, R.; Tao, Q. Promoter hypermethylation of the cyclin-dependent kinase inhibitor (CDKI) gene p21WAF1/CIP1/SDI1 is rare in various lymphomas and carcinomas. Blood 2004, 103, 743–746. [Google Scholar] [CrossRef]
  69. Zheng, S.; Rollet, M.; Yang, K.; Pan, Y.X. A gestational low-protein diet represses p21(WAF1/Cip1) expression in the mammary gland of offspring rats through promoter histone modifications. Br. J. Nutr 2012, 108, 998–1007. [Google Scholar] [CrossRef]
  70. Pfaffl, M.W.; Horgan, G.W.; Dempfle, L. Relative expression software tool (REST©) for group-wise comparison and statistical analysis of relative expression results in real-time PCR. Nucleic Acids Res. 2002, 30, 1–10. [Google Scholar] [CrossRef]
  71. Potemski, P.; Pluciennik, E.; Bednarek, A.K.; Kusinska, R.; Kubiak, R.; Kordek, R. Evaluation of oestrogen receptor expression in breast cancer by quantification of mRNA. Histopathology 2007, 51, 829–836. [Google Scholar] [CrossRef] [PubMed]
  72. Żelazowski, M.J.; Płuciennik, E.; Pasz-Walczak, G.; Potemski, P.; Kordek, R.; Bednarek, A.K. WWOX expression in colorectal cancer--a real-time quantitative RT-PCR study. Tumour Biol. 2011, 32, 551–560. [Google Scholar] [CrossRef] [PubMed]
Figure 1. Effect of ClF (A), EGCG (B), genistein (C), and DAC (D) on MCF7 (left panel) and MDA-MB-231 (right panel) cell viability as measured by trypan blue exclusion test. MCF7 and MDA-MB-231 breast cancer cells were incubated for 4 days with the tested compounds at the indicated concentrations. The number of viable cells after 4 days exposure to ClF, genistein, and DAC at IC50 concentrations (IC50 not achieved for EGCG) was expressed as a percentage of viable cells in the vehicle control ((viable exposed/viable vehicle control)*100%). The number of dead cells in either vehicle control or exposed group was calculated as a percentage of the total cell number. DAC was used as a positive control in the trypan blue exclusion test. Values are means ± SD of at least three independent experiments. Exposure (ClF alone or EGCG alone or genistein alone or DAC alone) versus vehicle control, *** p < 0.001, ** p < 0.01, * p < 0.05.
Ijms 19 03970 g001
Figure 2. Effects of ClF (IC50) and EGCG (10 µM) or genistein (10 µM) alone and in combination on the number of alive, apoptotic and necrotic cells as well as on caspase 3 activity (only in MDA-MB-231 cells) in MCF7 (A,B) and MDA-MB-231 (C,D) cell lines. The original FACS cytograms of annexin V/propidium iodide and caspase 3 (only in MDA-MB-231 cells) assays for MCF7 (B) and MDA-MB-231 (D) cells are shown. Values are means ± S.D. of three independent experiments. Exposure versus vehicle control: *** p < 0.001, ** p < 0.01, * p < 0.05. Ct0, control cells used for experiments (time 0 h); Control (unexposed), negative control, cells incubated with medium; DAC, positive control; DMSO, vehicle control; Q1, necrotic cells (Ann−/PI+); Q2, late apoptotic cells (Ann+/PI+); Q3, viable cells (Ann −/PI−); Q4, early apoptotic cells (Ann+/PI−).
Ijms 19 03970 g002
Figure 3. Relevance of DNA methylation-mediated silencing of RARB tumor suppressor in human breast cancer in vivo. (A) A map of the RARB proximal promoter region (Human GRCh37/hg19 Assembly) including an enhancer region. The methylation-sensitive restriction analysis (MSRA)-tested CpG site (located within the enhancer region of the RARB promoter, -139 bp from transcription start site (TSS); cg06720425 on Illumina 450K microarray platform; chr3: 25469694) is depicted as a black circle, indicated with black dashed arrow. The neighboring CpG sites [-441 bp to +158 bp from TSS] covered on Illumina 450K array are depicted as gray circles. Putative transcription factor binding sites are indicated as predicted using TransFac. (B) Methylation status of these 14 CpG sites (black and gray circles on the gene map) within the RARB proximal promoter region, covered on Illumina 450K array and expressed as beta value in breast tumors based on publicly available Illumina 450K data (GSE66695). The tested CpG site, cg06720425, is indicated with black dashed arrow. Beta value, the methylation score for a specific CpG site with any values between 0 (unmethylated) and 1 (completely methylated), according to the fluorescent intensity ratio. (C) Breast cancer gene expression microarray data for RARB from Oncomine. The normal versus tumor gene expression data are presented as log2-transformed median centered per array, and SD-normalized to 1 per array. The demonstrated changes are statistically significant (P < 0.05).
Ijms 19 03970 g003
Figure 4. Effects of ClF (IC50) and EGCG (10 µM) or genistein (10 µM) alone and in combination on expression (left panel) and methylation (right panel) of RARB tumor suppressor gene in MCF7 (A) and MDA-MB-231 (B) cells. All results represent mean ± SD of three independent experiments. Exposure (ClF alone, EGCG alone, genistein alone, ClF + EGCG or ClF + Genistein) versus vehicle control, *** p < 0.001, ** p < 0.01, * p < 0.05. EGCG or genistein alone versus combinatorial exposure (ClF + EGCG or ClF + Genistein), ^^^ p < 0.001, ^^ p < 0.01, ^ p < 0.05. ClF alone versus combinatorial exposure (ClF + EGCG or ClF + Genistein), ## p < 0.01, # p < 0.05.
Ijms 19 03970 g004
Figure 5. Effects of ClF (IC50) and EGCG (10 µM) or genistein (10 µM) alone and in combination on expression of modifiers of DNA methylation reaction, DNMT1, CDKN1A, and TP53, in MCF7 (A) and MDA-MB-231 (B) cells. All results represent mean ± SD of three independent experiments. Exposure (ClF alone, EGCG alone, genistein alone, ClF + EGCG or ClF + Genistein) versus vehicle control, *** p < 0.001, ** p < 0.01, * p < 0.05. EGCG or genistein alone versus combinatorial exposure (ClF + EGCG or ClF + Genistein), ^^^ p < 0.001, ^^ p < 0.01, ^ p < 0.05. ClF alone versus combinatorial exposure (ClF + EGCG or ClF + Genistein), ## p < 0.01, # p < 0.05.
Ijms 19 03970 g005
Figure 6. The potential repressive effects of the tested combinatorial exposures of ClF with EGCG or genistein on modulation of DNMT1 transcription and/or activity in breast cancer cells. Implications of RARB and PTEN-mediated negative regulation of intracellular oncogenic signaling pathways, including MAPK/AP-1 and PI3K/AKT. A competition of CDKN1A (p21) with DNMT1 for the same binding site on PCNA. Shc, SH2-containing collagen-related proteins; MAPK, mitogen-activated protein kinase; AP-1, activator protein 1; PI3K, phosphatidylinositol-4,5-bisphosphate 3-kinase; PIP2, phosphatidylinositol (4,5)-bisphosphate; PIP3, phosphatidylinositol (3,4,5)-trisphosphate; SMRT, thyroid-, retinoic-acid-receptor-associated corepressor; SAM, S-adenosyl-l-methionine; PCNA, proliferating cell nuclear antigen.
Ijms 19 03970 g006
Figure 7. Effects of ClF (IC50) and EGCG (10 µM) or genistein (10 µM) alone and in combination on expression (left panel) and methylation (right panel) of PTEN tumor suppressor gene in MCF7 (A) and MDA-MB-231 (B) cells. All results represent mean ± SD of three independent experiments. Exposure (ClF alone, EGCG alone, genistein alone, ClF + EGCG or ClF + Genistein) versus vehicle control, *** p < 0.001, ** p < 0.01, * p < 0.05. EGCG or genistein alone versus combinatorial exposure (ClF + EGCG or ClF + Genistein), ^^ p < 0.01, ^ p < 0.05. ClF alone versus combinatorial exposure (ClF + EGCG or ClF + Genistein), ## p < 0.01, # p < 0.05.
Ijms 19 03970 g007
Figure 8. Effect of DMSO on MCF7 (A) and MDA-MB-231 (B) cell viability as measured by trypan blue exclusion test. MCF7 and MDA-MB-231 breast cancer cells were incubated for 4 days with DMSO at the indicated concentrations. The number of viable cells after 4 days exposure to DMSO was expressed as a percentage of viable cells in the unexposed control ((viable DMSO/viable unexposed control)*100%). The number of dead cells in either unexposed control or DMSO-exposed group was calculated as a percentage of the total cell number. DMSO at 0.1% (v/v) concentration was used as a vehicle control in all experiments. Values are means ± SD of at least three independent experiments. DMSO versus unexposed control, *** p < 0.001.
Ijms 19 03970 g008
Table 1. Effects of ClF at IC50 concentration (640 nM and 50 nM in MCF7 and MDA-MB-231 cells, respectively), EGCG or genistein at 10 µM concentration, as well as ClF (IC50) in combination with EGCG or genistein (10 µM) on MCF7 and MDA-MB-231 cell viability ((viable exposed/viable vehicle control)*100%).
ACell Viability
MCF7MDA-MB-231
ClF (IC50)53.6 ± 2.5 ***54.2 ± 2.7 ***
EGCG 10 µM87.2 ± 7.6 *83.3 ± 8.9 *
Genistein 10 µM79.7 ± 8.1 *78.3 ± 13.0 *
ClF + EGCG37.1 ± 3.1 ***^^^##45.2 ± 2.7 ***^^#
ClF + Genistein39.9 ± 1.1 ***^^###44.9 ± 3.6 ***^#
BMCF7MDA-MB-231
ClF (IC50)++++
EGCG 10 µM++
Genistein 10 µM++
Average CI0.8021 ± 0.0458 ***1.1439 ± 0.09130.7825 ± 0.0593 **1.0808 ± 0.1065
(A) All results represent mean ± SD of three independent experiments. Exposure (ClF alone, EGCG alone, genistein alone, ClF + EGCG, or ClF + Genistein) versus vehicle control, *** p < 0.001, ** p < 0.01, * p < 0.05. EGCG or genistein alone versus combinatorial exposure (ClF + EGCG or ClF + Genistein), ^^^ p < 0.001, ^^ p < 0.01, ^ p < 0.05. ClF alone versus combinatorial exposure (ClF + EGCG or ClF + Genistein), ### p < 0.001, ## p < 0.01, # p < 0.05. (B) CompuSyn data of trypan blue exclusion test values [57] (cell growth inhibition, (viable exposed/viable vehicle control)) indicate synergistic (CI < 1) effect of ClF + EGCG and nearly additive (CI = 1) effect of ClF + Genistein in both MCF7 and MDA-MB-231 breast cancer cells. CI, combination index.
Table 2. Primer sequences, annealing temperature, and polymerase chain reaction (PCR) product size used for methylation-sensitive restriction analysis (MSRA).
GeneAmplicon Length (bp)Sequence of Primers
(5′ → 3′)
F—Forward; R—Reverse
Annealing Temperature (°C)UCSC RefSeq Gene Accession NM (Human GRCh37/hg19 Assembly)
RARB295F: CTCGCTGCCTGCCTCTCTGG58.4NM_016152
R: GCGTTCTCGGCATCCCAGTCchr:3
PTEN214F: CAGCCGTTCGGAGGATTATTC61.1NM_000314
R: GGGCTTCTTCTGCAGGATGGchr:10
Table 3. Primer sequences, annealing temperature, and PCR product size used for quantitative real-time PCR (qPCR).
GeneAmplicon Length (bp)Sequence of Primers
(5′ → 3′)
F—Forward; R—Reverse
Annealing Temperature (°C)
RARB92F: TTCAAGCAAGCCTCACATGTTTCCA58.4
R: AGGTAATTACACGCTCTGCACCTTTAG
PTEN330F: CGAACTGGTGTAATGATATGT50.0
R: CATGAACTTGTCTTCCCGT
DNMT1100F: ACCGCCCCTGGCCAAAGCCATTG60.0
R: AGCAGCTTCCTCCTCCTTTATTTTAGCTGAG
CDKN1A103F: GCTCAGGGGAGCAGGCTGAAG60.0
R: CGGCGTTTGGAGTGGTAGAAATCTGT
TP53120F: TAACAGTTCCTGCATGGGCGGC64.0
R: GGACAGGCACAAACACGCACC
H3F3A76F: AGGACTTTAAAACAGATCTGCGCTTCCAGAG65.0
R: ACCAGATAGGCCTCACTTGCCTCCTGC
RPLP069F: ACGGATTACACCTTCCCACTTGCTGAAAAGGTC65.0
R: AGCCACAAAGGCAGATGGATCAGCCAAG
RPS1787F: AAGCGCGTGTGCGAGGAGATCG64.0
R: TCGCTTCATCAGATGCGTGACATAACCTG

