Abstract
Callose plays a critical role in different biological processes including development as well as in the response to multiple biotic and abiotic stresses. In this study, we characterized the callose deposition in cotyledons of different Brassica napus varieties post-inoculated with different Leptosphaeria maculans isolates. Further, members of the callose synthase gene were identified from the whole genome of B. napus using the 12 Arabidopsis thaniana callose synthase protein sequences, and were then classified into three groups based on their phylogenetic relationships. Chromosomal location and duplication patterns indicated uneven distribution and segmental duplication patterns of BnCalS genes in the B. napus genome. Subsequently, gene structures, conserved domains analysis, and protein properties were analyzed for BnCalS genes. In addition, 12 B. napus orthologs of the AtCalS were selected for investigating the tissue expression pattern, indicating diverse expression patterns for these BnCalS genes. Responses of the selected 12 orthologs and all the BnCalS genes were characterized in the different types (AvrLm1-Rlm1, AvrLm4-Rlm4, AvrLepR1-LepR1) of B. napus–L. maculans interactions and B. napus-Leptosphaeria biglobosa interactions, implying their potential roles in response to Leptosphaeria infection.
1. Introduction
Blackleg, caused by Leptosphaeria maculans (L. maculans), is an economically important disease on Brassica napus (B. napus) and is common in North America, Australia, and Europe []. There are several measures to control this disease including crop rotation, fungicide application, seed treatments, and planting of resistant cultivars []. Using resistant cultivars is normally considered as an effective as well as an economic method of disease control. Regarding resistance for L. maculans in Brassica crops, qualitative loci related to seedling stage resistance and quantitative loci in resistance of adult plants have been reported by different groups []. So far, a total of 18 qualitative loci have been reported, including Rlm1, Rlm2 [], Rlm3, Rlm4 [], Rlm5, Rlm6 [,], Rlm7 [], Rlm8, Rlm9 [,], Rlm10 [], Rlm11 [,], LepR1 and LepR2 [,], LepR3 [,], LepR4 [], and RlmS [].
Callose is a polysaccharide existing widely in the cell walls of a variety of higher plants. Its major composition is β-1,3-glucan. Synthesis and degradation of callose are involved in a variety of processes in plant development as well as in responses to multiple biotic and abiotic stresses []. Callose has been proposed to play crucial roles in another development. Its synthesis and degradation are tightly controlled during and following meiosis []. Callose is believed to be deposited as a temporary callose wall between the primary cell wall and the plasma membrane, preventing microsporocytes fusion and cohesion as well as maintaining the microsporocyte morphology and shielding microsporocytes from the influence of the surrounding environment [,]. Callose is synthesized by callose synthases (CalS) [,], most of which play vital roles in diverse biological processes [,]. CalS7 plays a role in plant growth and reproduction []. Many reports revealed that synthesis of callose was influenced by abiotic and biotic stresses, including injury, low temperature, heavy metals, and various pathogens. GSL5/Cals12 was found to be responsible for callose formation at sites of pathogen attack and at wounding sites [,,]. In addition, expression of five callose synthase genes (AtCalS1, 5, 9, 10, and 12) was induced by the pathogen (Hyaloperonospora arabidopsis) or salicylic acid (SA) []. In Citrus limon, increased susceptibility to Xanthomonas citrisubsp. citri was caused by the silencing of ClCalS1 []. It was shown that down-regulation of HvGsl6, an orthologue of AtGsl5 (Cals12) in barley, leads to lower accumulation of papillary and wound callose as well as a higher susceptibility to the pathogen Blumeria graminis f. sp. hordei [].
B. napus (AACC, 2n = 38) is an allotetraploid species that was formed by hybridization between ancestors of Brassica oleracea (B. oleracea, CC, 2n = 18) and Brassica rapa (B. rapa, AA, 2n = 20) [], followed by allopolyploidy []. Rapeseed/canola oil occupies the third position of oil production, after palm and soybean oils []. However, the production of rapeseed/canola is facing various threats, especially from diseases. A better understanding of the genes involved in defense responses will be helpful in breeding for the control of diseases. While little has been explained about callose deposition and the callose synthase gene family in B. napus, especially in response to blackleg, the CalS gene family plays important roles in different plant physiological processes. In this study, we characterized the callose deposition in two different R-Avr interactions, and subsequently identified 32 CalS genes in B. napus by protein-protein Basic Local Alignment Search Tool (BLASTP) against the B. napus genome using protein sequences of 12 CalS genes from Arabidopsis thaliana (A. thaliana). The phylogenetic relationships of CalS genes between B. napus, B. rapa, B. oleracea, and A. thaliana were analyzed, and gene structures, conserved domains, protein properties, and duplication patterns were all analyzed. Subsequently, selected BnCalS gene family members or all the members were revealed for tissue expression patterns and their response to L. maculans or L. biglobosa isolates in different varieties.
2. Results
2.1. Characterization of Callose Deposition in B. napus with the Infection by L. maculans Isolates
Callose was suggested to have a vital role in response to plant pathogens. In order to test the alteration of callose deposition in different types (AvrLm1-Rlm1, AvrLm4-Rlm4) of B. napus–L. maculans interactions, aniline blue dye was used to stain cotyledons of different B. napus varieties (with Rlm1, Rlm4, or no R gene) inoculated with different L. maculans isolates. As shown in Figure 1, all the cotyledons displayed a circle of staining near the inoculation sites 1-day post inoculation. Unconsolidated distribution of callose appeared in the cotyledons of the susceptible cultivar Westar, which were inoculated with D4 or D6 isolates and observed for 3, 7 or 11 days. In contrast, the incompatible interactions, Jet Neuf with D4 isolate and MT29 with D6 isolate, showed a pyknotic style of callose distribution around the infection sites through the whole infection process (Figure 1). However, deposition was continuous along with the whole infection process during the compatible interactions (Westar with D4 or D6, Figure 1).
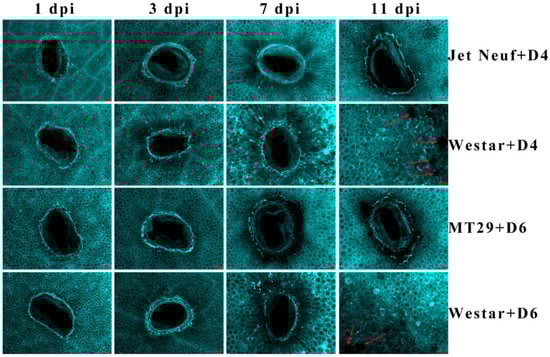
Figure 1.
Staining of callose deposition in different B. napus varieties inoculated with different L. maculans isolates. Jet Neuf + D4 and MT29 + D6 indicate cotyledons of Jet Neuf, and MT29 were inoculated with D4 and D6 isolates, respectively. Westar + D4 and Westar + D6 indicate cotyledons of Westar were inoculated with D4 and D6 isolates, respectively. One, 3, 7 and 11 dpi indicate 1, 3, 7 and 11 days post-inoculation. Red arrows indicate the pycnidia produced by L. maculans. Three replicates were performed for each treatment and showed a similar pattern. Scale bars = 100 μm.
2.2. Genome-Wide Identification of BnCals Family Genes from B. napus
Using 12 A. thaliana CalS protein sequences as queries, thirty-two BnCalS genes were identified and validated via reciprocal BLASTP between the genome database for B. napus and A. thaliana. The length of BnCalS proteins varied from 603 to 2085 aa, and the corresponding molecular weights of the BnCalS proteins ranged from 69.11 to 241.01 kDa (Table 1). The isoelectric point (pI) values of the BnCalS proteins were all higher than seven (Table 1), indicating the partial alkaline properties of BnCalS proteins. Transmembrane domain analysis showed that BnCalS proteins all contain several transmembrane domains, with values from 8 to 20 (Table 1). The protein sequences of BnCalS genes, AtCalS genes, and their homologs in B. rapa and B. oleracea were also used for constructing phylogenetic trees to analyze the evolutionary relationships of CalS proteins. In total, 32 BnCalS, 12 AtCalS, 15 BrCalS, and 16 BoCals proteins were used for generating the phylogenetic tree (Figure 2). As shown in Figure 2, CalS gene families were divided into three groups: Group A, Group B and Group C, which were subsequently divided into three subgroups: Group C1, Group C2 and Group C3. Group A and Group B contain 9 and 6 BnCalS genes, respectively (Table 1), while 1, 6 and 10 BnCalS members were included in Group C1, C2, and C3, respectively (Table 1).

Table 1.
Protein information of BnCalS gene family in Brassica napus. ORF stands for open reading frame. aa indicates the length of the protein. pI denotes isoelectric point.
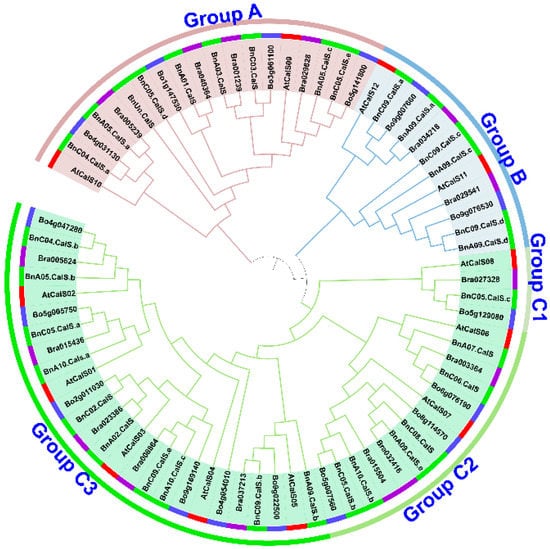
Figure 2.
Phylogenetic relationship analysis of CalS genes in A. thaliana, B. napus, B. rapa, and B. oleracea. Protein sequences of twelve AtCalS from A. thaliana, 32 BnCalS from B. napus, 15 BrCalS from B. rapa, and 16 BoCalS from B. oleracea were used to construct a neighbor-joining (NJ) tree. Different colors of the first circle from the tree represent different genes from different species, with red indicating A. thaliana, green indicating B. napus, purple representing B. rapa, and skyblue denoting B. oleracea. The second circle of the tree indicates three groups or five subgroups differentiated by different colors.
2.3. Chromosomal Localization and Duplication of BnCalS Gene Family in B. napus
Thirty-two BnCalS genes were mapped onto 15 chromosomes in B. napus (Figure 3, Table S1). BnCalS genes were unevenly distributed throughout the chromosomes. Chromosome A09, C05, and C09 contained the maximum number of CalS genes (five), while some chromosomes contained no CalS genes, such as A04, A06, A08, C01 and C07 (Figure 3 and Table S1). Two chromosomes (A05 and A10) contained three CalS genes (Figure 3 and Table S1) and chromosome C04 contained two CalS genes (Figure 3 and Table S1). Nine chromosomes, A01, A02, A03, A07, C02, C03, C06, C08 and chrUnn_random, contained only one CalS gene (Figure 3 and Table S1).
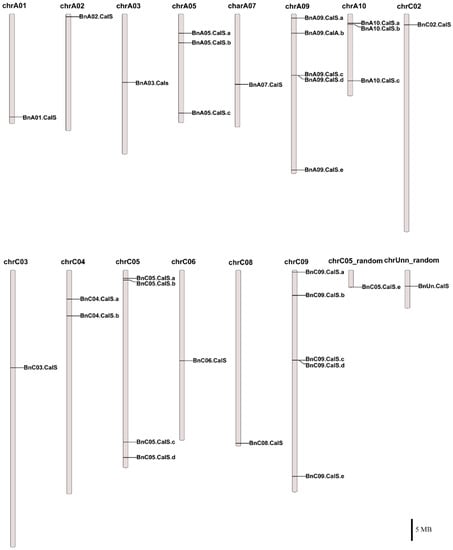
Figure 3.
Chromosomal locations of 32 BnCalS genes. The chromosome number is placed above each chromosome. Only those chromosomes containing BnCalS genes (15) are listed. Scale bar represents a 5 Mb physical distance.
Several gene duplication modes including whole-genome duplication (WGD) or segmental duplication, tandem duplication, and rearrangements were considered to drive the evolution of protein-coding gene families at the gene and chromosomal level []. The contribution of the CalS gene family to the expansion of the B. napus genome was investigated using MCscanX software suite []. According to a whole genome analysis of gene duplications, two types of duplication modes, dispersed and WGD/segmental, were detected among 32 BnCalS genes (Table S1). Twenty-seven BnCalS genes were produced by WGD, with five others produced by dispersed duplications (Table S1). The collinear relationships of the duplicated pairs in the BnCalS gene family in B. napus were investigated using MCscanX and are shown in Figure 4. In total, we identified 30 paralog pairs that shared a higher identity according to their protein sequences (Figure 4). Enormous synteny blocks were also identified between A and C subgenomes or between different chromosomes of A or C, and all the 30 paralog pairs were located within synteny blocks on chromosomes (Figure 4).
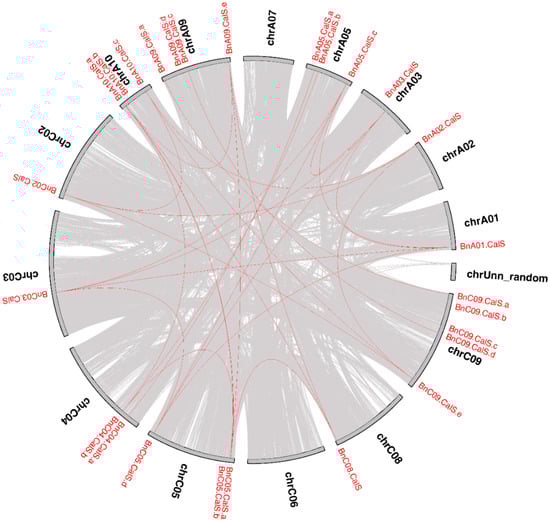
Figure 4.
Circle plot showing collinear gene pairs on 12 Brassica napus chromosomes. Grey lines represent collinear blocks in the whole B. napus genome, while red lines indicate collinear BnCalS gene pairs.
2.4. Gene Structure and Conserved Domain Analysis of BnCalS Genes
The open reading frame (ORF) length of the 32 BnCalS genes ranged from 1809 to 6912 bp, with an average of 4977 bp (Table 1). The number of exons in the BnCalS gene family varied from one to 55, with most genes (29 of 32, 71.9%) having more than 30 exons (Figure 5 and Table S1). The gene pairs among the BnCalS gene family shared a high similarity in terms of exon numbers and protein/ORF length (Figure 5 and Table S1). For example, the gene pairs BnA01.Cals: BnC03.Cals had 50 and 50 exons, respectively, and gene pair BnA09.Cals.d: BnC09.Cals.d had 3 and 3 exons, respectively (Figure 5 and Table S1). The conserved domains in BnCalS gene family were investigated using Batch CD-Search. Nine conserved domains were discovered in the 32 CalS genes, and the Glucan_synthase superfamily domain was observed to be the most common domain (30 of 32) in the BnCalS proteins, followed by FKS1_dom1 domain, which was found to be in 27 BnCalS proteins (Figure 6). However, the domains DUF1084 superfamily and UPF0139 superfamily were observed in only one protein, BnC06.CalS and BnA03.CalS, respectively (Figure 6).
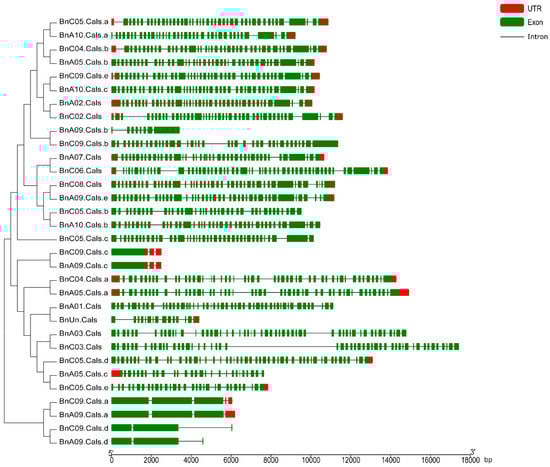
Figure 5.
Gene structures of the BnCalS genes according to their phylogenetic relationships. The red boxes and green boxes indicate untranslated regions (UTR) and exons, respectively, black lines denote introns. bp: base pairs.
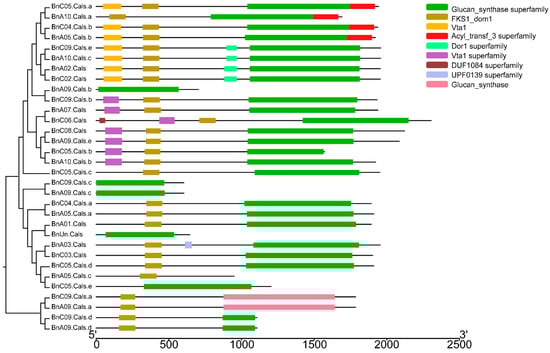
Figure 6.
Schematic representation of the conserved domains in the BnCalS genes. Each predicted domain is represented by a colored box indicated at the right side.
2.5. Expression Analysis of the BnCalS Gene Family in Different Tissues
To gain a better understanding of the functions of BnCalS genes in plant development, we selected 12 BnCalS genes showing the highest similarity with 12 AtCalS genes and analyzed their expression patterns in six tissues including root, stem, leaf, flower, silique, and bud at three different developmental stages (<1 mm, 1–2 mm, >2 mm) using quantitative RT-PCR (qPCR) (Table S2). We found that the BnCalS genes had various kinds of expression patterns (Figure 7); BnC09.Cals.b showed expression only in open flowers and buds, BnA10.CalS.b had no expression in silique. The remaining nine BnCalS genes displayed expression in all the six tissues (Figure 7). Most of the BnCalS genes exhibited a higher expression level in open flowers and buds (Figure 7), suggesting key roles of BnCalS genes in the flower development process. BnA02.CalS and BnA05.CalS.a displayed a higher expression level in all six tissues. Some BnCalS genes exhibited tissue-specific expression; BnA07.CalS was highly expressed in roots and open flowers, while BnC05.CalS.c, BnC04.CalS.b, and BnA05.CalS.b were strongly expressed in open flowers (Figure 7). In the three bud stages, BnA02.CalS had a higher expression level across all three bud stages, and BnC05.CalS.a was mainly expressed in the <1 mm stage, while BnC09.CalS.b showed higher expression levels in the >2 mm stage (Figure 7). Due to the low expression level detected here, we performed another cycle of qPCR using another known internal gene GAPDH (BnaC05g09880D) to validate the expression of BnCalS genes in different tissues. Most of these genes showed very similar expression patterns, as in Figure 7, except that expression levels increased a little in most genes (Figures S3 and S4).
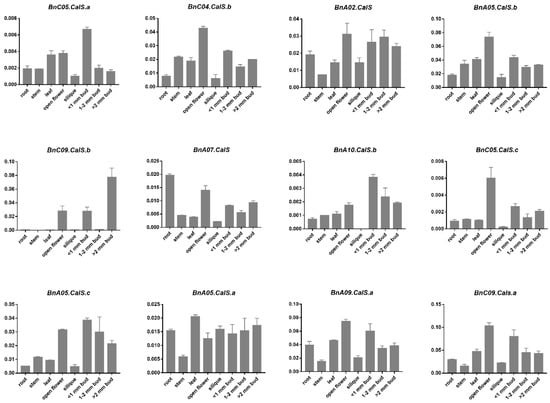
Figure 7.
Expression analysis of 12 selected BnCalS genes in different tissues and at different developmental stages. The different tissues included root, stem, leaf, silique, and bud as indicated in the figure. <1 mm bud, 1–2 mm bud, and >2 mm bud indicate buds with different sizes, with diameters >1 mm, 1–2 mm, or >2 mm. Expression was detected using qPCR. The values and error bars indicate means ± standard error (n = 3).
2.6. Expression Analysis of BnCalS Genes in Different R-Gene-Containing Varieties Infected by L. maculans Isolates with Different Avr Genes
Callose synthesis was reported to be involved in defense against different kinds of pathogens [,,,,]. To gain insight into the roles of BnCalS genes in the responses of B. napus against L. maculans, 12 BnCalS with higher similarity to 12 AtCalS genes were selected for determining expression levels in varieties of MT29 (containing Rlm1 and Rlm9, inoculated with D6), Jet Neuf (containing Rlm4, inoculated with D4), and Westar (containing no R gene, inoculated with D4 or D6). One-week-old cotyledons from each cultivar were punctured prior to inoculation. As shown in Figures S1 and S2, the interactions of MT29 with D6, and Jet Neuf with D4, were defined as incompatible interactions, while interactions of Westar with D6 or D4 were indicated as compatible interactions. The expression of the 12 selected BnCalS genes showed diverse patterns (Figure 8). There were two genes, BnC04.CalS.b and BnA05.CalS.b, the expressions of which were shown to be suppressed under four treatments (Figure 8). Expression of the twelve selected genes appeared to decrease or not be altered in Jet Neuf after inoculation with D4 isolate (Figure 8). However, when the cultivar Westar was inoculated with D4 isolate, eight of the 12 BnCalS genes, BnC05.CalS.a, BnA02.CalS, BnC09.Cals.b, BnA07.CalS, BnA05.Cals.c, BnA05.CalS.a, BnA09.CalS.a, and BnC09.CalS.a, increased their expression (Figure 8). In the cultivar MT29, expression of BnC05.CalS.a, BnC09.CalS.b, BnA07.CalS, BnC05.CalS.c, BnA09.CalS.a, and BnC09.CalS.a were induced by the infection of D6 isolates. When Westar was inoculated with D6 isolate, expressions of BnC05.CalS.a, BnC09.CalS.b, BnA07.CalS, BnA05.CalS.c, BnA05.CalS.a, BnA09.CalS.a, and BnC09.CalS.a were shown to be up-regulated after inoculation at different periods (Figure 8).
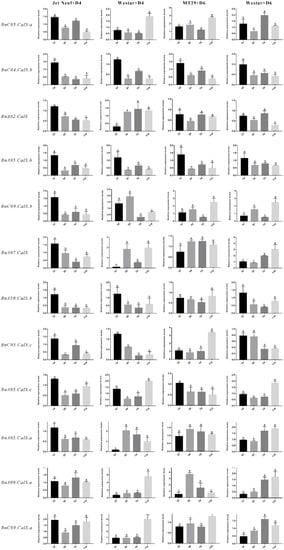
Figure 8.
Expression analysis of selected 12 BnCalS genes in two B. napus varieties following inoculation with Leptosphaeria maculans. Three different varieties, Westar, MT29, and Jet Neuf, were inoculated with two L. maculans isolates, D4 and D6, and expression of the corresponding 12 CalS genes at different time points was determined using qPCR. The Brassica napus Actin gene was used as the internal control to normalize expression data. The results were calculated from three biological replicates. Tukey’s test (ANOVA) were performed to determine the significant difference between each treatment. The statistically significant differences were defined as p < 0.05 and are marked with different letters. Error bars denote standard error.
To further explore BnCalS gene expression in other types of B. napus–L. maculans pathosystems, such as the AvrLepR1–LepR1 interaction or the B. napus–L. biglobosa pathosystem, we analyzed the expression level of these BnCalS genes under different types of pathosystems based on published RNA-seq datasets [,]. For analyzing the expression of BnCalS during the AvrLepR1–LepR1 interaction, one-week-old seedlings of cultivars DF78 and Westar inoculated with of D3 isolates were harvested at different time points for RNA purification and subsequently RNA sequencing []. As shown in Figure 9, 11 of the 32 genes (4 of them were not shown because of low or no expression) were shown to be induced by the infection of L. maculans isolate D3 in both B. napus lines, Westar, and DF78. However, none of these genes were induced in both varieties: BnA01.CalS, BnA02.CalS, BnC09.CalS.e, BnC02.CalS, BnA10.CalS.c, BnC05CalS.b, and BnUn.CalS only increased their levels in Westar, while BnA10.CalS.a, BnC05.CalS.a, BnC05.CalS.e, and BnC09.CalS.d were only induced in DF78 (Figure 9). Expression levels of all the four up-regulated genes peaked at 7-days post-inoculation in DF78 (Figure 9). All the remaining BnCalS genes, except BnA05.CalS.b, BnC04.CalS.b, BnA05.CalS.c, BnC09.CalS.c, BnA05.CalS.a, and BnA09.CalS.a, showed repressed expression in both varieties (Figure 9). Expression of BnA05.CalS.b, BnC04.CalS.b, and BnA05.CalS.c were not altered in Westar but repressed in DF78, whereas, expression of BnC09.CalS.a and BnA05.CalS.a were displayed inversely (Figure 9). BnC09.CalS.c was not affected in both varieties (Figure 9).
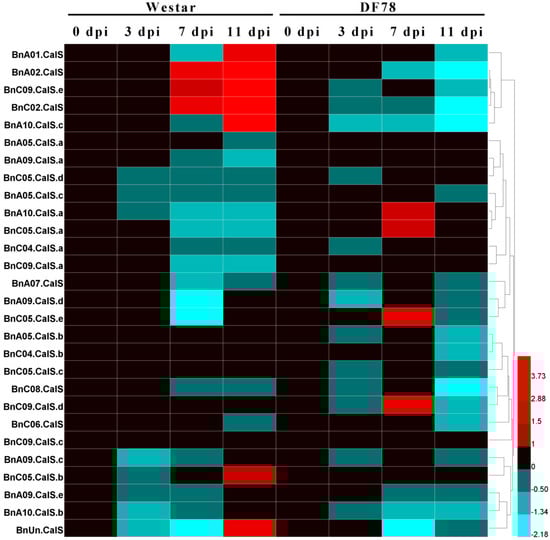
Figure 9.
Heatmap of the expression patterns of the 28 BnCalS genes in Westar and DF78 after inoculation with D3 isolate for different time periods. Expression levels were measured in transcripts per kilobase of exon model per million mapped reads (TPM) values, ratio values were from comparing the TPM value of the L. maculans treated sample with that of the mock-treated sample. The color scale bar at the bottom of the map represents a log2 ratio value, which represents the low and high expression, respectively. Varieties and corresponding treatments used for expression profiling are indicated at the top of each column. The names of genes are indicated on the left side of the heatmap.
2.7. Differential Expression Analysis of BnCalS Genes in the Interaction of B. napus with Two Leptosphaeria Species: L. maculans and L. biglobosa
Leptosphaeria biglobosa is closely related with L. maculans, both belonging to the Leptosphaeria genus [,,]. As L. biglobosa is less aggressive and causes lower losses to oilseed rape production compared with L. maculans, it is essential to investigate the host response differences to these two species. We utilized the published RNA sequencing data [] to differentiate the expression difference of BnCalS in Westar with inoculation by L. maculans and L. biglobosa. As stated by Lowe et al. [], 10-day-old cotyledons of Westar were inoculated with L. maculans isolate IBCN18 and L. biglobosa isolate 06J154 and collected for RNA sequencing at 7 and 11 dpi, respectively. As shown in Figure 10, various kinds of expression patterns were indicated. The first class were those having ultra-low or no expression levels in the interaction of B. napus with both Leptosphaeria species, and those genes including BnA03.CalS, BnA09.CalS.d, BnC03.CalS, BnC05.CalS.c, BnC09.CalS.d, and BnUn.CalS. The second class were those whose expression was repressed in the interaction of Westar with both species, including BnA02.CalS, BnA10.CalS.c, BnA05.CalS.b, BnC02.CalS, BnC09.CalS.e, BnA09.CalS.e, BnC08.CalS, BnC05.CalS.b, BnA10.CalS.b, BnC04.CalS.b, and BnC06.CalS. The third class included BnA05.CalS.a, BnA05.CalS.c, BnC05.CalS.d, BnC04.CalS.a, and BnC09.CalS.a, in which the expression level was not altered in Westar inoculated with L. biglobosa but showed an elevated level in Westar inoculated with L. maculans. The fourth class was those which showed increased expression level in both kinds of interactions, and included BnA07.CalS, BnC05.CalS.e, BnA09.CalS.a, BnC09.CalS.a, BnC05.CalS.a, BnA09.CalS.b, BnC09.CalS.b, and BnA10.CalS.a. The fifth class included BnA09.CalS.c and BnC09.CalS.c, in which the expression was not altered in the Westar-L. biglobosa interaction but was repressed in the Westar-L. maculans interaction.
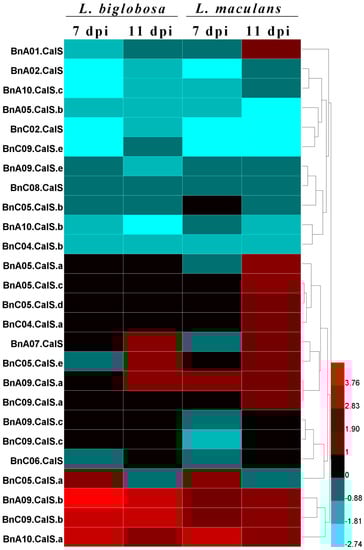
Figure 10.
Heapmap of the expression profiles of BnCalS genes in Westar plants subjected to L. biglobosa or L. maculans infection. The TPM value of each gene was used as the expression level, the relative value was obtained by comparing TPM values of Westar inoculated with L. maculans or L. biglobosa with Westar inoculated with water, and the color scale was based on the log2 (relative value). Samples with L. maculans or L. biglobosa are indicated on the top of the heatmap, and genes are indicated at the left side of the heatmap. Twenty-six genes were shown and the other 6 were not included because of low or no expression in these samples.
3. Discussion
Callose is suggested to have diverse functions during the process of plant development as well as in responses to environmental biotic or abiotic stimulus [,]. Blackleg is one of the major diseases around the world, and callose deposition plays an important role in the interaction of B. napus and L. maculans [], the causal agent of blackleg. Here, we characterize the deposition of callose during the whole infection process of blackleg in B. napus using two different R-Avr interaction types (Rlm1-AvrLm1, Rlm4-AvrLm4). This contributed to knowledge of callose deposition during blackleg infection. During the incompatible interaction, pyknotic callose structure circled the infection site, which can be beneficial in enhancing the resistance of host to pathogen by preventing the extension of hyphae []. In the compatible interaction, unconsolidated distribution of callose around the infection site starting from 3 dpi may cause the B. napus to be more susceptible to L. maculans. However, callose production was continuous in compatible interactions, and higher after 7 dpi, which may suggest that callose production is a sign for responses of B. napus to L. maculans, and R genes could effectively modulate the callose deposition to form a compact callose wall around the infection site. Furthermore, behavior of callose deposition displays a very similar pattern between different types of R-Avr interactions, which might suggest that they share a similar regulation mechanism of callose deposition.
Callose is synthesized by callose synthases in plants, and 12 callose synthases genes were proposed in Arabidopsis []. Some of the 12 AtCalS genes were investigated for their functions in plant development [,,,] and defense against biotic or abiotic stress [,]. However, little is known about the CalS gene family in B. napus.
In this study, 32 CalS genes were identified in B. napus, which is almost three times the number of Arabidopsis CalS genes. This may suggest that genome duplication occurred in the evolution of B. napus, in accordance with the fact that B. napus is an allotetraploid species with widespread genome duplication and merging events []. B. napus contains the same number of genes as the total number of B. rapa and B. oleracea, which are two ancestral species of B. napus [], indicating that CalS genes may be derived from B. rapa and B. oleracea CalS genes. Combing phylogeny with gene structures and protein properties, it was found that most of the genes in the same groups showed similar exon numbers and protein pI values, such as the group B members having 1–4 exons with pI values around 9, while most members of group A had approximately 50 exons with pI values about 8. This indicated that group classification based on the phylogenetic tree was supported by gene structure and protein character. Five gene duplication modes including whole-genome duplication (WGD) or segmental duplication, tandem duplication, and rearrangements were considered as the major driving forces for the evolution of gene families at the gene []. In addition, segmental gene duplication is one of the main reasons for maintenance of gene families []. Thirty-two BnCalS genes were unevenly distributed on 15 of 19 chromosomes, and 27 of them were found to be produced by segmental duplication, indicating that segmental duplication played an indispensable role in the evolution of the CalS gene family in B. napus. Based on a constructed phylogenetic tree, the 32 BnCalS proteins were classified into three groups, which showed similar patterns as reported previously []. In addition, the Glucan_synthase family or Glucan_synthase domain was detected in all the BnCalS gene family, indicating that these CalS proteins may have glucan synthase activity, which has the main role in callose synthesis.
Expression patterns of CalS genes in different tissues have not been reported for many plants. For this study, we selected the 12 BnCalS genes showing the most similarity with the 12 AtCalS genes for analyzing expression in seven different tissues. The qPCR results from two reference genes showed a small difference in the expression level, which might be mainly due to relatively stable expression but not absolutely constant expression of these reference genes. Homologs from different species usually share a similar function in the biological process. BnC09.CalS.b showed a relatively higher level in open flowers and buds, especially in buds with diameters larger than 2mm, which is recognized as the microspore stage []. This expression pattern is in accordance with that of AtCalS5, however, BnC09.CalS.b was not expressed in roots, leaves, stems, and silique, which is totally different from AtClaS5. For this case, we infer that different paralogs of BnC09.CalS.b may be expressed in these tissues to ensure the normal synthesis of callose, or that the other CalS family members may help to achieve normal formation of callose in these tissues. Callose is ultra-important for pollen development and entry into the ovary [,,,], and results from the present study also suggest that most of the CalS genes display a higher expression level in the open flower and bud development process, which indicate that these CalS genes play key roles in the process of pollen development and pollen grain germination. In addition, the 12 tested CalS showed different levels in different tissues, suggesting the complex expression profiles of the CalS gene family members in plant development stages, and that different members may be responsible for the synthesis of callose in different tissues and development stages.
Callose is considered to provide mechanical support to the cell wall against environmental stresses, and its synthesis can be altered by the infection of pathogens []. Callose was also found to be involved in the B. napus–L. maculans interaction []. Comparing the expression of CalS genes in different B. napus varieties inoculated with different isolates, it was found that most of the BnCalS genes were repressed in the varieties, suggesting that L. maculans may have mechanisms to regulate the expression of CalS genes. There are some BnCalS genes that displayed different expression patterns in response to different types of variety–isolate interactions; for instance, the expression of BnC05.CalS.a was suppressed in both DF78 and Westar inoculated with D3 isolate, while its expression was inhibited in Jet Neuf but activated in Westar when they were both inoculated with the D4 isolate. Such BnCalS genes like BnC05.CalS.a may be modulated by the interaction of specific R and Avr genes. Expression of some BnCalS genes, such as BnC09.CalS.b, were repressed in the susceptible variety of Westar but were induced in resistant varieties DF78 and MT29, which may contribute to resistance conferred by R genes. There are some genes whose expression peaked earlier in incompatible interactions of plant–pathogens, contributing to the prompt response to L. maculans infection, such as BnA03.CalS and BnA09.CalS.d in the interactions of DF78 and D3. Based on these results, we concluded that BnCalS plays a key role in the response of B. napus against L. maculans infection through mediating the synthesis of callose. In addition, more up-regulated BnCalS genes were found in the interaction of B. napus–L. maculans, indicating a stronger defense response. All up-regulated BnCalS genes found in the interaction of B. napus–L. biglobosa are also shared with up-regulated genes in the interaction of B. napus–L. maculans. This may indicate that these shared BnCalS genes are in the common signaling pathway for defense against Leptosphaeria species.
4. Materials and Methods
4.1. Plant and Fungal Materials
The susceptible B. napus cultivar Westar (no R gene) was inoculated with L. maculans isolate D4 or D6, while the B. napus lines Jet Neuf (Rlm4) and MT29 (Rlm1 and Rlm9) were inoculated with L. maculans isolates D4 and D6, respectively. The D4 isolate contained seven avirulent genes AvrLm4, AvrLm5, AvrLm6, AvrLm7, AvrLm8, AvrLepR1, and AvrLepR2, and the D6 isolate contained five avirulent genes AvrLm1, AvrLm5, AvrLm6, AvrLm8, and AvrLmS []. B. napus seeds were germinated in soil and grown for one week, with a photoperiod of 16 h/8 h (16 °C dark, 22 °C light). The L. maculans inoculation was performed as described by Zhang et al. [] and Liban, et al. []. Sterilized distilled water was used as mock control. Samples were collected and flash-frozen in liquid nitrogen. Cotyledons inoculated with L. maculans isolate or mock were sampled at the 1st day, 3rd day, 7th day, and 11th day after inoculation. Roots of Westar seedlings were used for root tissue, and stems of two-month-old Westar plants were used for stem tissue. For leaf tissue collection, the fifth leaves of 8-leaf-stage Westar plants were sampled. Buds with different diameters (<1 mm, 1–2 mm, and >2 mm) were collected from Westar plants and used for different stages of buds. Flowers were sampled the same day they bloomed. Silique samples were collected after flowering for two weeks.
4.2. Aniline Blue Staining of Callose Deposition
Callose deposition was stained using aniline blue according to the protocol by Schenk and Schikora []. Briefly, post-inoculated cotyledons were collected and fixed in formalin-acetic-acid-alcohol (FAA) solution (ethanol: acetic acid: formaldehyde: H2O = 10:1:2:7, v/v/v/v). Before staining, cotyledons were de-stained in 1:3 acetic acid/ethanol until they became transparent. Cotyledons were then washed three times using 150 mM K2HPO4, and washed cotyledons were immersed in staining solution and stained for at least 2 hrs. The staining solution was prepared by dissolving 0.01% aniline blue in 150 mM K2HPO4. Callose depositions were visualized on a Zeiss Axio Imager Z1 using a 4’,6-diamidino-2-phenylindole (DAPI) filter.
4.3. Identification of CalS in B. napus, B. rapa, and B. oleracea
The 12 AtCalS protein sequences from the A. thaliana genome (http://www.arabidopsis.org/) were used as queries to identify CalS genes in B. napus, B. rapa, and B. oleracea via a BLASTP search []. The BLASTP searches used default parameters, with E-value less than 1 × 10⁻²⁰ and the score set at more than 1000. In addition, obtained BnCalS sequences were used as queries in BLASTP against the A. thaliana protein database for confirmation. The sequences of obtained proteins were analyzed using the Batch CD-Search (https://www.ncbi.nlm.nih.gov/Structure/bwrpsb/bwrpsb.cgi) to ensure target proteins contained glucan_synthase or glucan_synthase family domains. The identified CalS protein sequences of B. napus, B. rapa, B. oleracea, and A. thaliana were used for multiple sequence alignments using the ClustalW program. Phylogenetic relationships were established using alignment results with MEGA 6.0 [] based on the neighbor-joining (NJ) method using a boot strap replication of 1000.
4.4. Chromosomal Location and Orthologous Identification of CalS
Chromosomal position information for BnCalS genes was retrieved from relevant generic feature format (GFF) files, which were downloaded from Ensembl plants. These BnCalS genes were denominated based on their position on the chromosomes. Gene duplication types and collinearity relationships were detected using MCscanX. BLASTP was performed to do self-self-comparison using B. napus protein sequences with the E-value under 1 × 10⁻¹⁰. Program detect_collinearity_within_gene_families.pl in MCscanX was used to detect collinearity within the BnCalS gene family []. Five duplication types including WGD/segmental duplication events were detected for classifying origins of the duplicate genes of the B. napus genome using the program incorporated in MCScanX, and duplication information of the BnCalS gene family was extracted. The duplications within the BnCalS gene family were displayed using the program circle_plotter of MCScanX.
4.5. Gene Structures and Protein Conserved Domains Analysis of the BnCalS Gene Family
The information of exon-intron structures for BnCalS genes was extracted from GFF files and displayed using TBtools software []. Conserved domains of the BnCalS proteins were investigated with the Batch CDD tool (https://www.ncbi.nlm.nih.gov/Structure/bwrpsb/bwrpsb.cgi) with default parameters used and displayed by TBtools.
4.6. RNA Purification and Quantitative RT-PCR Analysis
Total RNA from different tissues or cotyledons with different treatments was purified with PureLink™ Plant RNA Reagent (Invitrogen, Carlsbad, CA, USA). The purified RNA was treated with the TURBO DNA-free™ Kit (Invitrogen) for 30 minutes to degrade genomic DNA. Following the manufacturer’s instructions, the first-strand cDNA was synthesized using 1 μg of the total RNA with the 1st cDNA Synthesis Kit (Thermo Scientific, Waltham, MA, USA). For the qPCR assay, cDNA was diluted 1:100 with ddH2O, and 4.2 μL of cDNA plus 5 μL of SYBR Green I Master Mix (Clontech, Palo Alto, CA, USA) and 0.4 μL of each primer (10 mM) were used for the PCR reaction. PCRs were performed using a CFX96 Real Time Instrument (Bio-Rad, Hercules, CA, USA), and the amplification programs were set at the following conditions: 95 °C for 1 min, 40 cycles of 95 °C for 10 s, 60 °C for 30 s, followed by 95 °C for 10 min. Melting curve analysis was conducted by increasing 0.5 °C at 5 s/step from 65 to 95 °C to estimate the specificity of product. The relative gene expression levels of the target genes were calculated using the 2−ΔΔCt method with the B. napus Actin gene (AF111812.1) as a reference. All the primers used for qPCR were deposited in Table S2.
4.7. Transcriptome Analysis of BnCalS Genes Based on Published RNA-Seq Data
To investigate the expression patterns of BnCalS genes in the AvrLepR1-LepR1 interaction system, Sequence Read Archive (SRA) files were downloaded from Gene Expression Omnibus (GEO) RNA-seq datasets (GSE77723). All reads were cleaned using trimmomatic 0.36 [] and aligned to the transcriptome of B. napus ‘Darmor-bzh’ with Bowtie2 []. Gene expression quantification was performed using a software package called RSEM []. The transcripts per kilobase of exon model per million mapped reads (TPM) values were extracted from the expression quantification data, after which heatmaps were constructed from relative TPM values using HemI software (1.0) [].
Supplementary Materials
Supplementary materials can be found at http://www.mdpi.com/1422-0067/19/12/3769/s1.
Author Contributions
F.L. and W.G.D.F. designed the experiments. F.L. and Z.Z. performed the RNA extraction and gene expression analysis. F.L. and W.G.D.F. analyzed and interpreted the data. F.L. and W.G.D.F. wrote and revised the manuscript.
Funding
This work was supported by SaskCanola ASP-GF2 program, NSERC Discovery, and NSERC-CRD.
Acknowledgments
We are grateful to Paula Parks for her help on language editing and Ravinder Sidhu for her help on microscopy observation.
Conflicts of Interest
The authors declare no conflicts of interest.
References
- Fitt, B.D.; Brun, H.; Barbetti, M.; Rimmer, S. World-wide importance of phoma stem canker (Leptosphaeria maculans and L. biglobosa) on oilseed rape (Brassica napus). In Sustainable Strategies for Managing Brassica napus (Oilseed Rape) Resistance to Leptosphaeria maculans (Phoma Stem Canker); Springer: New York, NY, USA, 2006; pp. 3–15. [Google Scholar]
- Kutcher, H.; Brandt, S.; Smith, E.; Ulrich, D.; Malhi, S.; Johnston, A. Blackleg disease of canola mitigated by resistant cultivars and four-year crop rotations in western Canada. Can. J. Plant Pathol. 2013, 35, 209–221. [Google Scholar] [CrossRef]
- Raman, H.; Raman, R.; Larkan, N. Genetic dissection of blackleg resistance loci in rapeseed (Brassica napus L.). In Plant Breeding from Laboratories to Fields; InTech: Houston, TX, USA, 2013. [Google Scholar]
- Ansan-Melayah, D.; Balesdent, M.; Delourme, R.; Pilet, M.; Tanguy, X.; Renard, M.; Rouxel, T. Genes for race-specific resistance against blackleg disease in Brassica napus L. Plant Breed. 1998, 117, 373–378. [Google Scholar] [CrossRef]
- Delourme, R.; Pilet-Nayel, M.; Archipiano, M.; Horvais, R.; Tanguy, X.; Rouxel, T.; Brun, H.; Renard, M.; Balesdent, M. A cluster of major specific resistance genes to Leptosphaeria maculans in Brassica napus. Phytopathology 2004, 94, 578–583. [Google Scholar] [CrossRef] [PubMed]
- Keri, M.; Van den Berg, C.; McVetty, P.; Rimmer, S. Inheritance of resistance to Leptosphaeria maculans in Brassica juncea. Phytopathology 1997, 87, 594–598. [Google Scholar] [CrossRef] [PubMed]
- Balesdent, M.; Attard, A.; Kühn, M.; Rouxel, T. New avirulence genes in the phytopathogenic fungus Leptosphaeria maculans. Phytopathology 2002, 92, 1122–1133. [Google Scholar] [CrossRef] [PubMed]
- Balesdent, M.; Barbetti, M.; Li, H.; Sivasithamparam, K.; Gout, L.; Rouxel, T. Analysis of Leptosphaeria maculans race structure in a worldwide collection of isolates. Phytopathology 2005, 95, 1061–1071. [Google Scholar] [CrossRef] [PubMed]
- Chevre, A.; Eber, F.; This, P.; Barret, P.; Tanguy, X.; Brun, H.; Delseny, M.; Renard, M. Characterization of Brassica nigra chromosomes and of blackleg resistance in B. napus–B. nigra addition lines. Plant Breed. 1996, 115, 113–118. [Google Scholar] [CrossRef]
- Balesdent, M.H.; Fudal, I.; Ollivier, B.; Bally, P.; Grandaubert, J.; Eber, F.; Chèvre, A.M.; Leflon, M.; Rouxel, T. The dispensable chromosome of Leptosphaeria maculans shelters an effector gene conferring avirulence towards Brassica rapa. New Phytol. 2013, 198, 887–898. [Google Scholar] [CrossRef] [PubMed]
- Parkin, I.; Sharpe, A.; Keith, D.; Lydiate, D. Identification of the A and C genomes of amphidiploid Brassica napus (oilseed rape). Genome Natl. Res. Council Can. 1995, 38, 1122–1131. [Google Scholar] [CrossRef]
- Yu, F.; Lydiate, D.; Rimmer, S. Identification of two novel genes for blackleg resistance in Brassica napus. Theor. Appl. Genet. 2005, 110, 969–979. [Google Scholar] [CrossRef] [PubMed]
- Larkan, N.; Lydiate, D.; Parkin, I.; Nelson, M.; Epp, D.; Cowling, W.; Rimmer, S.; Borhan, M. The Brassica napus blackleg resistance gene LepR3 encodes a receptor-like protein triggered by the Leptosphaeria maculans effector AvrLm1. New Phytol. 2013, 197, 595–605. [Google Scholar] [CrossRef] [PubMed]
- Yu, F.; Lydiate, D.J.; Rimmer, S.R. Identification and mapping of a third blackleg resistance locus in Brassica napus derived from B. rapa subsp. sylvestris. Genome Natl. Res. Council Can. 2007, 51, 64–72. [Google Scholar] [CrossRef] [PubMed]
- Yu, F.; Gugel, R.K.; Kutcher, H.R.; Peng, G.; Rimmer, S.R. Identification and mapping of a novel blackleg resistance locus LepR4 in the progenies from Brassica napus × B. rapa subsp. sylvestris. Theor. Appl. Genet. 2013, 126, 307–315. [Google Scholar] [CrossRef] [PubMed]
- Van de Wouw, A.; Marcroft, S.; Barbetti, M.; Hua, L.; Salisbury, P.; Gout, L.; Rouxel, T.; Howlett, B.; Balesdent, M. Dual control of avirulence in Leptosphaeria maculans towards a Brassica napus cultivar with ‘sylvestris-derived’ resistance suggests involvement of two resistance genes. Plant Pathol. 2009, 58, 305–313. [Google Scholar] [CrossRef]
- Piršelová, B.; Matušíková, I. Callose: The plant cell wall polysaccharide with multiple biological functions. Acta Physiol. Plant. 2013, 35, 635–644. [Google Scholar] [CrossRef]
- Shi, X.; Han, X.; Lu, T.-G. Callose synthesis during reproductive development in monocotyledonous and dicotyledonous plants. Plant Signal. Behav. 2016, 11, e1062196. [Google Scholar]
- Bucciaglia, P.A.; Smith, A.G. Cloning and characterization of Tag 1, a tobacco anther β-1, 3-glucanase expressed during tetrad dissolution. Plant Mol. Biol. 1994, 24, 903–914. [Google Scholar] [CrossRef] [PubMed]
- Dong, X.; Hong, Z.; Sivaramakrishnan, M.; Mahfouz, M.; Verma, D.P.S. Callose synthase (CalS5) is required for exine formation during microgametogenesis and for pollen viability in Arabidopsis. Plant J. 2005, 42, 315–328. [Google Scholar] [CrossRef] [PubMed]
- Kelly, R.; Register, E.; Hsu, M.-J.; Kurtz, M.; Nielsen, J. Isolation of a gene involved in 1,3-β-glucan synthesis in Aspergillus nidulans and purification of the corresponding protein. J. Bacterial. 1996, 178, 4381–4391. [Google Scholar] [CrossRef]
- Verma, D.P.S.; Hong, Z. Plant callose synthase complexes. Plant Mol. Biol. 2001, 47, 693–701. [Google Scholar] [CrossRef] [PubMed]
- Ellinger, D.; Voigt, C.A. Callose biosynthesis in Arabidopsis with a focus on pathogen response: What we have learned within the last decade. Ann. Bot. 2014, 114, 1349–1358. [Google Scholar] [CrossRef] [PubMed]
- Xie, B.; Wang, X.; Zhu, M.; Zhang, Z.; Hong, Z. CalS7 encodes a callose synthase responsible for callose deposition in the phloem. Plant J. 2011, 65, 1–14. [Google Scholar] [CrossRef] [PubMed]
- Jacobs, A.K.; Lipka, V.; Burton, R.A.; Panstruga, R.; Strizhov, N.; Schulze-Lefert, P.; Fincher, G.B. An Arabidopsis callose synthase, GSL5, is required for wound and papillary callose formation. Plant Cell 2003, 15, 2503–2513. [Google Scholar] [CrossRef] [PubMed]
- Nishimura, M.T.; Stein, M.; Hou, B.-H.; Vogel, J.P.; Edwards, H.; Somerville, S.C. Loss of a callose synthase results in salicylic acid-dependent disease resistance. Science 2003, 301, 969–972. [Google Scholar] [CrossRef] [PubMed]
- Kim, M.G.; Da Cunha, L.; McFall, A.J.; Belkhadir, Y.; DebRoy, S.; Dangl, J.L.; Mackey, D. Two Pseudomonas syringae type III effectors inhibit RIN4-regulated basal defense in Arabidopsis. Cell 2005, 121, 749–759. [Google Scholar] [CrossRef] [PubMed]
- Dong, X.; Hong, Z.; Chatterjee, J.; Kim, S.; Verma, D.P.S. Expression of callose synthase genes and its connection with Npr1 signaling pathway during pathogen infection. Planta 2008, 229, 87–98. [Google Scholar] [CrossRef] [PubMed]
- Enrique, R.; Siciliano, F.; Favaro, M.A.; Gerhardt, N.; Roeschlin, R.; Rigano, L.; Sendin, L.; Castagnaro, A.; Vojnov, A.; Marano, M.R. Novel demonstration of RNAi in citrus reveals importance of citrus callose synthase in defence against Xanthomonas citrisubsp. citri. Plant Biotechnol. J. 2011, 9, 394–407. [Google Scholar] [CrossRef] [PubMed]
- Chowdhury, J.; Schober, M.S.; Shirley, N.J.; Singh, R.R.; Jacobs, A.K.; Douchkov, D.; Schweizer, P.; Fincher, G.B.; Burton, R.A.; Little, A. Down-regulation of the glucan synthase-like 6 gene (HvGsl6) in barley leads to decreased callose accumulation and increased cell wall penetration by Blumeria graminis f. sp. hordei. New Phytol. 2016, 212, 434–443. [Google Scholar] [CrossRef] [PubMed]
- Nagaharu, U. Genome analysis in Brassica with special reference to the experimental formation of B. napus and peculiar mode of fertilization. Jpn. J. Bot. 1935, 7, 389–452. [Google Scholar]
- Chalhoub, B.; Denoeud, F.; Liu, S.; Parkin, I.A.; Tang, H.; Wang, X.; Chiquet, J.; Belcram, H.; Tong, C.; Samans, B. Early allopolyploid evolution in the post-Neolithic Brassica napus oilseed genome. Science 2014, 345, 950–953. [Google Scholar] [CrossRef] [PubMed]
- Gunstone, F.D. Production and Trade of Vegetable Oils; Wiley Online Library: Hoboken, NJ, USA, 2011. [Google Scholar]
- Maher, C.; Stein, L.; Ware, D. Evolution of Arabidopsis microRNA families through duplication events. Genome Res. 2006, 16, 510–519. [Google Scholar] [CrossRef] [PubMed]
- Wang, Y.; Tang, H.; DeBarry, J.D.; Tan, X.; Li, J.; Wang, X.; Lee, T.-H.; Jin, H.; Marler, B.; Guo, H. MCScanX: a toolkit for detection and evolutionary analysis of gene synteny and collinearity. Nucleic Acids Res. 2012, 40, e49. [Google Scholar] [CrossRef] [PubMed]
- Voigt, C.A. Callose-mediated resistance to pathogenic intruders in plant defense-related papillae. Front. Plant Sci. 2014, 5, 168. [Google Scholar] [CrossRef] [PubMed]
- Böhlenius, H.; Mørch, S.M.; Godfrey, D.; Nielsen, M.E.; Thordal-Christensen, H. The multivesicular body-localized GTPase ARFA1b/1c is important for callose deposition and ROR2 syntaxin-dependent preinvasive basal defense in barley. Plant Cell 2010, 22, 3831–3844. [Google Scholar] [CrossRef] [PubMed]
- Yun, M.H.; Torres, P.S.; El Oirdi, M.; Rigano, L.A.; Gonzalez-Lamothe, R.; Marano, M.R.; Castagnaro, A.P.; Dankert, M.A.; Bouarab, K.; Vojnov, A.A. Xanthan induces plant susceptibility by suppressing callose deposition. Plant Physiol. 2006, 141, 178–187. [Google Scholar] [CrossRef] [PubMed]
- Nomura, K.; Melotto, M.; He, S.-Y. Suppression of host defense in compatible plant–Pseudomonas syringae interactions. Curr. Opin. Plant Biol. 2005, 8, 361–368. [Google Scholar] [CrossRef] [PubMed]
- Hauck, P.; Thilmony, R.; He, S.Y. A Pseudomonas syringae type III effector suppresses cell wall-based extracellular defense in susceptible Arabidopsis plants. Proc. Natl. Acad. Sci. USA 2003, 100, 8577–8582. [Google Scholar] [CrossRef] [PubMed]
- Lowe, R.G.; Cassin, A.; Grandaubert, J.; Clark, B.L.; Van de Wouw, A.P.; Rouxel, T.; Howlett, B.J. Genomes and transcriptomes of partners in plant-fungal-interactions between canola (Brassica napus) and two Leptosphaeria species. PLoS ONE 2014, 9, e103098. [Google Scholar] [CrossRef] [PubMed]
- Becker, M.G.; Zhang, X.; Walker, P.L.; Wan, J.C.; Millar, J.L.; Khan, D.; Granger, M.J.; Cavers, J.D.; Chan, A.C.; Fernando, D.W. Transcriptome analysis of the Brassica napus–Leptosphaeria maculans pathosystem identifies receptor, signaling and structural genes underlying plant resistance. Plant J. 2017, 90, 573–586. [Google Scholar] [CrossRef] [PubMed]
- Mendes-Pereira, E.; Balesdent, M.-H.; Hortense, B.; Rouxel, T. Molecular phylogeny of the Leptosphaeria maculans–L. biglobosa species complex. Mycol. Res. 2003, 107, 1287–1304. [Google Scholar] [CrossRef] [PubMed]
- Williams, R.; Fitt, B.D. Differentiating A and B groups of Leptosphaeria maculans, causal agent of stem canker (blackleg) of oilseed rape. Plant Pathol. 1999, 48, 161–175. [Google Scholar] [CrossRef]
- Luna, E.; Pastor, V.; Robert, J.; Flors, V.; Mauch-Mani, B.; Ton, J. Callose deposition: A multifaceted plant defense response. Mol. Plant-Microbe Interact. 2011, 24, 183–193. [Google Scholar] [CrossRef] [PubMed]
- Barratt, D.P.; Kölling, K.; Graf, A.; Pike, M.; Calder, G.; Findlay, K.; Zeeman, S.C.; Smith, A.M. Callose synthase GSL7 is necessary for normal phloem transport and inflorescence growth in Arabidopsis. Plant Physiol. 2011, 155, 328–341. [Google Scholar] [CrossRef] [PubMed]
- Xie, B.; Deng, Y.; Kanaoka, M.M.; Okada, K.; Hong, Z. Expression of Arabidopsis callose synthase 5 results in callose accumulation and cell wall permeability alteration. Plant Sci. 2012, 183, 1–8. [Google Scholar] [CrossRef] [PubMed]
- Cannon, S.B.; Mitra, A.; Baumgarten, A.; Young, N.D.; May, G. The roles of segmental and tandem gene duplication in the evolution of large gene families in Arabidopsis thaliana. BMC Plant Biol. 2004, 4, 10. [Google Scholar] [CrossRef] [PubMed]
- Schuette, S.; Wood, A.J.; Geisler, M.; Geisler-Lee, J.; Ligrone, R.; Renzaglia, K.S. Novel localization of callose in the spores of Physcomitrella patens and phylogenomics of the callose synthase gene family. Ann. Bot. 2009, 103, 749–756. [Google Scholar] [CrossRef] [PubMed]
- Zhou, Z.; Dun, X.; Xia, S.; Shi, D.; Qin, M.; Yi, B.; Wen, J.; Shen, J.; Ma, C.; Tu, J. BnMs3 is required for tapetal differentiation and degradation, microspore separation, and pollen-wall biosynthesis in Brassica napus. J. Exp. Bot. 2011, 63, 2041–2058. [Google Scholar] [CrossRef] [PubMed]
- Enns, L.C.; Kanaoka, M.M.; Torii, K.U.; Comai, L.; Okada, K.; Cleland, R.E. Two callose synthases, GSL1 and GSL5, play an essential and redundant role in plant and pollen development and in fertility. Plant Mol. Biol. 2005, 58, 333–349. [Google Scholar] [CrossRef] [PubMed]
- Zhang, X.; Peng, G.; Kutcher, H.R.; Balesdent, M.-H.; Delourme, R.; Fernando, W.D. Breakdown of Rlm3 resistance in the Brassica napus–Leptosphaeria maculans pathosystem in western Canada. Eur. J. Pathol. 2015, 145, 659–674. [Google Scholar] [CrossRef]
- Liban, S.; Cross, D.; Kutcher, H.; Peng, G.; Fernando, W. Race structure and frequency of avirulence genes in the western Canadian Leptosphaeria maculans pathogen population, the causal agent of blackleg in brassica species. Plant Pathol. 2016. [Google Scholar] [CrossRef]
- Schenk, S.T.; Schikora, A. Staining of callose depositions in root and leaf tissues. Bio-Protocol 2015, 5, e1429. [Google Scholar] [CrossRef]
- Altschul, S.F.; Madden, T.L.; Schäffer, A.A.; Zhang, J.; Zhang, Z.; Miller, W.; Lipman, D.J. Gapped BLAST and PSI-BLAST: A new generation of protein database search programs. Nucleic Acids Res. 1997, 25, 3389–3402. [Google Scholar] [CrossRef] [PubMed]
- Tamura, K.; Stecher, G.; Peterson, D.; Filipski, A.; Kumar, S. MEGA6: molecular evolutionary genetics analysis version 6.0. Mol. Biol. Evol. 2013, 30, 2725–2729. [Google Scholar] [CrossRef] [PubMed]
- Chen, C.; Xia, R.; Chen, H.; He, Y. TBtools, a Toolkit for Biologists integrating various HTS-data handling tools with a user-friendly interface. bioRxiv 2018, 289660. [Google Scholar] [CrossRef]
- Bolger, A.M.; Lohse, M.; Usadel, B. Trimmomatic: A flexible trimmer for Illumina sequence data. Bioinformatics 2014, 30, 2114–2120. [Google Scholar] [CrossRef] [PubMed]
- Langmead, B.; Trapnell, C.; Pop, M.; Salzberg, S.L. Ultrafast and memory-efficient alignment of short DNA sequences to the human genome. Genome Biol. 2009, 10, R25. [Google Scholar] [CrossRef] [PubMed]
- Li, B.; Dewey, C.N. RSEM: Accurate transcript quantification from RNA-Seq data with or without a reference genome. BMC Bioinform. 2011, 12, 323. [Google Scholar] [CrossRef] [PubMed]
- Deng, W.; Wang, Y.; Liu, Z.; Cheng, H.; Xue, Y. HemI: A toolkit for illustrating heatmaps. PLoS ONE 2014, 9, e111988. [Google Scholar] [CrossRef] [PubMed]
© 2018 by the authors. Licensee MDPI, Basel, Switzerland. This article is an open access article distributed under the terms and conditions of the Creative Commons Attribution (CC BY) license (http://creativecommons.org/licenses/by/4.0/).