Pax3 Gene Regulated Melanin Synthesis by Tyrosinase Pathway in Pteria penguin

Fishery College, Guangdong Ocean University, 40 East Jiefang Road, Xiashan District, Zhanjiang 524025, China
*
Author to whom correspondence should be addressed.
Int. J. Mol. Sci. 2018, 19(12), 3700; https://doi.org/10.3390/ijms19123700
Submission received: 24 October 2018
/
Revised: 15 November 2018
/
Accepted: 17 November 2018
/
Published: 22 November 2018
(This article belongs to the Special Issue Transcriptional Regulation: Molecules, Involved Mechanisms and Misregulation)
Abstract
:The paired-box 3 (Pax3) is a transcription factor and it plays an important part in melanin synthesis. In this study, a new Pax3 gene was identified from Pteria penguin (Röding, 1798) (P. penguin) by RACE-PCR (rapid-amplification of cDNA ends-polymerase chain reaction) and its effect on melanin synthesis was deliberated by RNA interference (RNAi). The cDNA of PpPax3 was 2250 bp long, containing an open reading fragment of 1365 bp encoding 455 amino acids. Amino acid alignment and phylogenetic tree showed PpPax3 shared the highest (69.2%) identity with Pax3 of Mizuhopecten yessoensis. Tissue expression profile showed that PpPax3 had the highest expression in mantle, a nacre-formation related tissue. The PpPax3 silencing significantly inhibited the expression of PpPax3, PpMitf, PpTyr and PpCdk2, genes involved in Tyr-mediated melanin synthesis, but had no effect on PpCreb2 and an increase effect on PpBcl2. Furthermore, the PpPax3 knockdown obviously decreased the tyrosinase activity, the total content of eumelanin and the proportion of PDCA (pyrrole-2,3-dicarboxylic acid) in eumelanin, consistent with influence of tyrosinase (Tyr) knockdown. These data indicated that PpPax3 played an important regulating role in melanin synthesis by Tyr pathway in P. penguin.
1. Introduction
The winged pearl oyster Pteria penguin (Röding, 1798) (P. penguin) is an important marine cultured species that produces high-quality seawater pearl, whose value depends mainly on its color [1,2]. The melanin is the major pigment in P. penguin and largely affects the color and value of the pearl [3]. Moreover, the P. penguin is considered to be the best research model for melanin synthesis and color reconstruction in bivalve, because of its purely black shell in population. The mantle tissue is the main organ responsible for the formation and secretion of nacre, which is called as “mother of pearl” [4]. Inhibiting the synthesis and secretion of melanin in mantle might change the color of nacre in P. penguin.
Melanin plays an important role in a series of physiological processes, including pigmentation, skin photoprotection and aging [5]. In mammals, melanin synthesis is a complex process, and more than 40 genes participate in it [6,7,8]. Tyrosinase (Tyr) is a key rate-limiting enzyme in melanogenesis [9,10], because it catalyzes three different reactions in biosynthetic pathway of melanin [11]. The microphthalmia-associated transcription factor (Mitf) is a central regulator of melanogenesis, and it activates the transcription of several important genes, including Tyr, Cdk2 (cyclin-dependent kinase 2) and Bcl2 (B-cell lymphoma 2), to control melanocyte differentiation, growth and survival [6,8,12].
The paired-box 3 (Pax3) is a member of the paired-box family of transcription factors, and it participates in the development of central nervous system, skeletal muscles, and melanocytes [13,14]. Several studies have demonstrated that Pax3 is frequently expressed in normal melanocytes and aggregated melanomas [15]. PAX3 directly promotes Mitf transcription by binding the Mitf promoter, functioning with SOX10 (SRY box 10) and synergizing with the CREB (cyclic-AMP responsive element-binding protein) [16]. However, at the same time, PAX3 competes with MITF by occupying the enhancer of dopachrome tautomerase (Dct), a downstream enzyme that functions in melanin synthesis [17,18]. Despite extensive investigations about Pax3 being carried out over recent years, the effect of Pax3 on melanin synthesis in bivalves is still largely speculative.
The eumelanin, which gave organisms a brown-black color, was the main pigment in P. penguin [3]. Natural eumelanin is mainly composed of the monomer units 5,6-dihydroxyindole (DHI) and 5,6-dihydroxyindole-2-carboxylic acid (DHICA), with various ratios of DHI and DHICA [19]. The alkaline hydrogen peroxide oxidation of eumelanin yields pyrrole-2,3-dicarboxylic acid (PDCA) and pyrrole-2,3,5-tricarboxylic acid (PTCA) from DHI- and DHICA-derived units [5]. The PDCA and PTCA can be detected by high-performance liquid chromatography (HPLC), because they are insoluble in both acidic and alkaline solutions. Quantification of PDCA and PTCA has been extensively used to evaluate the amount and composition of eumelanin in a pigment sample using liquid chromatograph-tandem mass spectrometer (LC-MS/MS) [3,20].
In our previous works, we analyzed the crucial function of Tyr in menlanin synthesis of P. penguin [3]. In this study, a new Pax3 gene from P. penguin was identified, and its exact function in melanin synthesis was deliberated by RNA interference (RNAi) technology. The relative genes involved in the regulation of PpPax3 to melanin synthesis were enriched. A Pax3-Tyr-melanin axis was verified to exist in P. penguin.
2. Results
2.1. Cloning and Sequence Analysis of Pax3 cDNA in P. penguin
Based on the cDNA fragment of Pax3 from transcriptome database of P. penguin, the complete cDNA of PpPax3 gene was obtained by RACE-PCR. The PpPax3 cDNA consisted of an open reading frame (452–1816) of 1365bp, a 5′-untranslated region (UTR) of 451bp, and a 3′-UTR of 434bp with a typical polyadenylation signal sequence (AATAAA) and a 31bp poly (A) tail (Figure 1). The putative amino acid sequence was 454 amino acids long. No signal peptide and transmembrane domain were found in deduced PAX3 sequence. The predicted molecular mass of PpPax protein was 50.7 kDa, and the theoretical isoelectric point (pI) was 8.15. The full-length cDNA sequence of PpPax3 was submitted to Genebank with the accession no. MH558581.
2.2. Multiple Sequence Alignment and Phylogenetic Analysis
Amino acid sequence alignments of Pax3 gene from P. penguin and other species were performed. The PpPax3 shared the highest (69.2%) identity with Pax3 of Mizuhopecten yessoensis, 52.5% with Pax3 of Aplysia californica, 45.8% with Pax3 of Parasteatoda tepidariorum, and 45.0% with Pax3 of Branchiostoma belcheri. The deduced amino acid sequence comparison revealed a highly conserved paried box domain (PD) containing 127 amino acids and a homeodomain (HD) containing 59 amino acids (Figure 2) in PpPax3 gene. But the octapeptide motifs located between PD and HD were not obvious in Pax3 of P. Pengui, A. californica and P. tepidariorum.
The phylogenetic tree analysis was performed to indicate the evolutionary relationships of Pax3 from different species. As shown in Figure 2B, PpPax3 was close to Pax3 of M. yessoensis, one bivalve, with a support of 89%. Three Pax3 genes of mollusk referred, including P. penguin, M. yessoensis and Aplysia californica, were grouped into a close cluster. The Pax3 of Aplysia californica showed high homology with that of mollusk, agreed with their taxonomic relationships. All Pax3 genes of vertebrates referred were classified to a big clade, which exhibited farther distance to Pax3 of invertebrates.
2.3. PpPax3 mRNA Expression Profile in Different Tissues
The relative expression levels of PpPax3 gene in various tissues were compared by qRT-PCR (Quantitative real time polymerase chain reaction), with β-actin as an internal control. As shown in Figure 3, the PpPax3 has constitutive expression in mantle, gill, adductor muscle, digestive diverticulum, foot, testis and ovary. The highest expression level of PpPax3 was shown in the mantle, followed by the foot, without significant difference between them (P > 0.05). The expression of PpPax3 in the mantle was approximately 2-fold higher than that in adductor muscle, testis and ovary with obvious significant difference (P < 0.05). The digestive diverticulum has the lowest expression level. Since PpPax3 was mainly expressed in the mantle, which was responsible for nacre secretion, the mantle was selected for further studies.
2.4. PpPax3 Expression Was Inhibited by RNA Interference in P. penguin
To investigate the function of Pax3 in melanin synthesis of P. penguin, RNA interference was performed to inhibit the expression of PpPax3, and qRT-PCR was employed to evaluate the silencing effects. As shown in Figure 4A, the PpPax3 expression was reduced by 65.7% in the Pax3-siRNA1 group (P < 0.05) and 37.7% in the Pax3-siRNA2 group (P < 0.05) compared with the negative control (NC) group. This indicated that the expression of PpPax3 was significantly knocked down by RNA interference.
2.5. PpPax3 Silencing Affected the Expression of PpMitf, PpTyr, PpCreb2, PpBcl2 and PpCdk2 in P. penguin
After PpPax3 silencing, the transcripts of PpMitf, PpTyr, PpCreb2, PpBcl2 and PpCdk2 genes were analyzed. As shown in Figure 4B, after PpPax3 knockdown, the transcript of PpMitf, a central transcription factor of melanogenesis, was significantly decreased by 64.7% in the Pax3-siRNA1 (Small interfering RNA) group (P < 0.01) and 46.7% in the Pax3-siRNA2 group (P < 0.05). The expression of PpTyr, the key rate-limiting enzyme for melanin synthesis, was obviously reduced by 53.3% (P < 0.01) by Pax3-siRNA1 and 33.3% (P < 0.05) by Pax3-siRNA2. The PpCdk2 mRNA, a melanocyte growth-dependent kinase, was also depressed by 36.6% (P < 0.05) and 26.7% (P < 0.05). However, no significant difference was observed in PpCreb2 transcript (P > 0.05), a regulatory factor in melanin synthesis pathway. Moreover, the transcript of PpBcl2, an apoptosis-related gene, was raised up to 1.9 fold through Pax3-siRNA1 interference (P < 0.05).
2.6. PpPax3 Silencing Depressed Tyrosinase Activity in P. penguin
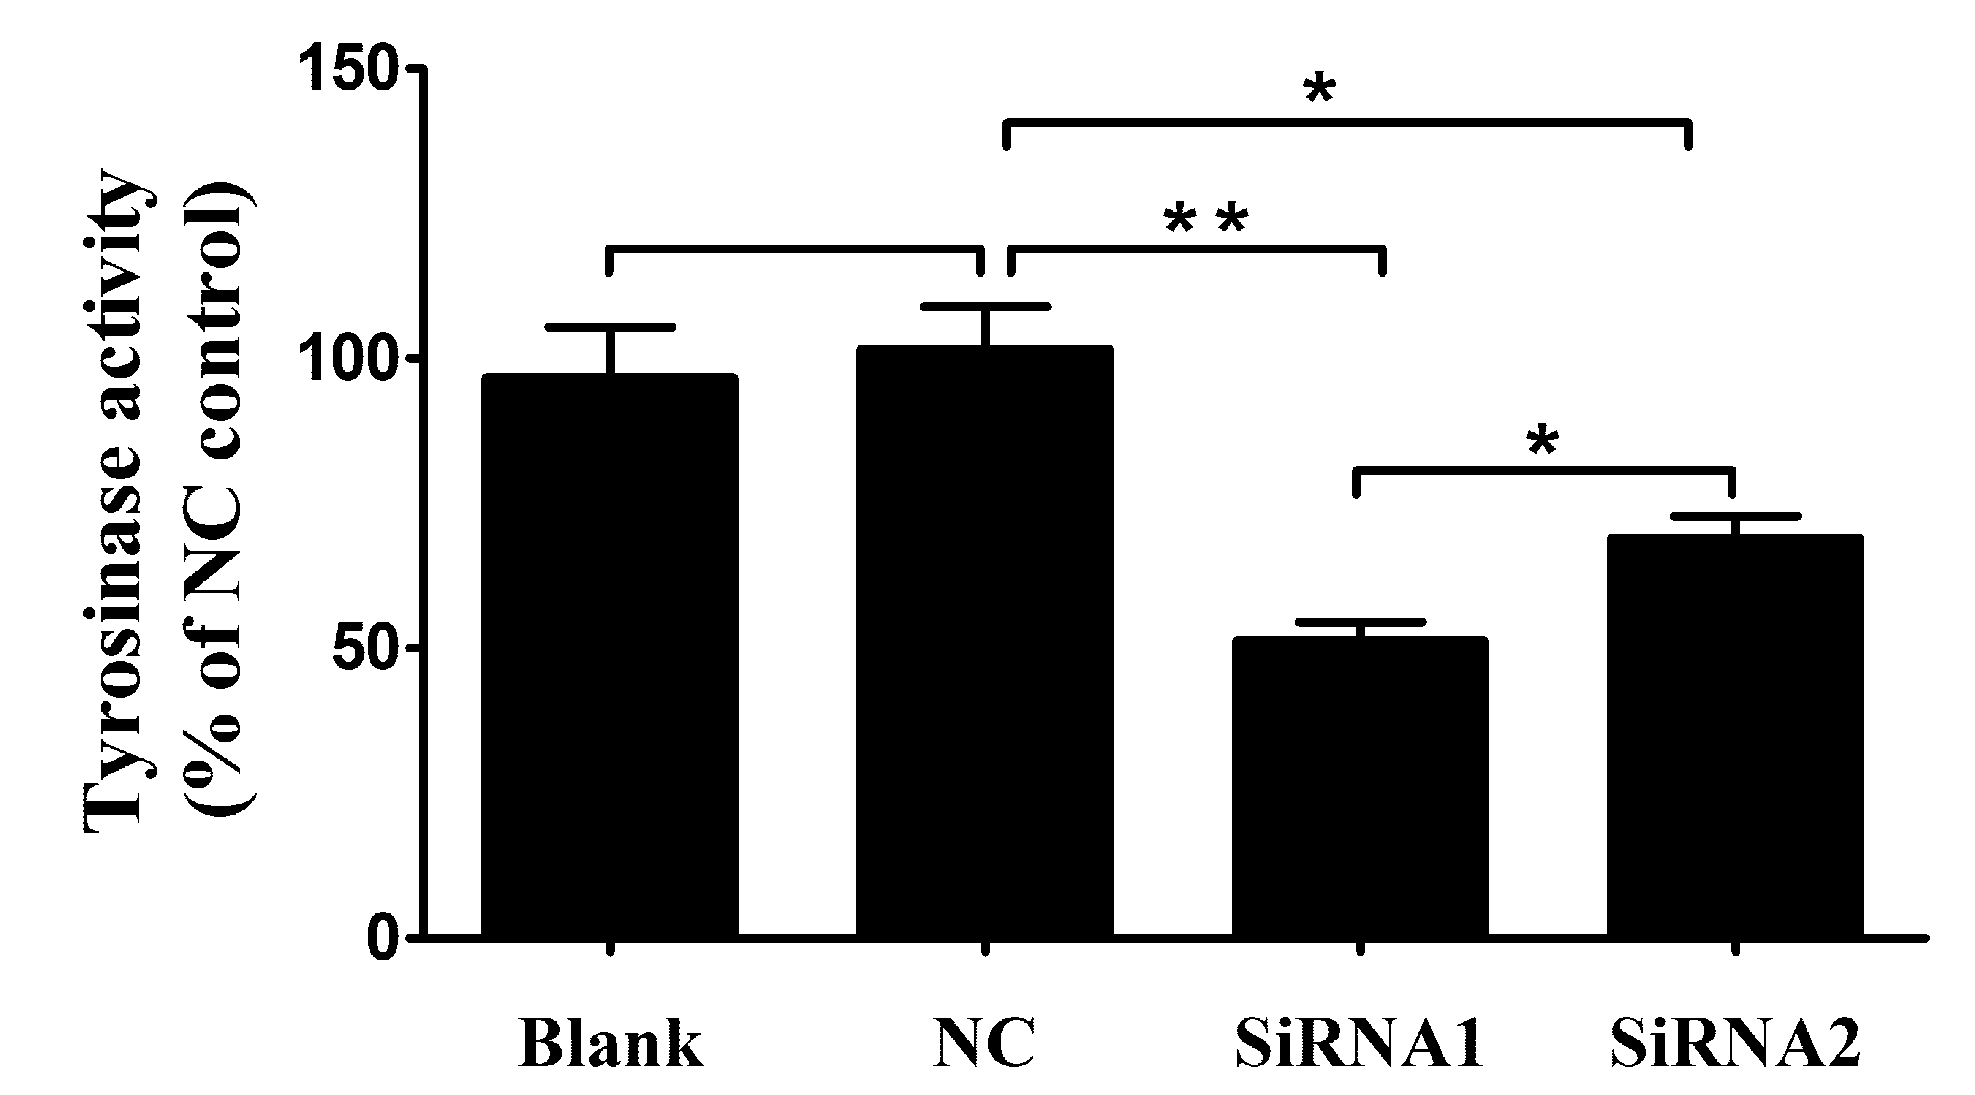
The tyrosinase activity was investigated according to the change in absorbance per minute at 475nm due to dopachrome formation from L-tyrosine of Levodopa (L-DOPA). As respected, after PpPax3 silencing, the tyrosinase activity was obviously decreased about 48.7% in siRNA1 group (P < 0.05) and 31.2% in siRNA2 group (P < 0.05) compared to NC group (Figure 5). This indicated that the PAX3 could obviously affect the tyrosinase activity in P. penguin.
2.7. PpPax3 Silencing Decreased Melanin Content and Proportion of PDCA
To further investigate the function of PpPax3 in melanin synthesis in P. penguin, we detected the content and composition of melanin in mantle after RNA interference using LC-MS/MS. As expected, by ion spectra examination, the alkaline hydrogen peroxide oxidation products of eumelanin from P. Penguin were identified as PDCA and PTCA, because their mass-to-charge ratio values were 156 and 199, respectively, consistent with their molecular weight [3]. The quantity of PDCA and PTCA was calculated according to the special area of peak, which appeared at 2.39 min and 3.58 min, respectively (Figure 6A). As shown in Figure 6B, the total content of PDCA and PTCA was obviously decreased from 674.6 ng/mg to 348.4 ng/mg (by 49.3%) in PpPax3-siRNA1 group and to 478.5 ng/mg (by 30.1%) in PpPax3-siRNA2 group (P < 0.05). The quantity of PDCA was inhibited by 63.5% and 42.6% in PpPax3-siRNA1 and PpPax3-siRNA2 groups (P < 0.05). The quantity of PTCA was inhibited by 45.0% and 26.1% groups (P < 0.05). Moreover, after RNA interference, the proportion of PDCA in total oxidation products was obviously decreased from 19.1% to 13.5% (SiRNA1) and 14.6% (SiRNA2) (P < 0.05).
3. Discussion
Pax gene family encodes transcription factors that are characterized by presence of the paired box domain (PD), an octapeptide motif and homeodomain (HD) [21,22]. As reported [23], after an extensive comparison, both PD and HD of PAX3 proteins among different species were present and highly conserved, but the octapeptide might be absent, such as in Gastropoda, Annelida and in the bivalvia Pinctada fucata. Similarly, in this study, the obvious octapeptide only was found in vertebrates, in B. belcheri and one bivalve (M. yessoensis). No clear homologue of octapeptide could be evidenced in P. penguin, A. californica and P. tepidariorum.
Based on sequence homologies of PD, Pax gene family has been classified into four subfamilies, Pax1/9, Pax2/5/8, Pax3/7 and Pax4/6. The Pax3/7 subfamily includes Pax3 gene and Pax7 genes, which have high similarity in amino acid sequence. The Pax3 and Pax7 genes existed in the form of a ancestral gene in protostomes, ascidians and amphioxus, and then were separated into two genes in vertebrates by duplication of the ancestral gene [21]. This might be an explanation for high homology between Pax3 of P. penguin and Pax7 of other species, which implied the functional diversity of Pax3 in P. penguin.
Our previous studies showed that tyrosinase was a key melanin synthase, and it played a dominant role in melanin synthesis and color formation of P. penguin [3]. In this report, the data showed that the knockdown of PpPax3 caused a significant decrease in Tyr expression, tyrosinase activity and melanin content, similar to the influence of Tyr silencing [3]. The finding illustrated that PAX3 could affect the melanin synthesis by regulating the expression of Tyr. A Pax3-Tyr-melanin axis might exist in melanin synthesis pathway of P. penguin.
In humans, microphthalmia-associated transcription factor (MITF), known as a master regulator of melanogenesis, binded to the highly conserved binding motif in the regulatory region of the tyrosinase (TYR) promoter, and strongly stimulated the melanocyte-specific transcription of Tyr gene [7,24]. Pax3 directly activated expression of Mitf and indirectly affected the expression of Tyr in mice [12,20]. However, compared with vertebrates, little is known about whether the MITF also involve in melanin synthesis in bivalve. Our data showed that PpPax3 silencing significantly cut down the expression of PpMitf and obviously depressed the transcription of PpTyr. This illustrated that Mitf took part in the melanin synthesis of P. penguin. The PpPax3 might affect Tyr expression and melanin synthesis through regulation to Mitf, similar to that in mammals. Further studies were needed to specify the existence of Pax3-Mitf-Tyr pathway in melanin synthesis of P. penguin.
As MITF is a multifunctional transcription factor that activates the transcription of various genes involved not only in melanin synthesis, but also in melanocyte proliferation and survival in mammal [12,25], we speculated that Pax3 might also regulate melanocyte growth and survival by Mitf in P. penguin. The expressions of PpCdk2 and PpBcl2 were analyzed after PpPax3 interference, because Cdk2 and Bcl2 respectively were important genes in melanocyte proliferation and survival in mammals, and both of them were direct MITF target genes [26,27]. In this study, the PpPax3 silencing obviously decreased the PpCdk2 expression, which implied PpPax3 played an important part in control of melanocyte growth in P. penguin. Meanwhile, the expression of PpBcl2 was lightly increased after PpPax3 silencing, which implied that PpPax3 played an important part in control of cell survival. It was worth mentioning that the PpPax3 silencing led to an obvious decrease of PpMitf, but a light increase of PpBcl2. A possible explanation for this contradiction was that the reduction of tyrosinase protein by PpPax3 silencing might partly damage of normal cells functions, because tyrosinase involved in several important physiological processes including pigment synthesis [9,28], innate immunity [29] and wound healing [30]. The cell damage led to the up-regulation of cell apoptosis gene PpBcl2 through another pathway, and antagonized the depression of PpBcl2 by PpMitf decrease.
In human melanocytes, PAX3 partners with SOX10 to induce melanocyte differentiation and melanin synthesis [31]. The CREB (cyclic-AMP responsive element-binding protein), as a cofactor, was inputted to PAX3 and Sox10, so that all three transcription factors induce the expression of Mitf [8,11,32,33]. In this report, the silencing of Pax3 did not affect the expression of Creb, which indicated that CREB was not the downstream gene of Pax3 in P. penguin. Further, the alone knockdown of PpPax3 inhibited the expression of PpMitf and PpTyr, which implied that the regulation of PpPax3 to PpMitf and PpTyr could happen independently of CREB change of in P. penguin. The CREB might just work as a cofactor of PAX3 to enhance the regulation effect of PpPax3 on melanin synthesis in P. penguin.
RNA interference is a powerful tool and has been widely used to knock down genes to analyze the genes function, especially in human. For instance, Pax3 SiRNA was transfected in to human metastatic melanoma to elaborate the function of Pax3 in melanoma growth and survival [34]. Basing on these new technologies, in human, several widely-believed melanin synthesis pathways were reported, such as the cAMP(cyclic adenosine monophosphate) pathway and the Wnt (wingless-type MMTV integration site family) pathway. The cAMP pathway is a main signal pathway, which goes in the axis: MSH (melanocyte simulating hormone)-MC1R (melanocortin 1 receptor)-cAMP (cycle AMP)–PKA (protein kinase A)–CREB–MITF–tyrosinase. In Wnt pathway, PAX3, partnering with SOX10, induces the expression of Mitf, and then affects the expression of Tyr. However, in bivalve, the melanin synthesis pathway is still unclear, although some important genes involved melanin synthesis has been cloned and analyzed, such as tyrosinase fom P. fucata [35], Hyriopsis cumingii [4] and Crassostrea gigas [36], Mitf from Meretrix petechialis [37], Pax3 from P. fucata, M. yessoensis and A. californica [23]. There has been no clear axis or pathway predicted in bivalve so far. In this research, by functional analysis, we believed that a Pax3-Mitf-tyr axis was existent in P. penguin, similarly to in humans. The PAX3, by inducing the Mitf expression, regulated the melanocyte differentiation, proliferation and survival. However, whether Wnt pathway existed and whether CREB worked as a member of Wnt pathway in P. penguin were still problems that deserved further research.
4. Materials and Methods
4.1. Experimental Animals, RNA Isolation and cDNA Synthesis
The Pteria penguin (Röding, 1798) samples used in this study were obtained from Weizhou Island in Beihai, Guangxi Province, China. All animals were about two years old, with shell length ranging from 12 and 15 cm. They were cultivated with the recirculating seawater at 25–26 °C for one week before the experiment.
Total RNA from mantle (pallial zone and marginal zone), gill, adductor muscle, digestive diverticulum, foot, testis and ovary of P. penguin were extracted using RNeasyMini Kit (Qiagen, Gaithersburg, MD, USA), according to the manufacturer’s instructions. The integrity and quantity of RNA were detected by electrophoresis on 1% agarose gels and NanoDrop ND1000 Spectrophotometer. The cDNA was synthesized from total RNA using a Superscript II polymerase kit (TransGen, Beijing, China).
4.2. cDNA Cloning and Sequence Analysis
The full-length cDNA sequence of Pax3 was obtained with SMART RACE cDNA Amplification Kit (Clontech, Mountain View, CA, USA) and Advantage 2 cDNA Polymerase Mix (Clontech, Mountain View, CA, USA) following the manufacturer’s protocol. The nested-PCR was employed to enrich the specific DNA band. The test-PCR was used to detect the correctness of linked nucleotide sequence. All used primers were listed in Table 1.
The full-length cDNA of Pax3 was analyzed by the BLAST program (http://www.ncbi.nlm.nih.gov/). ORF Finder (https://www.ncbi.nlm.nih.gov/orffinder/) was used to characterize the open reading fragment (ORF). Signal 4.1 (http://www.cbs.dtu.dk/services/SignalP/) and TMHMM program (http://www.cbs.dtu. dk/services/TMHMM/) were used to predict signal peptide and transmembrane. Multiple sequence alignments and phylogenetic tree were created using Clustal W and MEGA 6. The protein molecular weight and theoretical pI were analyzed using program tools (http://web.expasy.org/cgibin/protparam/protparam).
4.3. Quantitative Real-Time PCR (qRT-PCR) Analysis
The qRT-PCR assays were performed using Thermo Scientific DyNAmo Flash SYBR Green qPCR Kit (Thermo scientific, Waltham, MA, USA) and the Applied Biosystems 7500/7500 Fast Real-time System (ABI, Carlsbad, CA, USA). Each sample was run in triplicate, along with the internal control gene β-actin. The specific primers were listed in Table 1. The calibration curve was established by several dilutions of standard samples, and used as a linear regression model. The 2−∆∆CT method was applied to calculate the relative expression levels of genes.
4.4. RNA Interference Experiment
RNA interference was used to analyze the function of PpPax3 gene. The PpPax3-siRNA1 and PpPax3-SiRNA2 were synthesized to specially silence the conserved domain of PpPax3. The GFP-SiRNA was synthesized from pEGFP-N3 plasmid, a eukaryotic-expression vector encoding green fluorescent protein, as a negative control (NC), and RNase-free water was used as a blank control (primers as Table 1). Six individuals were used in each treatment group. When RNA interference experiment, the experimental individuals were gotten out from seawater and dried in air until the shells were slightly open. Then, 100 μL SiRNAs (small interfering RNA) at a final concentration of 1 μg/μL were gently injected into adductor muscle of experimental individuals, which was then put into seawater and cultivated for 3 days in the lab to have a recovery [38]. At the 4th day, the experimental individuals were injected with same dose of SiRNAs again, and had another recovery for 3 days. At the 7th day, the experimental animals were killed and the tissues were collected for RNA extraction, tyrosinase activity assay and melanin analysis.
4.5. Tyrosinase Activity Assays
Tyrosinase activity assays were performed as described previously with minor modification [19,39]. Briefly, 1g mantle was homogenized in 1 mL of 0.1 mol/L phosphate buffer (pH 6.8) and centrifugated to obtain the tissue supernate. The 0.5mL of 5 mmol/L L-DOPA (3,4-dihydroxyphenylalanine) was mixed with 2.4 mL of 0.1 mmol/L PBS (phosphate buffer saline), followed by the addition of 0.5 mL of tissue supernate. The mixture was incubated at 37 °C for 30 min, and then the absorbance of the mixture was measured at 475 nm. The total tryosinase activity of every group was represented by the change of absorbance value in 30 min. One unit (U) of the tyrosinase activity was defined as increased or decreased absorbancy per minute at 475 nm. The relative tyrosinase activity was shown using the percentage of every group in NC group.
4.6. Isolation and Oxidation of Total Melanin
The total melanin from mantle of P. penguin was isolated and oxidized following our previous report [3]. Briefly, 1 g mantle sample was finely homogenized and incubated in 15 mL phosphate buffer (pH 7.4) with 2% (m/V) papain at 55 °C for 20 h. The mixture was centrifuged at 10,000 rpm for 10min to obtain the precipitate, which was successively washed with 2 mL mineral ether for 3 times, 2 mL ethanol for 3 times and 2 mL water 3 times. Then, the black precipitate was dried and measured as raw melanin production.
The raw melanin production was dissolved in 8.6 mL of 1 mol/L K2CO3 and 0.8 mL of 30% H2O2. The mixture was heated under reflux at 100 °C for 20 min. After cooling, 0.4 mL of 10% Na2SO3 was added to end the reaction. The mixture was acidified to pH 1.0 with 5 mL of 6 mol/L HCl and then was extracted twice with 70 mL of ether. The supernanant was collected and dried to obtain crystalline residue, which was finally redissolved in mobile phase and filtered by 0.45 μm organic membrane for liquid chromatograph-tandem mass spectrometer (LC-MS/MS) analysis.
4.7. LC-MS/MS Assay of Melanin
The content and component of melanin were detected by LC-MS/MS according to previous description [40] with some modification. The chromatographic separation was performed using an Acquity ultraperformance liquid chromatography (UPLC) system (Waters, Milford, MA, USA) consisting of a Waters ACQUITY UPLC HSS T3 (2.1 × 50 mm, 1.7 μm particle size). The mobile phase A and B was 0.1% (v/v) of formic acid in deionized water and 0.1% (v/v) of formic acid in methanol, respectively. The ratio of mobile phase A in total mobile phase was gradually decreased from 90% to 0% within 5 min. The cycle time was 5 min per injection. Analyses were performed at 40 °C at a flow rate of 0.3 mL/min. MS/MS detection was performed using a Xevo TQ triple quadrupole mass spectrometer operated in positive electrospray ionization (ESI) mode similar to Yu et al. [3]. The source temperature and desolvation temperature were 150 °C and 550 °C, respectively. The cone gas flow, desolvation gas flow and collision gas flow were 50 L/h, 1100 L/h and 0.14 mL/min (argon), respectively. The analytes were monitored in multireaction monitoring mode (MRM). Specific parameters were given as Table 2.
4.8. Statistical Analysis
ANOVA analysis was performed using SPSS 19.0 (IBM, Armonk, NY, USA) to detect the significance of difference among different samples. Significant difference was indicated by * (P < 0.05), highly significant difference was indicated by ** (P < 0.01) and extremely significant difference was indicated by *** (P < 0.001).
5. Conclusions
In this study, we characterized a new Pax3 gene from P. penguin. Tissue expression profile showed that PpPax3 had the highest expression in mantle, a nacre-formation related tissue. The PpPax3 silencing significantly inhibited the transcription of PpPax3, PpMitf, PpTyr and PpCdk2, genes involved in Tyr-mediated melanin synthesis, but had no effect on PpCreb2 and an increase effect on PpBcl2. Furthermore, the PpPax3 silencing obviously decreased the tyrosinase activity, the total content of eumelanin and the proportion of PDCA in eumelanin, similar to the influence of Tyr silencing. Thus, we believed that PpPax3 played an important role in melanin synthesis by indirectly regulating the expression of Tyr in P. penguin. The Pax3-Tyr-melanin axis was considered a potential strategy in melanin synthesis of P. penguin.
Author Contributions
F.Y. and B.Q. conceived and designed the experiments; F.Y., D.L. and Z.Z. performed the experiments; R.H. analyzed the data; Y.D. contributed materials; F.Y. drafted the manuscript; B.Q. made a critical revision of the manuscript.
Funding
This work was supported by the Guangdong Provincial Science and Technology Program (2016A020210115); Guangdong Marine Fishery Development Foundation (B201601-Z08); Doctoral Scientific Research Foundation of Guangdong Ocean University (E15041) and Outstanding Young Teacher Foundation of Guangdong Ocean University (2014004).
Conflicts of Interest
The authors declare no conflict of interest.
Abbreviations
| RNAi | RNA interference |
| UTR | untraslated region |
| LC-MS/MS | liquid chromatograph-tandem mass spectrometer |
| PDCA | pyrrole-2,3-dicarboxylic acid |
| PTCA | pyrrole-2,3,5-tricarboxylic acid |
| DHI | 5,6-dihydroxyindole |
| DHICA | pyrrole-2,3,5-tricarboxylic acid |
| CREB | cyclic-AMP responsive element-binding protein |
| MITF | microphthalmia-associated transcription factor |
| Tyr | tyrosinase |
| PAX3 | paired-box 3 |
| BCL2 | B-cell lymphoma 2 |
| CDK2 | cyclin-dependent kinase 2 |
| SOX10 | SRY box 10 |
| cAMP | Cyclic Adenosine monophosphate |
References
- Li, H.; Liu, B.; Huang, G.; Fan, S.; Zhang, B.; Su, J.; Yu, D. Characterization of transcriptome and identification of biomineralization genes in winged pearl oyster (Pteria penguin) mantle tissue. Comp. Biochem. Physiol. D Genom. Proteom. 2017, 21, 67–76. [Google Scholar] [CrossRef] [PubMed]
- Naganuma, T.; Hoshino, W.; Shikanai, Y.; Sato, R.; Liu, K.; Sato, S.; Muramoto, K.; Osada, M.; Yoshimi, K.; Ogawa, T. Novel Matrix Proteins of Pteria penguin Pearl Oyster Shell Nacre Homologous to the Jacalin-Related b-Prism Fold Lectins. PLoS ONE 2014, 9, e112326. [Google Scholar] [CrossRef]
- Yu, F.; Pan, Z.; Qu, B.; Yu, X.; Xu, K.; Deng, Y.; Liang, F. Identification of a tyrosinase gene and its functional analysis in melaninsynthesis of Pteria penguin. Gene 2018, 656, 1–8. [Google Scholar] [CrossRef] [PubMed]
- Chen, X.; Liu, X.; Bai, Z.; Zhao, L.; Li, J. HcTyr and HcTyp-1 of Hyriopsis cumingii, novel tyrosinase and tyrosinase-related protein genes involved in nacre color formation. Comp. Biochem. Physiol. B Biochem. Mol. Biol. 2017, 204, 1–8. [Google Scholar] [CrossRef] [PubMed]
- Ito, S.; Wakamatsu, K.; Glass, K.; Simon, J.D. High-performance liquid chromatography estimation of cross-linking of dihydroxyindole moiety in eumelanin. Anal. Biochem. 2013, 434, 221–225. [Google Scholar] [CrossRef] [PubMed]
- Cheli, Y.; Ohanna, M.; Ballotti, R.; Bertolotto, C. Fifteen-year quest for microphthalmia-associated transcription factor target genes. Pigm. Cell Melanoma Res. 2010, 23, 27–40. [Google Scholar] [CrossRef] [PubMed]
- Busca, R.; Ballotti, R. Cyclic AMP a key messenger in the regulation of skin pigmentation. Pigment Cell Res. 2000, 13, 60–69. [Google Scholar] [CrossRef]
- Siominski, A.; Tobin, D.J.; Shibahara, S.; Wortsman, J. Melanin pigmentation in mammalian skin and its hormonal regulation. Physiol. Rev. 2004, 84, 1155–1228. [Google Scholar] [CrossRef] [PubMed]
- Hofreiter, M.; Schoneberg, T. The genetic and evolutionary basis of colour variation in vertebrates. Cell. Mol. Life Sci. 2010, 67, 2591–2603. [Google Scholar] [CrossRef] [PubMed]
- Cieslak, M.; Reissmann, M.; Hofreiter, M.; Ludwig, A. Colours of domestication. Biol. Rev. Camb. Philos. Soc. 2011, 86, 885–899. [Google Scholar] [CrossRef] [PubMed]
- Inoue, Y.; Hasegawa, S.; Yamada, T.; Date, Y.; Mizutani, H.; Nakata, S.; Matsunaga, K.; Akamatsu, H. Analysis of the effects of hydroquinone and arbutin on the differentiation of melanocytes. Biol. Pharm. Bull. 2013, 36, 1722–1730. [Google Scholar] [CrossRef] [PubMed]
- Vachtenheim, J.; Borovansky, J. “Transcription physiology” of pigment formation in melanocytes: Central role of MITF. Exp. Dermatol. 2010, 19, 617–627. [Google Scholar] [CrossRef] [PubMed]
- Lee, D.H.; Ahn, S.S.; Kim, J.B.; Lim, Y.; Lee, Y.H.; Shin, S.Y. Downregulation of Melanocyte-Stimulating Hormone-Induced Activation of the Pax3-MITF-Tyrosinase Axis by Sorghum Ethanolic Extract in B16F10 Melanoma Cells. Int. J. Mol. Sci. 2018, 19, 1640. [Google Scholar] [CrossRef] [PubMed]
- Donoghue, P.; Graham, A.; Kelsh, R.N. The origin and evolution of the neural crest. Bioessay 2008, 30, 530–541. [Google Scholar] [CrossRef] [PubMed] [Green Version]
- Medic, S.; Ziman, M. Pax3 expression in normal skin melanocytes and melanocytic lesions (naevi and melanomas). PLoS ONE 2010, 5, e9977. [Google Scholar] [CrossRef] [PubMed]
- Cao, J.; Dai, X.; Wan, L.; Wang, H.; Zhang, J.; Goff, P.S.; Sviderskaya, E.V.; Xuan, Z.; Xu, Z.; Xu, X.; et al. The E ligase APC/CCdh1 promotes ubiquitylation-mediated proteolysis of PAX3 to suppressmelanocyte proliferation and melanoma growth. Cancer 2015, 8, ra87. [Google Scholar] [CrossRef]
- Lang, D.; Lu, M.; Huang, L.; Engleka, K.A.; Zhang, M.; Chu, E.; Lipner, S.; Skoultchi, A.; Millar, S.E.; Epstein, J.A. Epstein1Pax3 functions at a nodal point inmelanocyte stem cell differentiation. Nature 2005, 433, 884–887. [Google Scholar] [CrossRef] [PubMed]
- D’Mello, S.; Finlay, G.J.; Baguley, B.C.; Askarian-Amiri, M.E. Signaling pathways in melanogenesis. Int. J. Mol. Sci. 2016, 17, 1144. [Google Scholar] [CrossRef]
- Szekely-Klepser, G.; Wade, K.; Wooolson, D.; Brown, R.; Fountain, S.; Kindt, E. A validated LC/MS/MS method for the quantification of pyrrole-2,3,5-tricarboxylic acid (PTCA), a eumelanin specific biomarker, in human skin punch biopsies. J. Chromatogr. B Anal. Technol. Biomed. Life Sci. 2005, 826, 31–40. [Google Scholar] [CrossRef] [PubMed]
- Ito, S.; Nakanishi, Y.; Valenzuela, R.K.; Brilliant, M.H.; Kolbe, L.; Wakamatsu, K. Usefulness of alkaline hydrogen peroxide oxidation to analyze eumelanin and pheomelanin in various tissue samples: Application to chemical analysis of human hair melanins. Pigment Cell Melanoma Res. 2011, 24, 605–613. [Google Scholar] [CrossRef] [PubMed]
- Akolkar, D.B.; Asaduzzaman, M.; Kinoshita, S.; Asakawa, S.; Watabe, S. Characterization of Pax3 and Pax7 genes and their expression of patterns during different development and growth stages of Japanese pufferfish Takifugu rubripes. Gene 2016, 575, 21–28. [Google Scholar] [CrossRef] [PubMed]
- Lang, D.; Powell, S.K.; Plummer, R.S.; Young, K.P.; Ruggeri, B.A. PAX genes: Roles in development, pathophysiology, and cancer. Biochem. Pharmacol. 2007, 73, 1–14. [Google Scholar] [CrossRef] [PubMed]
- Navet, S.; Buresi, A.; Baratt, S.; Andouche, A.; Bonnaud-Ponticelli, L.; Bassaglia, Y. The Pax gene family: Highlights from cephalopods. PLoS ONE 2017, 12, e0172719. [Google Scholar] [CrossRef]
- Yasumoto, K.; Yokoyama, K.; Shibata, K.; Tomita, Y.; Shibahara, S. Microphthalmia-associated transcription factor as a regulator for melanocyte-specific transcription of the human tyrosinase gene. Mol. Cell Biol. 1994, 14, 8058–8070. [Google Scholar] [CrossRef] [PubMed]
- Yang, G.; Li, Y.; Nishimura, E.K.; Xin, H.; Zhou, A.; Guo, Y.; Dong, L.; Denning, M.F.; Nickoloff, B.J.; Gui, R. Inhibition of Pax3 by TGF-βmodulates melanocyte viability. Mol. Cell 2008, 32, 554–563. [Google Scholar] [CrossRef] [PubMed]
- Du, J.; Widlund, H.R.; Horstmann, M.A.; Ramaswamy, S.; Ross, K.; Huber, W.E.; Nishimura, E.K.; Golub, T.R.; Fisher, D.E. Critical role of CDK2 for melanoma growth linked to its melanocyte specific transcriptional regulation by MITF. Cancer Cell 2004, 6, 565–576. [Google Scholar] [CrossRef] [PubMed]
- Seiberg, M. Age-induced hair graying-the multiple effects of oxidative stress. Int. J. Cosmet. Sci. 2013, 35, 532–538. [Google Scholar] [CrossRef] [PubMed]
- Kim, T.K.; Lin, Z.; Tidwell, W.J.; Li, W.; Slominski, A.T. Melatonin and its metabolites accumulate in the human epidermis in vivo and inhibit proliferation and tyrosinase activity in epidermal melanocytes in vitro. Mol. Cell. Endocrinol. 2015, 404, 1–8. [Google Scholar] [CrossRef] [PubMed] [Green Version]
- Cerenius, L.; Lee, B.L.; Söderhäll, K. The proPO-system: Pros and cons for its role in invertebrate immunity. Trends Immunol. 2008, 29, 263–271. [Google Scholar] [CrossRef] [PubMed]
- Aguilera, F.; McDougall, C.; Degnan, B.M. Origin, evolution and classification of type-3 copper proteins: Lineage-specific gene expansions and losses across the Metazoa. BMC Evol. Biol. 2013, 13, 96. [Google Scholar] [CrossRef]
- Suzuki, N.; Mutai, H.; Miya, F.; Tsunoda, T.; Terashima, H.; Morimoto, N.; Matsunaga, T. A case report of reversible generalized seizures in a patient with Waardenburg syndrome associated with a novel nonsense mutation in the penultimate exon of SOX10. BMC Pediatr. 2018, 18, 171. [Google Scholar] [CrossRef] [PubMed]
- Moustakas, A. TGF-b Targets PAX3 to Control Melanocyte Differentiation. Cell 2008, 15, 797–799. [Google Scholar] [CrossRef] [PubMed]
- Ortonne, J.P.; Ballotti, R. Melanocyte biology and melanogenesis: What’s new? J. Dermatol. Treat. 2018, 9, 1–28. [Google Scholar] [CrossRef]
- He, S.; Li, C.; Slobbe, L.; Glover, A.; Marshall, M.; Baguley, B.C.; Eccles, M.R. Pax3 knockdwon in metastatic melanoma cell lines does not reduce MITF expression. Melanoma Res. 2011, 21, 24–34. [Google Scholar] [CrossRef] [PubMed]
- Takgi, R.; Miyashita, T. A cDNA cloning of a novel alpha-class tyrosinase of Pinctada fucata: Its expression analysis and characterization of the expressed protein. Enzym. Res. 2014, 780549, 1–9. [Google Scholar] [CrossRef] [PubMed]
- Feng, D.; Li, Q.; Yu, H.; Zhao, X.; Kong, L. Comparative transcriptome analysis of the Pacific oyster Crassostrea gigas characterized by shell colors: Identification of genetic bases potentially involved in pigmentation. PLoS ONE 2015, 10, e0145257. [Google Scholar] [CrossRef]
- Zhang, S.; Wang, H.; Yu, J.; Jiang, F.; Yue, X.; Liu, B. Identification of a gene encoding microphthalimia-associated transcription factor and its association with shell color in the clam Memetrix petechialis. Comp. Biochem. Physiol. B Biochem. Mol. Biol. 2018, 225, 75–83. [Google Scholar] [CrossRef] [PubMed]
- Yan, F.; Luo, S.; Jiao, Y.; Deng, Y.; Du, X.; Huang, R.; Wang, Q.; Chen, W. Molecular characterization of the BMP7 gene and its potential role in shell formation in pinctada martensii. Int. J. Mol. Sci. 2014, 15, 21215–21228. [Google Scholar] [CrossRef] [PubMed]
- Choi, T.Y.; Sohn, K.C.; Kim, J.H.; Kim, S.M.; Kim, C.H.; Hwang, J.S.; Lee, J.H.; Kim, C.D.; Yoon, T.J. Impact of NAD(P)H: Quinone oxidoreductase-1 on pigmentation. J. Investig. Dermatol. 2010, 130, 784–792. [Google Scholar] [CrossRef] [PubMed]
- Ito, S.; Wakamatsu, K. Chemical degration of melanins: Application to identification of dopamine-melanin. Pigment Cell Res. 1998, 11, 120–126. [Google Scholar] [CrossRef]
Figure 1.
Nucleotide and deduced amino acid sequences of PpPax3. PD (paried box domain) and HD (homeodomain) were shown in grey boxes. The ORF (open reading frame) and deduced amino acid sequences were shown in uppercase. The 5′-UTR (untranslated region) and 3’-UTR were shown in lowercase. The initiation codon (ATG) and the stop codon (TGA) were boxed. The putative polyadenylation signal (aataaa) was underlined.

Figure 2.
Sequence alignment and phylogenetic analysis. (A) Multiple sequence comparison of Pax3 among different species including Pteria penguin(Röding, 1798) (PpPax3, MH558581), Mizuhopecten yessoensis (MyPax3, XP_021364914.1), Aplysia californica (AcPax3, XP_012943435.1), Parasteatoda tepidariorum (PtPax3/7, BBD75270.1), Branchiostoma belcheri (BbPax3/7, ABK54280.1), Danio rerio (DrPax3, AAC41253.1), Homo sapiens (HsPax3, NP_852122.1), Xenopus laevis (XlPax3, AAI08574.1) and Gallus gallus (GgPax3, BAB85652.1). The conserved amino acids were written in black background, and similar amino acids were shaded in green and pink. PD, octapeptide motif and HD were indicated in blue boxes. (B) Phylogenetic tree of Pax3 genes. Numbers in the branches represented the bootstrap values (as a percentage). ▲ meaned the Pax3 of P. penguin.


Figure 3.
Relative expression of PpPax3 in various tissues of P. penguin estimated by qRT-PCR. Each bar was a mean of 6 pearl oysters. Error bars were the SD. Different letters (a, b, c and d) meaned significant difference (P < 0.05).
Figure 3.
Relative expression of PpPax3 in various tissues of P. penguin estimated by qRT-PCR. Each bar was a mean of 6 pearl oysters. Error bars were the SD. Different letters (a, b, c and d) meaned significant difference (P < 0.05).

Figure 4.
Expression of PpPax3, PpMitf, PpTyr, PpCreb2, PpBcl2 and PpCdk2 after PpPax3 RNA interference (RNAi). (A) Expression of PpPax3. (B) Expression of PpMitf, PpTyr, PpCreb2, PpBcl2 and PpCdk2. The qRT-PCR was done with RNA samples from blank group (RNase-free water), NC group (GFP-siRNA), PpPax3-siRNA1 group and PpPax3-siRNA2 group. The β-actin of P. penguin was used as an internal control. Each bar was a mean of 6 individuals. Significant difference was indicated by * (P < 0.05) and highly significant difference was indicated by ** (P < 0.01).

Figure 5.
The tyrosinase activity of the control groups and RNA interference groups. The tyrosinase activity was performed with samples from blank group (RNase-free water), NC group (green fluorescent protein (GFP)-siRNA), PpPax3-siRNA1 group and PpPax3-siRNA2 group. The tyrosinase activity was shown with percentage of every group and NC. Each bar was a mean of 6 pearl oysters. Significant difference was indicated by * (P < 0.05) and highly significant difference was indicated by ** (P < 0.01).

Figure 6.
LC-MS/MS analysis of oxidation products of melanin in P. penguin. (A) HPLC (High Performance Liquid Chromatography) chromatograms of oxidation products of melanin from NC group and RNAi groups. (B) The content of PDCA and PTCA from NC group and RNAi groups. Each bar was a mean of 6 pearl oysters. * meaned significant difference (P < 0.05); ** meaned very significant difference (P < 0.01); *** meaned extremely significant difference (P < 0.001).


Table 1.
Primers used in the study.
| Primer | Sequence (5′–3′) | Application |
|---|---|---|
| PpPax3-outer-F | GGACGGCCACTGCCCAACCATATACG | 3′RACE |
| PpPax3-inner-F | AAGTAAACCAAGGGTCGCAACTCCG | nest-3′RACE |
| PpPax3-outer-R | GGAACCTGCTCCGTAATACTCGACTGATGG | 5′RACE |
| PpPax3-inner-R | TCAGCAGCCGATCCCGAATCT | nest-5′RACE |
| UPM (Universal Primer) | TAATACGACTCACTATAGGGCAAGCAGTGGTATCAACGCAGAGT | RACE universal primer |
| NUP (Nested Universal Primer) | AAGCAGTGGTATCAACGCAGAGT | Nest-RACE universal primer |
| PpPax3-test-F | GAATGCTCCGTAAACGTTATTG | cDNA test |
| PpPax3-test-R | GACAACAAAATGGCTACCTCAT | cDNA test |
| PpPax3-siRNA1-F | GCGTAATACGACTCACTATAGGGGTAAACCAAGGGTCGCAAC | RNAi |
| PpPax3-siRNA1-R | GCGTAATACGACTCACTATAGGGCGTTGTCGCTTTTGTCGCT | RNAi |
| PpPax3-siRNA2-F | GCGTAATACGACTCACTATAGGGGATAATCCGGGAATTTTCAGTTGGG | RNAi |
| PpPax3-siRNA2-R | GCGTAATACGACTCACTATAGGGGATAGTGAGTTCGTTCAAAGGCTCT | RNAi |
| GFP-siRNA-F | GATCACTAATACGACTCACTATAGGGATGGTGAGCAAGGGCGAGGA | RNAi |
| GFP-siRNA-R | GATCACTAATACGACTCACTATAGGGTTACTTGTACAGCTCGTCCA | RNAi |
| PpPax3-qPCR-F | TCCGTGCGTCATCAGTAGAC | qRT-PCR |
| PpPax3-qPCR-R | CCCTTGGTTTACTTCCGCCA | qRT-PCR |
| PpTyr-qPCR-F | CTCAGGGAAGGGATCAGCTT | qRT-PCR |
| PpTyr-qPCR-R | AGACCCTCTGCCATTACCAA | qRT-PCR |
| PpMitf-qPCR-F | TGTTACCTAAATCTGTTGATCCAG | qRT-PCR |
| PpMitf-qPCR-R | AAATTAGCTGGACAGGAAGAGGAG | qRT-PCR |
| PpCreb2-qPCR-F | AACTCCCAGTGAAGCAGACA | qRT-PCR |
| PpCreb2-qPCR-R | GCTCCCCAACAGTAGCCAAT | qRT-PCR |
| PpBcl2-qPCR-F | TGAGGCACAGTTCCAGGATT | qRT-PCR |
| PpBcl2-qPCR-R | ACTCTCCACACACCGTACAG | qRT-PCR |
| PpCdk2-qPCR-F | TGGATTTGCTCGGACACTTG | qRT-PCR |
| PpCdk2-qPCR-R | TCTACTGCCCTGCCATACTT | qRT-PCR |
| β-actin-F | CGGTACCACCATGTTCTCAG | qRT-PCR |
| β-actin-R | GACCGGATTCATCGTATTCC | qRT-PCR |
Table 2.
Details of mass spectrometric detection.
| Compand | Parent Ion (m/z) | Product Ion (m/z) | Conc Voltage (V) | Collision Energy (eV) | Retention Time (min) |
|---|---|---|---|---|---|
| PDCA | 155.98 | 138.01 | 30 | 8 | 2.39 |
| PTCA | 199.99 | 182.09 | 30 | 8 | 3.58 |
© 2018 by the authors. Licensee MDPI, Basel, Switzerland. This article is an open access article distributed under the terms and conditions of the Creative Commons Attribution (CC BY) license (http://creativecommons.org/licenses/by/4.0/).
Share and Cite
MDPI and ACS Style
Yu, F.; Qu, B.; Lin, D.; Deng, Y.; Huang, R.; Zhong, Z. Pax3 Gene Regulated Melanin Synthesis by Tyrosinase Pathway in Pteria penguin. Int. J. Mol. Sci. 2018, 19, 3700. https://doi.org/10.3390/ijms19123700
AMA Style
Yu F, Qu B, Lin D, Deng Y, Huang R, Zhong Z. Pax3 Gene Regulated Melanin Synthesis by Tyrosinase Pathway in Pteria penguin. International Journal of Molecular Sciences. 2018; 19(12):3700. https://doi.org/10.3390/ijms19123700
Chicago/Turabian StyleYu, Feifei, Bingliang Qu, Dandan Lin, Yuewen Deng, Ronglian Huang, and Zhiming Zhong. 2018. "Pax3 Gene Regulated Melanin Synthesis by Tyrosinase Pathway in Pteria penguin" International Journal of Molecular Sciences 19, no. 12: 3700. https://doi.org/10.3390/ijms19123700
Note that from the first issue of 2016, this journal uses article numbers instead of page numbers. See further details here.