Speciation of Selenium in Brown Rice Fertilized with Selenite and Effects of Selenium Fertilization on Rice Proteins

 ,
,
Abstract
:
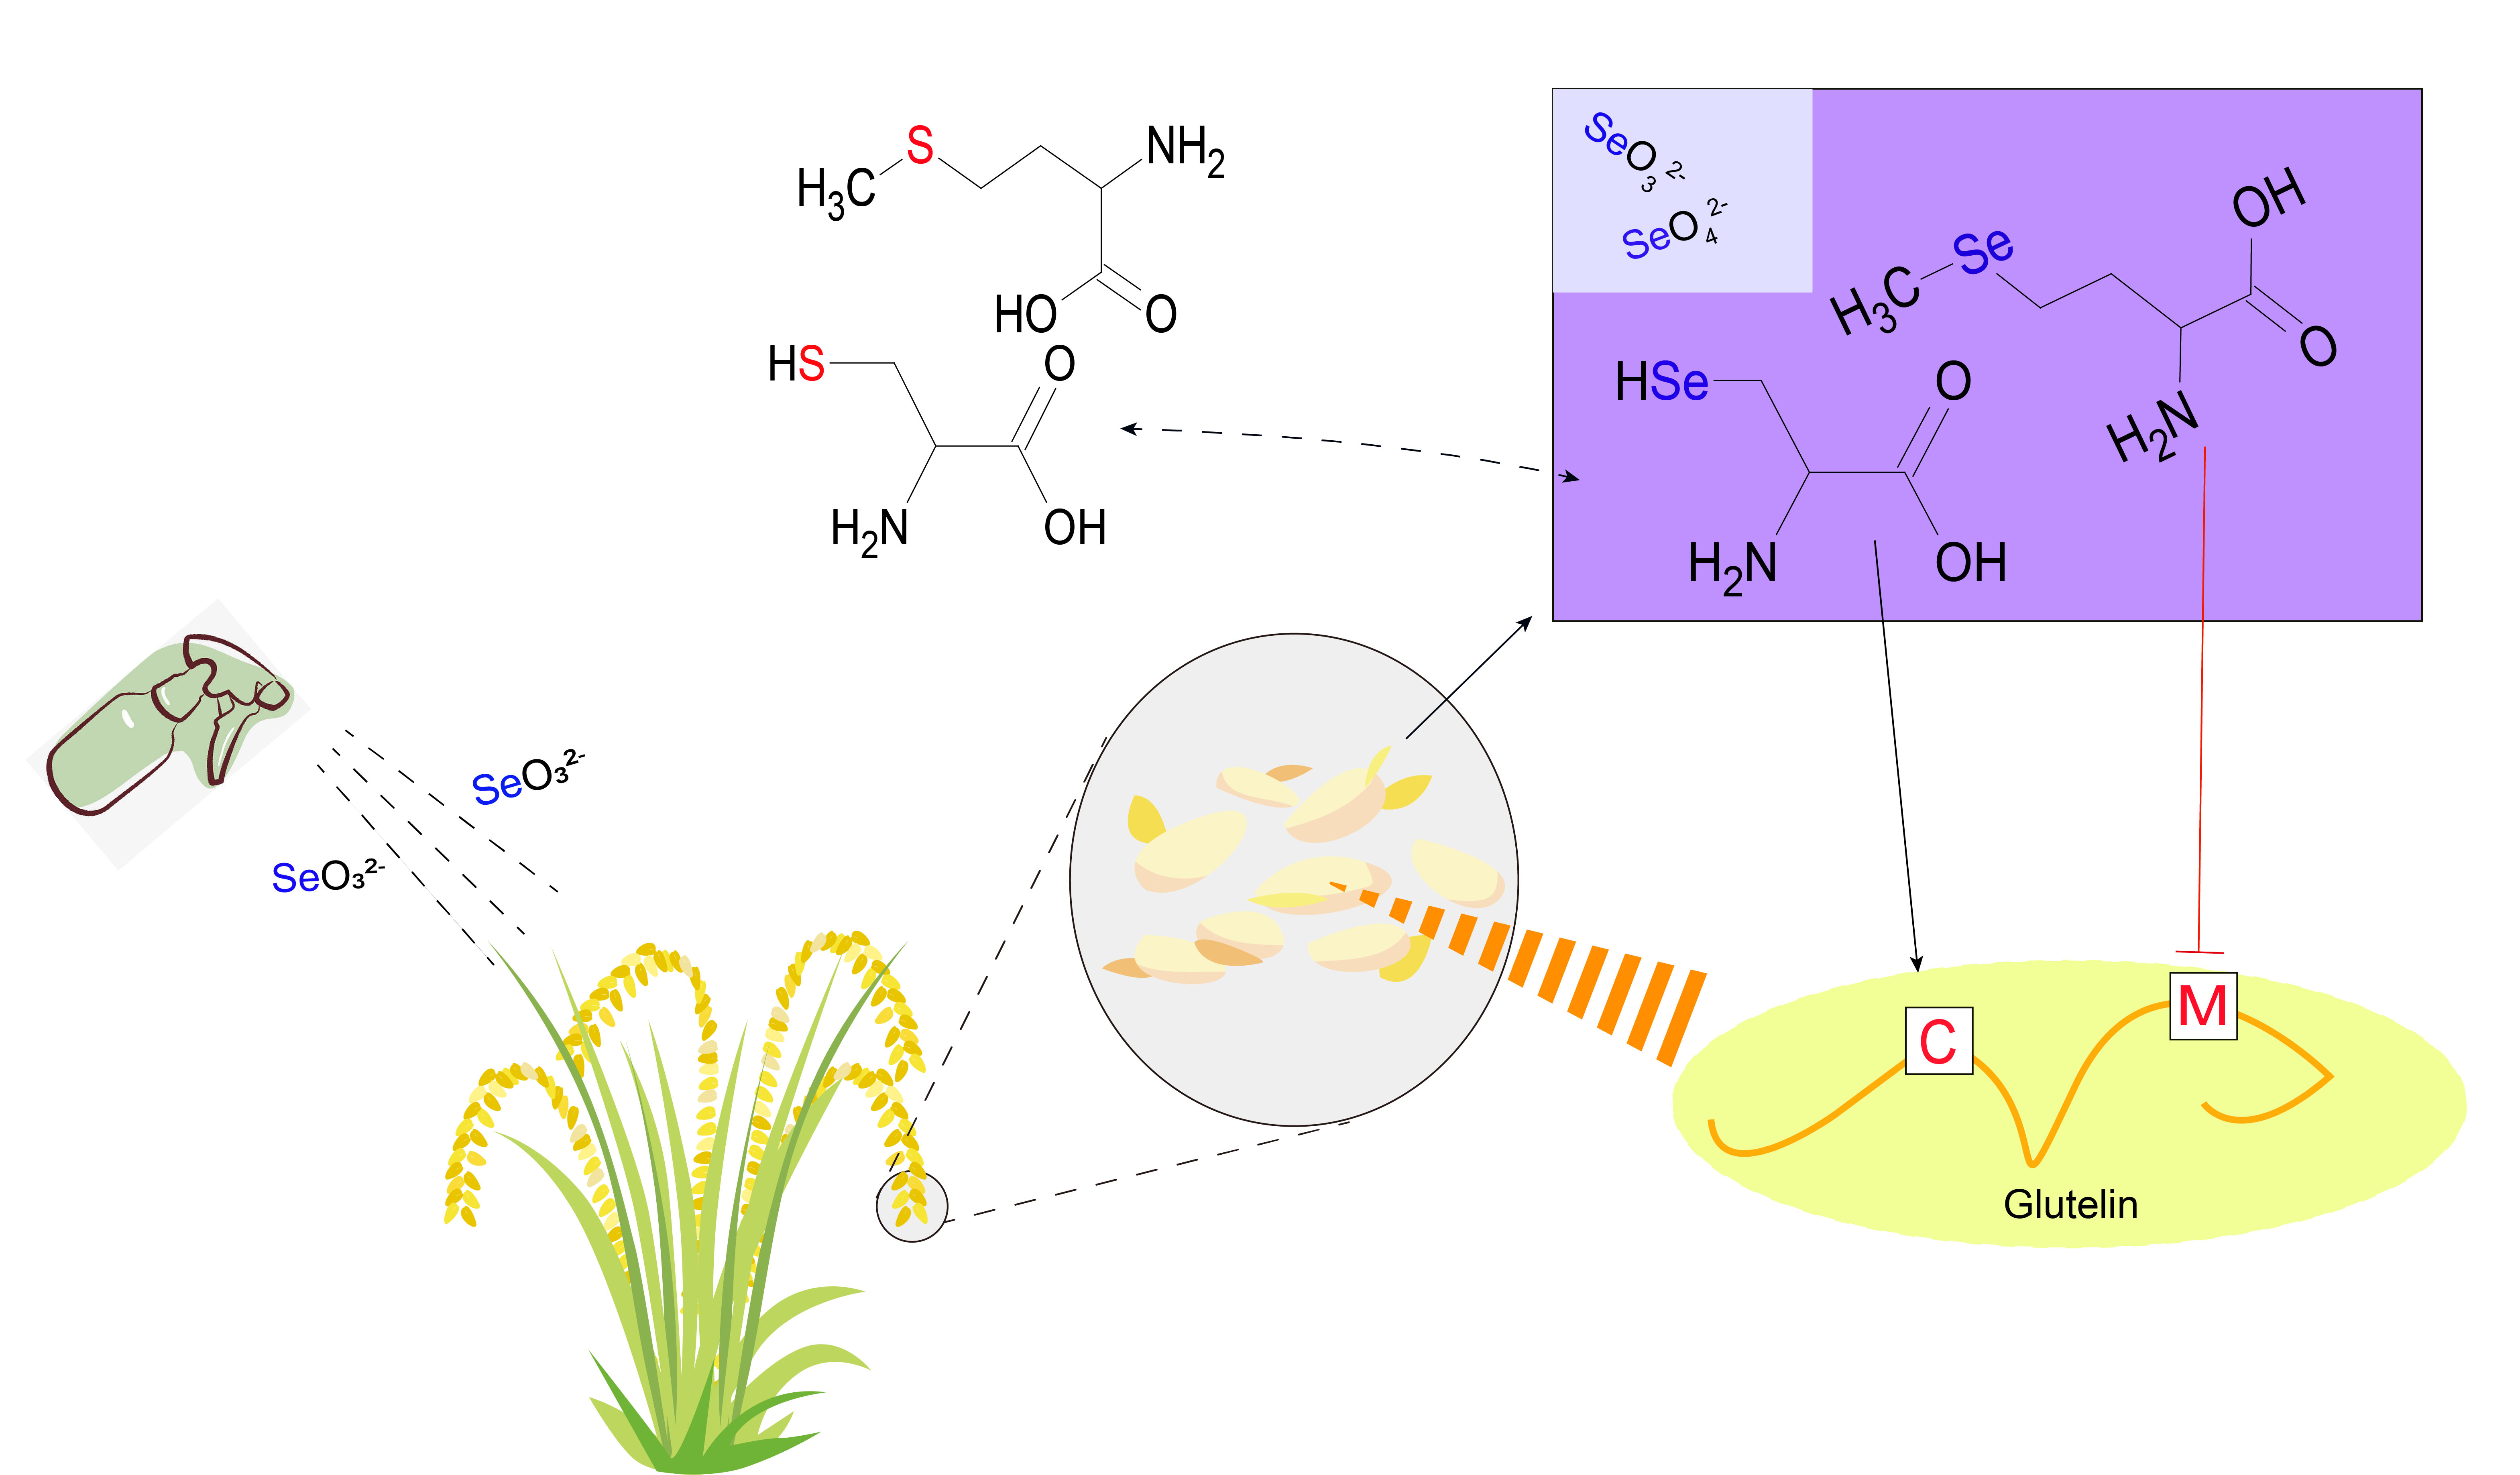
1. Introduction
2. Results
2.1. Se Concentration in Brown Rice
2.2. Se Species in the Water Extract Identified by LC-ICP-MS
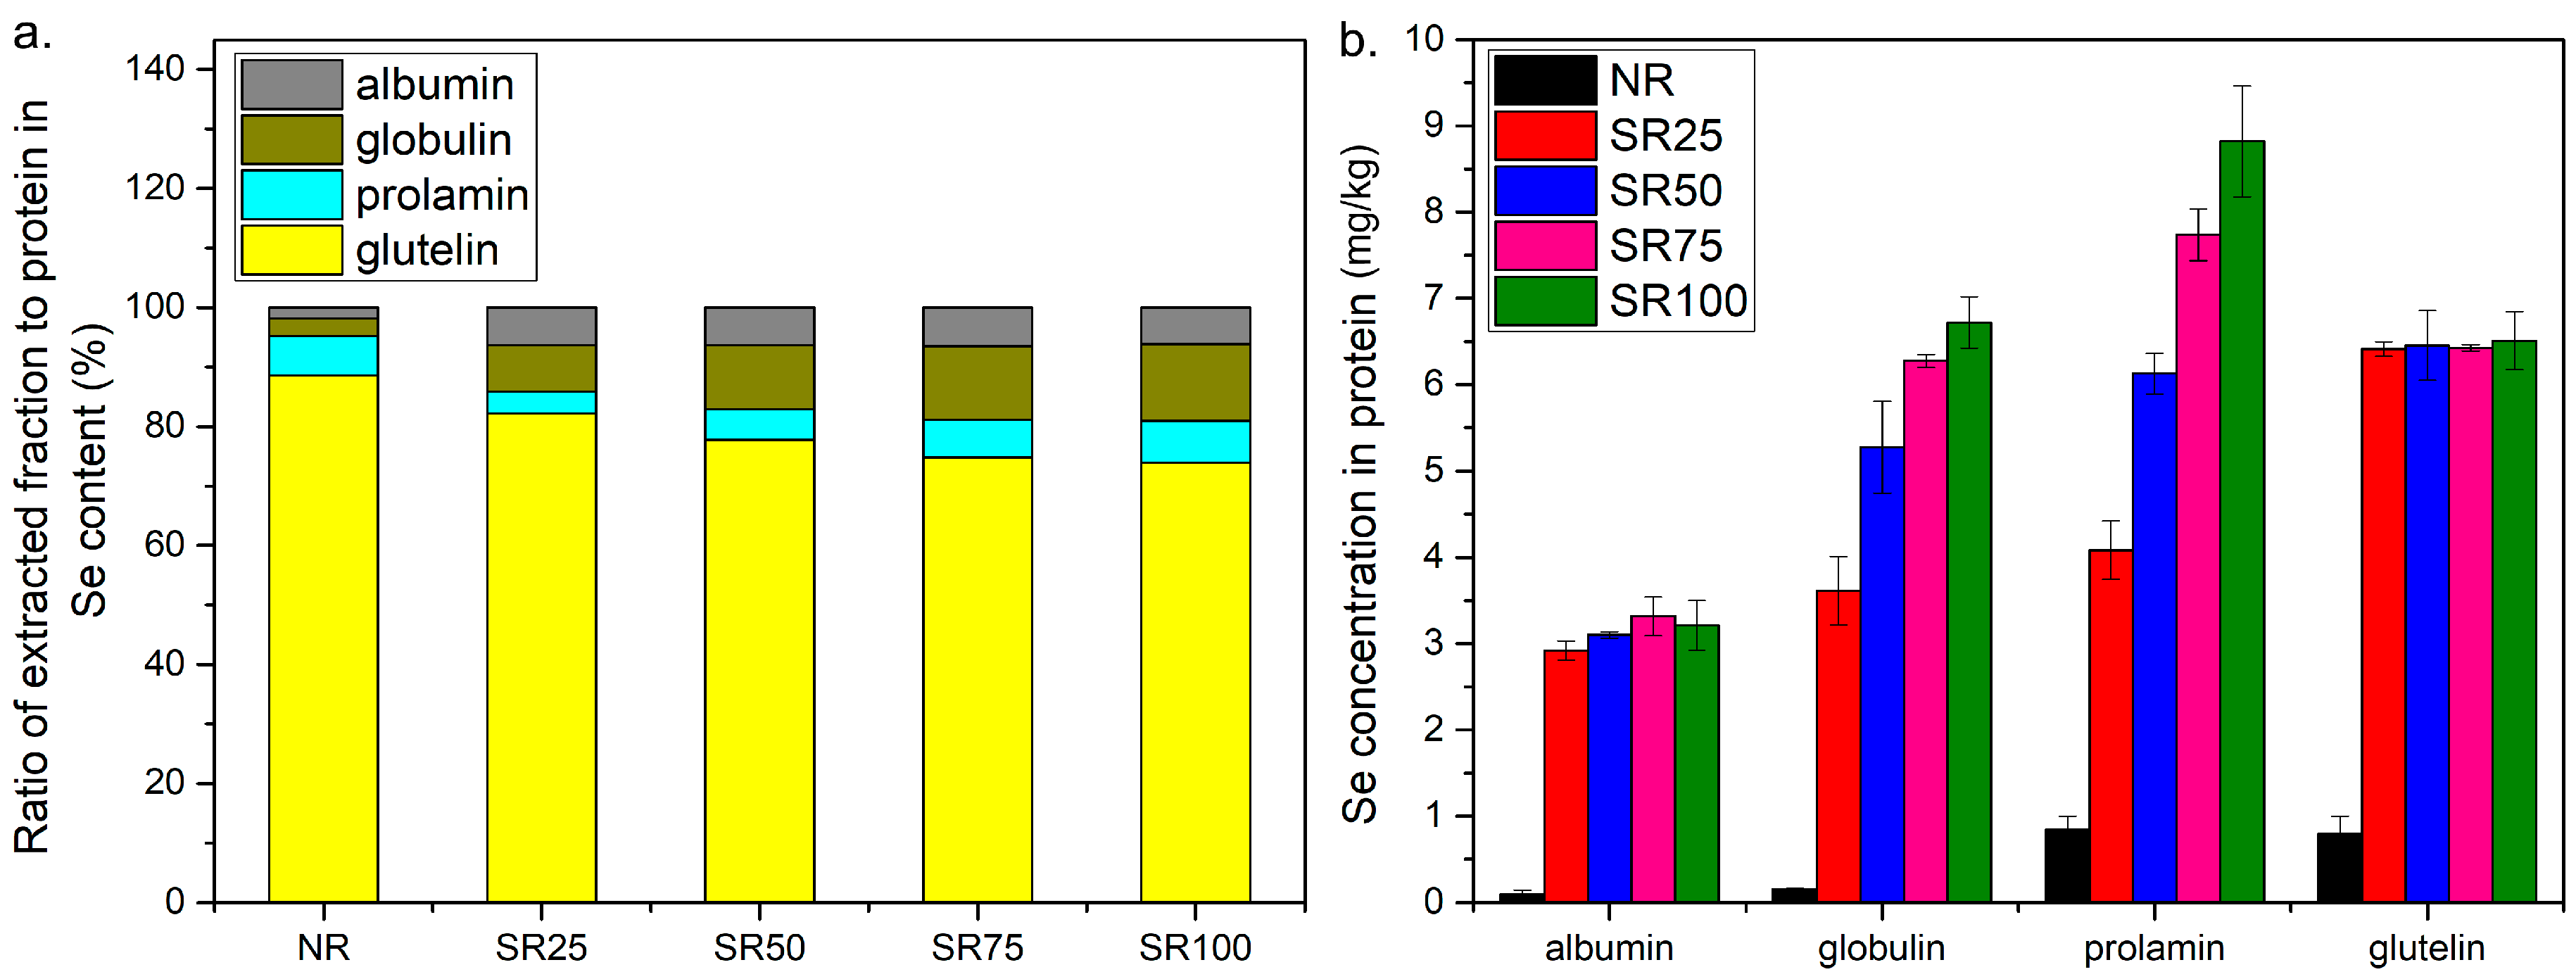
2.3. Distribution of Se in Extracted Fractions
2.4. Se Species in the Glutelin and Prolamin Fractions
2.5. Amino Acid Compositions in the Glutelin Fraction
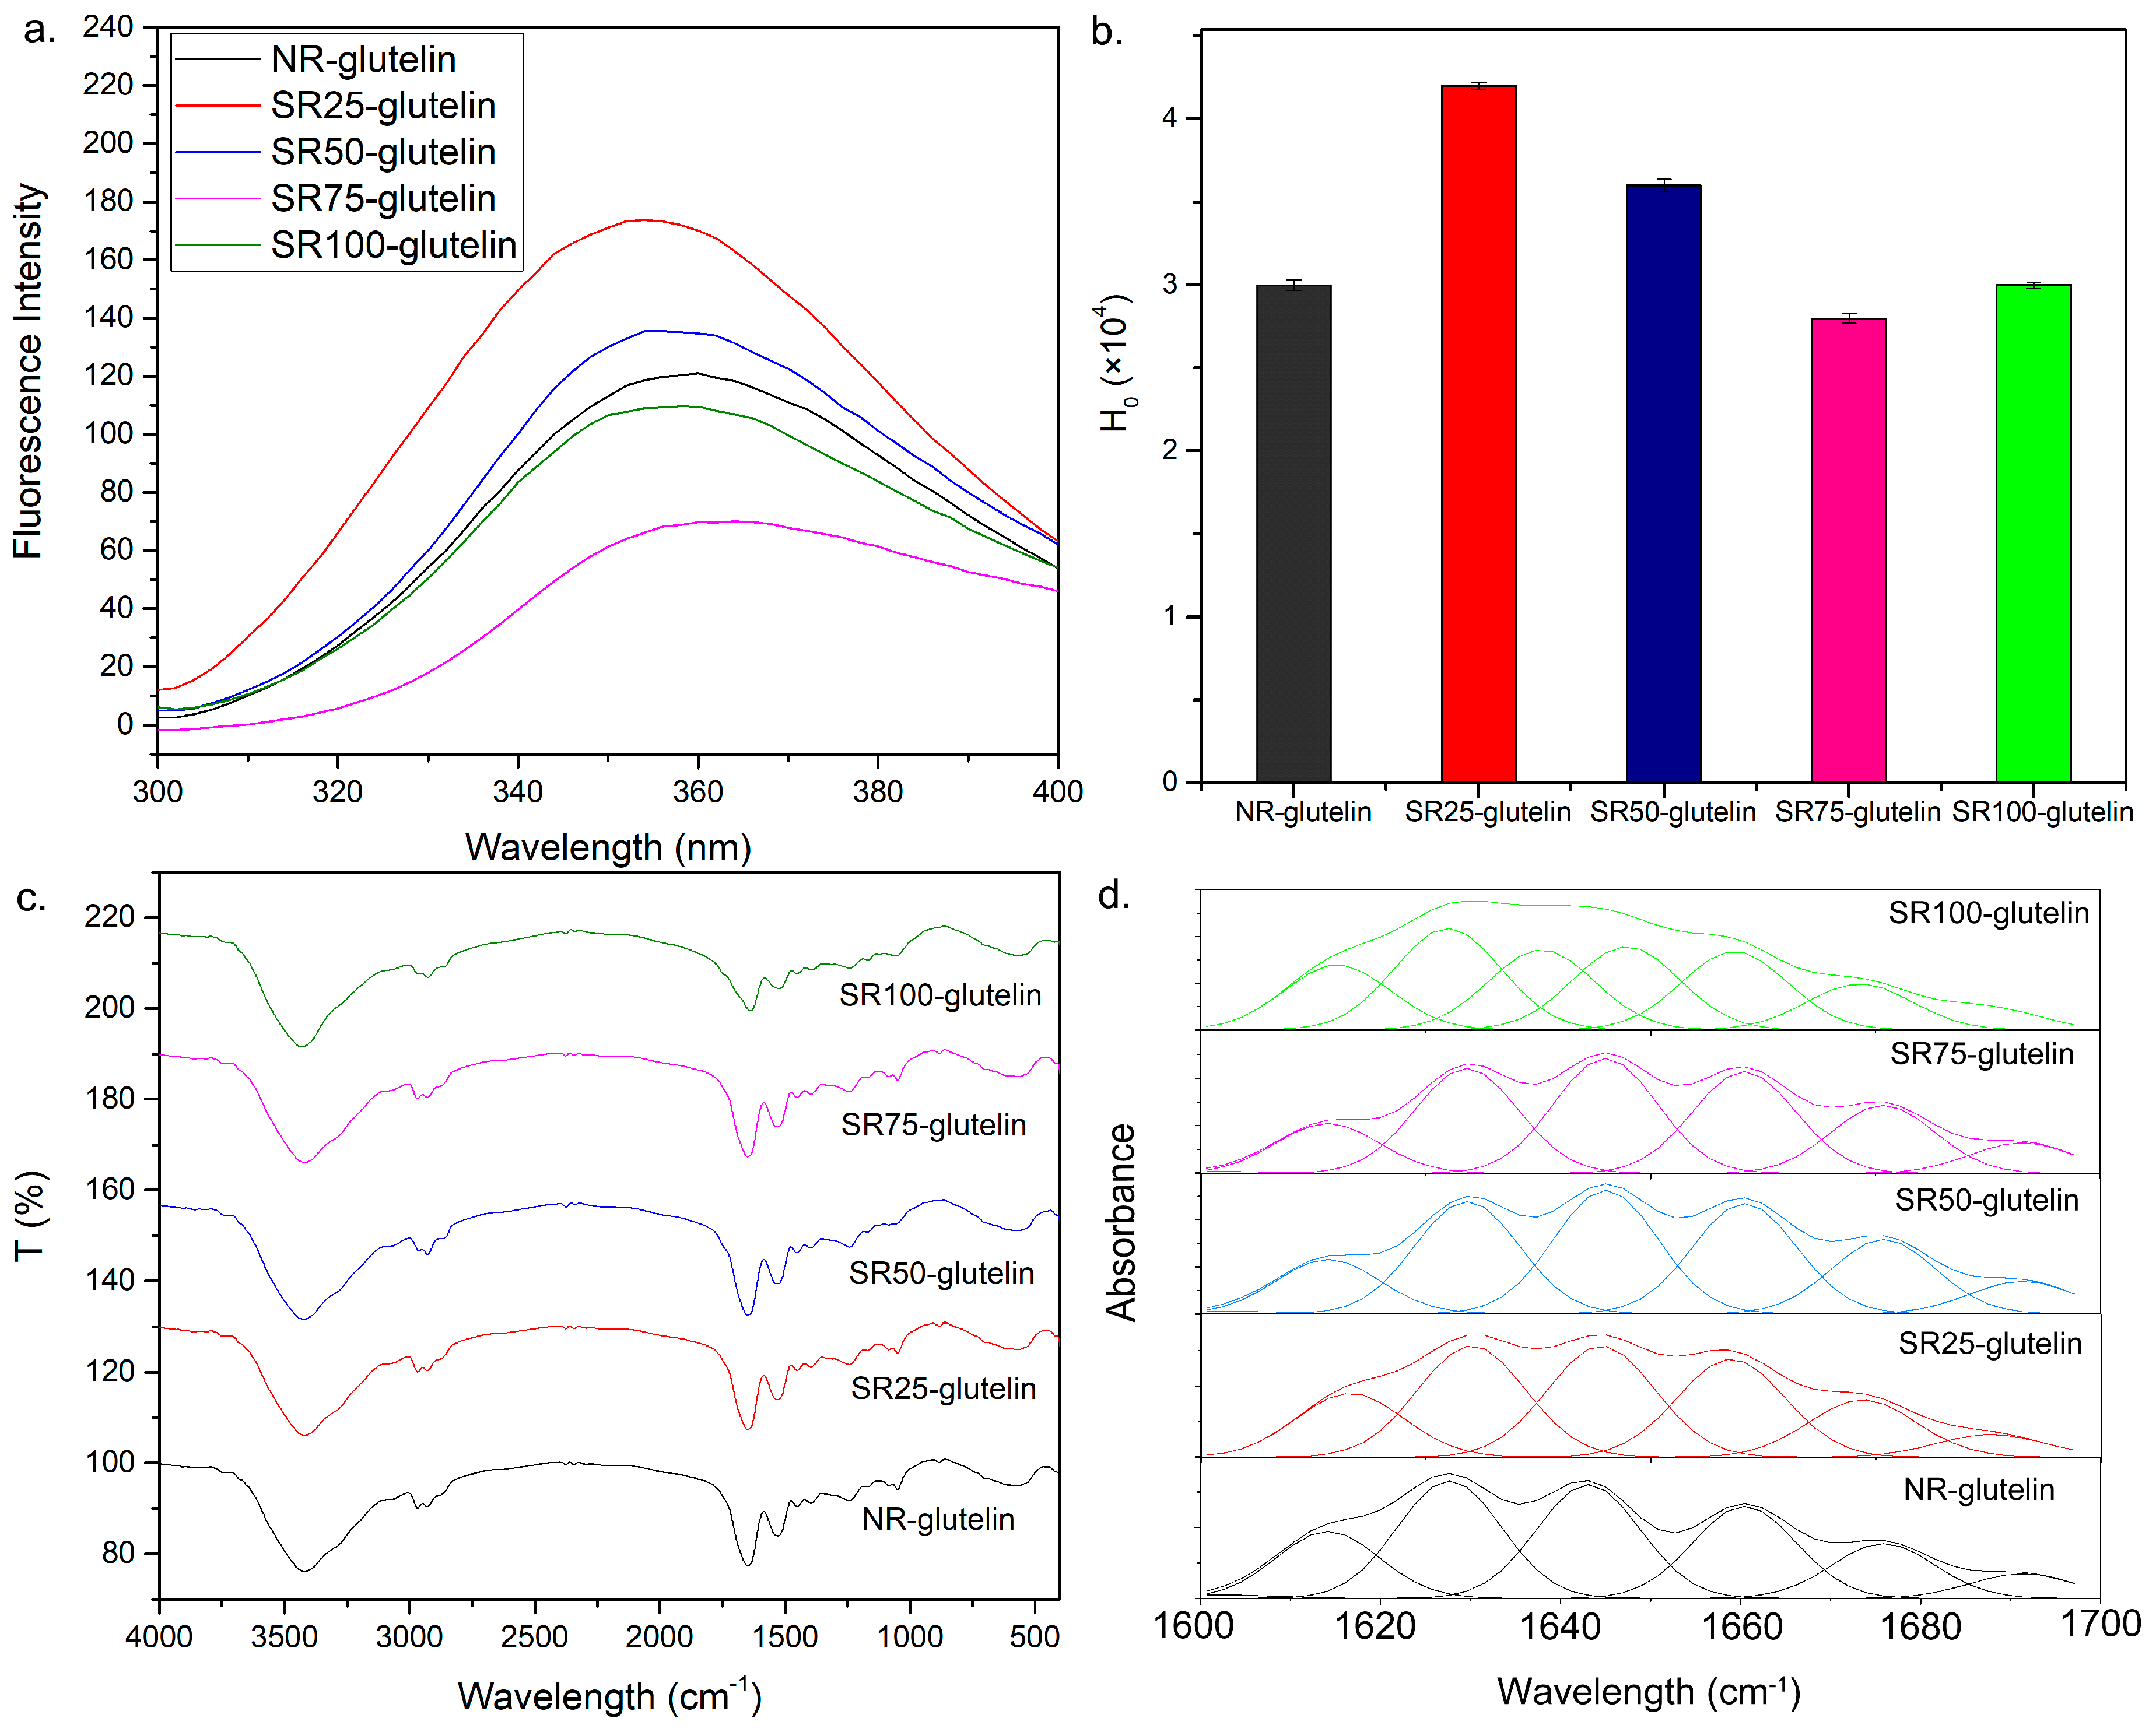
2.6. Fluorescence Spectra of the Glutelin Fraction
2.7. Secondary Structures of the Se-Containing Glutelin Fractions
2.8. Contents of Sulfhydryl Groups (SH) and Disulfide Bond (S-S)
2.9. DSC Analysis
3. Discussion
4. Materials and Methods
4.1. Plant Materials, Growth Conditions, and Pretreatment of Se-Containing Rice Samples
4.2. Extraction and Determination of Se Content in Se-Containing Brown Rice
4.3. Extraction of Selenocompounds and Se Speciation Analysis
4.4. Identification of Unknown Se Compound
4.5. Amino Acid (AA) Analysis
4.6. Fluorescence Measurements
4.7. Fourier Transformed Infrared (FT-IR) Spectroscopy
4.8. Contents of Total and Free Sulfhydryl (SH) Groups and Disulfide bonds
4.9. Differential Scanning Calorimetry (DSC)
4.10. Statistical Analysis
Author Contributions
Funding
Acknowledgments
Conflicts of Interest
Abbreviations
| FT-IR | Fourier transform infrared spectrometry |
| DSC | Differential scanning calorimetry |
| SeMetO | selenomethionine selenoxide |
References
- Hatfield, D.L.; Tsuji, P.A.; Carlson, B.A.; Gladyshev, V.N. Selenium and selenocysteine: Roles in cancer, health, and development. Trends Biochem. Sci. 2014, 39, 112–120. [Google Scholar] [CrossRef] [PubMed]
- Takahashi, K.; Suzuki, N.; Ogra, Y. Bioavailability comparison of nine bioselenocompounds in vitro and in vivo. Int. J. Mol. Sci. 2017, 18, 506. [Google Scholar] [CrossRef] [PubMed]
- Tiwary, A.K.; Stegelmeier, B.L.; Panter, K.E.; James, L.F.; Hall, J.O. Comparative toxicosis of sodium selenite and selenomethionine in lambs. J. Vet. Diagn. Investig. 2006, 18, 61–70. [Google Scholar] [CrossRef] [PubMed]
- Li, H.F.; Lombi, E.; Stroud, J.L.; McGrath, S.P.; Zhao, F.J. Selenium speciation in soil and rice: Influence of water management and Se fertilization. J. Agric. Food Chem. 2010, 58, 11837–11843. [Google Scholar] [CrossRef] [PubMed]
- Wang, Y.D.; Wang, X.; Wong, Y.S. Generation of selenium-enriched rice with enhanced grain yield, selenium content and bioavailability through fertilisation with selenite. Food Chem. 2013, 141, 2385–2393. [Google Scholar] [CrossRef] [PubMed]
- Premarathna, L.; McLaughlin, M.J.; Kirby, J.K.; Hettiarachchi, G.M.; Stacey, S.; Chittleborough, D.J. Selenate-enriched urea granules are a highly effective fertilizer for selenium biofortification of paddy rice grain. J. Agric. Food Chem. 2010, 60, 6037–6044. [Google Scholar] [CrossRef] [PubMed] [Green Version]
- Carvalho, S.M.P.; Vasconcelos, M.W. Producing more with less: Strategies and novel technologies for plant-based food biofortification. Food Res. Int. 2013, 54, 961–971. [Google Scholar] [CrossRef] [Green Version]
- Carey, A.M.; Scheckel, K.G.; Lombi, E.; Newville, M.; Choi, Y.; Norton, G.J.; Price, A.H.; Meharg, A.A. Grain accumulation of selenium species in rice (Oryza sativa L.). Environ. Sci. Technol. 2012, 46, 5557–5564. [Google Scholar] [CrossRef] [PubMed]
- Chen, L.; Yang, F.; Xu, J.; Hu, Y.; Hu, Q.; Zhang, Y.; Pan, G. Determination of selenium concentration of rice in China and effect of fertilization of selenite and selenate on selenium content of rice. J. Agric. Food Chem. 2002, 50, 5128–5130. [Google Scholar] [CrossRef] [PubMed]
- White, P.J. Selenium accumulation by plants. Ann. Bot. 2016, 117, 217–235. [Google Scholar] [CrossRef] [PubMed]
- Li, H.F.; Mcgrath, S.P.; Zhao, F.J. Selenium uptake, translocation and speciation in wheat supplied with selenate or selenite. New Phytol. 2010, 178, 92–102. [Google Scholar] [CrossRef] [PubMed]
- Schiavon, M.; Pilon, M.; Malagoli, M.; Pilonsmits, E.A.H. Exploring the importance of sulfate transporters and ATP sulphurylases for selenium hyperaccumulation–a comparison of Stanleya pinnata and Brassica juncea (Brassicaceae). Front. Plant Sci. 2015, 6, 2. [Google Scholar] [CrossRef] [PubMed]
- White, P.J.; Broadley, M.R.; Bowen, H.C.; Johnson, S.E. Sulfur in Plants an. Ecological Perspective; Selenium and Its Relationship with Sulfur; Springer: Dordrecht, The Netherlands, 2007; pp. 225–525. [Google Scholar]
- Pilon-Smits, E.A.; Quinn, C.F.; Tapken, W.; Malagoli, M.; Schiavon, M. Physiological functions of beneficial elements. Cur. Opin. Plant Biol. 2009, 12, 267–274. [Google Scholar] [CrossRef] [PubMed]
- Sors, T.G.; Ellis, D.R.; Salt, D.E. Selenium uptake, translocation, assimilation and metabolic fate in plants. Photosynth. Res. 2005, 86, 373–389. [Google Scholar] [CrossRef] [PubMed]
- Pickering, I.J.; Wright, C.; Bubner, B.; Ellis, D.; Persans, M.W.; Yu, E.Y.; George, G.N.; Prince, R.C.; Salt, D.E. Chemical form and distribution of selenium and sulfur in the selenium hyperaccumulator astragalus bisulcatus. Plant Physiol. 2003, 131, 1460–1467. [Google Scholar] [CrossRef] [PubMed]
- Ellis, D.R.; Salt, D.E. Plants, selenium and human health. Curr. Opin. Plant Biol. 2003, 6, 273–279. [Google Scholar] [CrossRef]
- Stadtman, T.C. Selenium Biochemistry. Annu. Rev. Biochem. 1990, 59, 111–127. [Google Scholar] [CrossRef] [PubMed]
- Phongthai, S.; Homthawornchoo, W.; Rawdkuen, S. Preparation, properties and application of rice bran protein: A. review. Int. Food Res. J. 2017, 24, 25–34. [Google Scholar]
- Chanput, W.; Theerakulkait, C.; Nakai, S. Antioxidative properties of partially purified barley hordein, rice bran protein fractions and their hydrolysates. J. Cereal Sci. 2009, 49, 422–428. [Google Scholar] [CrossRef]
- Aureli, F.; Ouerdane, L.; Bierla, K.; Szpunar, J.; Prakash, N.T.; Cubadda, F. Identification of selenosugars and other low-molecular weight selenium metabolites in high-selenium cereal crops. Metallomics 2012, 4, 968–978. [Google Scholar] [CrossRef] [PubMed]
- Fang, Y.; Catron, B.; Zhang, Y.; Zhao, L.; Caruso, J.A.; Hu, Q. Distribution and in vitro availability of selenium in selenium-containing storage protein from selenium-enriched rice utilizing optimized extraction. J. Agric. Food Chem. 2010, 58, 9731–9738. [Google Scholar] [CrossRef] [PubMed]
- Tao, Z.; YuXi, G.; Bai, L.; YuFeng, L.; ChunYing, C.; Gang, W. Study of selenium speciation in selenized rice using high-performance liquid chromatography-inductively coupled plasma mass spectrometer. Chin. J. Anal. Chem. 2008, 36, 206–210. [Google Scholar] [CrossRef]
- Gammelgaard, B.; Cornett, C.; Olsen, J.; Bendahl, L.; Hansen, S.H. Combination of LC-ICP-MS, LC-MS and NMR for investigation of the oxidative degradation of selenomethionine. Talanta 2003, 59, 1165–1171. [Google Scholar] [CrossRef]
- Bianco, C.L.; Moore, C.D.; Fukuto, J.M.; Toscano, J.P. Selenols are resistant to irreversible modification by HNO. Free Radic. Biol. Med. 2016, 99, 71–78. [Google Scholar] [CrossRef] [PubMed] [Green Version]
- Deng, X.; Liu, K.; Li, M.; Zhang, W.; Zhao, X.; Zhao, Z.; Liu, X. Difference of selenium uptake and distribution in the plant and selenium form in the grains of rice with foliar spray of selenite or selenate at different stages. Field Crop. Res. 2017, 211, 165–171. [Google Scholar] [CrossRef]
- Huang, Q.Q.; Wang, Q.; Wan, Y.N.; Yu, Y.; Jiang, R.F.; Li, H.F. Application of X-ray absorption near edge spectroscopy to the study of the effect of sulphur on selenium uptake and assimilation in wheat seedlings. Physiol. Plant. 2017, 61, 726–732. [Google Scholar] [CrossRef]
- Fang, Y.; Zhang, Y.; Catron, B.; Chan, Q.; Hu, Q.; Caruso, J.A. Identification of selenium compounds using HPLC-ICPMS and nano-ESI-MS in selenium-enriched rice via foliar application. J. Anal. At. Spectrom. 2009, 24, 1657–1664. [Google Scholar] [CrossRef]
- Nothstein, A.K.; Eiche, E.; Riemann, M.; Nick, P.; Winkel, L.H.; Gottlicher, J.; Steininger, R.; Brendel, R.; von Brasch, M.; Konrad, G.; et al. Tracking Se assimilation and speciation through the rice Plant-nutrient competition, toxicity and distribution. PLoS ONE 2016, 11, e0152081. [Google Scholar] [CrossRef] [PubMed]
- Nawaz, F.; Ahmad, R.; Ashraf, M.Y.; Waraich, E.A.; Khan, S.Z. Effect of selenium foliar spray on physiological and biochemical processes and chemical constituents of wheat under drought stress. Ecotoxicol. Environ. Saf. 2015, 113, 191–200. [Google Scholar] [CrossRef] [PubMed]
- Zhou, X.B.; Zhang, C.M.; Wang, Y.K.; Xu, W.H. Differences in selenium accumulation in grains of two rice cultrivars. Bangladesh J. Bot. 2016, 45, 811–818. [Google Scholar]
- Gong, R.; Ai, C.; Zhang, B.; Cheng, X. Effect of selenite on organic selenium speciation and selenium bioaccessibility in rice grains of two Se-enriched rice cultivars. Food Chem. 2018, 264, 443–448. [Google Scholar] [CrossRef] [PubMed]
- Resurreccion, A.P.; Li, X.X.; Okita, T.W.; Juliano, B.O. Characterization of poorly digested protein of cooked rice protein bodies. Cereal Chem. 1993, 70, 101–104. [Google Scholar]
- Dhanjal, N.I.; Sharma, S.; Prakash, N.T. Quantification and in vitro bioaccessibility of selenium from Osborne fractions of selenium-rich cereal grains. Cereal Chem. 2016, 93, 339–343. [Google Scholar] [CrossRef]
- Santiago, F.E.M.; Silva, M.L.D.; Ribeiro, F.D.; Cipriano, P.E.; Guilherme, L.R.G. Influence of sulfur on selenium absorption in strawberry. Acta Sci. Agron. 2018, 40, e35780. [Google Scholar] [CrossRef]
- Guerrero, B.; Llugany, M.; Palacios, O.; Valiente, M. Dual effects of different selenium species on wheat. Plant Physiol. Biochem. 2014, 83, 300–307. [Google Scholar] [CrossRef] [PubMed]
- Hawrylak-Nowak, B. Comparative effects of selenite and selenate on growth and selenium accumulation in lettuce plants under hydroponic conditions. Plant. Growth Regul. 2013, 70, 149–157. [Google Scholar] [CrossRef] [Green Version]
- Boldrin, P.F.; Figueiredo, M.Ad.; Yang, Y.; Luo, H.; Giri, S.; Hart, J.J.; Faquin, V.; Guilherme, L.R.G.; Thannhauser, T.W.; Li, L. Selenium promotes sulfur accumulation and plant growth in wheat (Triticum aestivum). Physiol. Plant. 2016, 158, 80–91. [Google Scholar] [CrossRef] [PubMed]
- Kubachka, K.M.; Hanley, T.; Mantha, M.; Wilson, R.A.; Falconer, T.M.; Kassa, Z.; Oliveira, A.; Landero, J.; Caruso, J. Evaluation of selenium in dietary supplements using elemental speciation. Food Chem. 2017, 218, 313–320. [Google Scholar] [CrossRef] [PubMed]
- Fang, Y.; Wang, L.; Xin, Z.; Zhao, L.; An, X.; Hu, Q. Effect of foliar application of zinc, selenium, and iron fertilizers on nutrients concentration and yield of rice grain in China. J. Agric. Food Chem. 2008, 56, 2079–2084. [Google Scholar] [CrossRef] [PubMed]
- Sun, G.X.; Van de Wiele, T.; Alava, P.; Tack, F.M.G.; Du Laing, G. Bioaccessibility of selenium from cooked rice as determined in a simulator of the human intestinal tract (SHIME). J. Sci. Food Agric. 2017, 97, 3540–3545. [Google Scholar] [CrossRef] [PubMed]
- Lei, L.; Zhao, Q.; Selomulya, C.; Xiong, H. The effect of deamidation on the structural, functional, and rheological properties of glutelin prepared from Akebia trifoliata var. australis seed. Food Chem. 2015, 178, 96–105. [Google Scholar] [CrossRef] [PubMed]
- Wang, T.; Zhang, H.; Wang, L.; Wang, R.; Chen, Z. Mechanistic insights into solubilization of rice protein isolates by freeze-milling combined with alkali pretreatment. Food Chem. 2015, 178, 82–88. [Google Scholar] [CrossRef] [PubMed]
- Zhao, Q.; Selomulya, C.; Xiong, H.; Chen, X.D.; Ruan, X.; Wang, S.; Xie, J.; Peng, H.; Sun, W.; Zhou, Q. Comparison of functional and structural properties of native and industrial process-modified proteins from long-grain indica rice. J. Cereal Sci. 2012, 56, 568–575. [Google Scholar] [CrossRef]


| Compound | Parent m/z | Product m/z |
|---|---|---|
| SeMet | 198 | 181 (-NH3) 153 (-COOH) 135 (-COOH, -NH3) 109 (CH3SeCH2+) |
| SeMetO | 214 | 196 (-H2O) 168 (-CO) 150 (-H2O) 122 (-CH2CH2) |
| Sample | Se Species in Glutelin (μg/g) | Se Species in Prolamin (μg/g) | ||
|---|---|---|---|---|
| SeMet | SeCys2 | SeMet | SeCys2 | |
| NR | 0.321 ± 0.007 c | 0.318 ± 0.006 b | 0.333 ± 0.040 e | 0.379 ± 0.012 c |
| SR25 | 4.695 ± 0.041 b | 0.475 ± 0.006 a | 2.289 ± 0.008 d | 0.976 ± 0.026 b |
| SR50 | 4.705 ± 0.022 b | 0.457 ± 0.021 a | 3.765 ± 0.244 c | 1.137 ± 0.077 a |
| SR75 | 4.666 ± 0.024 b | 0.474 ± 0.089 a | 5.044 ± 0.029 b | 1.145 ± 0.022 a |
| SR100 | 4.761 ± 0.028 a | 0.447 ± 0.075 a | 5.914 ± 0.122 a | 1.142 ± 0.066 a |
| Amino Acid | NR-Glutelin | SR25-Glutelin | SR50-Glutelin | SR75-Glutelin | SR100-Glutelin |
|---|---|---|---|---|---|
| Asp | 2.35 ± 0.01 b | 3.11 ± 0.59 a | 3.56 ± 0.27 a | 3.35 ± 0.38 a | 3.00 ± 0.18 a |
| Thr | 3.63 ± 0.15 b | 3.30 ± 0.11 b | 3.06 ± 0.16 b | 5.78 ± 0.85 a | 5.29 ± 0.45 a |
| Ser | 4.51 ± 2.08 bc | 7.31 ± 0.55 a | 5.63 ± 0.13 ab | 3.16 ± 0.11 c | 7.10 ± 0.50 a |
| Glu | 12.71 ± 3.23 b | 16.55 ± 0.30 a | 18.79 ± 0.10 a | 8.27 ± 1.29 c | 17.88 ± 0.22 a |
| Gly | 5.82 ± 0.30 a | 5.50 ± 0.08 b | 4.72 ± 0.02 c | 4.58 ± 0.17 c | 4.90 ± 0.14 c |
| Ala | 7.52 ± 0.78 a | 6.35 ± 0.12 b | 5.96 ± 0.03 b | 8.08 ± 0.64 a | 6.09 ± 0.22 b |
| Cys | 3.50 ± 0.22 bc | 3.73 ± 0.13 b | 3.39 ± 0.014 c | 4.58 ± 0.17 a | 2.40 ± 0.11 d |
| Val | 6.80 ± 0.40 a | 5.86 ± 0.08 b | 6.21 ± 0.03 b | 7.10 ± 0.30 a | 6.09 ± 0.22 b |
| Met | 2.73 ± 0.15 b | 2.93 ± 0.10 a | 1.99 ± 0.01 c | 1.79 ± 0.01 d | 1.95 ± 0.02 cd |
| Ile | 4.98 ± 0.32 a | 4.09 ± 0.12 b | 4.47 ± 0.02 b | 5.19 ± 0.20 a | 4.54 ± 0.24 b |
| Leu | 9.60 ± 0.57 a | 8.36 ± 0.07 b | 8.69 ± 0.04 b | 9.82 ± 0.43 a | 8.53 ± 0.32 b |
| Tyr | 5.96 ± 0.42 ab | 5.44 ± 0.18 c | 5.71 ± 0.03 b | 6.42 ± 0.23 a | 5.54 ± 0.20 d |
| Phe | 6.20 ± 0.37 b | 5.07 ± 0.07 c | 6.04 ± 0.17 b | 6.91 ± 0.31 a | 6.00 ± 0.16 b |
| His | 4.38 ± 0.30 b | 3.97 ± 0.04 c | 4.47 ± 0.02 b | 5.31 ± 0.13 a | 4.49 ± 0.18 b |
| Lys | 5.73 ± 0.47 a | 5.07 ± 0.07 b | 3.97 ± 0.02 c | 4.76 ± 0.16 b | 4.09 ± 0.15 c |
| Arg | 10.24 ± 0.89 b | 10.08 ± 0.20 b | 10.10 ± 0.11 b | 11.67 ± 0.47 a | 10.02 ± 0.54 b |
| Pro | 3.33 ± 0.17 a | 3.30 ± 0.22 a | 3.23 ± 0.24 a | 3.21 ± 0.16 a | 3.06 ± 0.14 a |
| Hydrophobic † | 33.64 | 32.96 | 33.76 | 34.12 | 33.23 |
| Uncharged polar ‡ | 12.70 | 12.20 | 11.47 | 10.58 | 12.50 |
| Basic ⁋ | 16.41 | 16.90 | 16.90 | 18.37 | 18.11 |
| Acidic § | 27.55 | 27.36 | 27.94 | 26.74 | 26.42 |
| Essential amino acids ¶ | 44.87 | 45.56 | 44.44 | 44.70 | 46.88 |
| Aromatic amino acids ǁ | 12.16 | 10.51 | 11.75 | 13.33 | 11.54 |
| Sample | Secondary Structures (%) | Thermostability | |||||||
|---|---|---|---|---|---|---|---|---|---|
| α-Helix | β-Sheet | β-Turn | Random Coil | To (°C) | Te (°C) | Tp (°C) | ∆H (J/g) | To (°C) | |
| NR-glutelin | 19.59 | 44.51 | 11.65 | 24.25 | 50.07 | 106.93 | 90.48 | 14.91 | 50.07 |
| SR25-glutelin | 21.15 | 42.57 | 12.35 | 23.92 | 45.57 | 127.86 | 92.04 | 14.88 | 45.57 |
| SR50-glutelin | 21.73 | 39.29 | 14.60 | 24.36 | 47.10 | 132.38 | 85.39 | 28.81 | 47.10 |
| SR75-glutelin | 33.91 | 39.64 | 9.64 | 24.45 | 51.80 | 141.79 | 88.26 | 29.19 | 51.80 |
| SR100-glutelin | 21.64 | 39.44 | 14.47 | 16.81 | 49.23 | 127.44 | 86.58 | 18.62 | 49.23 |
© 2018 by the authors. Licensee MDPI, Basel, Switzerland. This article is an open access article distributed under the terms and conditions of the Creative Commons Attribution (CC BY) license (http://creativecommons.org/licenses/by/4.0/).
Share and Cite
Hu, Z.; Cheng, Y.; Suzuki, N.; Guo, X.; Xiong, H.; Ogra, Y. Speciation of Selenium in Brown Rice Fertilized with Selenite and Effects of Selenium Fertilization on Rice Proteins. Int. J. Mol. Sci. 2018, 19, 3494. https://doi.org/10.3390/ijms19113494
Hu Z, Cheng Y, Suzuki N, Guo X, Xiong H, Ogra Y. Speciation of Selenium in Brown Rice Fertilized with Selenite and Effects of Selenium Fertilization on Rice Proteins. International Journal of Molecular Sciences. 2018; 19(11):3494. https://doi.org/10.3390/ijms19113494
Chicago/Turabian StyleHu, Zhenying, Yixin Cheng, Noriyuki Suzuki, Xiaoping Guo, Hua Xiong, and Yasumitsu Ogra. 2018. "Speciation of Selenium in Brown Rice Fertilized with Selenite and Effects of Selenium Fertilization on Rice Proteins" International Journal of Molecular Sciences 19, no. 11: 3494. https://doi.org/10.3390/ijms19113494