Pharmacological Inhibition of Class IIA HDACs by LMK-235 in Pancreatic Neuroendocrine Tumor Cells

 , , ,
, , , 
Abstract
:1. Introduction
2. Results
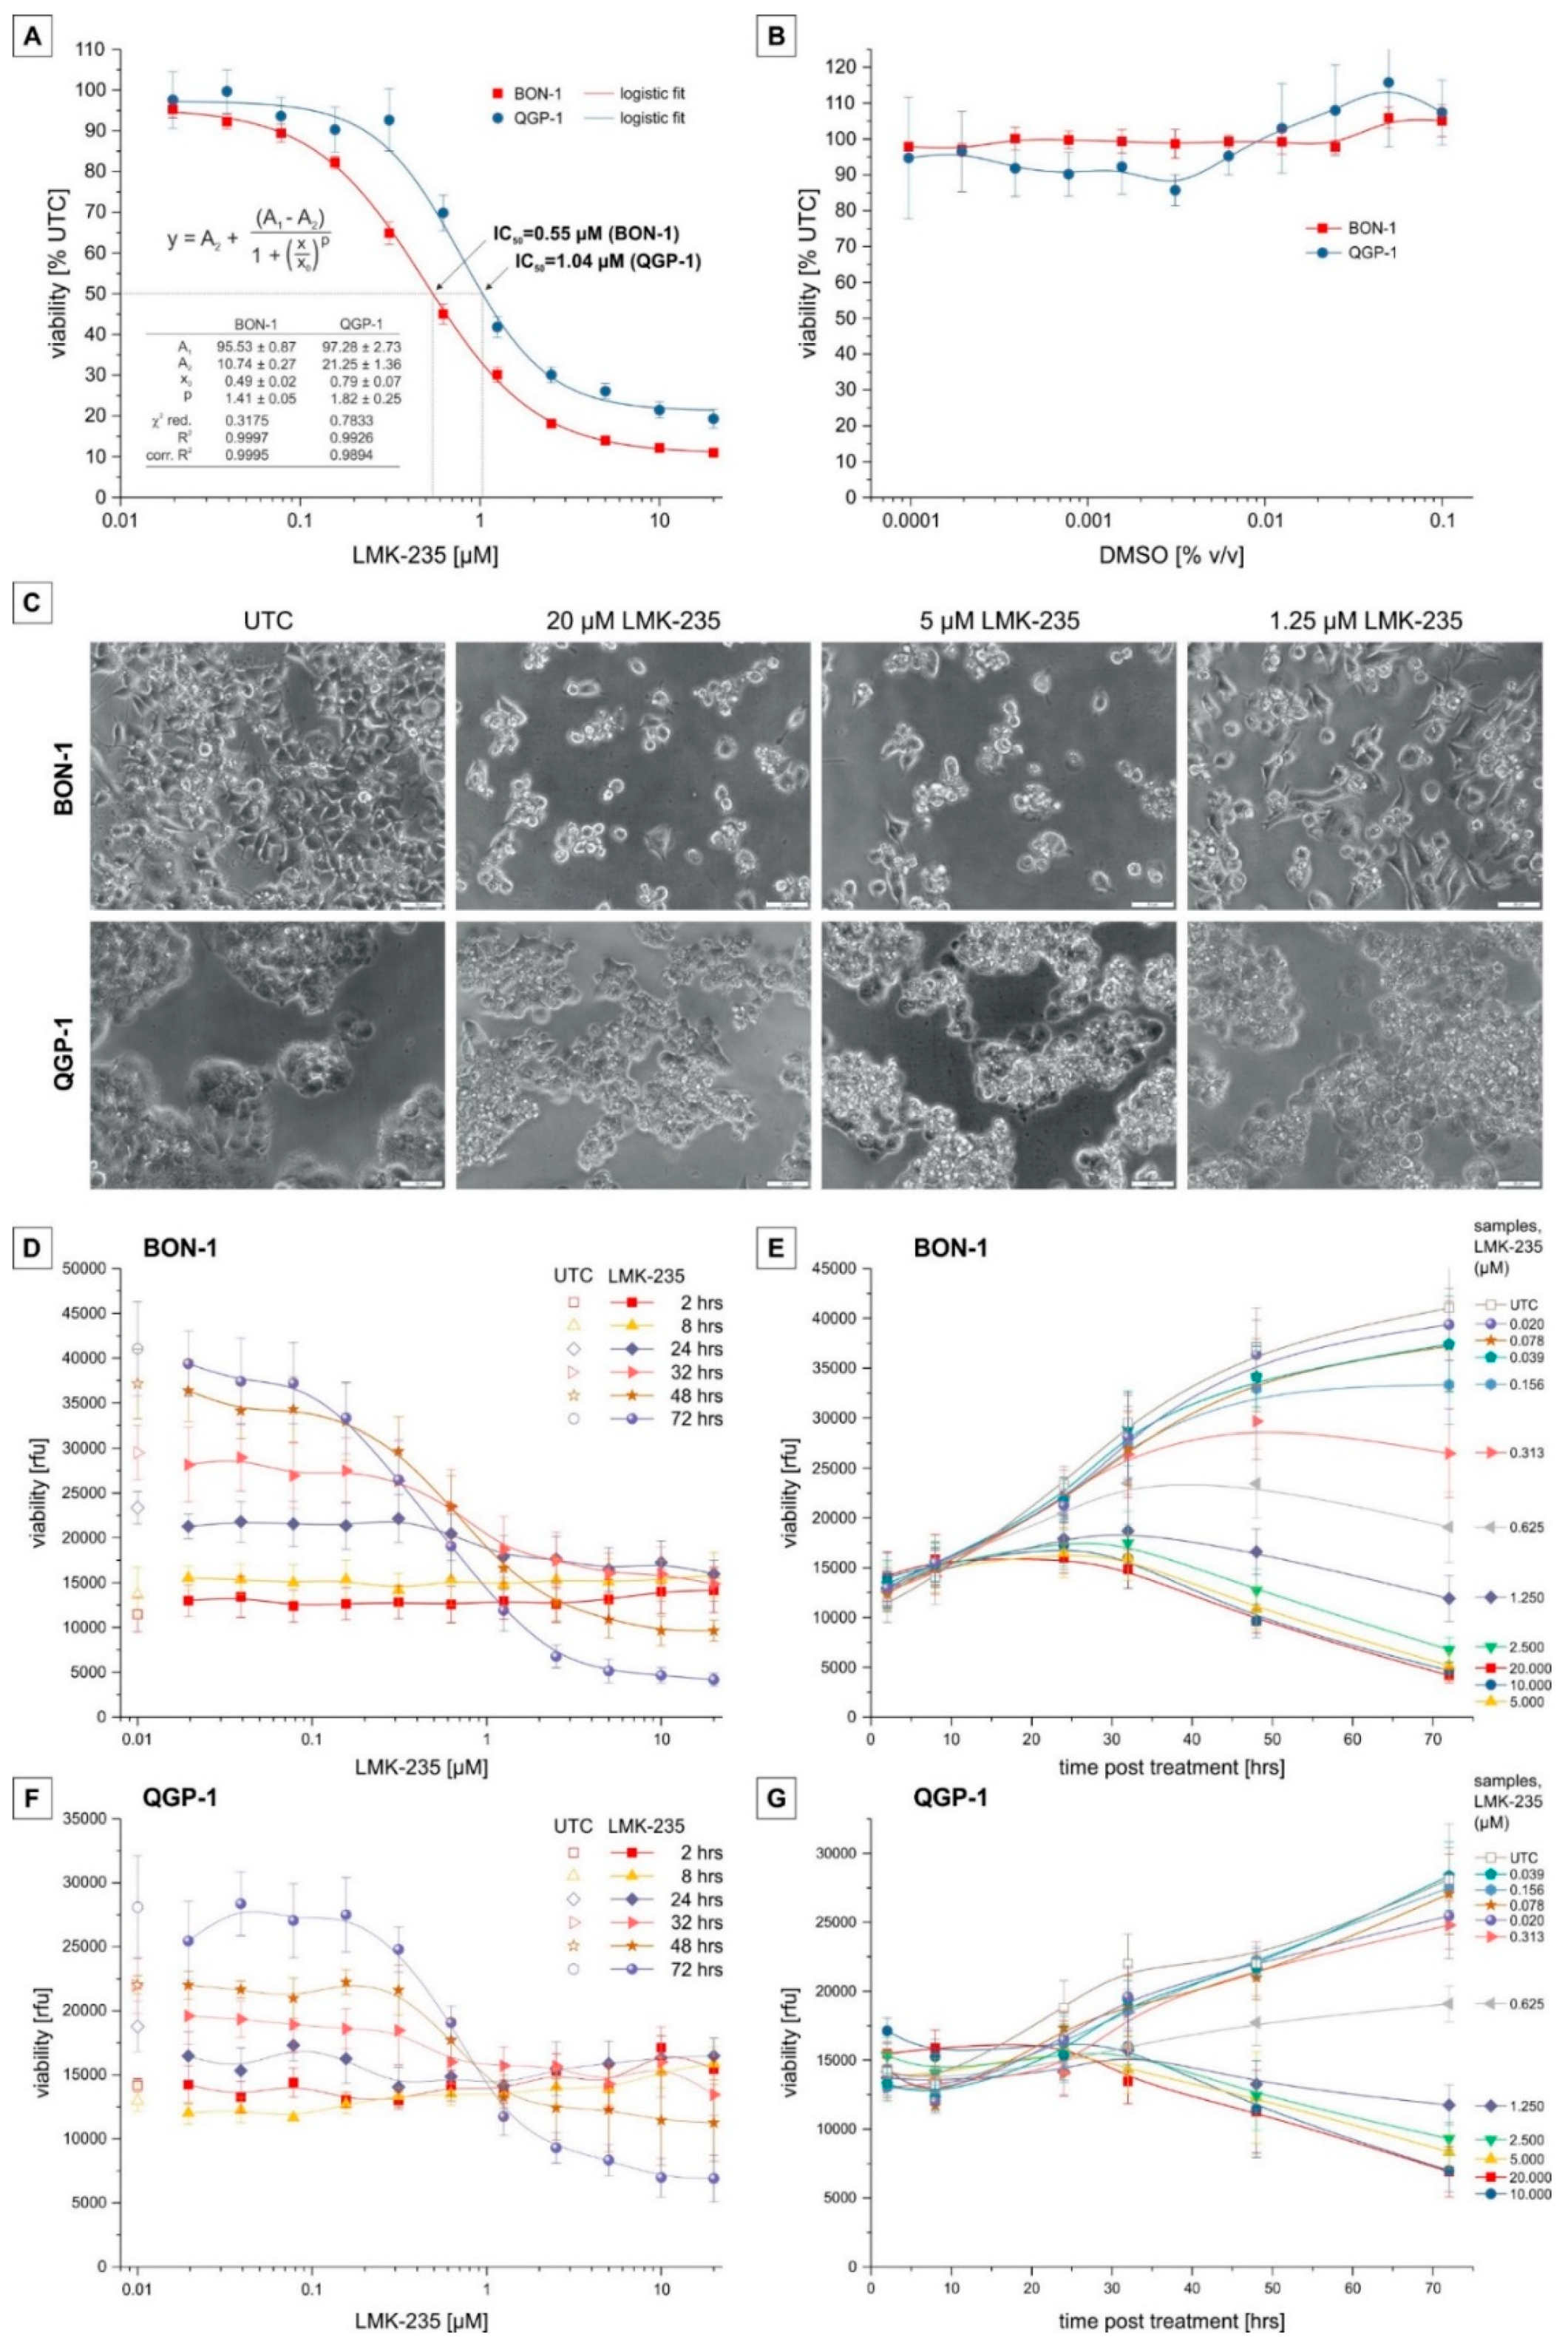
2.1. Cell Viability
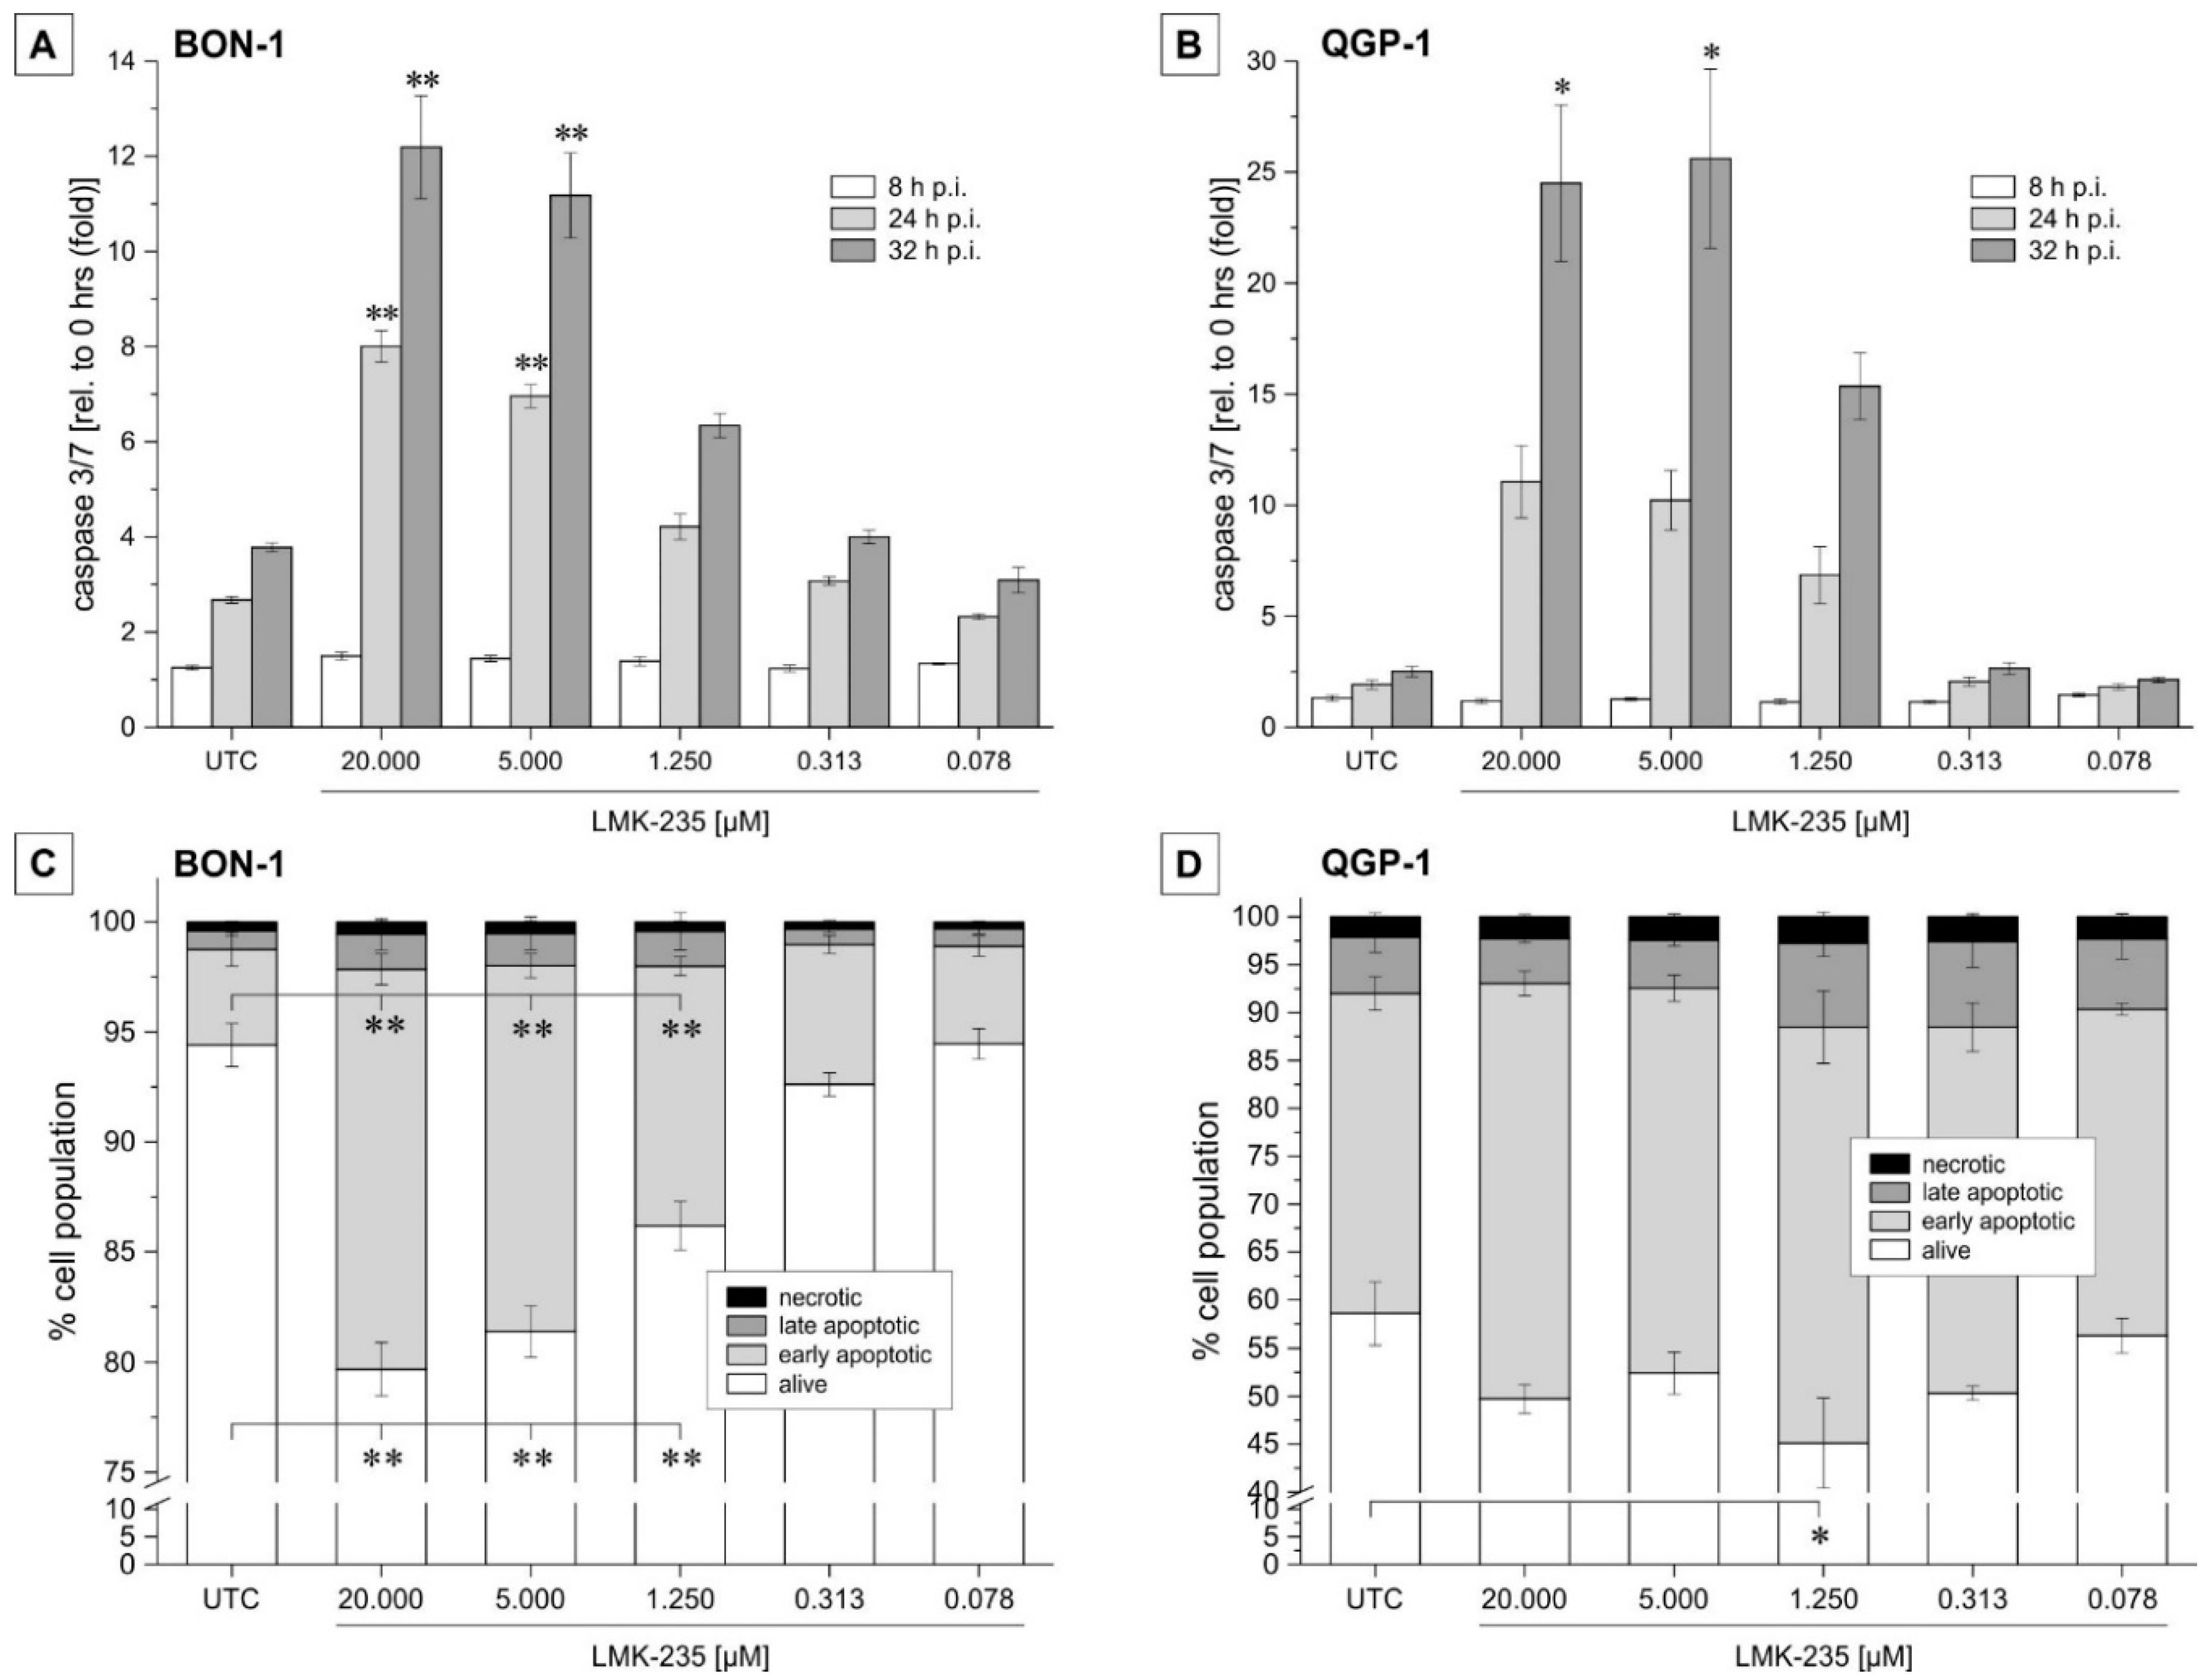
2.2. Apoptosis Induction
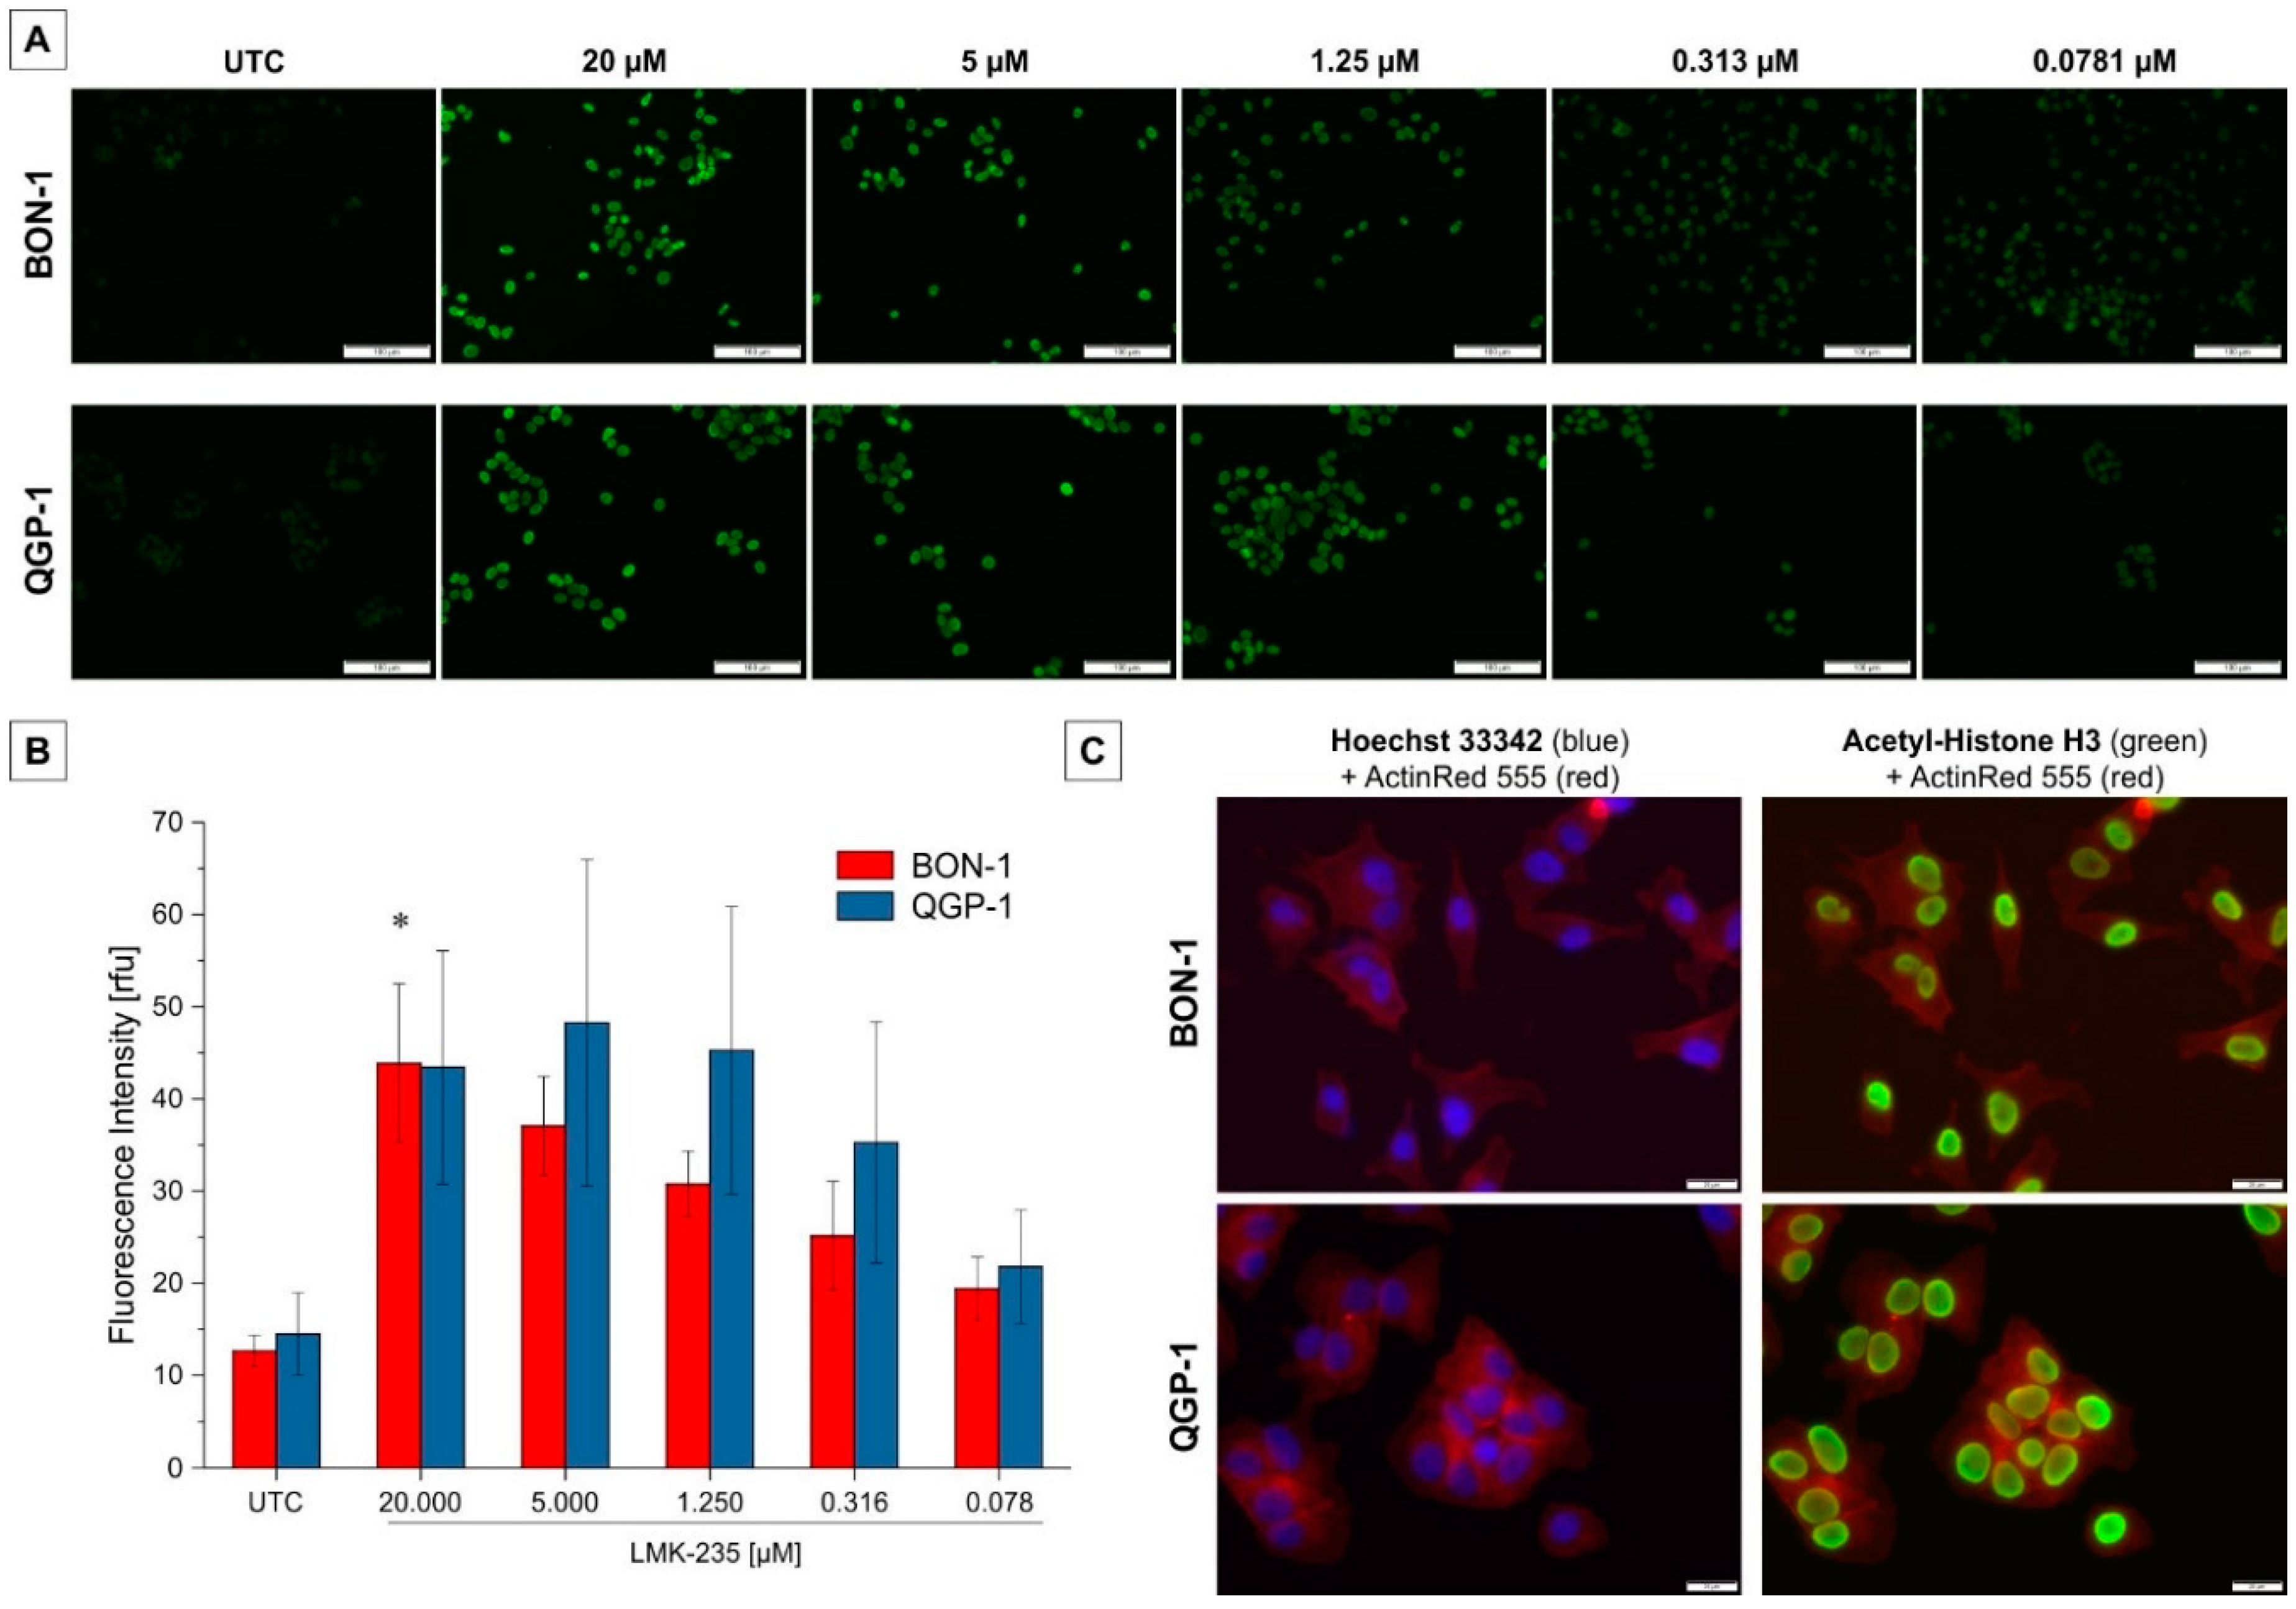
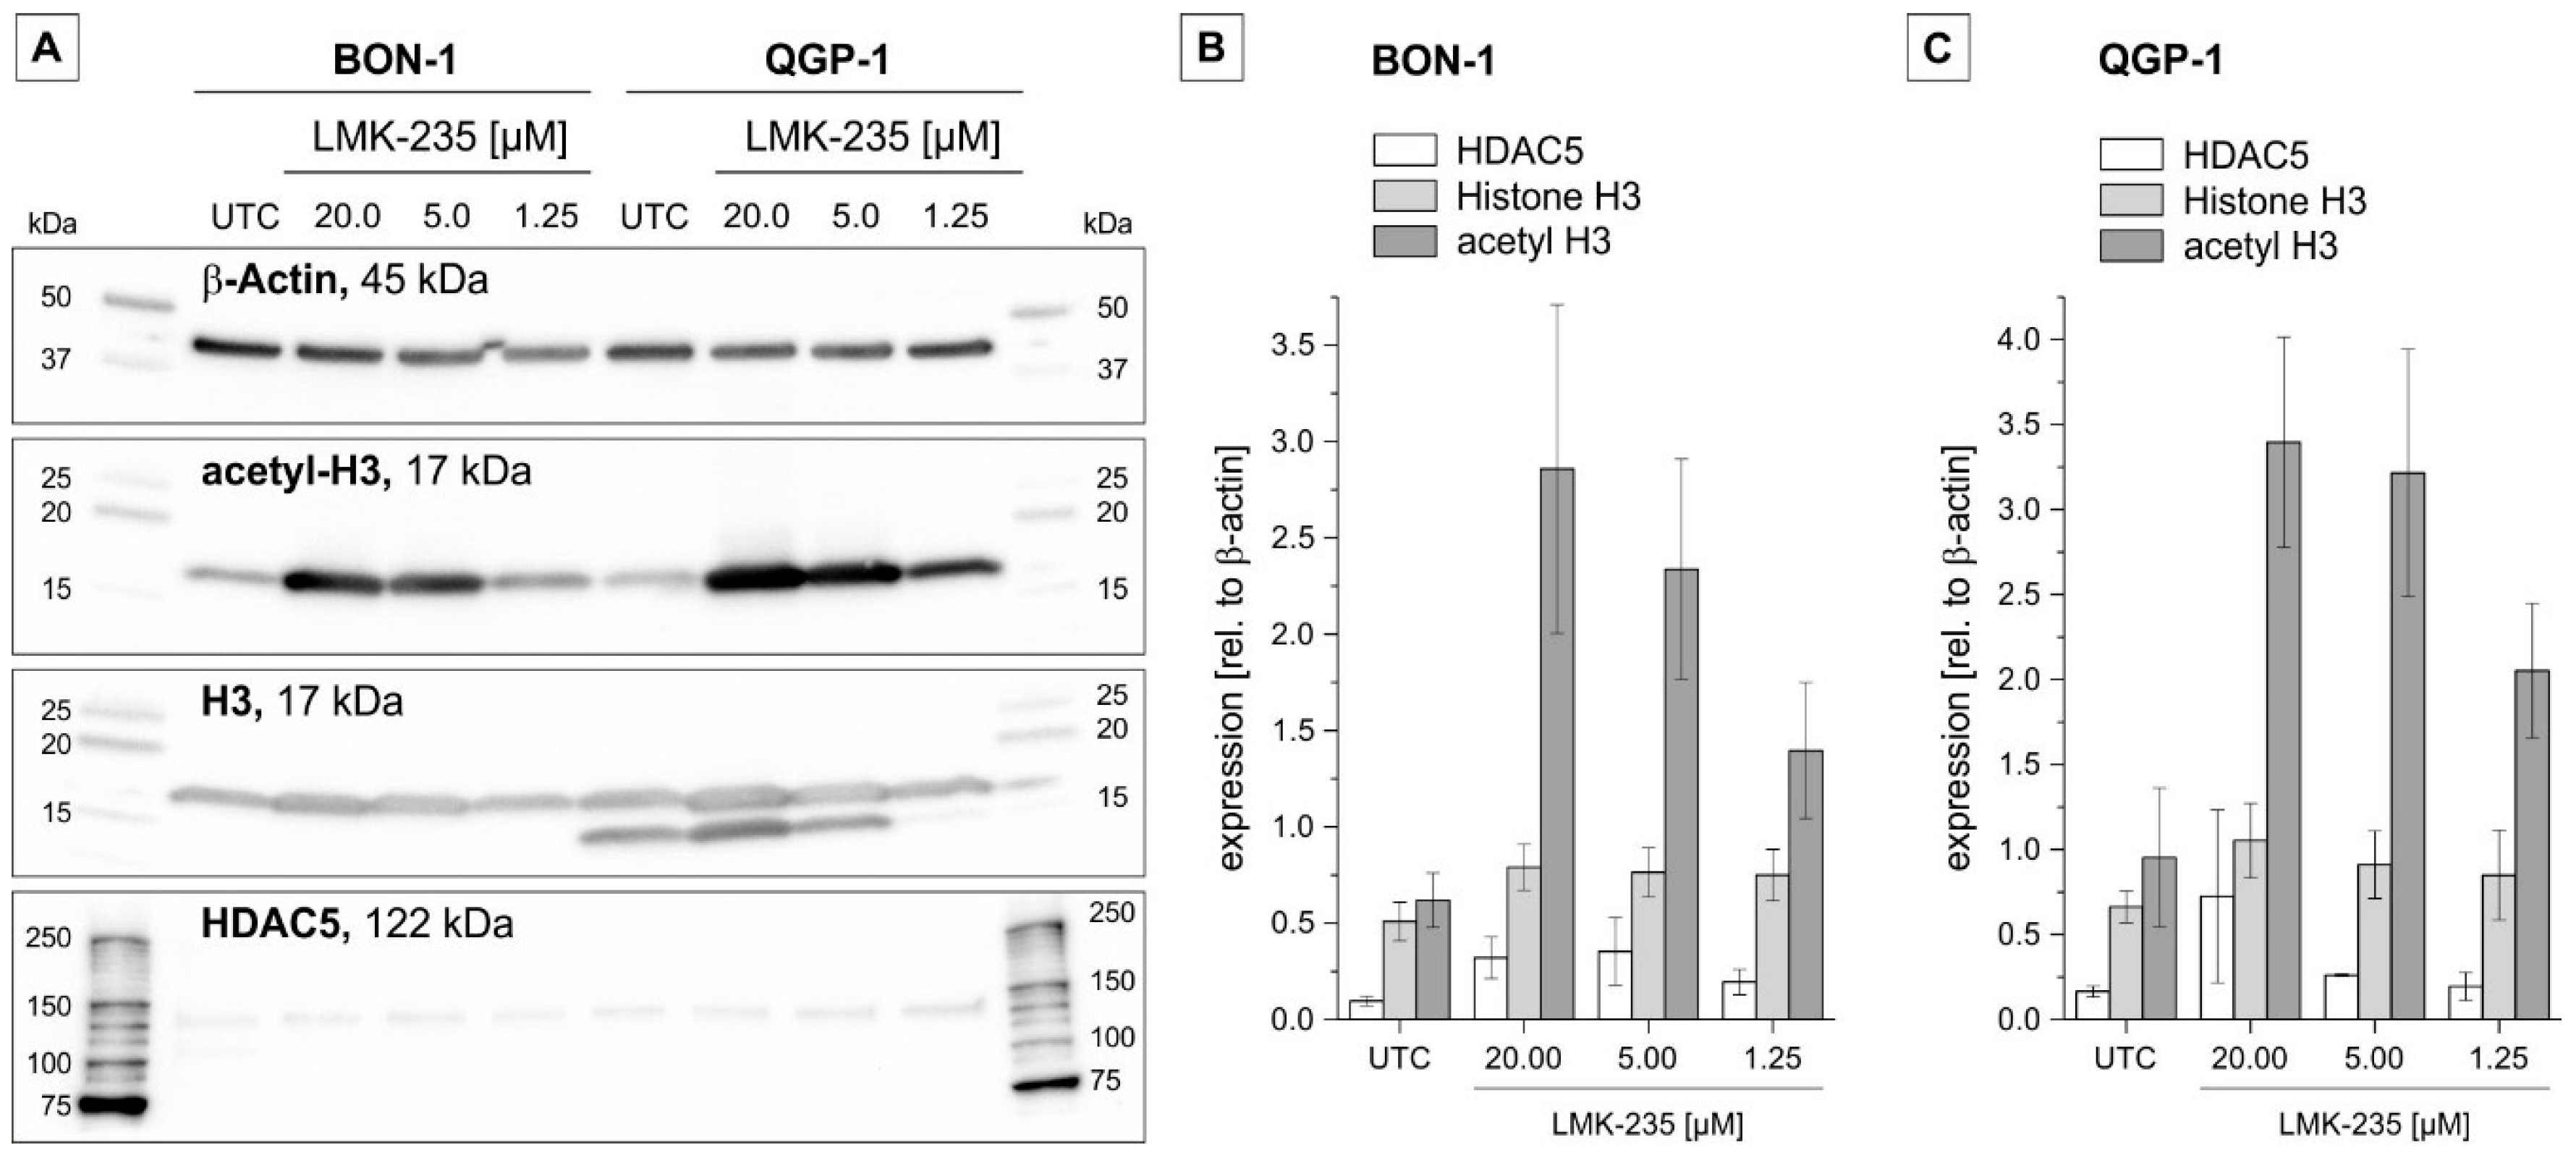
2.3. Effect on Acetyl-H3 Expression
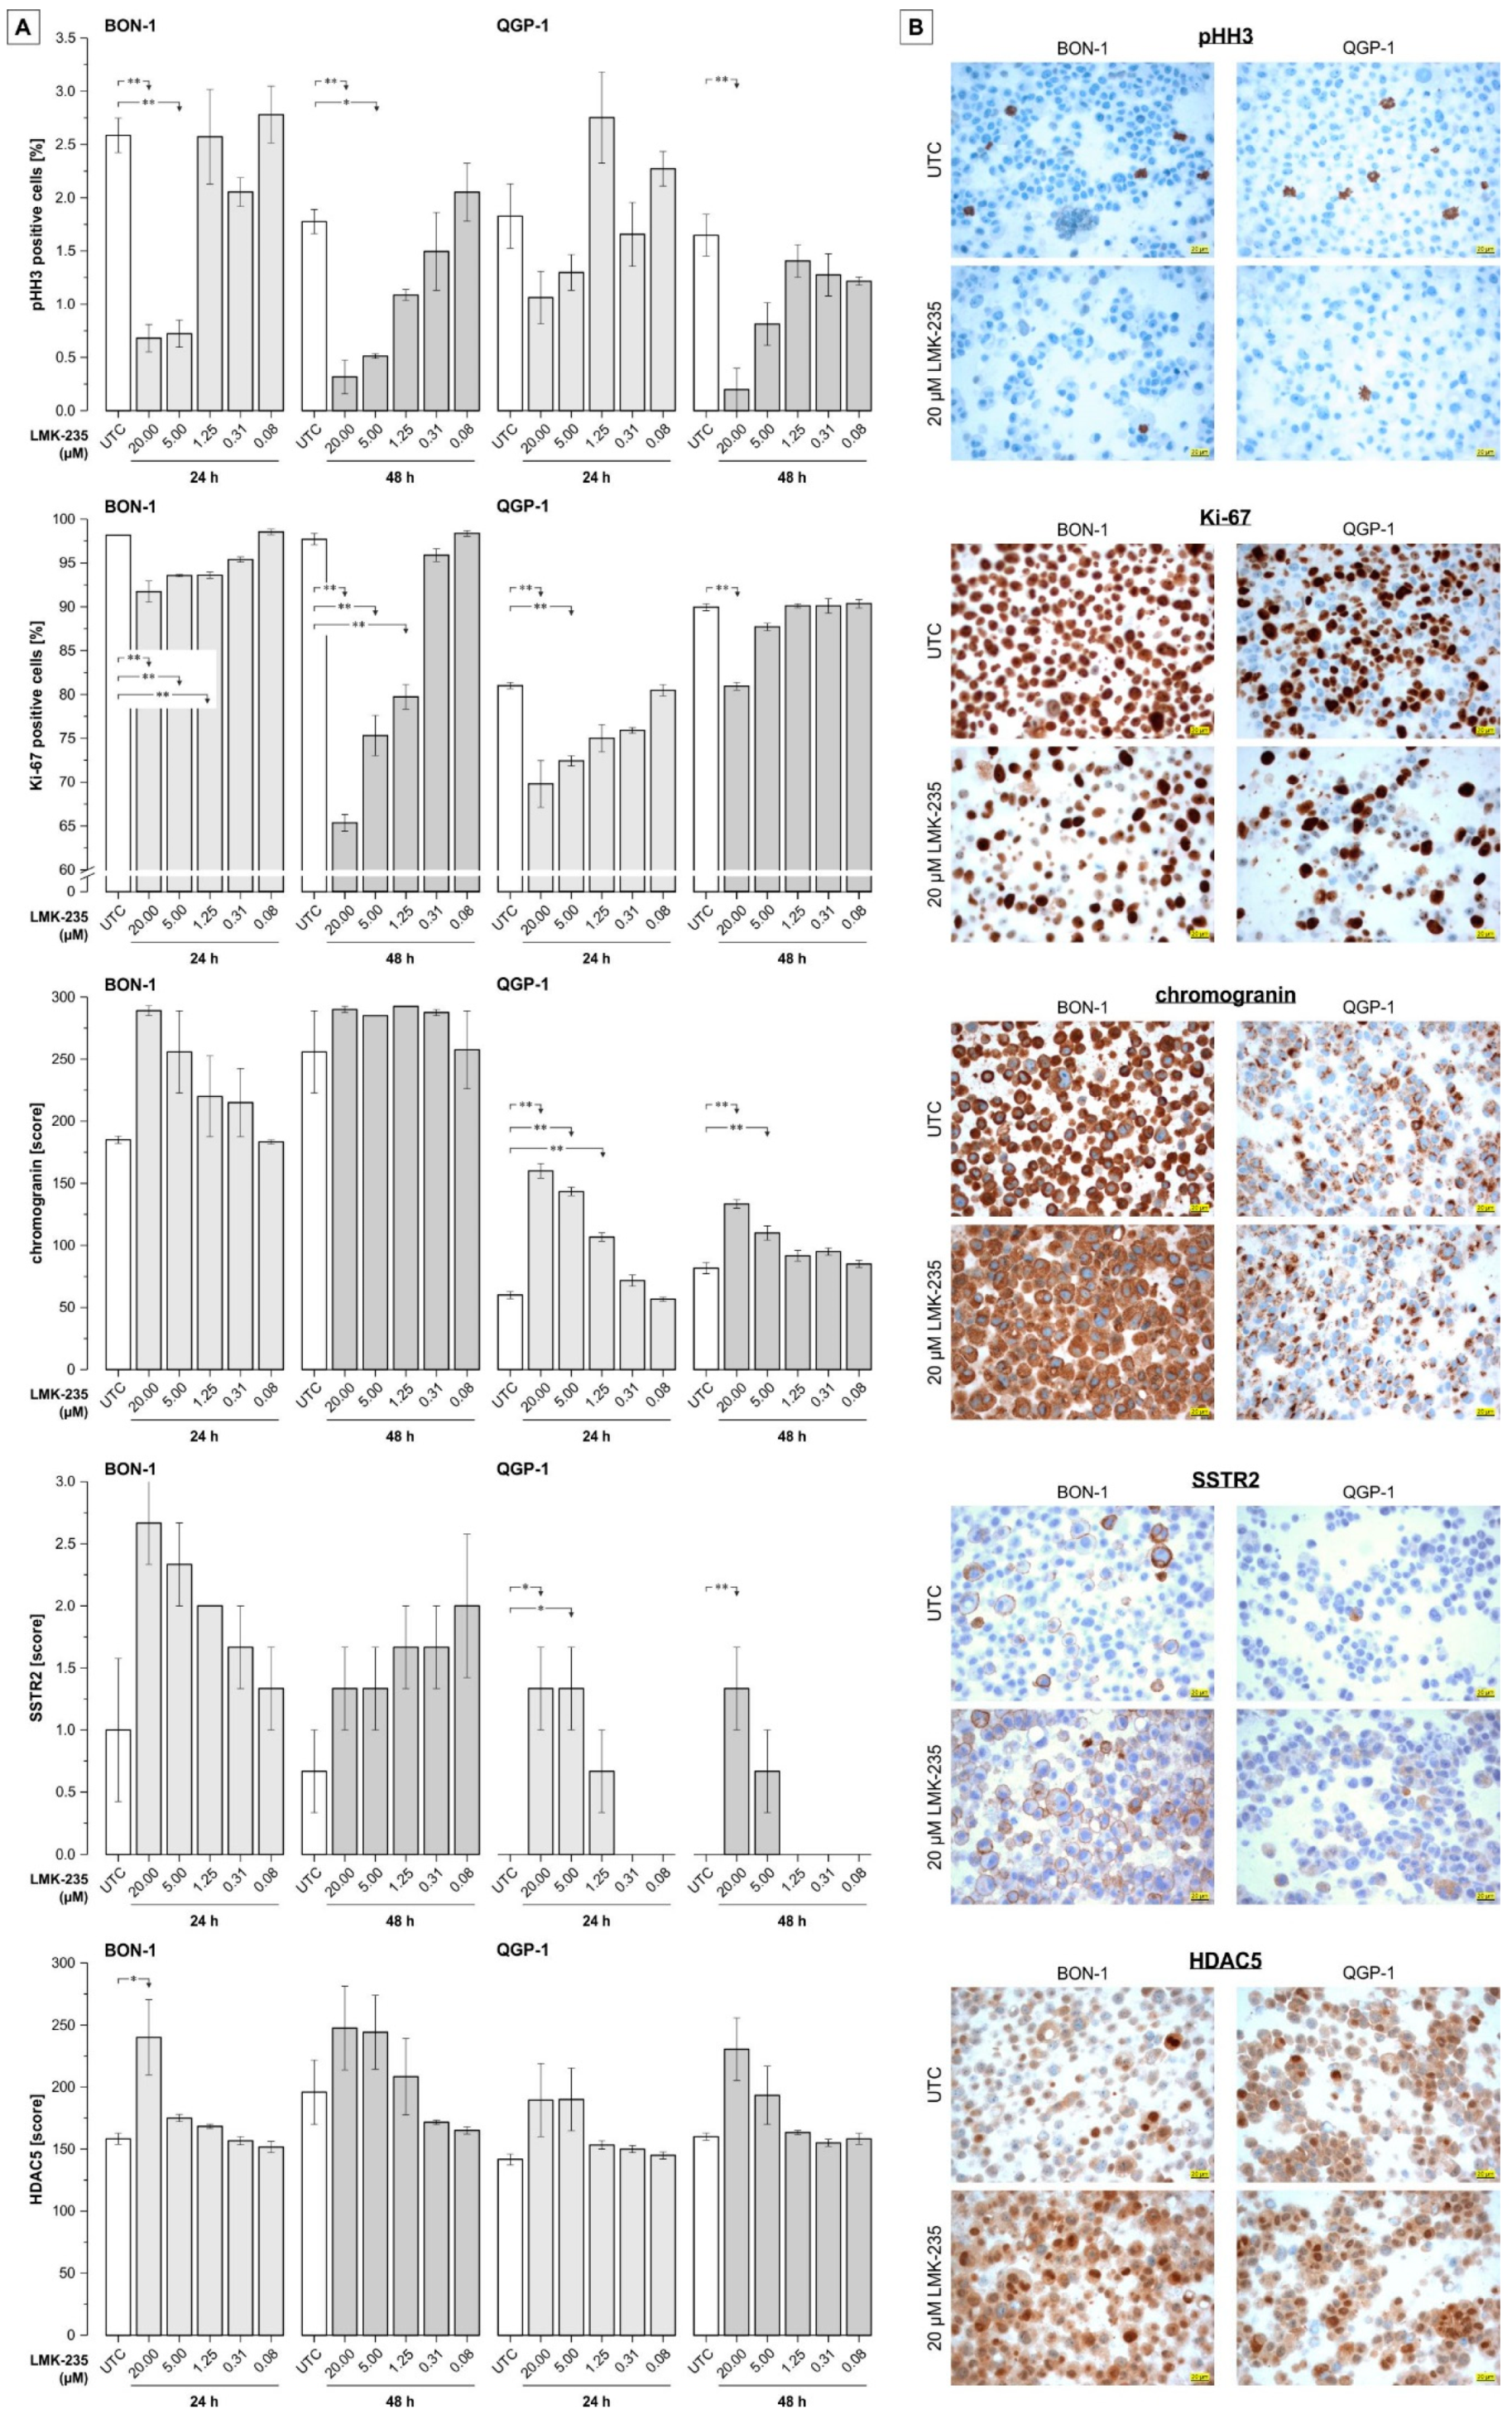
2.4. Effect of LMK-235 on Expression of Selected pNET-Relevant Proteins
3. Discussion
4. Materials and Methods
4.1. Cell Culture and Treatment
4.2. Viability
4.3. Apoptosis Detection
4.4. Effect on Acetyl-H3 Expression
4.5. Immunocytochemistry
4.6. Statistics
Author Contributions
Acknowledgments
Conflicts of Interest
References
- Schimmack, S.; Svejda, B.; Lawrence, B.; Kidd, M.; Modlin, I.M. The diversity and commonalities of gastroenteropancreatic neuroendocrine tumors. Langenbecks Arch. Surg. 2011, 396, 273–298. [Google Scholar] [CrossRef] [PubMed]
- Lawrence, B.; Gustafsson, B.I.; Chan, A.; Svejda, B.; Kidd, M.; Modlin, I.M. The epidemiology of gastroenteropancreatic neuroendocrine tumors. Endocrinol. Metab. Clin. N. Am. 2011, 40, 1–18. [Google Scholar] [CrossRef] [PubMed]
- Modlin, I.M.; Oberg, K.; Chung, D.C.; Jensen, R.T.; de Herder, W.W.; Thakker, R.V.; Caplin, M.; Delle Fave, G.; Kaltsas, G.A.; Krenning, E.P.; et al. Gastroenteropancreatic neuroendocrine tumours. Lancet Oncol. 2008, 9, 61–72. [Google Scholar] [CrossRef]
- Bosman, F.T.; Carneiro, F.; Hruban, R.H.; Theise, N.D. Nomenclature and classification of neuroendocrine neoplasms of the digestive system. In WHO Classification of Tumours of the Digestive System, 4th ed.; WHO Press World Health Organization: Geneva, Switzerland, 2010; pp. 13–14. ISBN 9789283224327. [Google Scholar]
- Öberg, K.; Knigge, U.; Kwekkeboom, D.; Perren, A. Neuroendocrine gastro-entero-pancreatic tumors: Esmo clinical practice guidelines for diagnosis, treatment and follow-up. Ann. Oncol. 2012, 23 (Suppl. 7), 124–130. [Google Scholar]
- Berardi, R.; Rinaldi, S.; Torniai, M.; Morgese, F.; Partelli, S.; Caramanti, M.; Onofri, A.; Polenta, V.; Pagliaretta, S.; Falconi, M.; et al. Gastrointestinal neuroendocrine tumors: Searching the optimal treatment strategy—A literature review. Crit. Rev. Oncol. Hematol. 2016, 98, 264–274. [Google Scholar] [CrossRef] [PubMed]
- Reid, M.D.; Balci, S.; Saka, B.; Adsay, N.V. Neuroendocrine tumors of the pancreas: Current concepts and controversies. Endocr. Pathol. 2014, 25, 65–79. [Google Scholar] [CrossRef] [PubMed]
- Guo, M.; Jia, Y.; Yu, Z.; House, M.G.; Esteller, M.; Brock, M.V.; Herman, J.G. Epigenetic changes associated with neoplasms of the exocrine and endocrine pancreas. Discov. Med. 2014, 17, 67–73. [Google Scholar] [PubMed]
- West, A.C.; Johnstone, R.W. New and emerging hdac inhibitors for cancer treatment. J. Clin. Investig. 2014, 124, 30–39. [Google Scholar] [CrossRef] [PubMed]
- Ropero, S.; Esteller, M. The role of histone deacetylases (HDACs) in human cancer. Mol. Oncol. 2007, 1, 19–25. [Google Scholar] [CrossRef] [PubMed] [Green Version]
- Seto, E.; Yoshida, M. Erasers of histone acetylation: The histone deacetylase enzymes. Cold Spring Harb. Perspect. Biol. 2014, 6, a018713. [Google Scholar] [CrossRef] [PubMed]
- Hsieh, T.H.; Hsu, C.Y.; Tsai, C.F.; Long, C.Y.; Wu, C.H.; Wu, D.C.; Lee, J.N.; Chang, W.C.; Tsai, E.M. HDAC inhibitors target HDAC5, upregulate microRNA-125a-5p, and induce apoptosis in breast cancer cells. Mol. Ther. 2015, 23, 656–666. [Google Scholar] [CrossRef] [PubMed]
- Li, A.; Liu, Z.; Li, M.; Zhou, S.; Xu, Y.; Xiao, Y.; Yang, W. HDAC5, a potential therapeutic target and prognostic biomarker, promotes proliferation, invasion and migration in human breast cancer. Oncotarget 2016, 7, 37966–37978. [Google Scholar] [CrossRef] [PubMed] [Green Version]
- Liu, J.; Gu, J.; Feng, Z.; Yang, Y.; Zhu, N.; Lu, W.; Qi, F. Both HDAC5 and HDAC6 are required for the proliferation and metastasis of melanoma cells. J. Transl. Med. 2016, 14, 7. [Google Scholar] [CrossRef] [PubMed]
- Wang, L.; Zou, X.; Berger, A.D.; Twiss, C.; Peng, Y.; Li, Y.; Chiu, J.; Guo, H.; Satagopan, J.; Wilton, A.; et al. Increased expression of histone deacetylaces (HDACs) and inhibition of prostate cancer growth and invasion by HDAC inhibitor saha. Am. J. Transl. Res. 2009, 1, 62–71. [Google Scholar] [PubMed]
- Li, Y.; Seto, E. HDACs and HDAC inhibitors in cancer development and therapy. Cold Spring Harb. Perspect. Med. 2016, 6. [Google Scholar] [CrossRef] [PubMed]
- Mann, B.S.; Johnson, J.R.; Cohen, M.H.; Justice, R.; Pazdur, R. FDA approval summary: Vorinostat for treatment of advanced primary cutaneous T-cell lymphoma. Oncologist 2007, 12, 1247–1252. [Google Scholar] [CrossRef] [PubMed]
- Frye, R.; Myers, M.; Axelrod, K.C.; Ness, E.A.; Piekarz, R.L.; Bates, S.E.; Booher, S. Romidepsin: A new drug for the treatment of cutaneous T-cell lymphoma. Clin. J. Oncol. Nurs. 2012, 16, 195–204. [Google Scholar] [CrossRef] [PubMed]
- Richardson, P.G.; Laubach, J.P.; Lonial, S.; Moreau, P.; Yoon, S.S.; Hungria, V.T.; Dimopoulos, M.A.; Beksac, M.; Alsina, M.; San-Miguel, J.F. Panobinostat: A novel pan-deacetylase inhibitor for the treatment of relapsed or relapsed and refractory multiple myeloma. Expert Rev. Anticancer Ther. 2015, 15, 737–748. [Google Scholar] [CrossRef] [PubMed]
- Jin, N.; Lubner, S.J.; Mulkerin, D.L.; Rajguru, S.; Carmichael, L.; Chen, H.; Holen, K.D.; LoConte, N.K. A phase II trial of a histone deacetylase inhibitor panobinostat in patients with low-grade neuroendocrine tumors. Oncologist 2016, 21, 785–786. [Google Scholar] [CrossRef] [PubMed]
- Klieser, E.; Urbas, R.; Stattner, S.; Primavesi, F.; Jager, T.; Dinnewitzer, A.; Mayr, C.; Kiesslich, T.; Holzmann, K.; Di Fazio, P.; et al. Comprehensive immunohistochemical analysis of histone deacetylases in pancreatic neuroendocrine tumors: HDAC5 as a predictor of poor clinical outcome. Hum. Pathol. 2017, 65, 41–52. [Google Scholar] [CrossRef] [PubMed]
- Ye, M.; Fang, Z.; Gu, H.; Song, R.; Ye, J.; Li, H.; Wu, Z.; Zhou, S.; Li, P.; Cai, X.; et al. Histone deacetylase 5 promotes the migration and invasion of hepatocellular carcinoma via increasing the transcription of hypoxia-inducible factor-1alpha under hypoxia condition. Tumour Biol. 2017, 39. [Google Scholar] [CrossRef] [PubMed]
- Fan, J.; Lou, B.; Chen, W.; Zhang, J.; Lin, S.; Lv, F.F.; Chen, Y. Down-regulation of HDAC5 inhibits growth of human hepatocellular carcinoma by induction of apoptosis and cell cycle arrest. Tumour Biol. 2014, 35, 11523–11532. [Google Scholar] [CrossRef] [PubMed]
- Liu, C.; Lv, D.; Li, M.; Zhang, X.; Sun, G.; Bai, Y.; Chang, D. Hypermethylation of miRNA-589 promoter leads to upregulation of HDAC5 which promotes malignancy in non-small cell lung cancer. Int. J. Oncol. 2017, 50, 2079–2090. [Google Scholar] [CrossRef] [PubMed]
- He, P.; Liang, J.; Shao, T.; Guo, Y.; Hou, Y.; Li, Y. HDAC5 promotes colorectal cancer cell proliferation by up-regulating dll4 expression. Int. J. Clin. Exp. Med. 2015, 8, 6510–6516. [Google Scholar] [PubMed]
- Arvidsson, Y.; Johanson, V.; Pfragner, R.; Wangberg, B.; Nilsson, O. Cytotoxic effects of valproic acid on neuroendocrine tumour cells. Neuroendocrinology 2016, 103, 578–591. [Google Scholar] [CrossRef] [PubMed]
- Baradari, V.; Huether, A.; Hopfner, M.; Schuppan, D.; Scherubl, H. Antiproliferative and proapoptotic effects of histone deacetylase inhibitors on gastrointestinal neuroendocrine tumor cells. Endocr. Relat. Cancer 2006, 13, 1237–1250. [Google Scholar] [CrossRef] [PubMed] [Green Version]
- Cecconi, D.; Donadelli, M.; Rinalducci, S.; Zolla, L.; Scupoli, M.T.; Scarpa, A.; Palmieri, M.; Righetti, P.G. Proteomic analysis of pancreatic endocrine tumor cell lines treated with the histone deacetylase inhibitor trichostatin A. Proteomics 2007, 7, 1644–1653. [Google Scholar] [CrossRef] [PubMed]
- Jang, S.; Janssen, A.; Aburjania, Z.; Robers, M.B.; Harrison, A.; Dammalapati, A.; Cheng, Y.Q.; Chen, H.; Jaskula-Sztul, R. Histone deacetylase inhibitor thailandepsin-a activates notch signaling and suppresses neuroendocrine cancer cell growth in vivo. Oncotarget 2017, 8, 70828–70840. [Google Scholar] [CrossRef] [PubMed]
- Jang, S.; Jin, H.; Roy, M.; Ma, A.L.; Gong, S.; Jaskula-Sztul, R.; Chen, H. Antineoplastic effects of histone deacetylase inhibitors in neuroendocrine cancer cells are mediated through transcriptional regulation of notch1 by activator protein 1. Cancer Med. 2017, 6, 2142–2152. [Google Scholar] [CrossRef] [PubMed]
- Marek, L.; Hamacher, A.; Hansen, F.K.; Kuna, K.; Gohlke, H.; Kassack, M.U.; Kurz, T. Histone deacetylase (HDAC) inhibitors with a novel connecting unit linker region reveal a selectivity profile for HDAC4 and HDAC5 with improved activity against chemoresistant cancer cells. J. Med. Chem. 2013, 56, 427–436. [Google Scholar] [CrossRef] [PubMed]
- Zhao, M.; Li, L.; Zhou, J.; Cui, X.; Tian, Q.; Jin, Y.; Zhu, Y. Mir-2861 behaves as a biomarker of lung cancer stem cells and regulates the HDAC5-erk system genes. Cell. Reprogram. 2018, 20, 99–106. [Google Scholar] [CrossRef] [PubMed]
- Li, X.; He, Z.; Cheng, B.; Fang, Q.; Ma, D.; Lu, T.; Wei, D.; Kuang, X.; Tang, S.; Xiong, J.; et al. Effect of BCLAF1 on HDAC inhibitor LMK-235-mediated apoptosis of diffuse large B cell lymphoma cells and its mechanism. Cancer Biol. Ther. 2018, 1–30. [Google Scholar] [CrossRef] [PubMed]
- Kaletsch, A.; Pinkerneil, M.; Hoffmann, M.J.; Jaguva Vasudevan, A.A.; Wang, C.; Hansen, F.K.; Wiek, C.; Hanenberg, H.; Gertzen, C.; Gohlke, H.; et al. Effects of novel HDAC inhibitors on urothelial carcinoma cells. Clin. Epigenet. 2018, 10, 100. [Google Scholar] [CrossRef] [PubMed]
- Peixoto, P.; Castronovo, V.; Matheus, N.; Polese, C.; Peulen, O.; Gonzalez, A.; Boxus, M.; Verdin, E.; Thiry, M.; Dequiedt, F.; et al. HDAC5 is required for maintenance of pericentric heterochromatin, and controls cell-cycle progression and survival of human cancer cells. Cell Death Differ. 2012, 19, 1239–1252. [Google Scholar] [CrossRef] [PubMed]
- Huang, Y.; Tan, M.; Gosink, M.; Wang, K.K.W.; Sun, Y. Histone deacetylase 5 is not a p53 target gene, but its overexpression inhibits tumor cell growth and induces apoptosis. Cancer Res. 2002, 62, 2913. [Google Scholar] [PubMed]
- Guo, Y.; Fang, Q.; Ma, D.; Yu, K.; Cheng, B.; Tang, S.; Lu, T.; Wang, W.; Wang, J. Up-regulation of HO-1 promotes resistance of B-cell acute lymphocytic leukemia cells to HDAC4/5 inhibitor LMK-235 via the Smad7 pathway. Life Sci. 2018, 207, 386–394. [Google Scholar] [CrossRef] [PubMed]
- Song, K.B.; Kim, S.C.; Kim, J.H.; Seo, D.W.; Hong, S.M.; Park, K.M.; Hwang, D.W.; Lee, J.H.; Lee, Y.J. Prognostic value of somatostatin receptor subtypes in pancreatic neuroendocrine tumors. Pancreas 2016, 45, 187–192. [Google Scholar] [CrossRef] [PubMed]
- Qian, Z.R.; Li, T.; Ter-Minassian, M.; Yang, J.; Chan, J.A.; Brais, L.K.; Masugi, Y.; Thiaglingam, A.; Brooks, N.; Nishihara, R.; et al. Association between somatostatin receptor expression and clinical outcomes in neuroendocrine tumors. Pancreas 2016, 45, 1386–1393. [Google Scholar] [CrossRef] [PubMed]
- Narayanan, S.; Kunz, P.L. Role of somatostatin analogues in the treatment of neuroendocrine tumors. Hematol. Oncol. Clin. N. Am. 2016, 30, 163–177. [Google Scholar] [CrossRef] [PubMed]
- Papaxoinis, G.; Syrigos, K.; Saif, M.W. New concepts in the treatment strategy of neuroendocrine tumors: The role of biotherapy. Discov. Med. 2016, 21, 381–389. [Google Scholar] [PubMed]
- Werner, R.A.; Ilhan, H.; Lehner, S.; Papp, L.; Zsoter, N.; Schatka, I.; Muegge, D.O.; Javadi, M.S.; Higuchi, T.; Buck, A.K.; et al. Pre-therapy somatostatin receptor-based heterogeneity predicts overall survival in pancreatic neuroendocrine tumor patients undergoing peptide receptor radionuclide therapy. Mol. Imaging Biol. 2018. [Google Scholar] [CrossRef]
- Oksuz, M.O.; Winter, L.; Pfannenberg, C.; Reischl, G.; Mussig, K.; Bares, R.; Dittmann, H. Peptide receptor radionuclide therapy of neuroendocrine tumors with (90)Y-DOTATOC: Is treatment response predictable by pre-therapeutic uptake of (68) Ga-DOTATOC? Diagn. Interv. Imaging 2014, 95, 289–300. [Google Scholar] [CrossRef] [PubMed]
- McDermott, J.; Jimeno, A. Belinostat for the treatment of peripheral T-cell lymphomas. Drugs Today 2014, 50, 337–345. [Google Scholar] [CrossRef] [PubMed]
- Evers, B.M.; Ishizuka, J.; Townsend, C.M., Jr.; Thompson, J.C. The human carcinoid cell line, bon. A model system for the study of carcinoid tumors. Ann. N. Y. Acad. Sci. 1994, 733, 393–406. [Google Scholar] [CrossRef] [PubMed]
- Evers, B.M.; Townsend, C.M., Jr.; Upp, J.R.; Allen, E.; Hurlbut, S.C.; Kim, S.W.; Rajaraman, S.; Singh, P.; Reubi, J.C.; Thompson, J.C. Establishment and characterization of a human carcinoid in nude mice and effect of various agents on tumor growth. Gastroenterology 1991, 101, 303–311. [Google Scholar] [CrossRef]
- Kaku, M.; Nishiyama, T.; Yagawa, K.; Abe, M. Establishment of a carcinoembryonic antigen-producing cell line from human pancreatic carcinoma. Gan 1980, 71, 596–601. [Google Scholar] [PubMed]
- Schneider, C.A.; Rasband, W.S.; Eliceiri, K.W. NIH Image to ImageJ: 25 years of image analysis. Nat. Methods 2012, 9, 671–675. [Google Scholar] [CrossRef] [PubMed] [Green Version]
- Kemmerling, R.; Weyland, D.; Kiesslich, T.; Illig, R.; Klieser, E.; Jager, T.; Dietze, O.; Neureiter, D. Robust linear regression model of Ki-67 for mitotic rate in gastrointestinal stromal tumors. Oncol. Lett. 2014, 7, 745–749. [Google Scholar] [CrossRef] [PubMed] [Green Version]
- Mayr, C.; Helm, K.; Jakab, M.; Ritter, M.; Shrestha, R.; Makaju, R.; Wagner, A.; Pichler, M.; Beyreis, M.; Staettner, S.; et al. The histone methyltransferase G9a: A new therapeutic target in biliary tract cancer. Hum. Pathol. 2018, 72, 117–126. [Google Scholar] [CrossRef] [PubMed]
- Detre, S.; Saclani Jotti, G.; Dowsett, M. A “quickscore” method for immunohistochemical semiquantitation: Validation for oestrogen receptor in breast carcinomas. J. Clin. Pathol. 1995, 48, 876–878. [Google Scholar] [CrossRef] [PubMed]
- Volante, M.; Brizzi, M.P.; Faggiano, A.; La Rosa, S.; Rapa, I.; Ferrero, A.; Mansueto, G.; Righi, L.; Garancini, S.; Capella, C.; et al. Somatostatin receptor type 2A immunohistochemistry in neuroendocrine tumors: A proposal of scoring system correlated with somatostatin receptor scintigraphy. Mod. Pathol. 2007, 20, 1172–1182. [Google Scholar] [CrossRef] [PubMed]


© 2018 by the authors. Licensee MDPI, Basel, Switzerland. This article is an open access article distributed under the terms and conditions of the Creative Commons Attribution (CC BY) license (http://creativecommons.org/licenses/by/4.0/).
Share and Cite
Wanek, J.; Gaisberger, M.; Beyreis, M.; Mayr, C.; Helm, K.; Primavesi, F.; Jäger, T.; Di Fazio, P.; Jakab, M.; Wagner, A.; et al. Pharmacological Inhibition of Class IIA HDACs by LMK-235 in Pancreatic Neuroendocrine Tumor Cells. Int. J. Mol. Sci. 2018, 19, 3128. https://doi.org/10.3390/ijms19103128
Wanek J, Gaisberger M, Beyreis M, Mayr C, Helm K, Primavesi F, Jäger T, Di Fazio P, Jakab M, Wagner A, et al. Pharmacological Inhibition of Class IIA HDACs by LMK-235 in Pancreatic Neuroendocrine Tumor Cells. International Journal of Molecular Sciences. 2018; 19(10):3128. https://doi.org/10.3390/ijms19103128
Chicago/Turabian StyleWanek, Julia, Martin Gaisberger, Marlena Beyreis, Christian Mayr, Katharina Helm, Florian Primavesi, Tarkan Jäger, Pietro Di Fazio, Martin Jakab, Andrej Wagner, and et al. 2018. "Pharmacological Inhibition of Class IIA HDACs by LMK-235 in Pancreatic Neuroendocrine Tumor Cells" International Journal of Molecular Sciences 19, no. 10: 3128. https://doi.org/10.3390/ijms19103128