1. Introduction
Thyroid cancer is common type of malignant tumor, affecting approximately 1% of the total population. Thyroid cancer manifests as several common subtypes, including papillary thyroid carcinoma (PTC), follicular carcinoma (FC), medullary carcinoma (MC), poorly differentiated carcinoma (PDC), and anaplastic carcinoma (AC). Notably, the cellular origin, clinical manifestation, metastatic pattern, and clinical prognosis have been reported to differ depending on the subtype [
1].
In the field of cancer research, autophagy, defined as the lysosomal degradation of cellular components, has recently received considerable attention. Autophagy plays an important role in homeostasis through the removal of dysfunctional or damaged cellular components and recycling of necessary cellular components [
2,
3,
4,
5]. Among the various proteins involved in the autophagy process, the following markers are commonly used to evaluate autophagic activity: light chain (LC) 3, which participates in elongation and contributes to autophagosome formation [
6,
7,
8]; p62, a scaffold protein that transfers ubiquitinated proteins to the autophagosome [
9,
10]; and BCL2/adenovirus E1B 19 kDa protein-interacting protein 3 (BNIP3), a mitochondrial autophagy (mitophagy) regulator [
11].
Given its role in homeostasis, autophagy acts as a double-edged sword in cancers. The high metabolic demands of highly aggressive malignant tumors cannot be satisfied by angiogenesis and/or aerobic glycolysis alone, leading to activation of the alternative metabolic pathway in which cytoplasmic components are recycled via autophagy to provide a source of cellular energy [
12,
13]. However, unrestrained autophagy eventually leads to cell death following the progressive consumption of cellular constituents [
14,
15]. Accordingly, autophagy plays roles in both tumor suppression and progression, and the autophagy status has been linked to the tumor subtype in various types of cancer [
16,
17,
18,
19,
20].
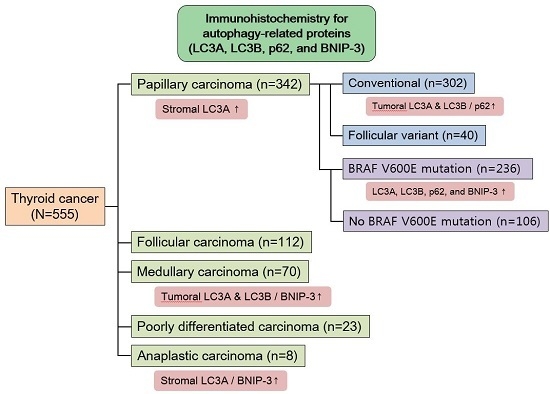
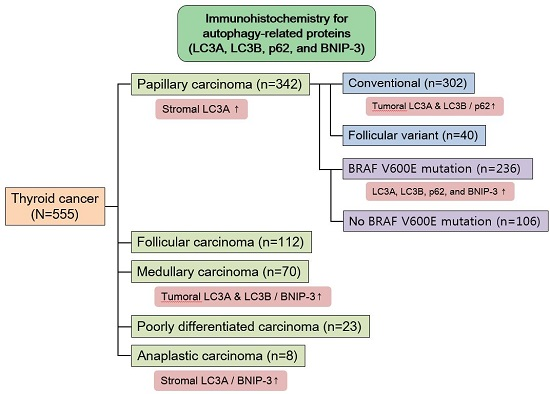
In human thyroid cancer, the autophagy status may similarly vary according to the tumor subtype. However, previous studies regarding the expression of autophagy-related proteins in thyroid cancer have not yielded clear results. Therefore, in this study, we investigated the expression of LC3A, LC3B, p62, and BNIP-3, the major components of autophagy, in human thyroid carcinomas, as well as the implications of these expression patterns.
3. Discussion
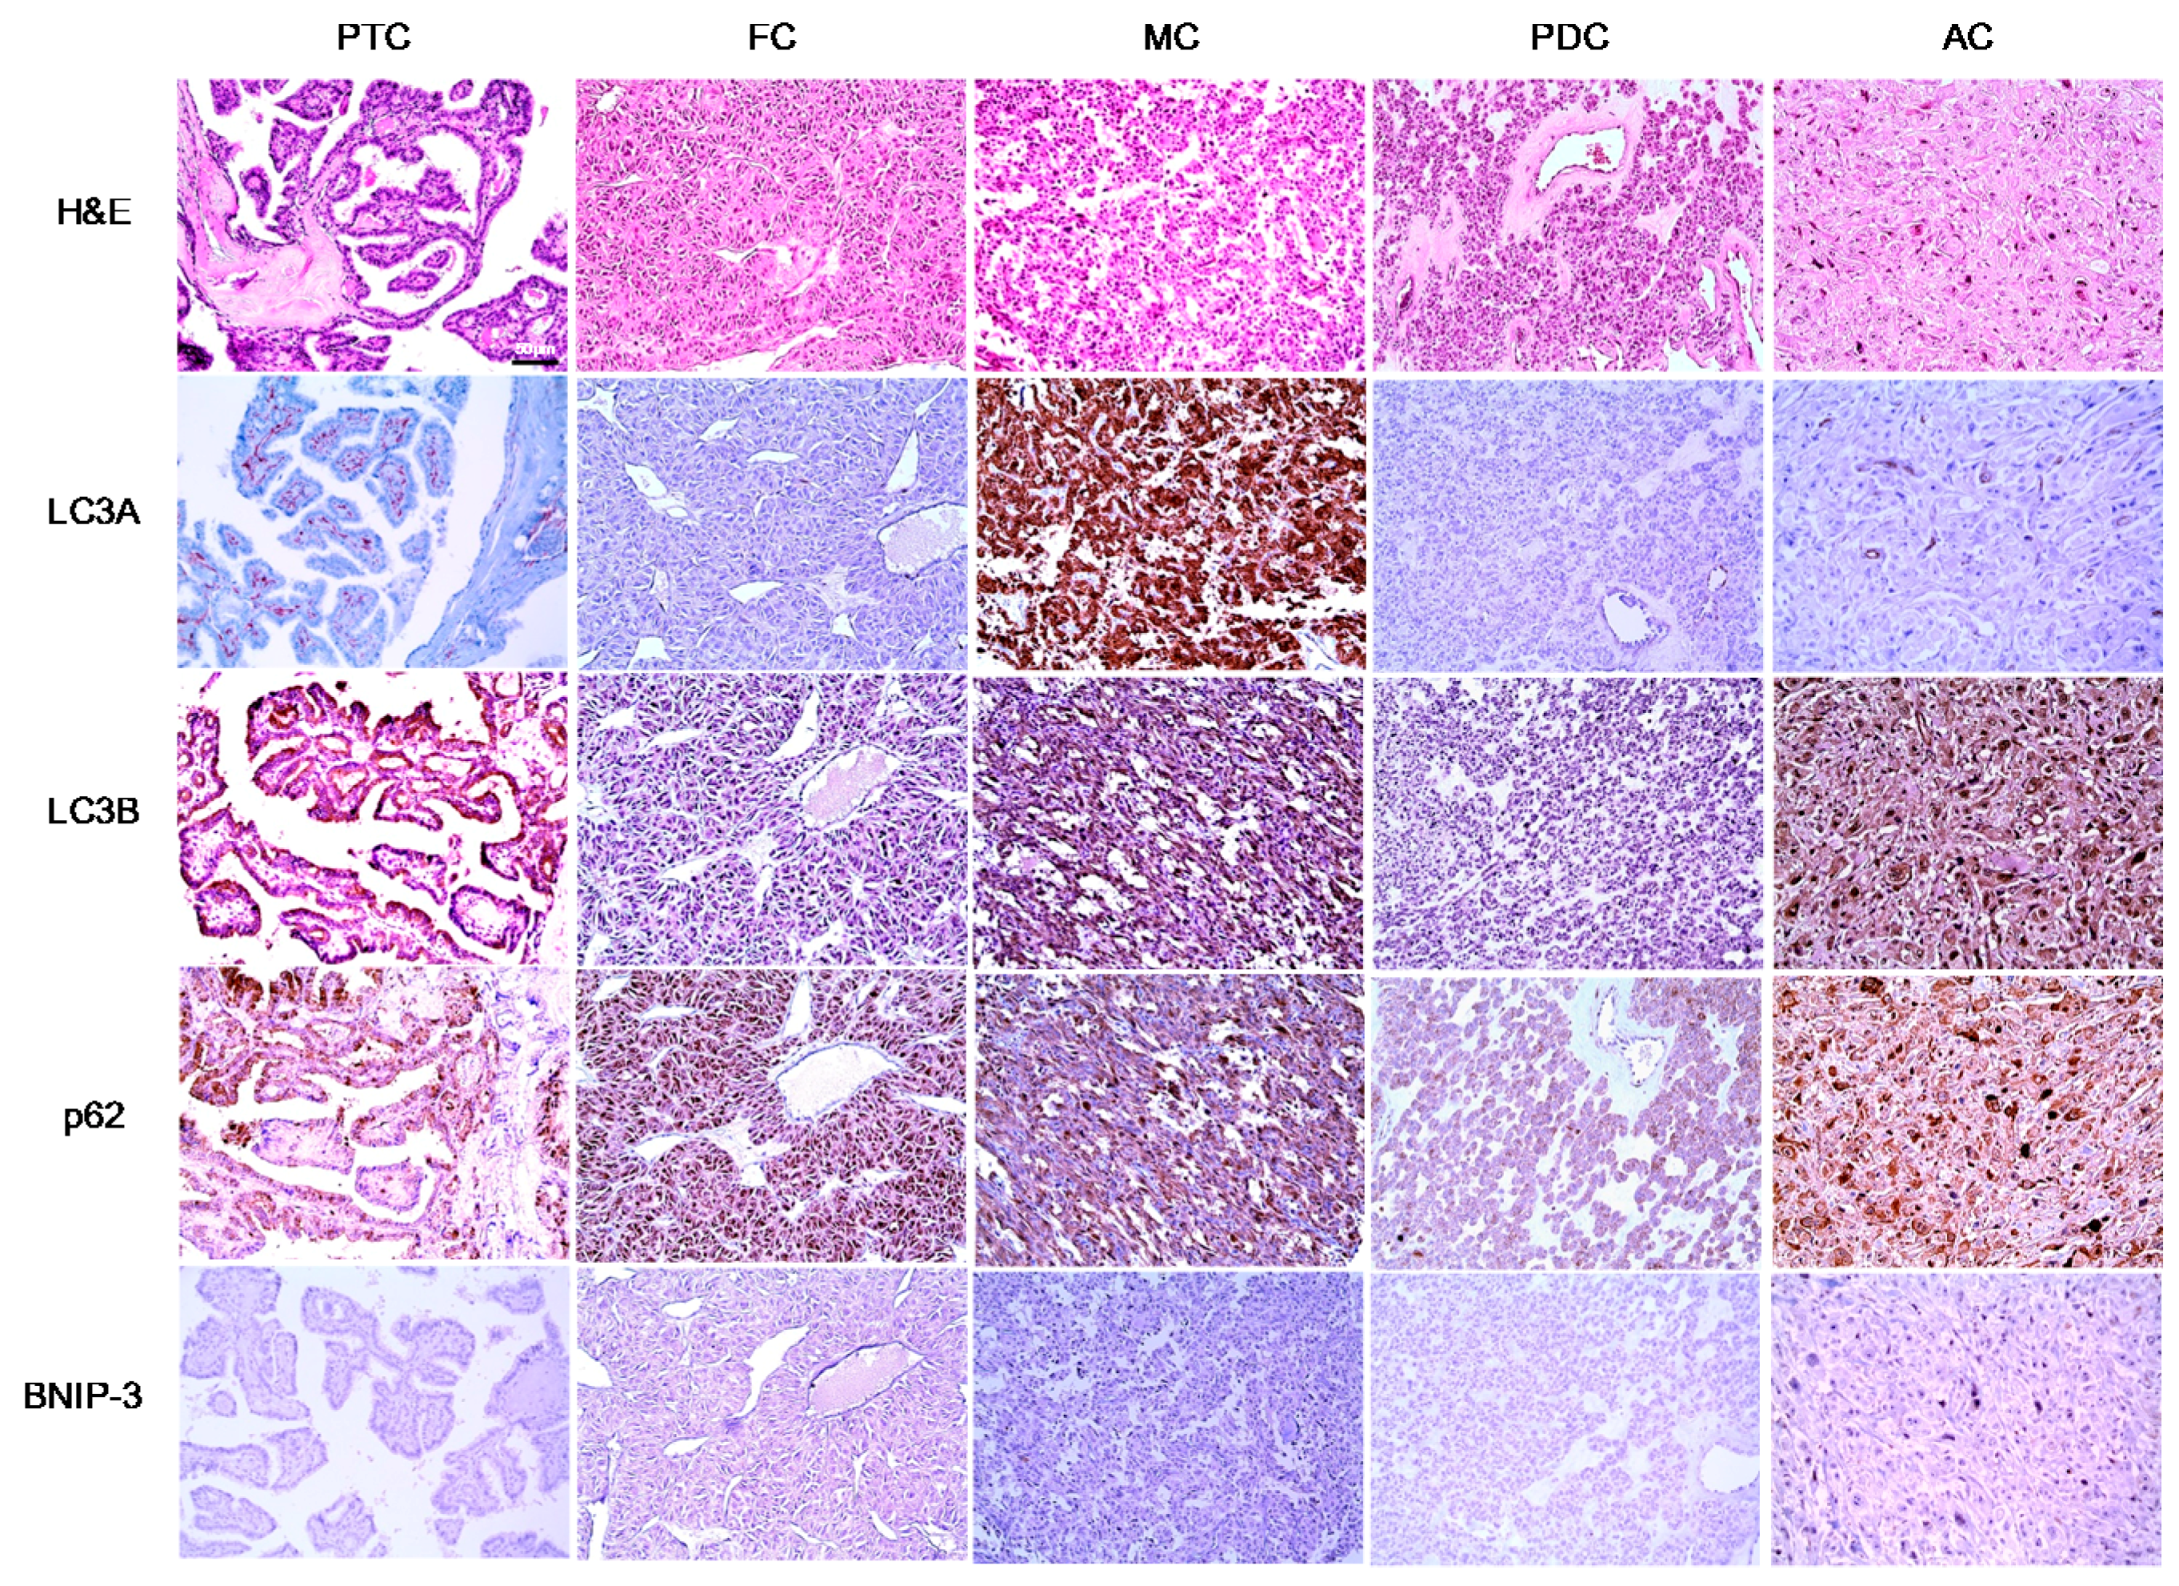
In this study, we investigated the expression of autophagy-related proteins in thyroid cancers and confirmed the existence of different expression patterns according to disease subtype. For example, we observed significantly higher levels of tumoral LC3A and LC3B expression in MC, a finding that was corroborated by a previous study in which higher expression levels of autophagy-related molecules, such as beclin-1 and LC3B, were observed in a MC cell line [
21]. According to that earlier study, sporadic type and hereditary type MCs differed with respect to the autophagy status, and higher expression levels of autophagy-related molecules were observed in the former [
21]. The different autophagy statuses observed in MC, compared to other types of thyroid cancer, might be attributable to differences in the expression of micro-RNAs (miRNAs), which have been reported to regulate autophagic activity in MC [
21]. In addition, differences in miRNA expression profiles have been observed among different thyroid cancer subtypes [
22]. Therefore, autophagic activity may differ as a result of distinct miRNA expression patterns, although this will require additional studies.
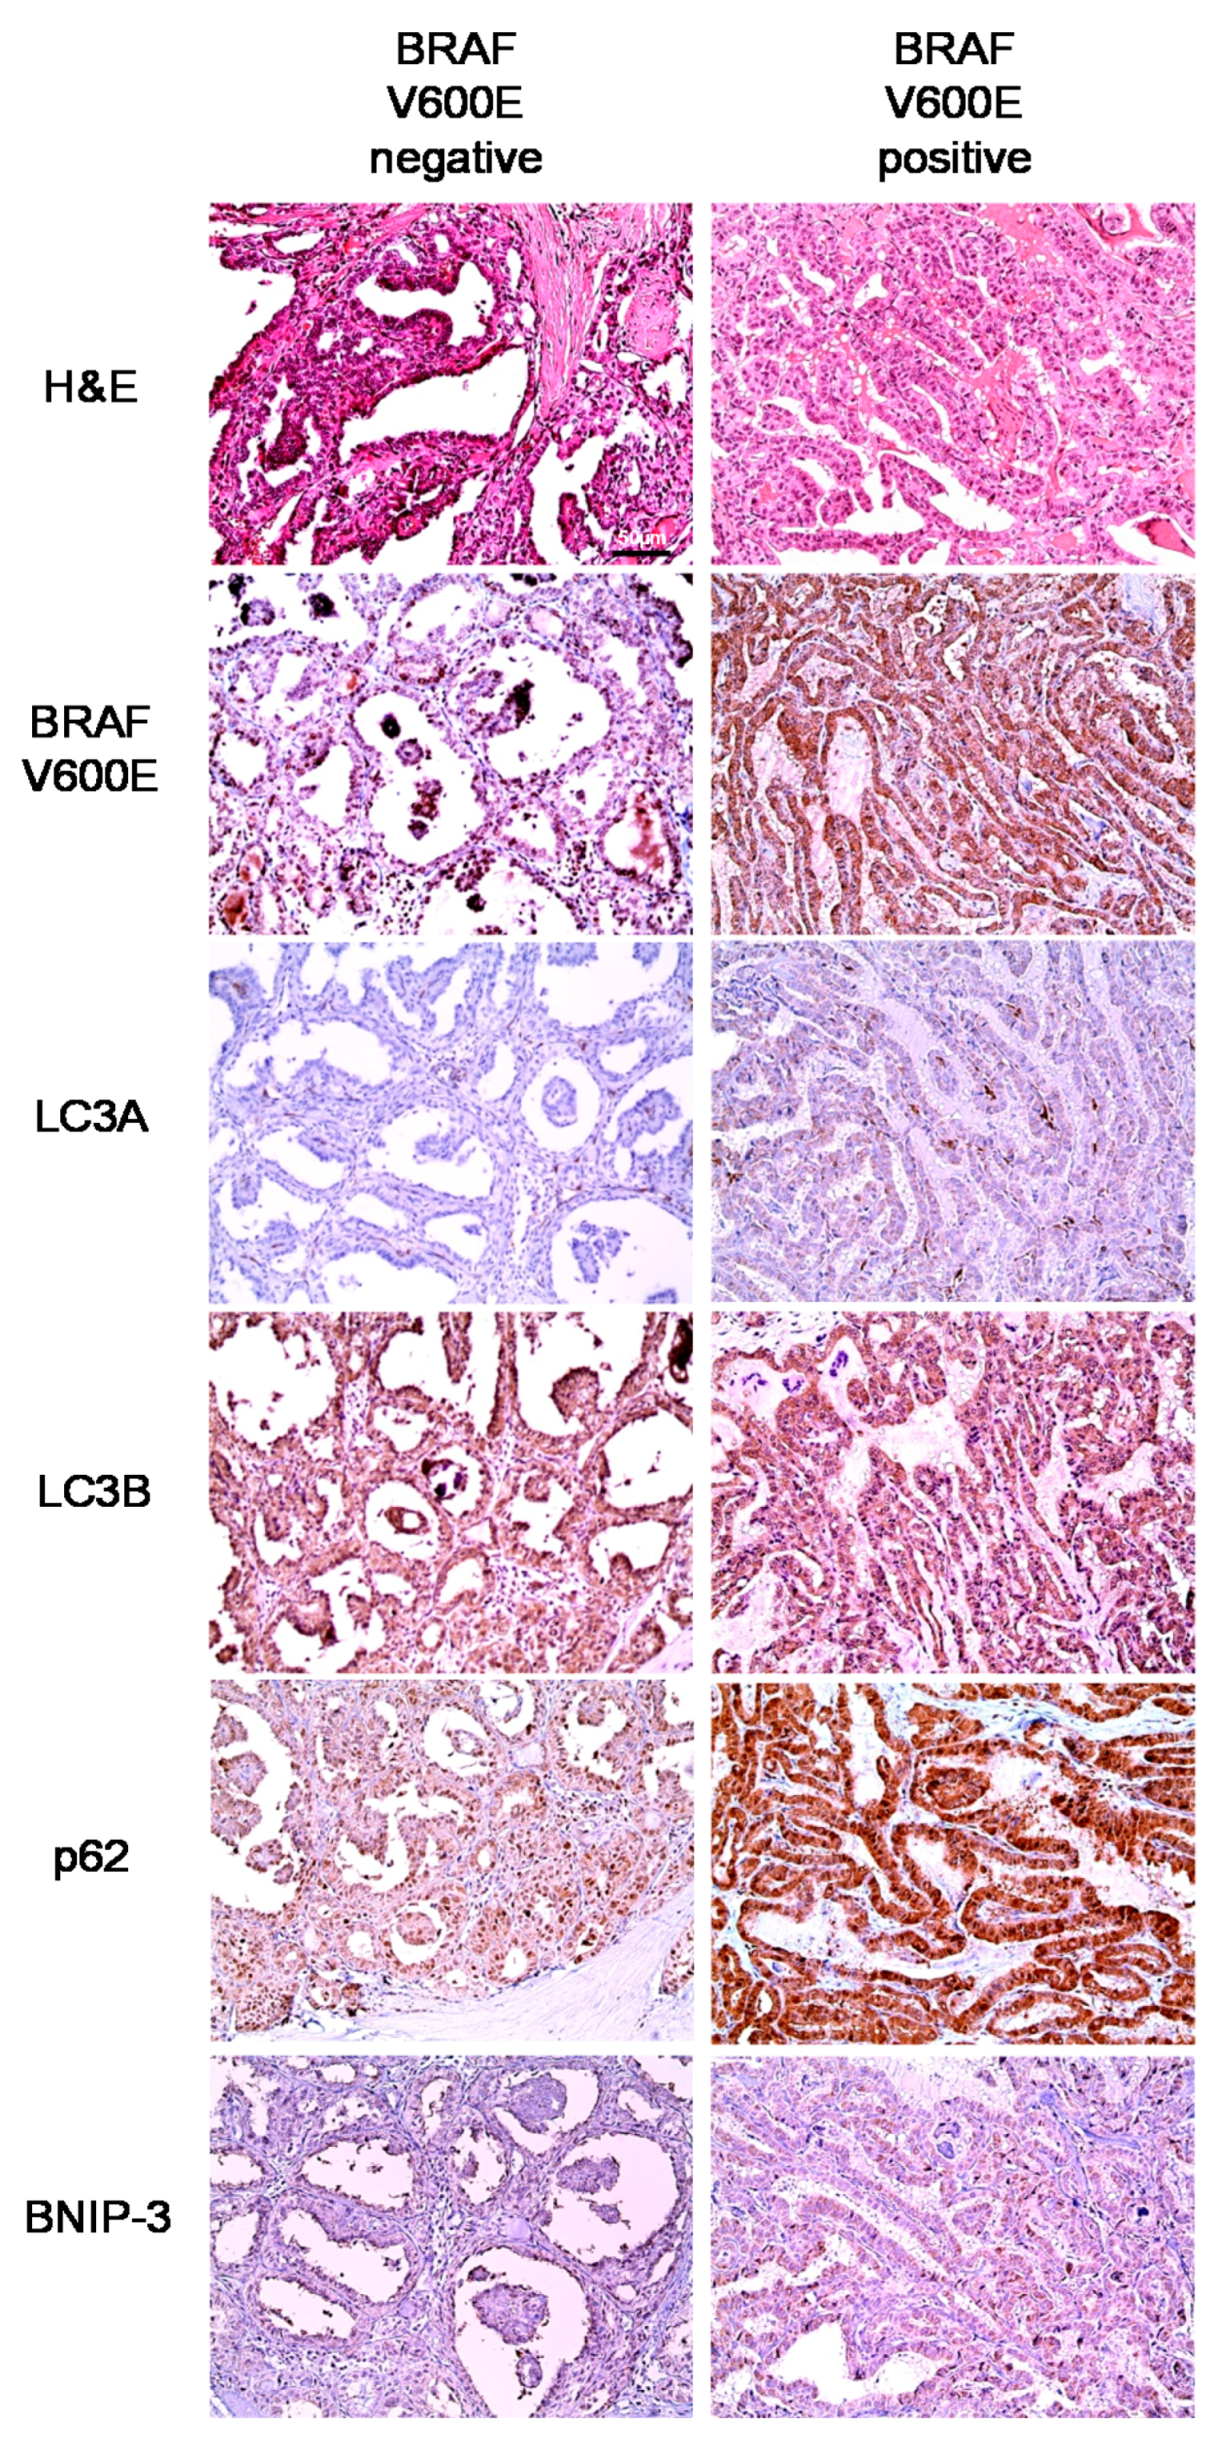
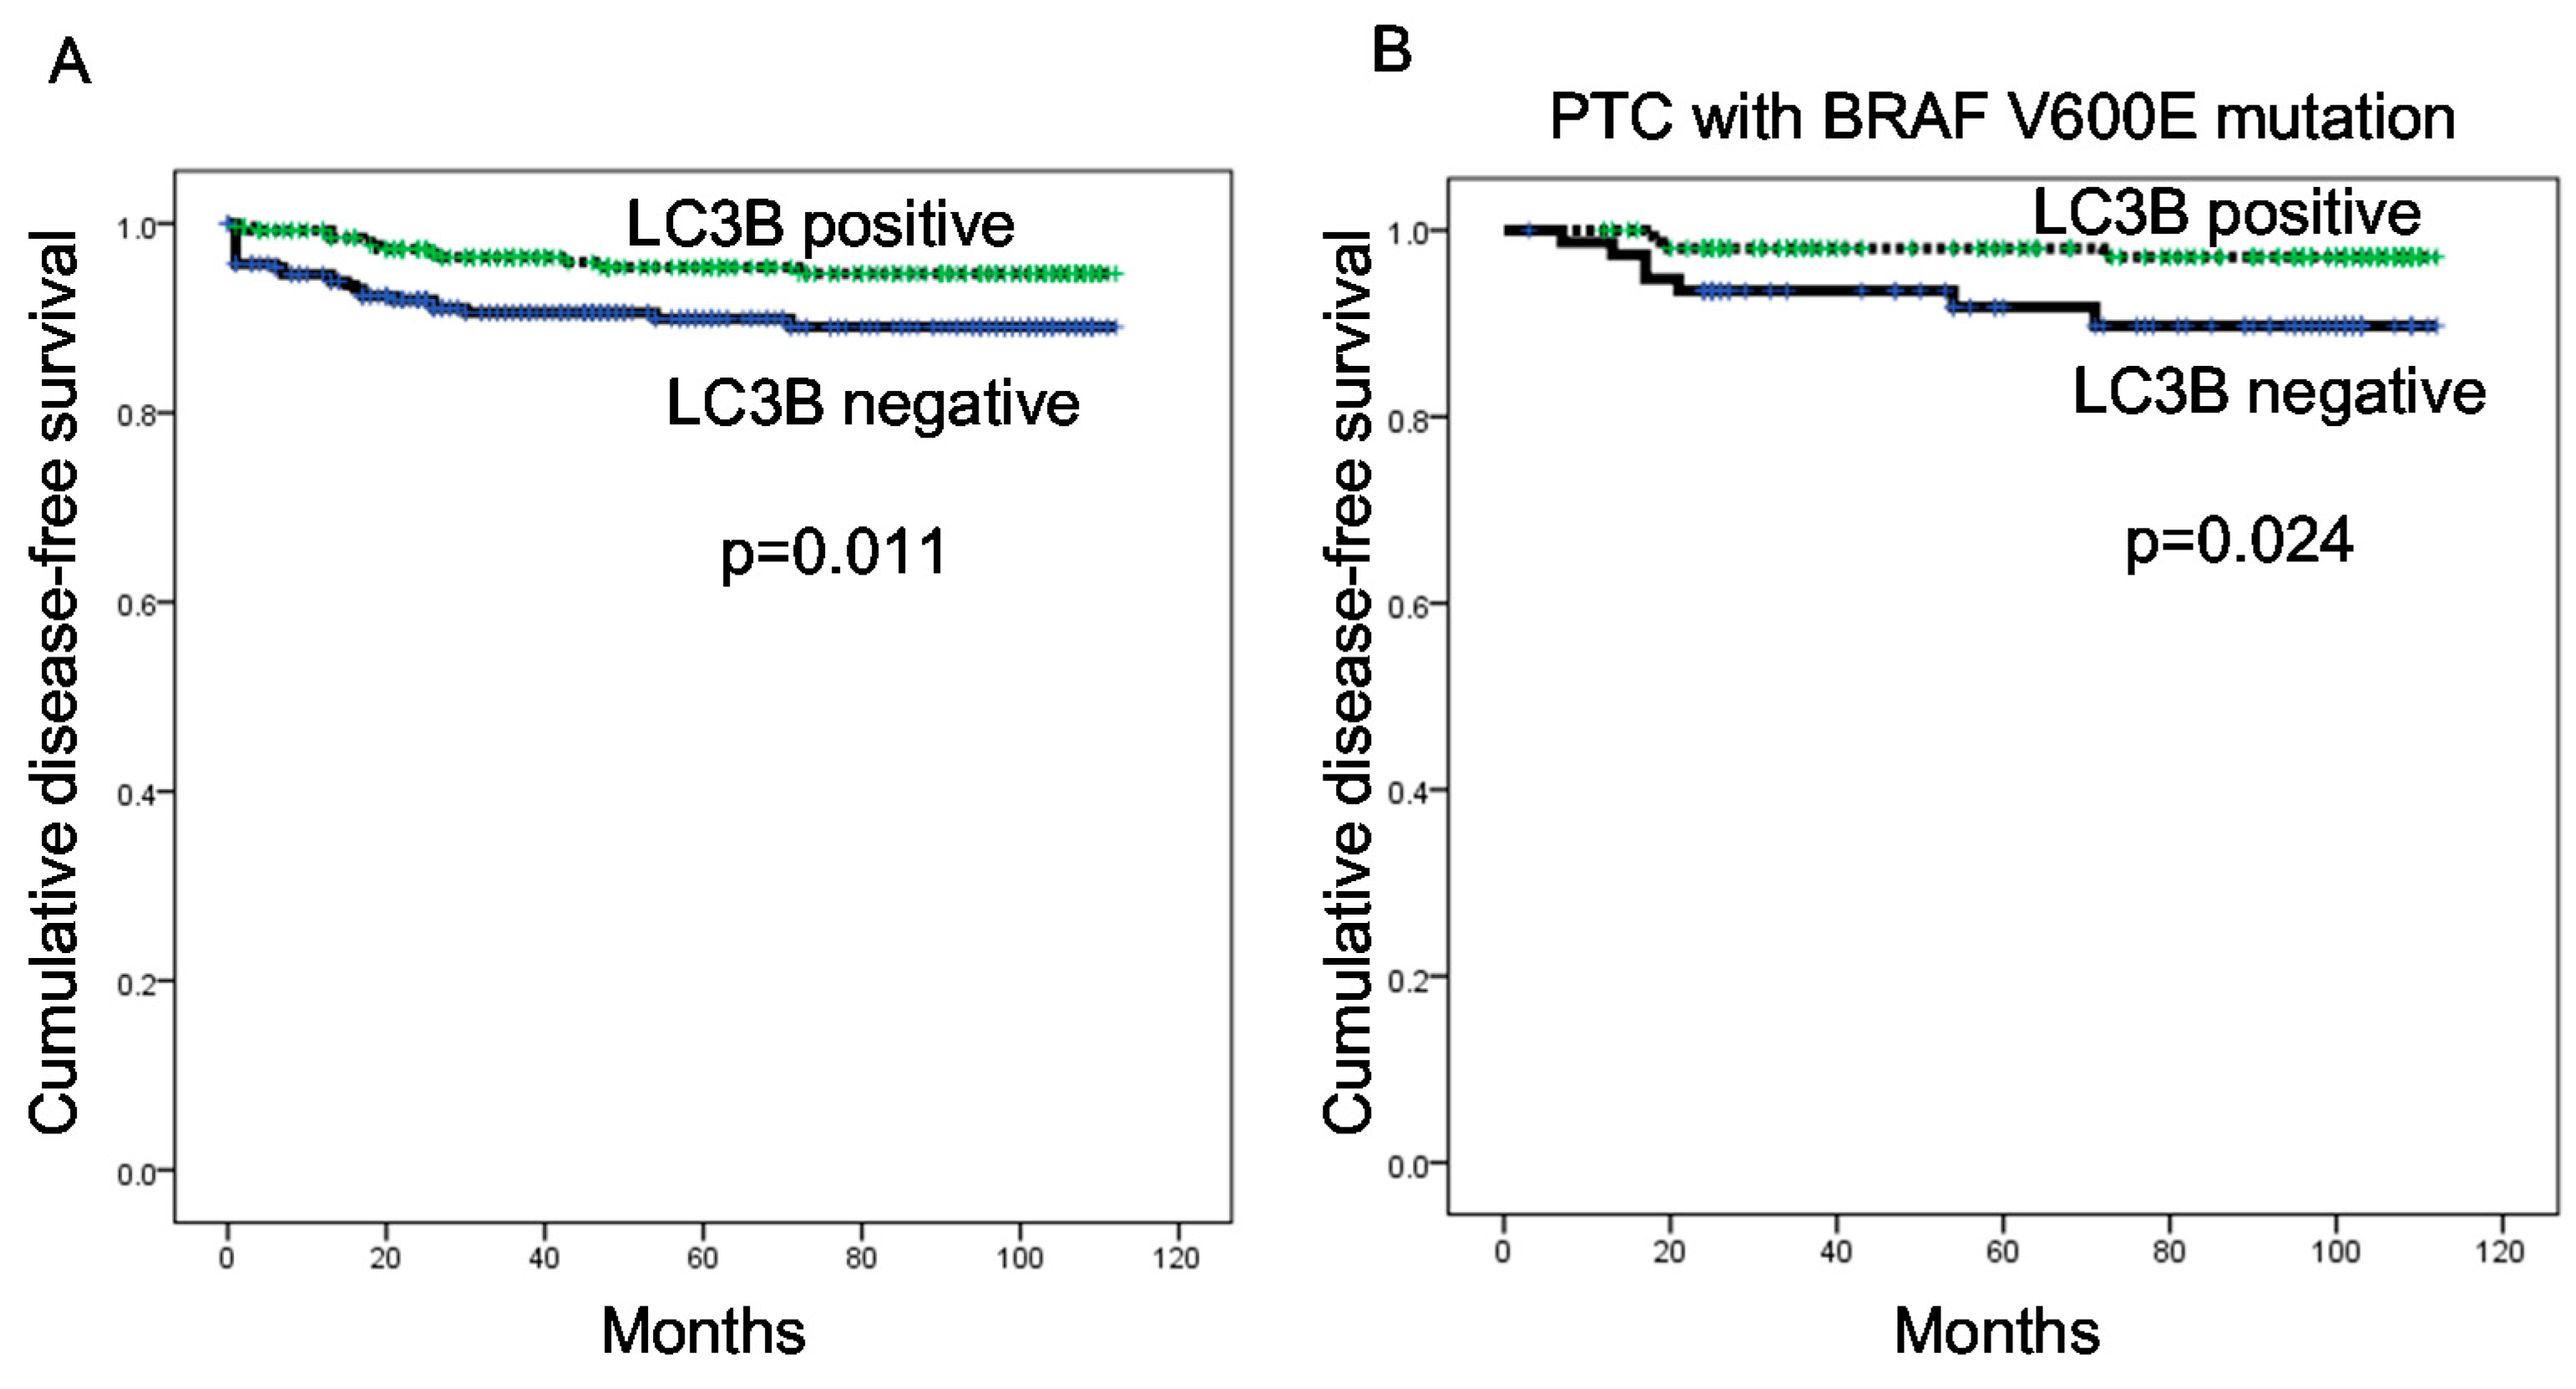
In our analysis of PTC, we observed differences in autophagy-related protein expression according to the BRAF V600E mutation status. Specifically, higher expression levels of all autophagy-related proteins were observed in PTCs with the BRAF V600E mutation, compared to those without the BRAF V600E mutation. In support of this finding, previous studies have observed an association between the BRAF V600E mutation and increased autophagy [
23,
24]. This association may be attributed to multiple factors. First, chronic ER stress may play a mechanistic role. Following activation of the IRE1/ASK1/JNK and TRB3 pathways via BRAF V600E-mediated p38 activation, Bcl-XL/Bcl-2 phosphorylation, induced by active JNK, and Akt/mTOR axis inhibition, mediated by TRB3, lead to increased autophagic activity [
24]. Second, long non-coding RNAs (lncRNAs) may also play a mechanistic role. For example, an increase in the LC3-II/LC3-I that was mediated by BRAF-activated lncRNA was found to induce autophagy in a previous study [
23].
Our results further demonstrated a high level of stromal LC3A expression in PTC. Previously, stromal LC3A expression was also observed in breast cancer [
18], similar to the findings of this study. The expression of autophagy-related proteins in tumor stroma has been attributed to a “reverse Warburg” effect, wherein a metabolic interaction exists between breast cancer cells and stromal cells. According to this theory, glycolysis, mitochondrial dysfunction, and increased autophagy activity are induced in stromal cells by reactive oxygen species produced by breast cancer cells. Ketone bodies and lactate, the by-products of glycolysis in stromal cells, enter cancer cells and facilitate the production of ATP through oxidative phosphorylation [
25,
26,
27]. Therefore, according to the reverse Warburg effect, autophagic activity would increase in stromal cells, which corresponds with the increased expression of LC3A and LC3B in PTC tumor stroma. In this context, cancer-associated fibroblasts that express reduced levels of caveolin-1 serve as tumor cell-interacting stromal cells [
28,
29]. In a previous study of thyroid cancer, the reported proportion of caveolin-1-negative stroma was 78.9% [
30], suggesting that the reverse Warburg effect may describe the situation in PTC. However, further studies are needed to clarify this potential mechanism.
We note that one limitation of our study was the use of immunohistochemistry (IHC) to detect autophagy-related proteins (beclin-1, LC3A, and LC3B) as an indicator of autophagic activity. Because autophagy is a dynamic, multi-step process, a static measure of autophagy activity (e.g., IHC) may yield inaccurate results. Namely, as the autophagy-related proteins LC3A and LC3B are autophagosome components, the increased expression of these proteins could be interpreted as an increase in the number of autophagosomes and, therefore, in autophagic activity. However, an increased number of autophagosomes might also result from delayed degradation. Therefore, an analysis of autophagy flux, which indicates changes in autophagic stages, would yield a more accurate measurement of autophagic activity [
10]. However, it was impossible to evaluate autophagy flux in our IHC study of paraffin-embedded tumor samples.
Clinically, the results of our study imply that autophagy regulation should be considered as a potential cancer therapeutic target. Recent evidence suggests that treatment with autophagy inhibitors could inhibit the growth of various tumors [
31,
32,
33,
34]. Specifically, autophagy inhibition might provide insights into the treatment of MC, which expresses high levels of autophagy markers and for which an effective target therapy is not currently available.
4. Materials and Methods
4.1. Patient Selection and Study Design
This study included patients with diagnosed PTC who underwent surgery at Severance Hospital between January 2012 and December 2013, as well as patients diagnosed with other thyroid cancer subtypes following surgery at Severance Hospital between January 2000 and December 2014. Patients who received preoperative chemotherapy were excluded. The study protocol was approved by the Institutional Review Board of Yonsei University Severance Hospital (8 November 2016; 4-2016-0832).
All cases of thyroid cancer were reviewed retrospectively by a single thyroid pathologist (Ja Seung Koo) via a histologic review of hematoxylin and eosin (H&E)-stained slides. Clinicopathologic data were obtained from the patients’ medical records and included the age at diagnosis, disease recurrence, metastasis status, current status, and duration of follow-up. The tumor size, location (right or left lobe), extent (confined to the thyroid parenchyma or with extrathyroidal spread), and number of metastatic lymph nodes were also determined from the histologic review of tumor slides and surgical pathology reports.
4.2. Tissue Microarray
Representative areas on (H&E)-stained slides were selected, and corresponding spots were marked on the surfaces of matching paraffin blocks. Three-millimeter sized tissue cores were extracted by using a manual tissue arrayer from the selected areas and placed into a 6 × 5 recipient block. More than two tissue cores were extracted from each case to minimize extraction bias. Each tissue core was assigned a unique tissue microarray location number that was linked to a database containing other clinicopathologic data.
4.3. Immunohistochemistry
The antibodies used for (IHC) are listed in
Table 7. All IHC analyses were performed using formalin-fixed, paraffin-embedded tissue sections. Briefly, 5-μm-thick sections were obtained with a microtome, transferred onto adhesive slides, and dried at 62 °C for 30 min. After incubation with primary antibodies, immunodetection was performed using biotinylated anti-mouse immunoglobulin followed by peroxidase-labeled streptavidin, using a labeled streptavidin biotin kit with 3,3′-diaminobenzidine chromogen as the substrate. The primary antibody incubation step was omitted from the negative control. A positive control tissue was used per the manufacturer’s recommendation. Slides were counterstained with Harris hematoxylin.
4.4. Interpretation of Immunohistochemical Staining
Immunohistochemical marker expression was visualized using light microscopy. Stained slides were evaluated semi-quantitatively according to a previously reported method [
35]. Tumor and stromal cell staining were assessed using the following scoring system: 0, negative or weak immunostaining in <1% of the tumor/stroma; 1, focal expression in 1%–10% of the tumor/stroma; 2: positive staining in 11%–50% of the tumor/stroma; and 3: positive staining in 51%–100% of the tumor/stroma. The entire tumor area was subjected to assessment, and a score of ≥2 was defined as positive. BRAF V600E staining was considered positive when more than 20% tumor cells were positive, as previously described [
36].
4.5. Statistical Analysis
Data were analyzed using IBM SPSS Statistics for Windows, Version 21.0 (IBM Corp. Released 2012. Armonk, NY, USA). For determinations of statistical significance, Student’s t-test and Fisher’s exact test were used for continuous and categorical variables, respectively. The correlation between the expression of GLS1, GDH, and ASCT was analyzed using Kendall’s tau. To analyze data with multiple comparisons, a corrected p-value and the Bonferroni multiple comparison procedure were applied. Statistical significance was set at a p-value < 0.05. Kaplan–Meier survival curves and log-rank statistics were used to evaluate the time to tumor recurrence and overall survival. A Cox proportional hazards model was used for the multivariate regression analysis.


