
Reprogramming Methods Do Not Affect Gene Expression Profile of Human Induced Pluripotent Stem Cells

 ,
, 
Abstract
:
1. Introduction
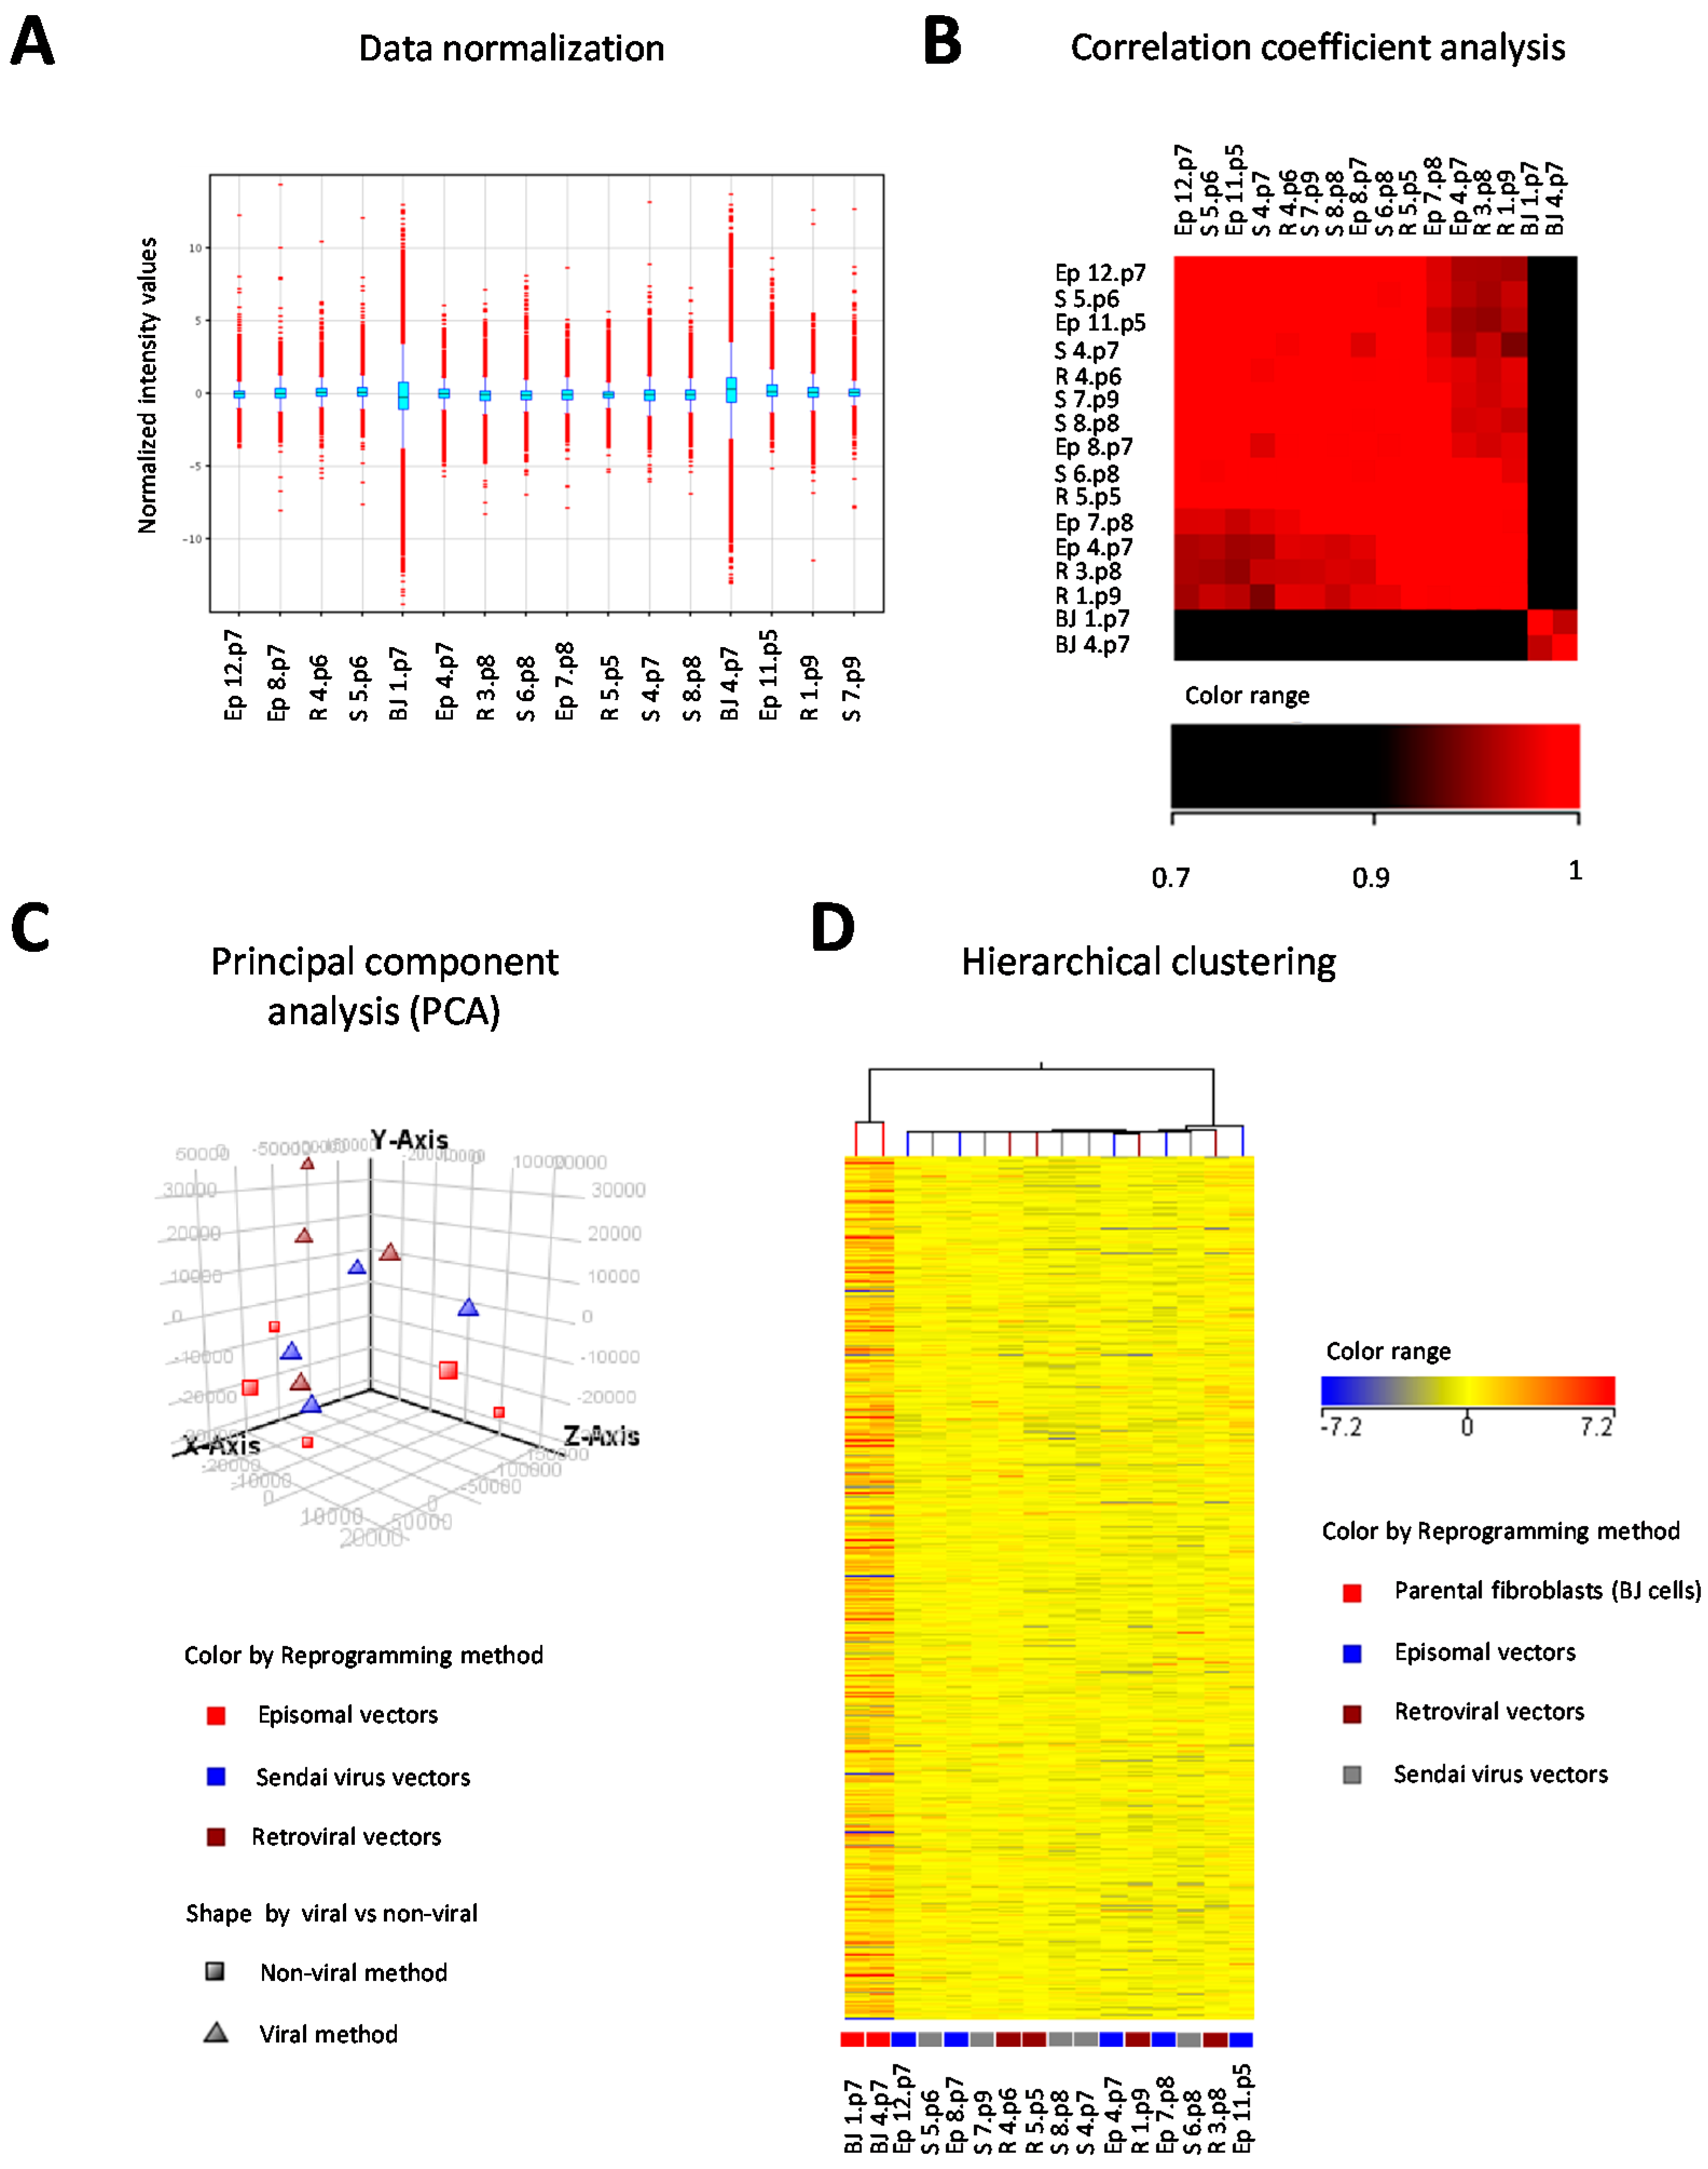
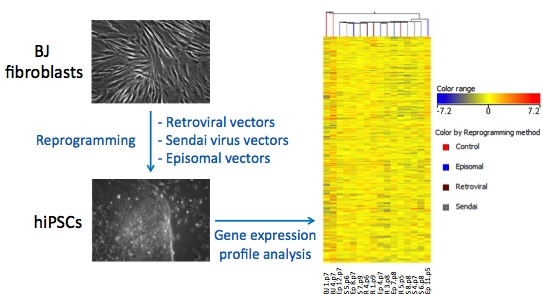
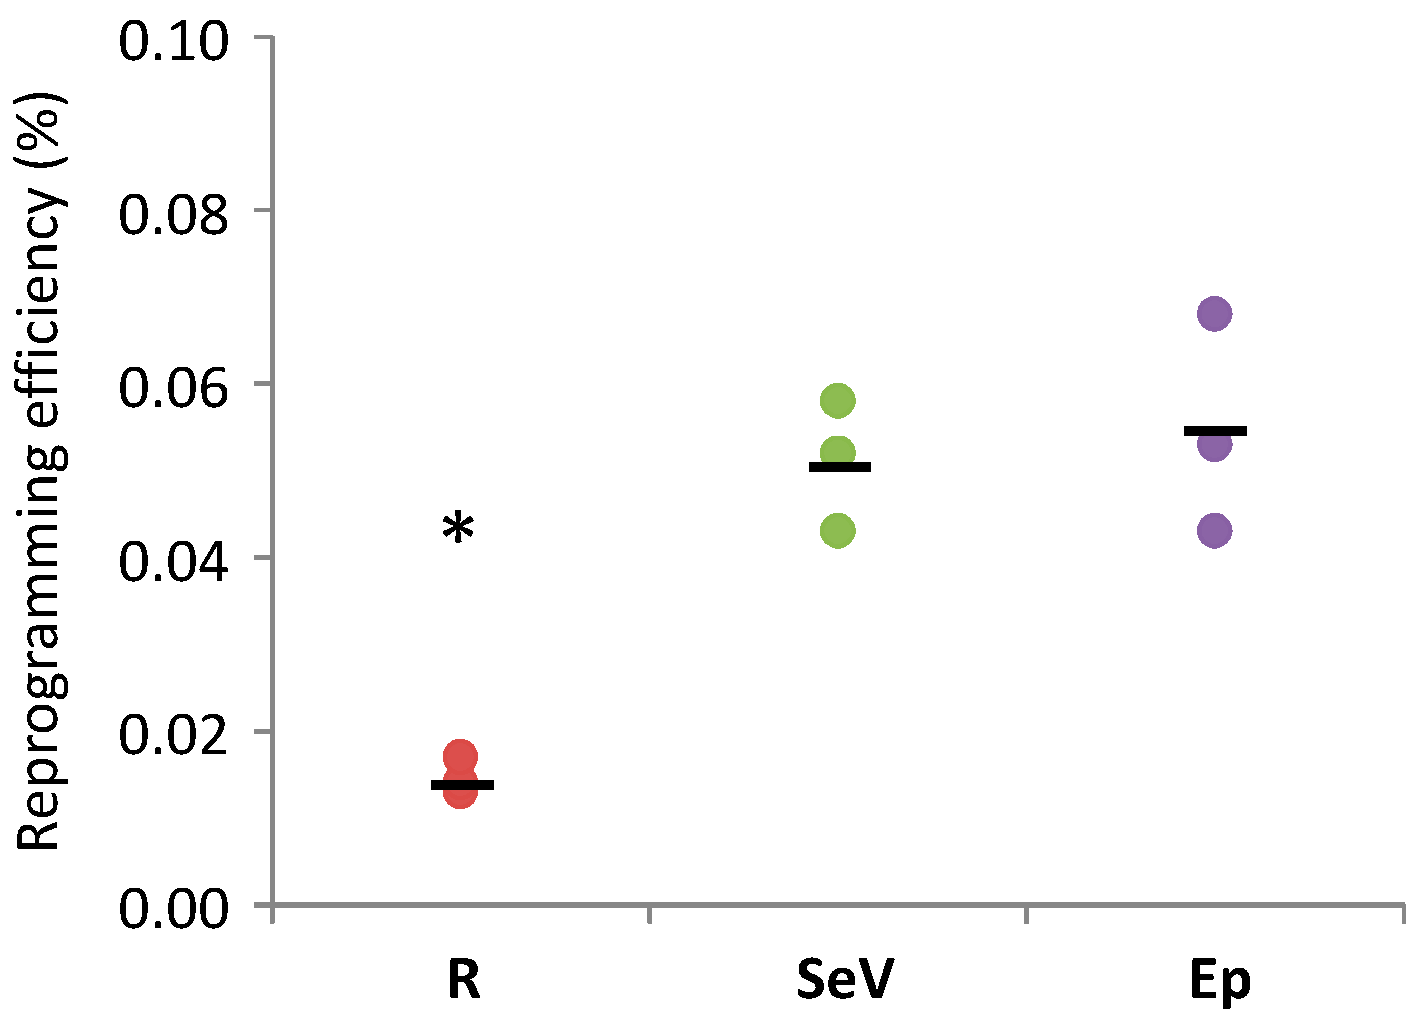
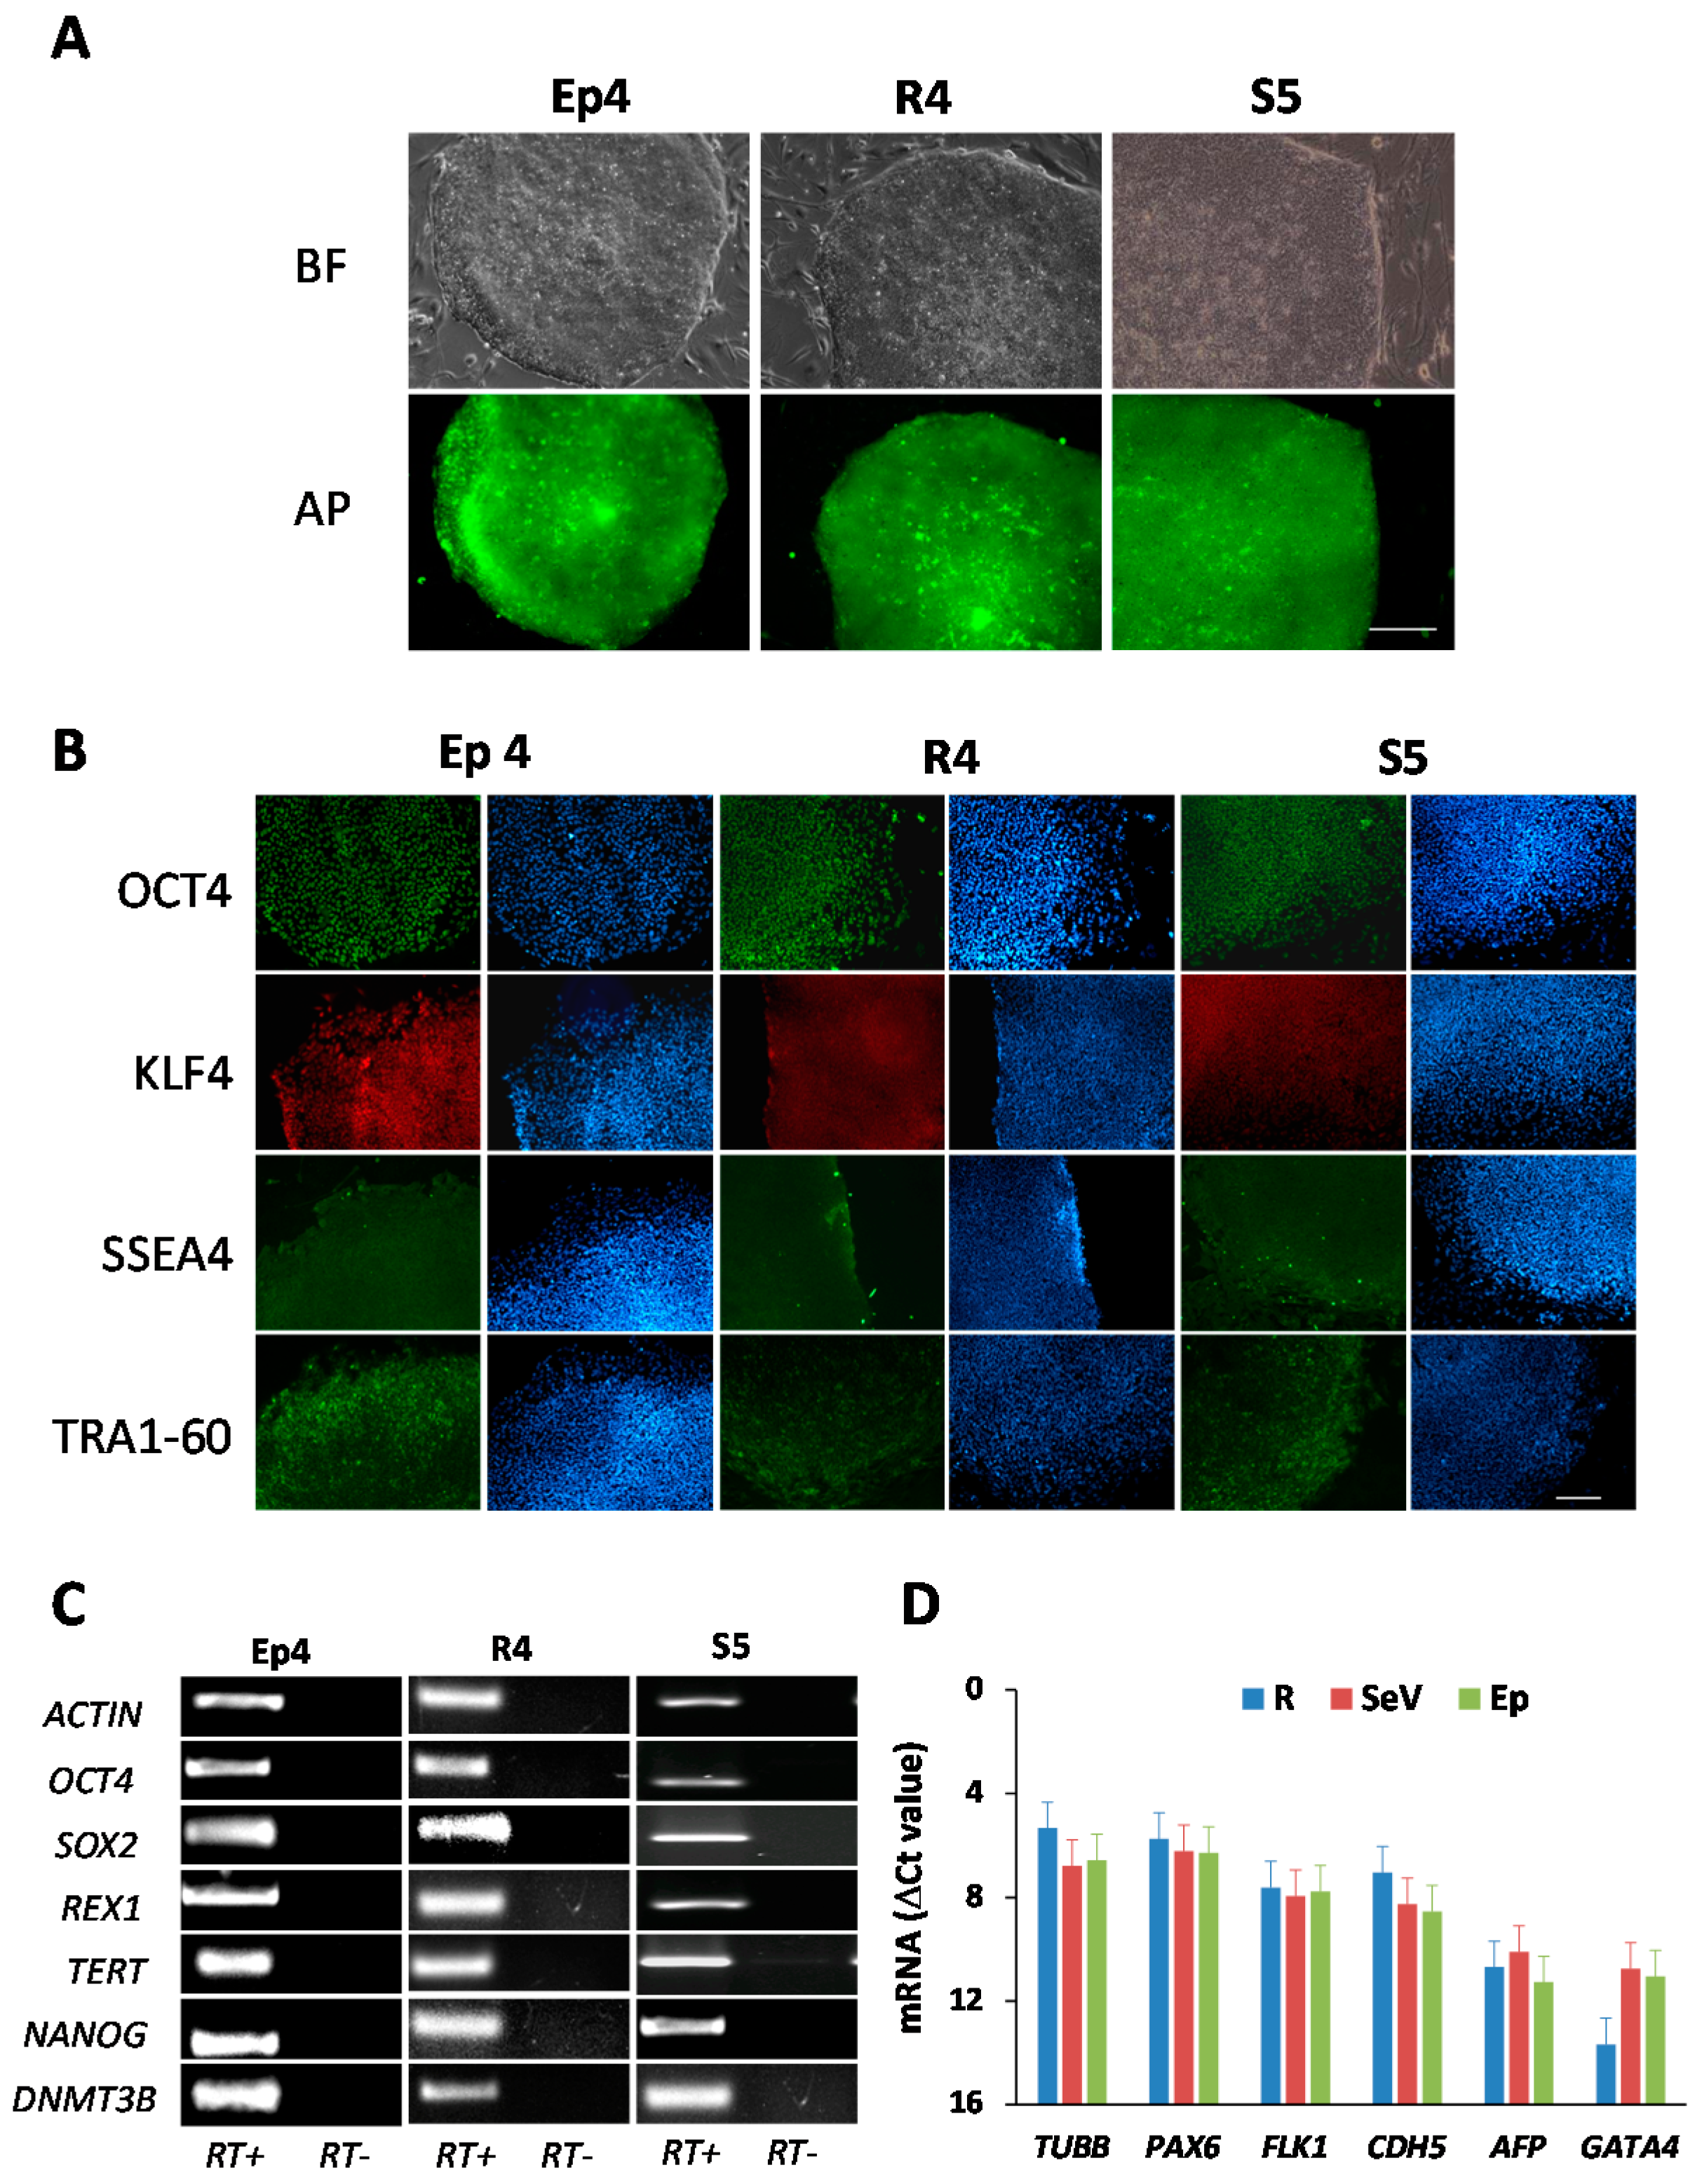
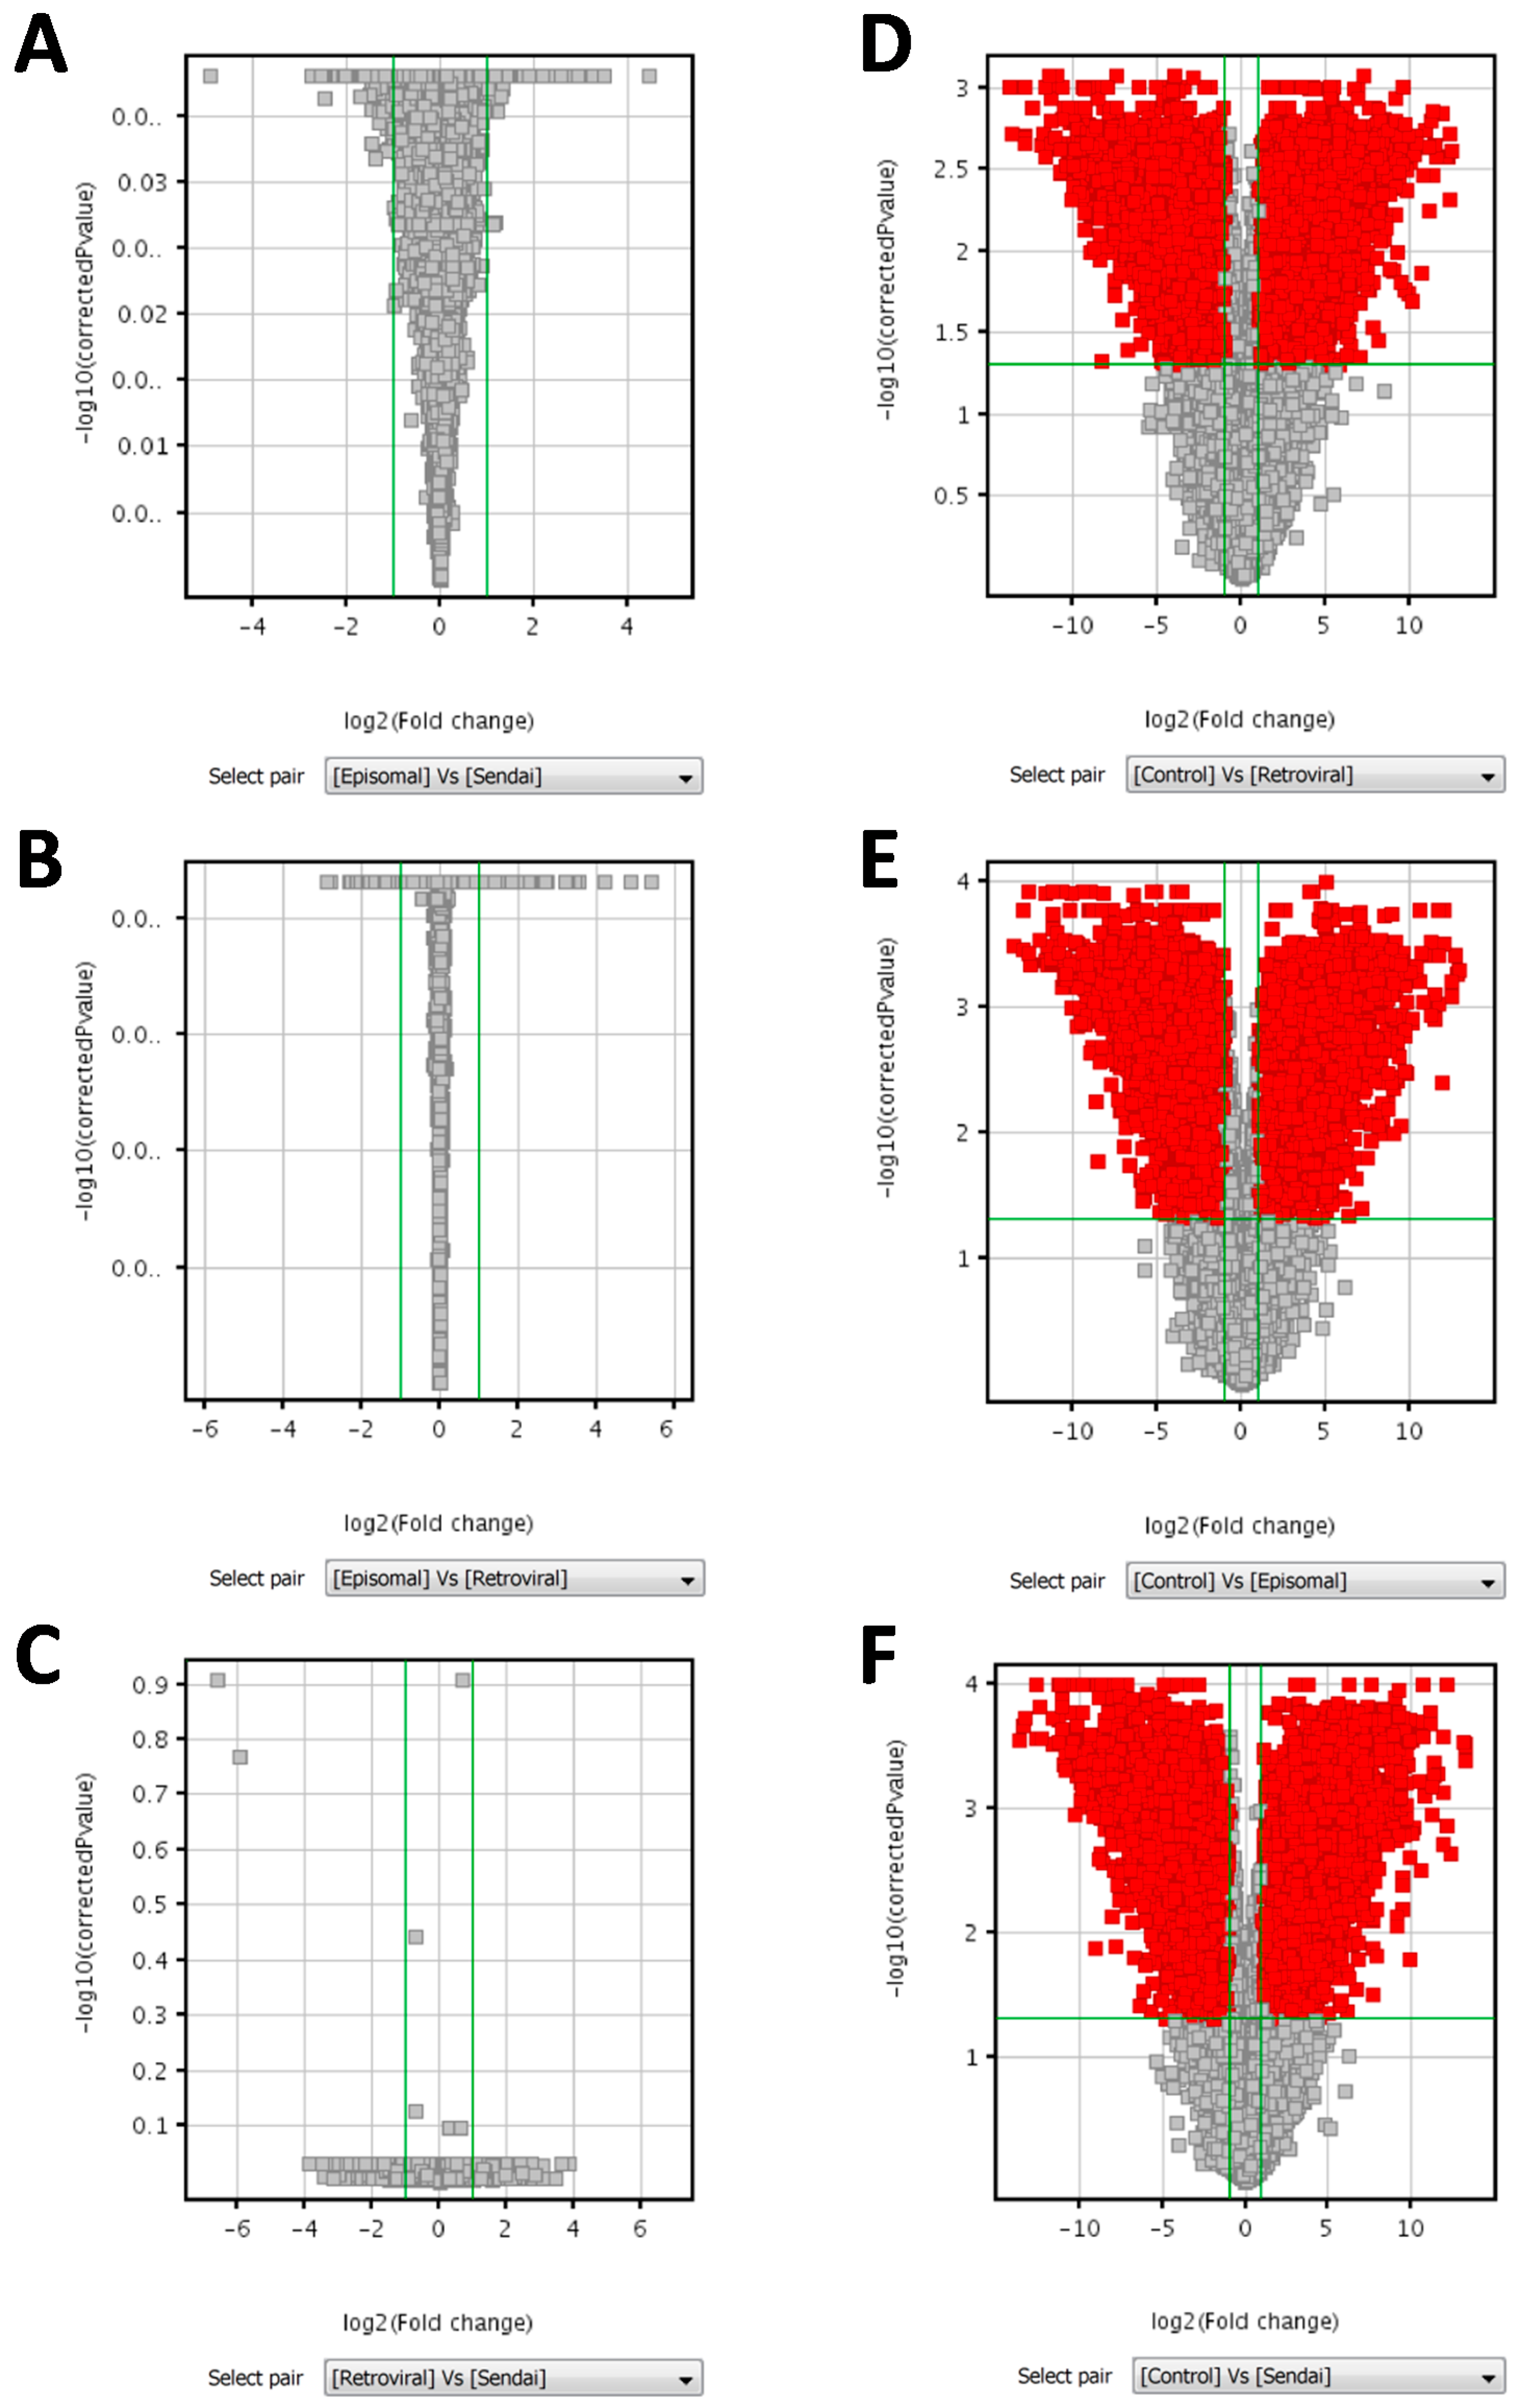
2. Results
3. Discussion
4. Materials and Methods
4.1. Cell Cultures
4.2. hiPSCs Reprogramming
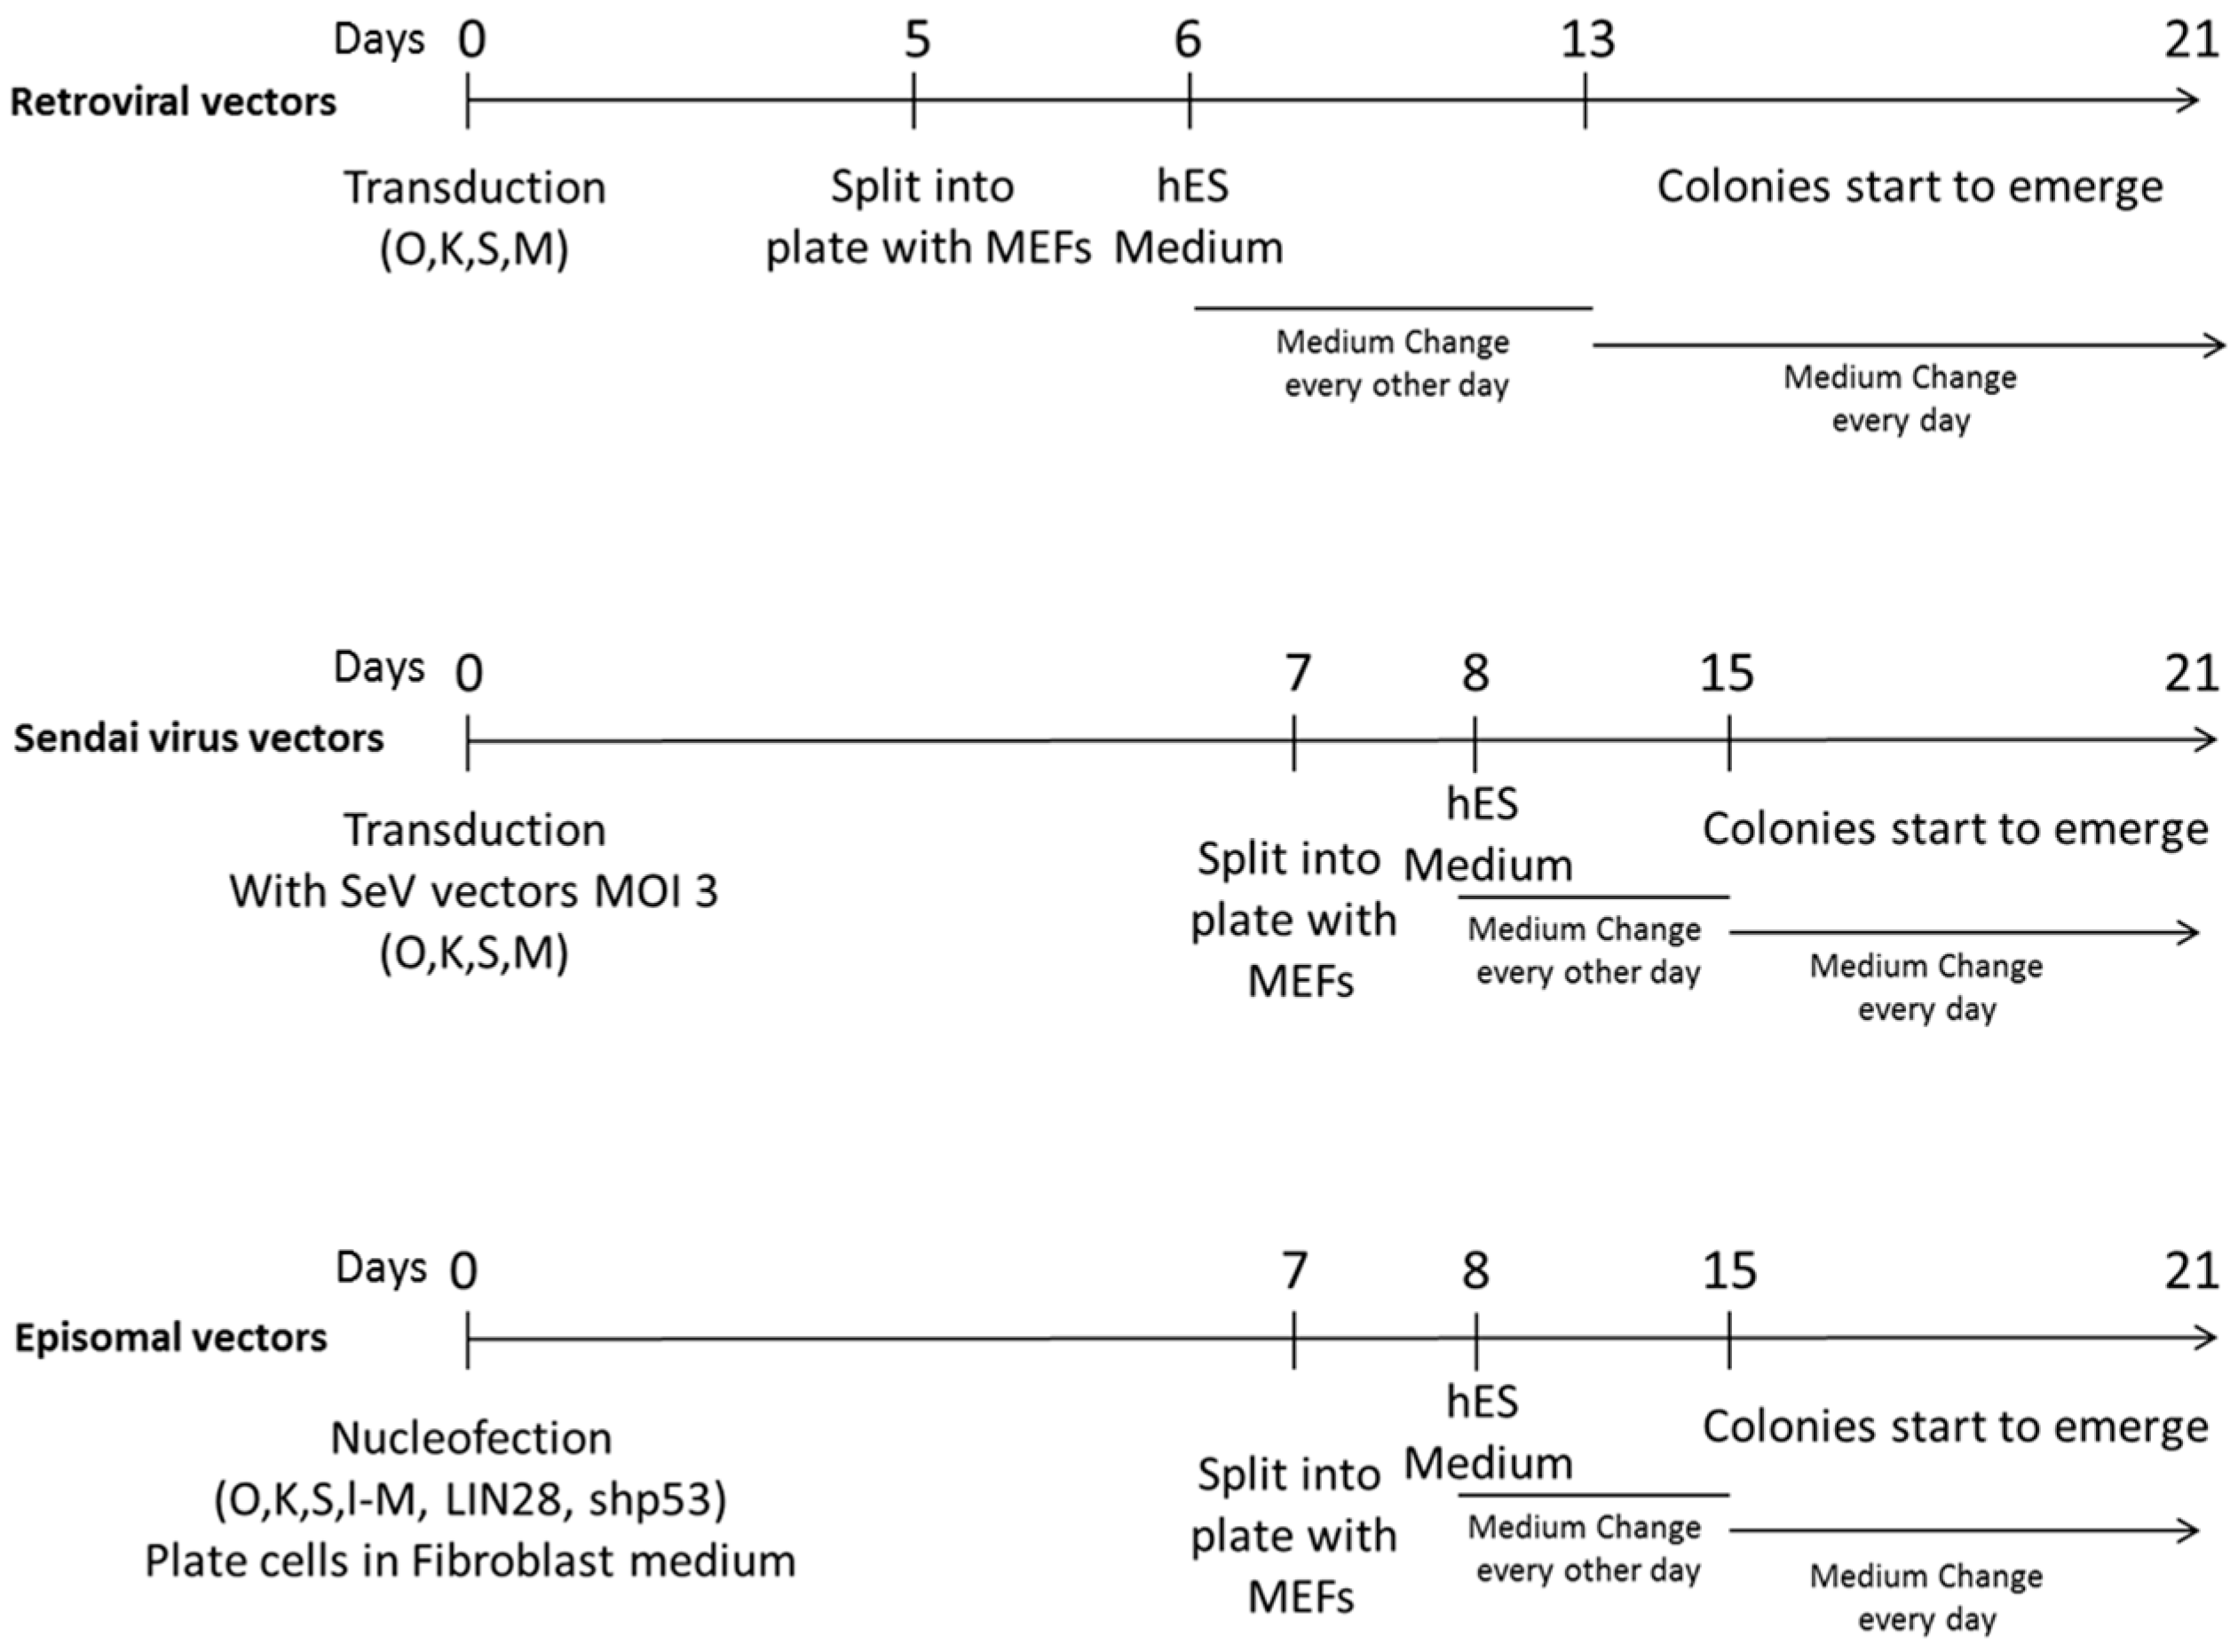
4.2.1. Retroviral Vectors Reprogramming
4.2.2. Sendai Virus Vectors Reprogramming
4.2.3. Episomal Vectors Reprogramming
4.3. Tra-160 and Alkaline Phosphatase-Live Assay
4.4. Immunofluorescence Analysis
4.5. RNA Extraction
4.6. Pluripotency Marker Expression by RT-PCR
4.7. Embryoid Bodies Test
4.8. Gene Expression Microarray Analysis
4.9. Statistical Analysis
Supplementary Materials
Acknowledgments
Author Contributions
Conflicts of Interest
References
- Takahashi, K.; Tanabe, K.; Ohnuki, M.; Narita, M.; Ichisaka, T.; Tomoda, K.; Yamanaka, S. Induction of pluripotent stem cells from adult human fibroblasts by defined factors. Cell 2007, 131, 861–872. [Google Scholar] [CrossRef] [PubMed] [Green Version]
- Okita, K.; Ichisaka, T.; Yamanaka, S. Generation of germ-line competent induced pluripotent stem cells. Nature 2007, 448, 313–317. [Google Scholar] [CrossRef] [PubMed]
- Carvajal-Vergara, X.; Sevilla, A.; D’Souza, S.L.; Ang, Y.S.; Schaniel, C.; Lee, D.F.; Yang, L.; Kaplan, A.D.; Adler, E.D.; Rozov, R.; et al. Patient-specific induced pluripotent stem-cell-derived models of LEOPARD syndrome. Nature 2010, 465, 808–812. [Google Scholar] [CrossRef] [PubMed]
- Itzhaki, I.; Maizels, L.; Huber, I.; Zwi-Dantsis, L.; Caspi, O.; Winterstern, A.; Feldman, O.; Gepstein, A.; Arbel, G.; Hammerman, H.; et al. Modelling the long QT syndrome with induced pluripotent stem cells. Nature 2011, 471, 225–229. [Google Scholar] [CrossRef] [PubMed]
- Sun, N.; Yazawa, M.; Liu, J.; Han, L.; Sanchez-Freire, V.; Abilez, O.J.; Navarrete, E.G.; Hu, S.; Wang, L.; Lee, A.; et al. Patient-specific induced pluripotent stem cells as a model for familial dilated cardiomyopathy. Sci. Transl. Med. 2012, 4, 130ra47. [Google Scholar] [CrossRef] [PubMed]
- Soldner, F.; Hockemeyer, D.; Beard, C.; Gao, Q.; Bell, G.W.; Cook, E.G.; Hargus, G.; Blak, A.; Cooper, O.; Mitalipova, M.; et al. Parkinson’s disease patient-derived induced pluripotent stem cells free of viral reprogramming factors. Cell 2009, 136, 964–977. [Google Scholar] [CrossRef] [PubMed]
- Park, I.H.; Arora, N.; Huo, H.; Maherali, N.; Ahfeldt, T.; Shimamura, A.; Lensch, M.W.; Cowan, C.; Hochedlinger, K.; Daley, G.Q. Disease-specific induced pluripotent stem cells. Cell 2008, 134, 877–886. [Google Scholar] [CrossRef] [PubMed]
- Fusaki, N.; Ban, H.; Nishiyama, A.; Saeki, K.; Hasegawa, M. Efficient induction of transgene-free human pluripotent stem cells using a vector based on Sendai virus, an RNA virus that does not integrate into the host genome. Proc. Jpn. Acad. Ser. B Phys. Biol. Sci. 2009, 85, 348–362. [Google Scholar] [CrossRef] [PubMed]
- Okita, K.; Matsumura, Y.; Sato, Y.; Okada, A.; Morizane, A.; Okamoto, S.; Hong, H.; Nakagawa, M.; Tanabe, K.; Tezuka, K.; et al. A more efficient method to generate integration-free human iPS cells. Nat. Methods 2011, 8, 409–412. [Google Scholar] [CrossRef] [PubMed] [Green Version]
- Warren, L.; Manos, P.D.; Ahfeldt, T.; Loh, Y.H.; Li, H.; Lau, F.; Ebina, W.; Mandal, P.K.; Smith, Z.D.; Meissner, A.; et al. Highly efficient reprogramming to pluripotency and directed differentiation of human cells with synthetic modified mRNA. Cell Stem Cell 2010, 7, 618–630. [Google Scholar] [CrossRef] [PubMed]
- Yu, J.; Hu, K.; Smuga-Otto, K.; Tian, S.; Stewart, R.; Slukvin, I.I.; Thomson, J.A. Human Induced Pluripotent Stem Cells Free of Vector and Transgene Sequences. Science 2009, 8, 797–801. [Google Scholar] [CrossRef] [PubMed]
- Kim, D.; Kim, C.H.; Moon, J.I.; Chung, Y.G.; Chang, M.Y.; Han, B.S.; Ko, S.; Yang, E.; Cha, K.Y.; Lanza, R.; et al. Generation of human induced pluripotent stem cells by direct delivery of reprogramming proteins. Cell Stem Cell 2009, 4, 472–476. [Google Scholar] [CrossRef] [PubMed]
- Higuchi, A.; Ling, Q.D.; Kumar, S.S.; Munusamy, M.A.; Alarfaj, A.A.; Chang, Y.; Kao, S.H.; Lin, K.C.; Wang, H.C.; Umezawa, A. Generation of pluripotent stem cells without the use of genetic material. Lab. Investig. 2015, 1, 26–42. [Google Scholar] [CrossRef] [PubMed]
- Inoue, H.; Nagata, N.; Kurokawa, H.; Yamanaka, S. iPS cells: A game changer for future medicine. EMBO J. 2014, 33, 409–417. [Google Scholar] [CrossRef] [PubMed]
- Zheng, W.; Wang, Y.; Chang, T.; Huang, H.; Yee, J.K. Significant differences in genotoxicity induced by retrovirus integration in human T cells and induced pluripotent stem cells. Gene 2013, 519, 142–149. [Google Scholar] [CrossRef] [PubMed]
- Mandal, P.K.; Rossi, D.J. Reprogramming human fibroblasts to pluripotency using modified mRNA. Nat. Protoc. 2013, 8, 568–582. [Google Scholar] [CrossRef] [PubMed]
- Schlaeger, T.M.; Daheron, L.; Brickler, T.R.; Entwisle, S.; Chan, K.; Cianci, A.; DeVine, A.; Ettenger, A.; Fitzgerald, K.; Godfrey, M.; et al. A comparison of non-integrating reprogramming methods. Nat. Biotechnol. 2015, 33, 58–63. [Google Scholar] [CrossRef] [PubMed]
- Lamb, R.A.; Kolakofsky, D. Paramyxoviridae: The Viruses and Their Replication; Lippincott Williams & Wilkins: New York, NY, USA, 2001; pp. 1177–1204. [Google Scholar]
- Tashiro, M.; McQueen, N.L.; Seto, J.T. Determinants of organ tropism of Sendai virus. Front. Biosci. 1999, 4, 642–645. [Google Scholar] [CrossRef]
- Newman, A.M.; Cooper, J.B. Lab-specific gene expression signatures in pluripotent stem cells. Cell Stem Cell 2010, 7, 258–262. [Google Scholar] [CrossRef] [PubMed]
- Choi, J.; Lee, S.; Mallard, W.; Clement, K.; Tagliazucchi, G.; Lim, H.; Choi, I.Y.; Ferrari, F.; Tsankov, A.M.; Pop, R.; et al. A comparison of genetically matched cell lines reveals the equivalence of human PSCs and ESCs. Nat. Biotechnol. 2015, 33, 1173–1181. [Google Scholar] [CrossRef] [PubMed]
- Rouhani, F.; Kumasaka, N.; de Brito, M.C.; Bradley, A.; Vallier, L.; Gaffney, D. Genetic background drives transcriptional variation in human induced pluripotent stem cells. PLoS Genet. 2014, 10, e1004432. [Google Scholar] [CrossRef] [PubMed]
- Shutova, M.V.; Surdina, A.V.; Ischenko, D.; Naumov, V.A.; Bogomazova, A.N.; Vassina, E.M.; Alekseev, D.G.; Lagarkova, M.A.; Kiselev, S.L. An integrative analysis of reprogramming in human isogenic system identified a clone selection criterion. Cell Cycle 2016, 15, 986–997. [Google Scholar] [CrossRef] [PubMed]
- Chin, M.H.; Mason, M.J.; Xie, W.; Volinia, S.; Singer, M.; Peterson, C.; Ambartsumyan, G.; Aimiuwu, O.; Richter, L.; Zhang, J.; et al. Induced pluripotent stem cells and embryonic stem cells are distinguished by gene expression signatures. Cell Stem Cell 2009, 5, 111–123. [Google Scholar] [CrossRef] [PubMed]
- Bock, C.; Kiskinis, E.; Verstappen, G.; Gu, H.; Boulting, G.; Smith, Z.D.; Ziller, M.; Croft, G.F.; Amoroso, M.W.; Oakley, D.H.; et al. Reference Maps of human ES and iPS cell variation enable high-throughput characterization of pluripotent cell lines. Cell 2011, 144, 439–452. [Google Scholar] [CrossRef] [PubMed]
- Nishino, K.; Toyoda, M.; Yamazaki-Inoue, M.; Fukawatase, Y.; Chikazawa, E.; Sakaguchi, H.; Akutsu, H.; Umezawa, A. DNA methylation dynamics in human induced pluripotent stem cells over time. PLoS Genet. 2011, 7, e1002085. [Google Scholar] [CrossRef] [PubMed]
- Tomoda, K.; Takahashi, K.; Leung, K.; Okada, A.; Narita, M.; Yamada, N.A.; Eilertson, K.E.; Tsang, P.; Baba, S.; White, M.P.; et al. Derivation conditions impact X-inactivation status in female human induced pluripotent stem cells. Cell Stem Cell 2012, 11, 91–99. [Google Scholar] [CrossRef] [PubMed]
- Drozd, A.M.; Walczak, M.P.; Piaskowski, S.; Stoczynska-Fidelus, E.; Rieske, P.; Grzela, D.P. Generation of human iPSCs from cells of fibroblastic and epithelial origin by means of the oriP/EBNA-1 episomal reprogramming system. Stem Cell Res. Ther. 2015, 19, 6. [Google Scholar] [CrossRef] [PubMed]
- Takahashi, K.; Okita, K.; Nakagawa, M.; Yamanaka, S. Induction of pluripotent stem cells from fibroblast cultures. Nat. Protoc. 2007, 2, 3081–3089. [Google Scholar] [CrossRef] [PubMed]
- Park, I.H.; Zhao, R.; West, J.A.; Yabuuchi, A.; Huo, H.; Ince, T.A.; Lerou, P.H.; Lensch, M.W.; Daley, G.Q. Reprogramming of human somatic cells to pluripotency with defined factors. Nature 2007, 451, 141–146. [Google Scholar] [CrossRef] [PubMed]
- Carey, B.W.; Markoulaki, S.; Hanna, J.H.; Faddah, D.A.; Buganim, Y.; Kim, J.; Ganz, K.; Steine, E.J.; Cassady, J.P.; Creyghton, M.P.; et al. Reprogramming factor stoichiometry influences the epigenetic state and biological properties of induced pluripotent stem cells. Cell Stem Cell 2011, 9, 588–598. [Google Scholar] [CrossRef] [PubMed]
- Polo, J.M.; Liu, S.; Figueroa, M.E.; Kulalert, W.; Eminli, S.; Tan, K.Y.; Apostolou, E.; Stadtfeld, M.; Li, Y.; Shioda, T.; et al. Cell type of origin influences the molecular and functional properties of mouse induced pluripotent stem cells. Nat. Biotechnol. 2010, 28, 848–855. [Google Scholar] [CrossRef] [PubMed] [Green Version]
- Mayshar, Y.; Ben-David, U.; Lavon, N.; Biancotti, J.C.; Yakir, B.; Clark, A.T.; Plath, K.; Lowry, W.E.; Benvenisty, N. Identification and classification of chromosomal aberrations in human induced pluripotent stem cells. Cell Stem Cell 2010, 7, 521–531. [Google Scholar] [CrossRef] [PubMed]
- Planello, A.C.; Ji, J.; Sharma, V.; Singhania, R.; Mbabaali, F.; Müller, F.; Alfaro, J.A.; Bock, C.; de Carvalho, D.D.; Batada, N.N. Aberrant DNA methylation reprogramming during induced pluripotent stem cell generation is dependent on the choice of reprogramming factors. Cell Regen. 2014, 3, 4. [Google Scholar] [CrossRef] [PubMed]
- Lavezzo, E.; Falda, M.; Fontana, P.; Bianco, L.; Toppo, S. Enhancing protein function prediction with taxonomic constraints—The Argot2.5 web server. Methods 2016, 93, 15–23. [Google Scholar] [CrossRef] [PubMed]


| Gene Symbol | Probe Name | Regulation | LogFc Ep vs. BJ | LogFc R vs. BJ | LogFc S vs. BJ |
|---|---|---|---|---|---|
| RIN2 | A_24_P305570 | down | −6.10 | −5.79 | −6.33 |
| RIN2 | A_23_P91379 | down | −5.33 | −5.00 | −6.02 |
| RIN2 | A_23_P120572 | down | −4.10 | −4.90 | −4.84 |
| LMNA | A_23_P34835 | down | −4.32 | −4.45 | −4.02 |
| LMNA | A_24_P162718 | down | −4.32 | −4.60 | −4.01 |
| EMILIN1 | A_23_P165848 | down | −5.35 | −5.28 | −5.39 |
| TMEM173 | A_23_P61371 | down | −7.80 | −7.84 | −7.93 |
| COL3A1 | A_23_P142533 | down | −9.50 | −8.48 | −9.97 |
| COL3A1 | A_24_P402242 | down | −8.65 | −7.81 | −9.61 |
| COL3A1 | A_24_P935491 | down | −9.04 | −8.09 | −9.46 |
| FAP | A_23_P56746 | down | −12.49 | −12.37 | −13.23 |
| FGF5 | A_24_P401855 | down | −6.43 | −6.25 | −6.53 |
| FGF5 | A_23_P212800 | down | −8.96 | −8.97 | −8.98 |
| GBP3 | A_23_P51487 | down | −10.10 | −10.26 | −10.38 |
| GBP3 | A_24_P370702 | down | −8.60 | −9.34 | −9.31 |
| LYST | A_23_P354074 | down | −7.05 | −6.59 | −6.24 |
| ANPEP | A_23_P88626 | down | −8.20 | −8.59 | −8.20 |
| POU5F1 | A_24_P144601 | up | 11.66 | 11.67 | 11.40 |
| POU5F1 | A_23_P59138 | up | 11.29 | 11.52 | 11.36 |
| POU5F1 | A_32_P132563 | up | 10.57 | 10.70 | 10.40 |
| POU5F1 | A_24_P214841 | up | 11.28 | 11.34 | 11.11 |
| CDH1 | A_23_P206359 | up | 11.04 | 11.43 | 11.12 |
| LEFTY1 | A_23_P160336 | up | 5.49 | 5.85 | 5.15 |
| TDGF1 | A_32_P135985 | up | 7.98 | 8.29 | 7.98 |
| TDGF1 | A_23_P366376 | up | 12.70 | 12.94 | 12.67 |
| SALL4 | A_23_P109072 | up | 7.48 | 7.13 | 7.62 |
| RAB25 | A_23_P115091 | up | 7.64 | 7.32 | 7.58 |
| PTPN6 | A_23_P162486 | up | 3.80 | 3.56 | 3.91 |
| EPHA1 | A_23_P157333 | up | 8.59 | 8.39 | 8.41 |
| SCNN1A | A_23_P128323 | up | 5.64 | 5.34 | 5.57 |
| SOX2 | A_23_P401055 | up | 13.09 | 12.99 | 13.71 |
| SOX2 | A_24_P379969 | up | 9.93 | 9.85 | 10.22 |
| NANOG | A_23_P204640 | up | 9.19 | 9.78 | 9.28 |
| TERT | A_23_P110851 | up | 5.14 | 5.49 | 5.01 |
| DNMT3B | A_23_P28953 | up | 7.89 | 8.30 | 8.00 |
© 2017 by the authors; licensee MDPI, Basel, Switzerland. This article is an open access article distributed under the terms and conditions of the Creative Commons Attribution (CC-BY) license (http://creativecommons.org/licenses/by/4.0/).
Share and Cite
Trevisan, M.; Desole, G.; Costanzi, G.; Lavezzo, E.; Palù, G.; Barzon, L. Reprogramming Methods Do Not Affect Gene Expression Profile of Human Induced Pluripotent Stem Cells. Int. J. Mol. Sci. 2017, 18, 206. https://doi.org/10.3390/ijms18010206
Trevisan M, Desole G, Costanzi G, Lavezzo E, Palù G, Barzon L. Reprogramming Methods Do Not Affect Gene Expression Profile of Human Induced Pluripotent Stem Cells. International Journal of Molecular Sciences. 2017; 18(1):206. https://doi.org/10.3390/ijms18010206
Chicago/Turabian StyleTrevisan, Marta, Giovanna Desole, Giulia Costanzi, Enrico Lavezzo, Giorgio Palù, and Luisa Barzon. 2017. "Reprogramming Methods Do Not Affect Gene Expression Profile of Human Induced Pluripotent Stem Cells" International Journal of Molecular Sciences 18, no. 1: 206. https://doi.org/10.3390/ijms18010206