Article

Characterizing Aciniform Silk Repetitive Domain Backbone Dynamics and Hydrodynamic Modularity

1
Department of Biochemistry & Molecular Biology, Dalhousie University, Halifax, NS B3H 4R2, Canada
2
Department of Chemistry, Dalhousie University, Halifax, NS B3H 4R2, Canada
*
Author to whom correspondence should be addressed.
Int. J. Mol. Sci. 2016, 17(8), 1305; https://doi.org/10.3390/ijms17081305
Submission received: 29 June 2016 / Revised: 3 August 2016 / Accepted: 4 August 2016 / Published: 10 August 2016
(This article belongs to the Special Issue Silk-Based Materials: From Production to Characterization)

Abstract

:
Spider aciniform (wrapping) silk is a remarkable fibrillar biomaterial with outstanding mechanical properties. It is a modular protein consisting, in Argiope trifasciata, of a core repetitive domain of 200 amino acid units (W units). In solution, the W units comprise a globular folded core, with five α-helices, and disordered tails that are linked to form a ~63-residue intrinsically disordered linker in concatemers. Herein, we present nuclear magnetic resonance (NMR) spectroscopy-based 15N spin relaxation analysis, allowing characterization of backbone dynamics as a function of residue on the ps–ns timescale in the context of the single W unit (W1) and the two unit concatemer (W2). Unambiguous mapping of backbone dynamics throughout W2 was made possible by segmental NMR active isotope-enrichment through split intein-mediated trans-splicing. Spectral density mapping for W1 and W2 reveals a striking disparity in dynamics between the folded core and the disordered linker and tail regions. These data are also consistent with rotational diffusion behaviour where each globular domain tumbles almost independently of its neighbour. At a localized level, helix 5 exhibits elevated high frequency dynamics relative to the proximal helix 4, supporting a model of fibrillogenesis where this helix unfolds as part of the transition to a mixed α-helix/β-sheet fibre.

Graphical Abstract

1. Introduction

Spider aciniform (or wrapping) silk is the toughest type of silk and is a remarkable biomaterial with outstanding mechanical properties [1]. Spider silk proteins (spidroins) and silkworm silk proteins (fibroins) share a general architecture of a relatively long repetitive domain, comprising a concatenated series of repetitive units or sequence motifs, flanked by much shorter non-repetitive N- and C-terminal domains [2,3]. Aciniform spidroin (AcSp1) is the primary constituent of wrapping silk. In Argiope trifasciata, it is a modular protein containing at least 14 identical concatenated repeats of a 200 amino acid unit (termed here “W” units, from wrapping) [4].
Modular protein architecture, in which discrete structured modules are connected together by linkers that range from rigid to highly flexible, is common in nature [5,6,7]. The structure of individual domains are frequently studied in isolation by nuclear magnetic resonance (NMR) spectroscopy and/or X-ray diffraction, then placed in a multi-domain context through NMR spectroscopy [8,9], small angle X-ray scattering [10], or cryo-electron microscopy [11], allowing delineation of structure and dynamics in the context of the larger assembly. The orientation of domains relative to one another, their dynamics, and the relation between domains is crucial for expanding our understanding of their function [9,12,13].
Many multi-domain proteins comprise discrete, differing units (e.g., scaffolding units such as the SH2, SH3, PDZ, or PTB domains) connected by linkers with both widespread pathophysiological consequences [14] and potential for recombination for synthetic biology purposes [15]. From an NMR spectroscopy standpoint, di-ubiquitin [16,17] and GB1 [18] have been extensively studied as model multi-domain proteins. In contrast to these proteins, where discrete modules impart individual function, many fibrous proteins including spider silks employ repetitive modules [2]. This adds unique difficulties for structural biology, where the repetitive nature of these proteins leads to challenges in unambiguously tracking individual modules.
We recently employed NMR spectroscopy to determine the solution-state structure of the recombinant W unit of A. trifasciata AcSp1 in the context of both the single unit (W1) and the two-unit concatemer (W2) [19]. W1 is composed of a predominantly helical globular domain composed of five defined α-helices with an unstructured ~12 residue N-terminal tail and ~50 residue C-terminal tail. In W2, the tails of neighbouring units become a linker that retains intrinsically disordered behaviour while the globular domains are identically structured giving rise to beads-on-a-string type conformation.
Fibres cannot be formed from solutions of W1, but manual drawing of fibres is readily possible from solutions containing W2, W3, or W4 concatemers [20], including from solution-state NMR samples of W2 [19]. During fibre formation, AcSp1 undergoes a partial conversion from α-helical to β-sheet structuring [21], putatively seeded at helix 5 in the W unit [19,22]. This transition is recapitulated in recombinant W2 between the soluble and fibrous forms [19]. The 200 residue W unit from A. trifasciata differs significantly from other spider silks, such as the extensively studied major and minor ampullate silks, where short repetitive motifs such as An, (GA)n, GGX or GPGXX dominate the protein sequence [1,2]. Silkworm fibroin is also dominated by short motifs (e.g., GAGAGS and GAGAGY) in its repetitive domain [3,23]. Echoing these differences in primary structuring, the retention of α-helical character in aciniform silk fibre is distinct from both ampullate silks and silkworm silk, where fibres are completely depleted of α-helical character [1,2,21]. Hence, although recombinant W proteins are much shorter than native aciniform silk proteins and lack non-repetitive N- and C-terminal domains, with reduced strength and extensibility relative to native silk that scale approximately with the number of W units [24], the structural behaviour of these proteins is consistent with the native protein.
Characterization of dynamics within proteins at the atomic-level is possible at a variety of time-scales using NMR spectroscopy [25,26]. Measurement of 15N nuclear spin relaxation properties, namely the longitudinal and transverse relaxation times (T1 and T2, respectively) and cross-relaxation through the heteronuclear 1H-15N nuclear Overhauser effect ([1H]-15N NOE) in particular, allow for characterization of small-amplitude, high-frequency motions as a function of position along the polypeptide backbone together with delineation of regions experiencing slower dynamic fluctuations [27]. Relation of these spin relaxation parameters to global and local motion is often carried out through the model-free [28] or extended model-free [29] approaches. In instances where a single global correlation time is not suitable, such as for proteins containing large unstructured regions, the reduced spectral density mapping approach provides residue-by-residue characterization of dynamics without a reliance on global rotational diffusion parameters [30].
These dynamics characterization methods rely upon unambiguous distinction of 1H-15N cross-peaks in 2D spectra, a situation impossible in concatemeric AcSp1 repeat units without some means to distinguish one W unit from the other. The technique of intein-mediated trans-splicing provides such a means, where individual W1 units can be selectively labelled with NMR active isotopes and investigated, in the present work, in the context of the larger fibre-forming W2 protein. Inteins are naturally-occurring protein segments that excise themselves from a polypeptide and ligate the flanking protein segments together with a native peptide bond. This reaction will occur provided that a nucleophilic Ser or Cys is present immediately C-terminal to the intein and that the intein-protein fragment pair are stable in solution and allow the ligation to occur [31,32].
There have now been many demonstrated applications of inteins in structural biology and biotechnology [32,33], including protein cyclization [34,35,36]; protein switches [37,38,39,40]; in vivo protein engineering and probe attachment for biophysical studies [41,42,43]; and, importantly for the present work, segmental isotope enrichment [19,31,44,45,46,47,48]. In our previous structural studies [19], we performed segmental-labelling using split intein trans-splicing [49,50], whereby either the first (W2-1) or second (W2-2) W unit in W2 was enriched with NMR-active 13C and/or 15N nuclei while the other W unit was at natural abundance. Although we demonstrated differential dynamics between the globular core and linker/tail regions through variation in the observed heteronuclear [1H]-15N NOE, a more in-depth analysis of backbone dynamics is necessary to compare and contrast the behaviour of isolated W units vs. concatemers and to provide insight into more subtle variations in dynamics within the W unit.
Herein, new insight has been gained into the modularity, global conformation, and localized backbone dynamics behaviour of spider wrapping silk concatemers through characterization of ps–ns timescale NMR relaxation behaviour of each W unit in W2 relative to one another and to W1. In W1 and in each W unit of W2, reduced spectral density mapping is consistent with a structured five α-helix globular core having elevated dynamics in helix 5 with intrinsically disordered N- and C-terminal tails and, in W2, linker. Nuclear spin relaxation data are consistent with rotational diffusion by a compact globular core in W1 and with modular tumbling of each W unit in W2 almost independently of the remainder of the protein. Beyond ramifications for AcSp1 behaviour, the methods presented herein will serve as a useful atomic-level model for further characterization of modular proteins in solution.

2. Results

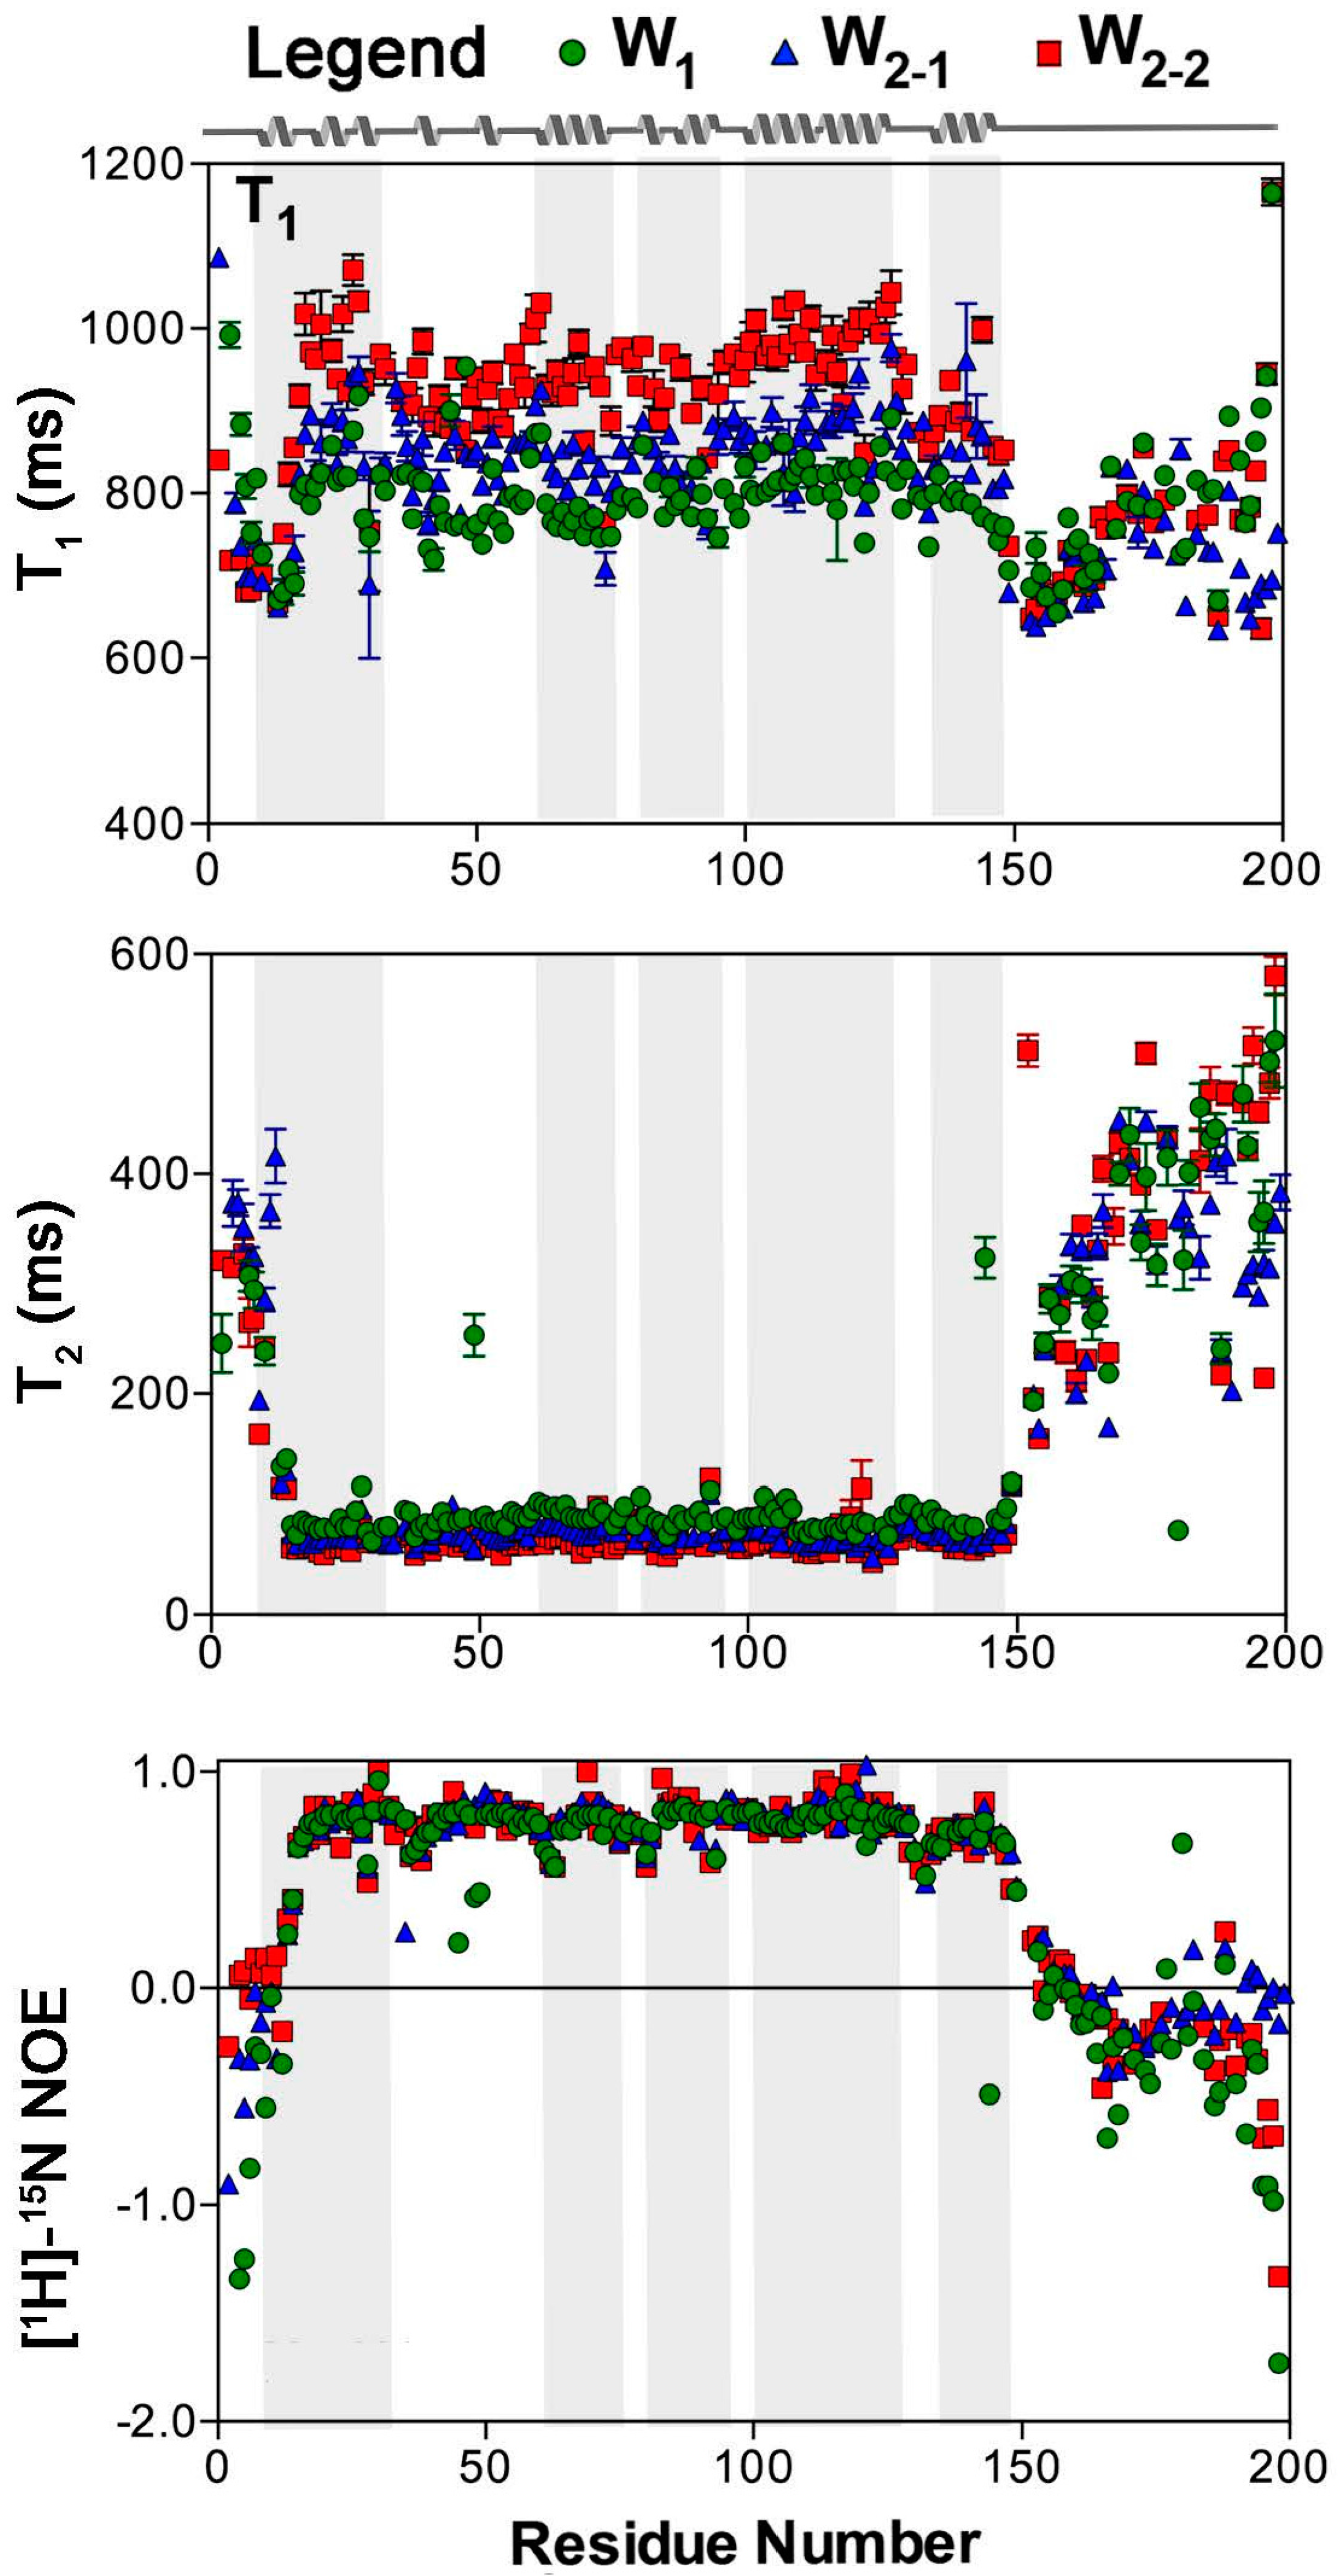
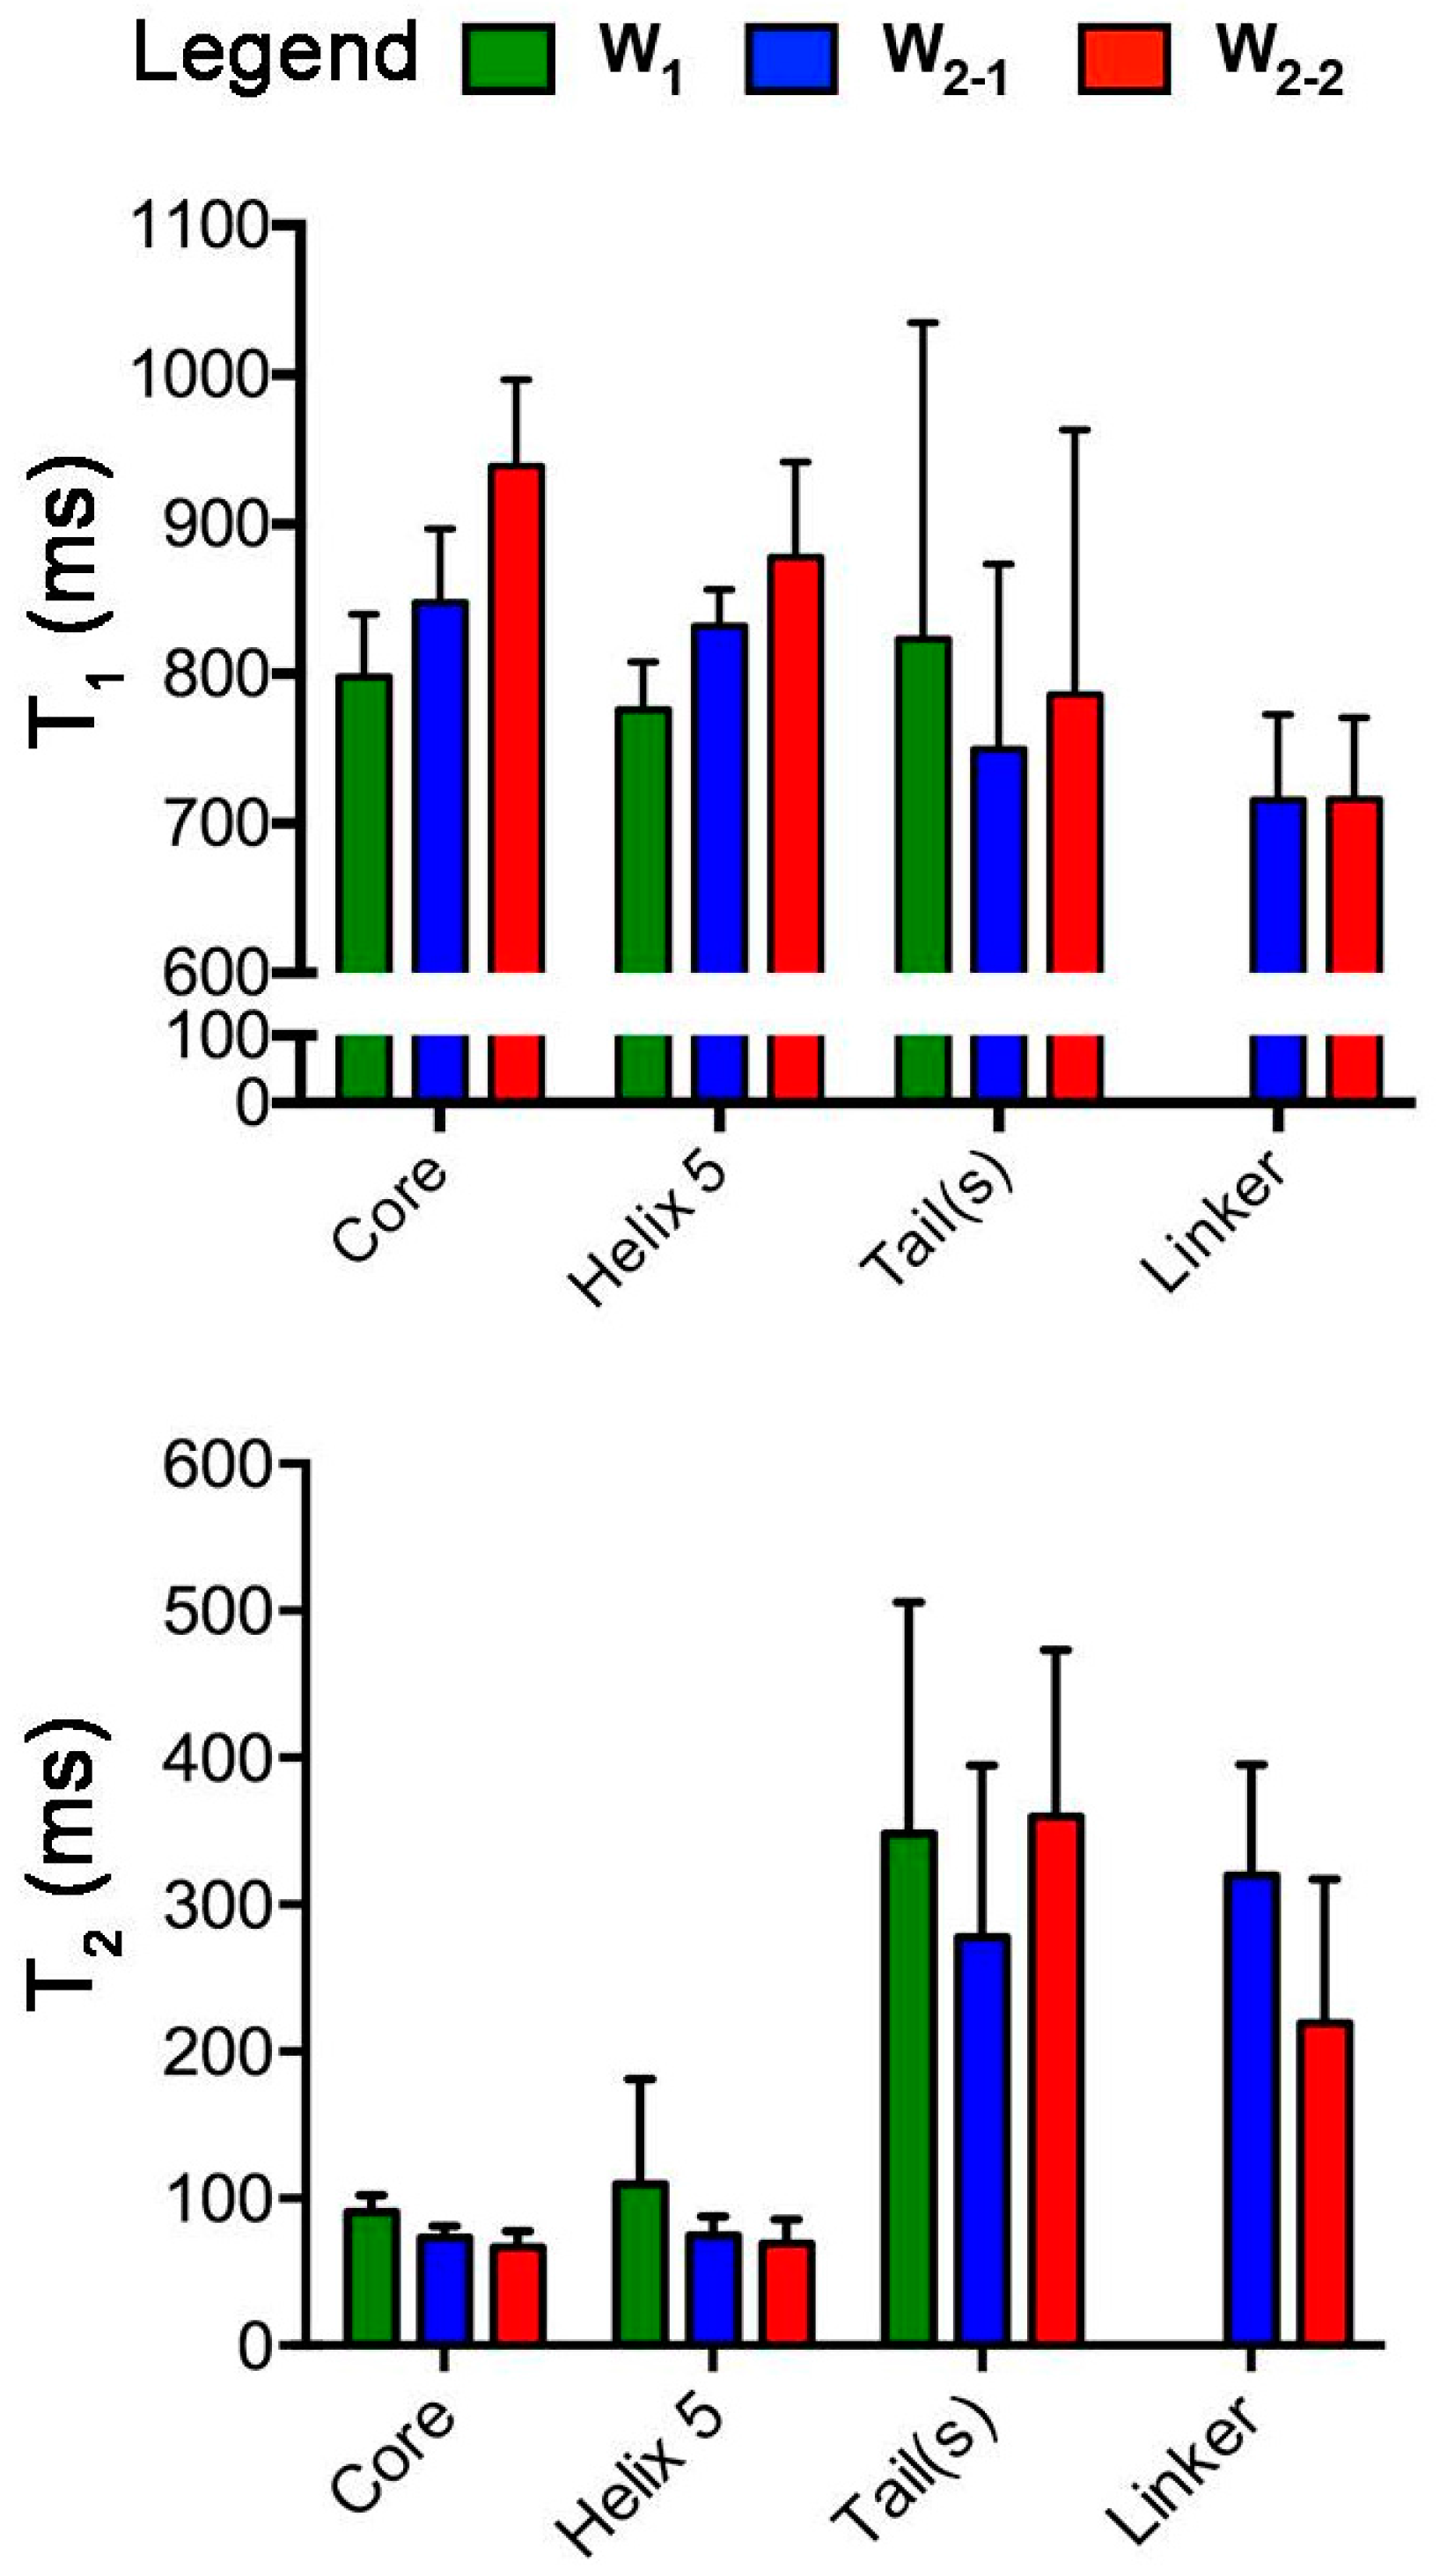
2.1. Nuclear Spin Relaxation Parameters

Longitudinal (T1) and transverse (T2) relaxation time constants were measured at 16.4 T on a residue-by-residue basis [27] for both the monomeric (W1) and concatemeric (W2) states of recombinant AcSp1 (Figure 1). To facilitate direct comparison, and because these data are integral for the subsequent analysis, the [1H]-15N data that we previously reported [19] are also plotted in Figure 1. A segregation in spin relaxation behaviour is clear between (i) the folded domain (residues 12–149 for a given W unit, with secondary structure elements shown in linear form in Figure 1) and (ii) the N- and C-terminal tails of W1 and W2 and the linker spanning W2-1 to W2-2 in W2. Namely, T1 and the [1H]-15N NOE are elevated through the folded core of a given W unit and decrease in the linker and tail regions while T2 exhibits the opposite trend.
For direct overall comparison, mean values of T1 and T2 were determined for four subdivided regions of the W unit chosen based upon our previous structural and 19F-NMR studies: the globular core (residues 12–149 and, in W2, 212–349), helix 5 within the core (residues 135–149 and, in W2, 335–349), tails (W1: residues 1–11 and 150–199; W2: residues 1–11 and 350–400), and the linker (residues 150–211 in W2 only) (Figure 2). Qualitatively, T1 is larger while T2 is smaller in the globular core for each W2 subunit relative to W1. The observed behaviour is consistent with the 15N relaxation behaviour to be expected on the basis of more rapidly (W1) vs. slowly (W2) tumbling molecules [27]. Notably, T1 values for W1, W2-1, and W2-2 are significantly different for the core (p-value < 0.0001) and helix 5 (p-value < 0.01), while the tails are relatively similar (albeit with large variance) regardless of protein size.
In examining overall T2 behaviour (Figure 2), the most striking feature is the large difference in mean values between the globular core and the disordered tails/linker, with a significant elevation in T2 for the tails or linker in all W units. As with T1, W1 exhibits a significant difference in behaviour from both W2-1 and W2-2 (p-value < 0.0001), with an elevated T2 relative to either unit in W2. Although the significance is low (p-value < 0.1), helix 5 follows the same qualitative trend. Unlike with T1, however, W2-1 and W2-2 do not exhibit significant differences in T2 relative to each other. Although the tails would be expected to be less encumbered and more dynamic overall, there is no difference between the mean values observed for the tails and the linker.

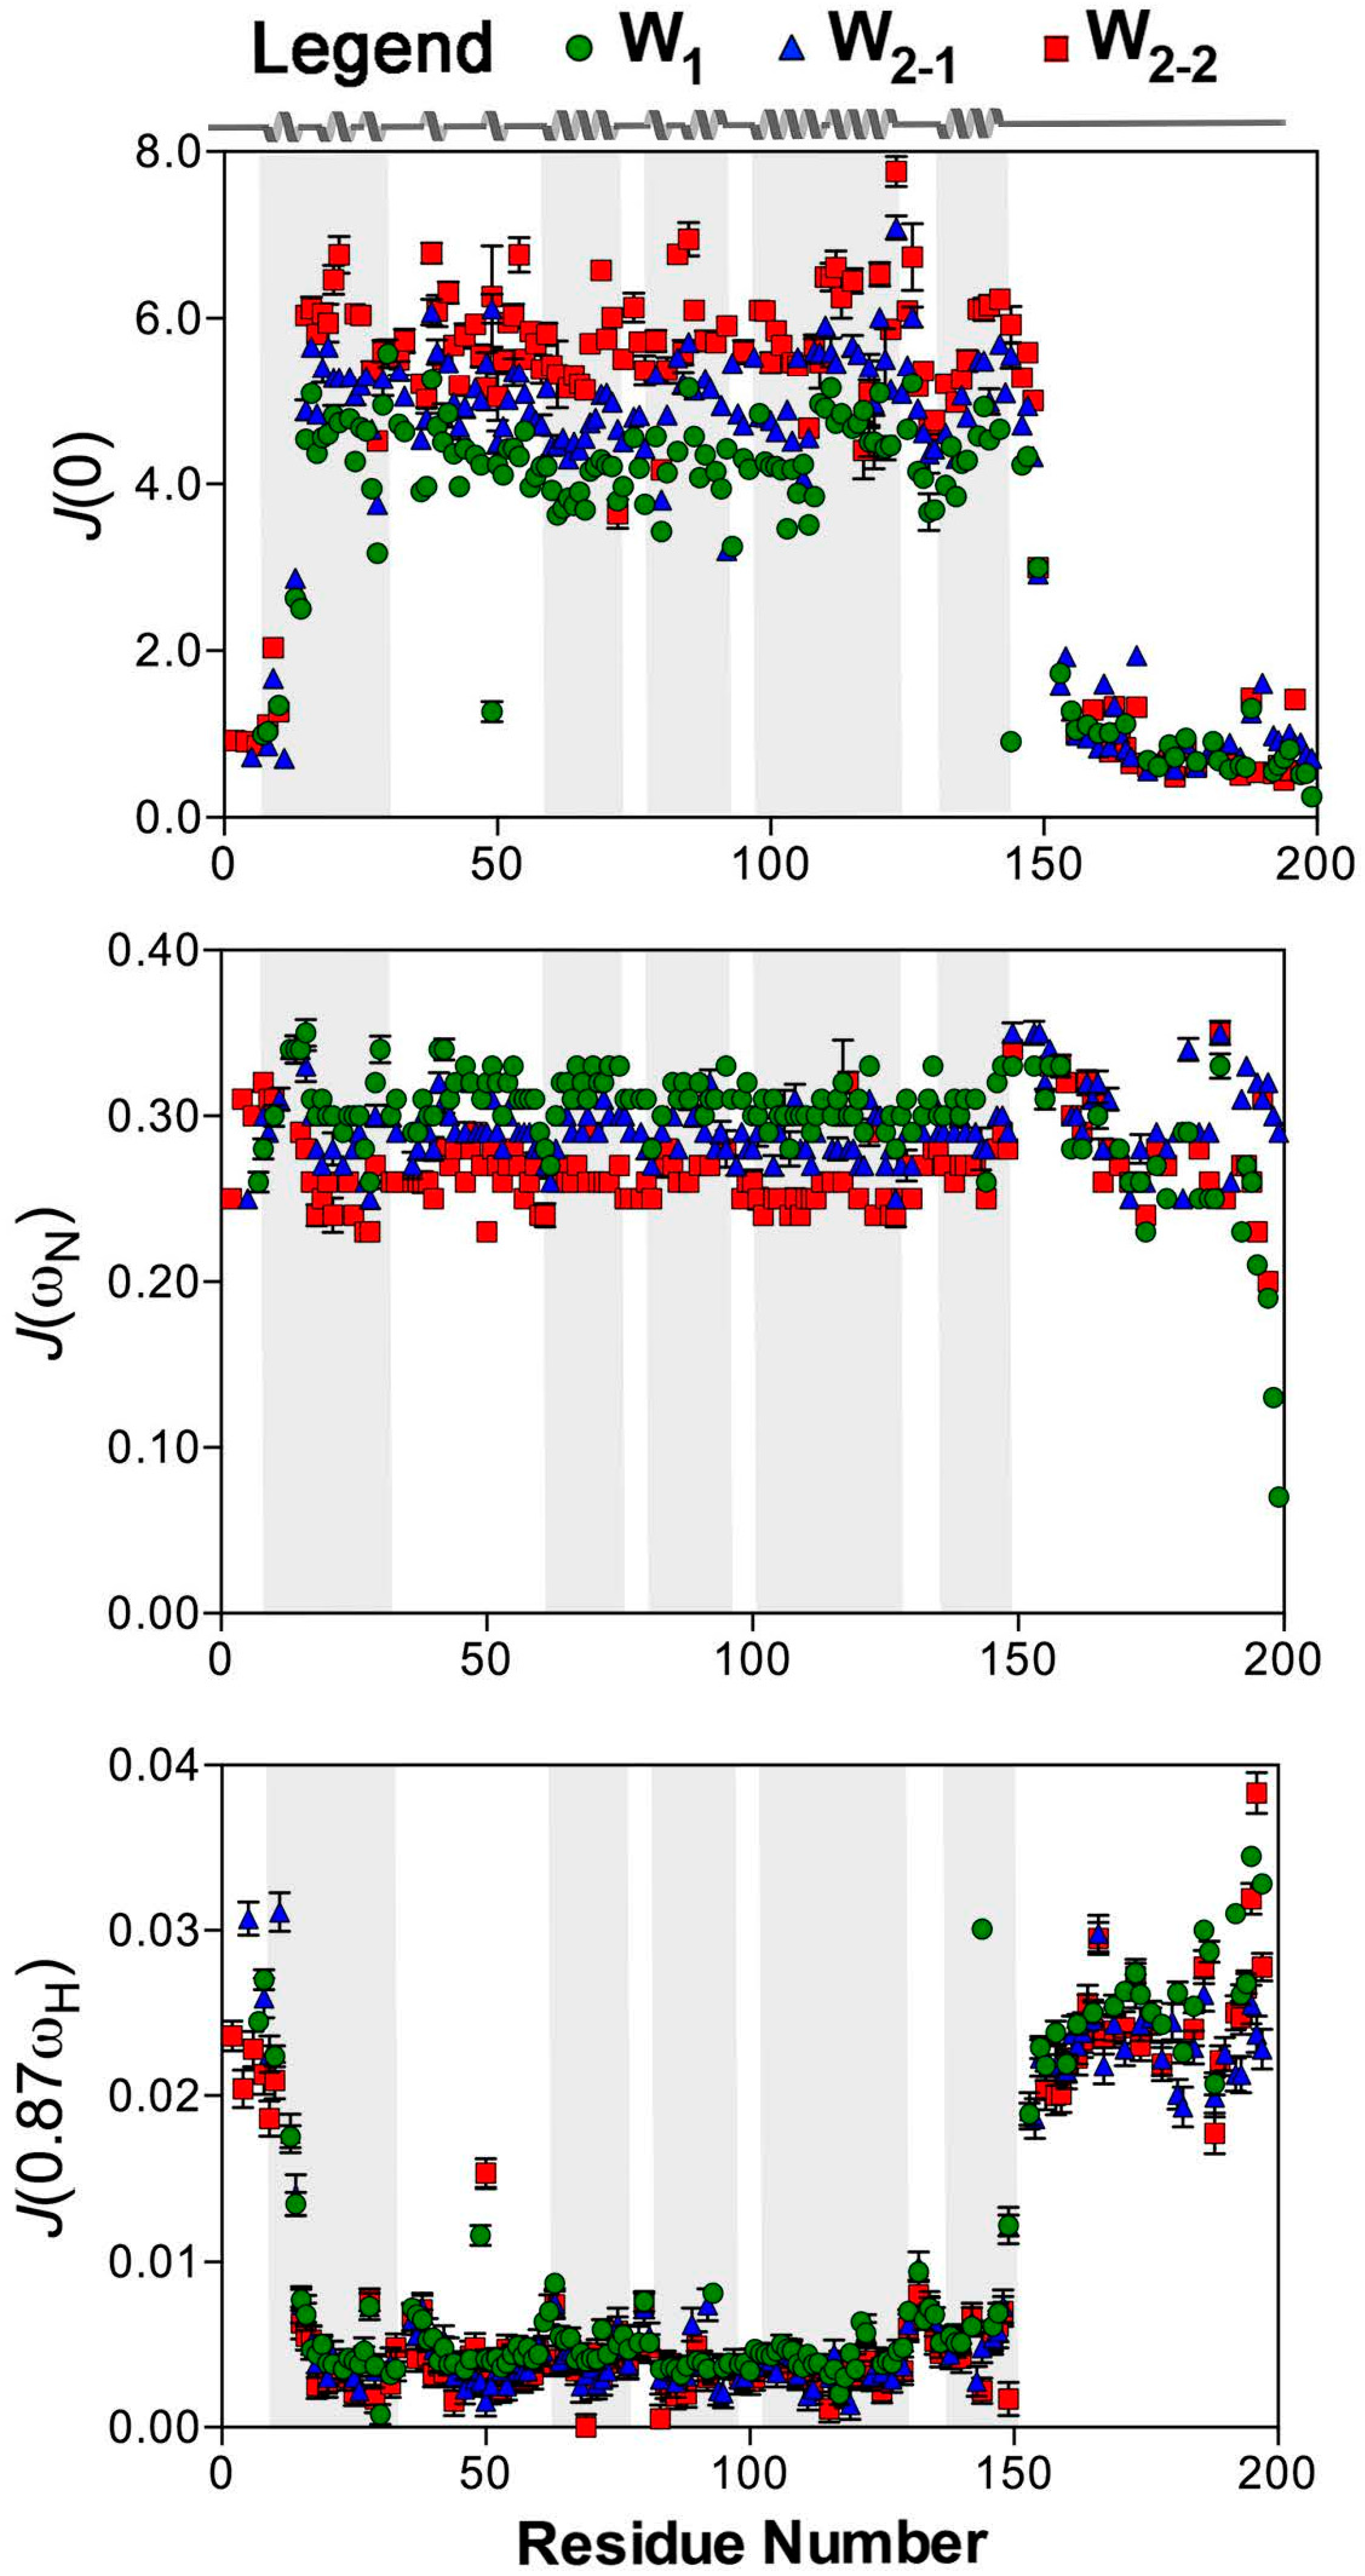
2.2. Reduced Spectral Density Mapping

The values of the reduced spectral density at J(0), JN), and J(0.87ωH) were calculated independently for each W unit. All residues with T1 and T2 fits that met the goodness-of-fit criterion (χ2 < critical χ2 [51]) for a given dataset at 16.4 T were employed for spectral density determination, giving 145, 153, and 131 residues, respectively, for W1, W2-1, and W2-2. J(0.87ωH) and J(0) both strongly demonstrate disparate dynamics between the folded core and the tails/linker, mirroring the behaviour of the individual T1, T2, and [1H]-15N NOE parameters (Figure 3 and Figure 4). JN), conversely, remains relatively uniform throughout all regions of a given unit of W1 or W2, without significant differences between globular and linker domains. Reflecting the relatively strong dependence of JN) on T1, an expected decrease in JN) is observed from W1, W2-1, to W2-2 for the globular core (p-value < 0.0001), with helix 5 following suit (p-value < 0.01), while those for the tails and linker are not significantly different between the W units.
J(0.87ωH), which is very sensitive to differences in motion in the high frequency regime [52], exhibits localized increases in W1 and in each W unit of W2 around residues 36, 63, 80, 121, and 132 (Figure 3), correlating directly to the locations of loops or turns within the W unit [19]. It should be noted, though, that the increases in J(0.87ωH) observed at these locations are not of the same magnitude as those seen for the linker or tails (Figure 3). These variations are, therefore, likely reflective of regions of the protein experiencing increased dynamics but tumbling with the core of the folded domain rather than behaving as intrinsically-disordered segments.
A statistically significant increase in J(0.87ωH) is also observed for helix 5 (residues 135–149) relative to helix 4 (residues 101–127) (p-values of 0.0060, 0.0001, and 0.0025 for W1, W2-1, and W2-2, respectively) or to the core (helices 1–4) (p-values of 0.019, 0.0011, and 0.0085 for W1, W2-1, and W2-2, respectively). Helix 1, like helix 5, is directly connected to a disordered tail or linker segment [19]; therefore, helix 1 would be expected to exhibit similarly elevated dynamics if proximity to a tail or linker were the only factor at play. Instead, helix 1 behaves more like a core helix, as demonstrated by a lack of significant differences in J(0.87ωH) for helix 1 vs. helix 4 (p-values of 0.11, 0.046, and 0.126 for W1, W2-1, and W2-2, respectively). There is also a qualitative difference between J(0.87ωH) of helix 5 in the W units, with W1 > W2-1 > W2-2 (Figure 4) following the same qualitative trend as the core as a whole.
Like JN), the behaviour at J(0) differs between W1, W2-1, and W2-2 in the globular core (p-value < 0.0001) and helix 5 (p-value < 0.001), increasing from W1, to W2-1 and W2-2 and opposite in trend to the observed decrease in JN). W1 has the lowest mean frequency at J(0) over the folded core (4.26 ± 0.07), followed by W2-1 (5.02 ± 0.11), and then W2-2 (5.67 ± 0.37) (Figure 4). On average, the tail/linker regions do differ between W1, W2-1, and W2-2 but care must be taken during interpretation given that the tail group for W2-1 has seven values and W2-2 linker has six values. When the tails and linker are grouped together, there is no statistical difference between the W units.

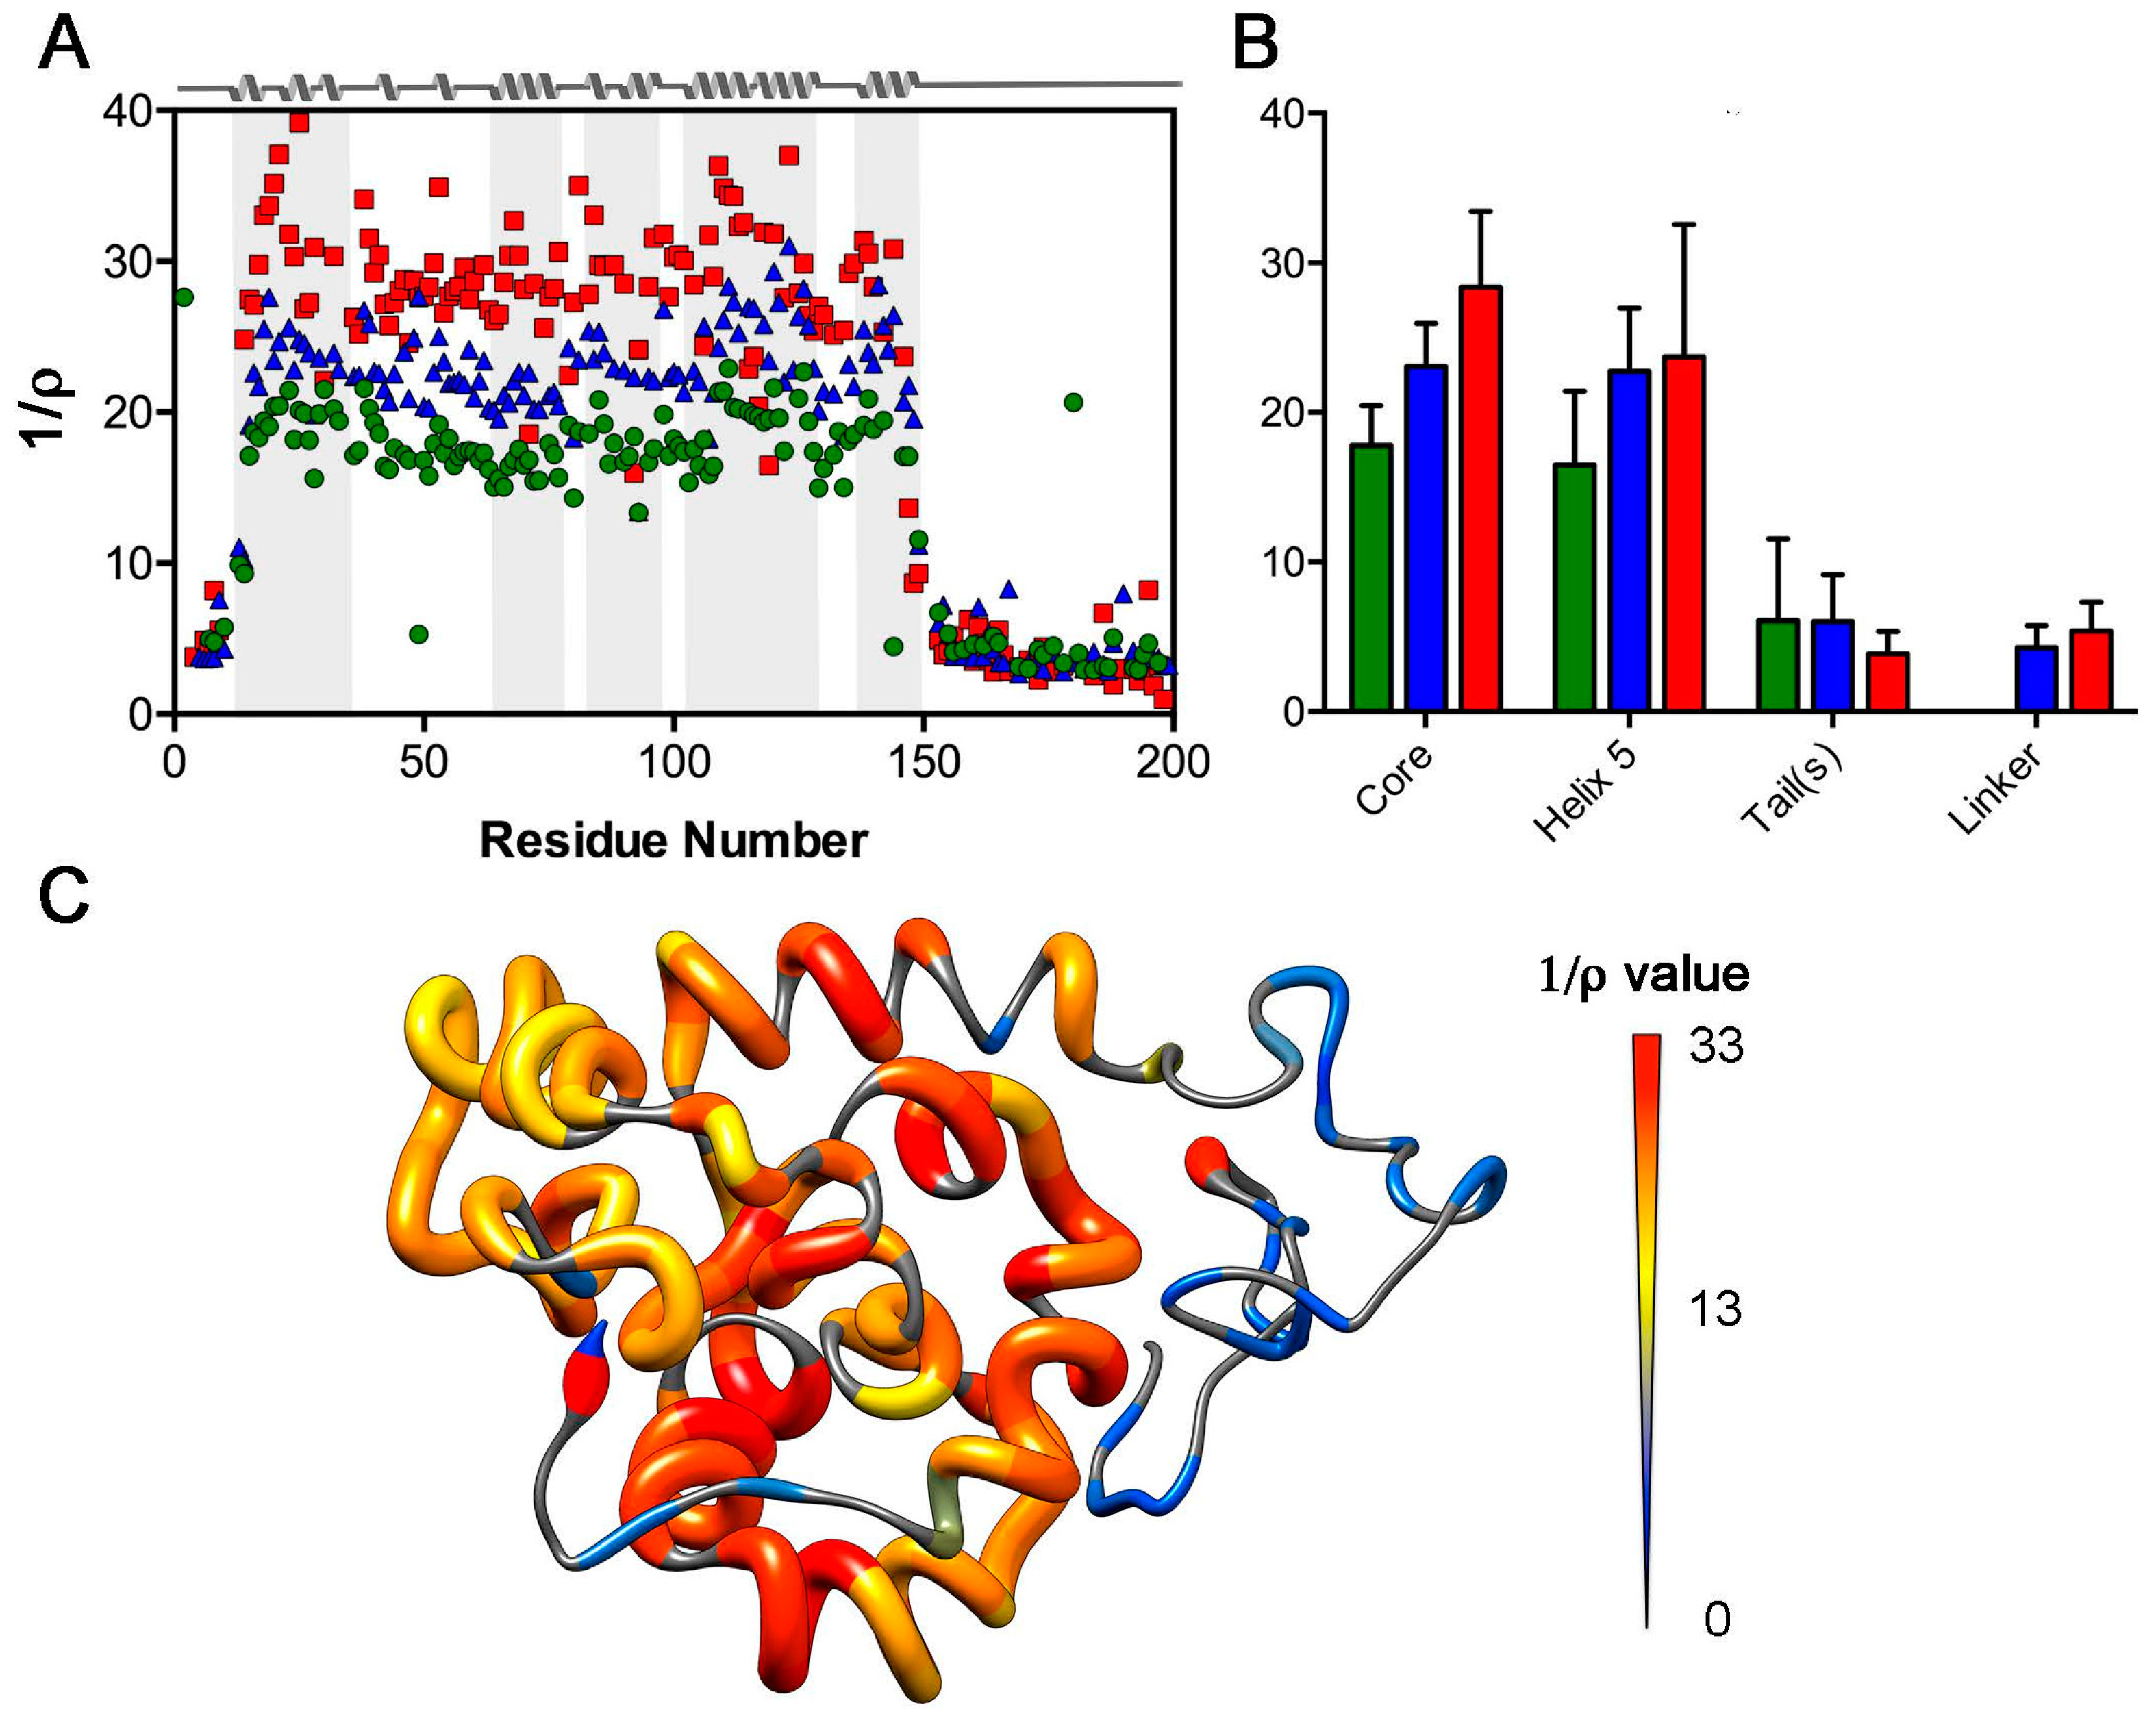
2.3. Analysis of Rotational Diffusion

Spin relaxation data were used to compare the suitability of isotropic, axially symmetric, or fully anisotropic rotational diffusion tensors for W1, W2-1, W2-2, and W2 based upon all residues with [1H]-15N NOE > 0.65 [53] using the software ROTDIF [54]. In each instance, an axially symmetric rotational diffusion tensor provided the best fit to the data (Table 1); notably, the degree of anisotropy observed was minimal in light of the fact that ~90% of an 878 monomeric protein dataset exhibited an anisotropy of 1.17 or higher [54]. W1 spin relaxation data were best fit with a prolate rotational diffusion tensor for all 20 members of the NMR structural ensemble (PDB entry 2MU3 [19]), with an anisotropy range of 1.09–1.18. Conversely, W2-2 was uniformly oblate (anisotropy 0.90–0.95 with W1 ensemble) while W2-1 varied depending upon the ensemble member employed, with anisotropy of 1.05–1.16 (16 members) or 0.88–0.95 (four members) observed. The fitting behaviour for W2-1 is consistent with the small degree of anisotropy observed, with minimal deviation from an isotropic fit. Additionally, diffusion tensors were modelled for a combined W2-1 and W2-2 spin relaxation data set using the ensemble of 20 inferred W2 structures [19]. In this instance, anisotropy remained minimal and most ensemble members led to oblate fits (anisotropy 0.8–0.92 for 18 members; 1.12–1.13 for two members). Goodness-of-fit, as judged by χ2 per degrees of freedom, was comparable in all instances (Table 1).
Ensemble-averaged values of τc based upon anisotropic diffusion tensors demonstrated only modest increases from 7.9 ns for W1 to 9.0 ns for W2-1 to 9.6 ns for W2-2. To place this behaviour in context, a variety of rotational correlation time (τc) estimations were compared (Table 2). Using Stokes’ law (Equation (5)), crude values of τc were estimated both according to an assumption of spherical shape (Equation (6)) and according to our previously reported hydrodynamic radii determined by diffusion ordered NMR spectroscopy (DOSY) and verified by dynamic light scattering [19]. Our NMR-derived W1 structural ensemble and the inferred W2 structural ensemble were also used for detailed hydrodynamics calculations in HYDROPRO [55] to estimate τc. To test the effect of a more compact globular tumbling unit, τc values were also determined for the W1 globular core (i.e., excluding the N- and C-terminal tails) with and without the inclusion of the more dynamic (Figure 4) and less stable helix 5 [19,22]. It should also be noted that the viscosities employed for the Stokes’ law and HYDROPRO hydrodynamics calculations (Table 2) were experimentally determined, rather than estimated. This determination was carried out through DOSY experiments with use of an internal dioxane standard [56]. Estimated τc values for W1 were most consistent with the experimentally-observed behaviour for the most compact estimates of its conformation. W2, conversely, was estimated regardless of the hydrodynamic model employed to tumble much more slowly than was experimentally observed for each globular unit in the concatemer.
The ratio of T1 to T2 can also be related to τc for the tumbling of a macromolecule in solution under the qualification that the 1H-15N spin pair in question does not experience significant rapid internal motion [27]. Extending this treatment, measured backbone relaxation time constants may be modified (giving T1’ and T2’, Equations (1) and (2), respectively) to remove high frequency spectral density contributions [17]. The ratio of these modified relaxation time constants, ρ (Equation (3)), is relatively insensitive to localized variations in dipolar coupling and 15N chemical shift anisotropy and, for a protein core, primarily dependent on overall tumbling. Direct comparison of the estimated τc obtained from average values of T1/T2 or T1′/T2′ on the basis of the 15N relaxation analysis of Kay et al. [27] neglecting high-frequency terms (Equation (7)) demonstrates excellent agreement with the far more rigorous ROTDIF calculation.
At a more global level, discrete differences in 1/ρ are apparent between the globular core vs. tail and linker regions of W1, W2-1, and W2-2 (Figure 5), with the core of W1 being significantly decreased in 1/ρ (p-value < 0.0001) relative to W2-1 or W2-2 and mirroring of this behaviour by helix 5 (p-value < 0.01) (Figure 5B). Following the same trend as J(0) (Figure 4), W1 has a statistically significantly lower mean (p-value < 0.0001) 1/ρ in the core compared to W2-1; W2-1 is again significantly lower than W2-2 (p-value < 0.0001), reflecting differences in rotational diffusion between W1 and each of the W units in W2 (Figure 5; Table 1). Additionally, regardless of being in a tail or linker, the corresponding residues in a given W unit in W2 (i.e., residues 1–11 relative to 201–211 and 150–200 relative to 350–400) demonstrate very similar mean 1/ρ values. The variance accompanying 1/ρ is, however, too great to draw significance.

3. Discussion

AcSp1 from A. trifasciata is a modular protein composed primarily of a repetitive domain of concatenated 200 amino acid W units [4]. We recently demonstrated that the W unit is composed of a well-folded globular domain of ~138 residues connected to adjacent globular domains by intrinsically-disordered linkers ~62 residues in length [19]. The functional necessity of this folded domain is further implied from the fact that it appears to be highly conserved (albeit considering a limited number of sequenced species), while the linker may vary both in length and sequence [57].
The modularity of AcSp1 was established through direct backbone chemical shift comparison between the monomeric (W1) and concatemeric (W2) states of AcSp1. Specifically, the chemical shifts of W2 are remarkably similar to W1 with exception of those in the linker immediately proximal to the covalent W unit linkage [19]. Beyond conservation of chemical shifts, heteronuclear [1H]-15N NOE data recorded at 16.4 T (Figure 1) also uphold the conformational independence of W units, given that W1 and each of the W units in W2 exhibit very similar NOE enhancement factor patterns as a function of position within the W unit [19]. In each case, higher NOE enhancement factors are exhibited in the folded domain (residues 12–149, numbering relative to each W unit) and lower or negative enhancements in the disordered terminal or linker regions (residues 1–11, 150–200) (Figure 1). The effect of concatemeric linking of W units is observed in the vicinity of the covalent linkage of the W units (residues ~190 to 210 of W2) through a less negative NOE enhancement relative to the free N- and C-terminal tails of W1 and of W2-1 and W2-2, respectively.
Our previous studies showed clear modularity in the W unit both in terms of structuring of the globular domain and the intrinsic disorder of the linker. The 15N spin relaxation measurements and reduced spectral density mapping detailed herein demonstrate that this modularity clearly extends beyond structuring and into the dynamic behaviour along the polypeptide backbone. Segmental isotope-labelling mediated by split intein trans-splicing allowed us to track this behaviour unambiguously along the length of W2. It should be noted that the relaxation analysis methods employed herein are limited to probing motions in the ps-ns regime [26], but that the trans-splicing methodology, itself, can be directly applied to other NMR-based methods allowing characterization of longer time-scale motions.
Direct comparison of the N- and C-terminal W units in the concatemer was, thus, possible alongside a comparison of W1 to W2. T1, T2, [1H]-15N NOE, and 1/ρ, in each case, explicitly delineate the globular vs. tail or linker domains (Figure 1, Figure 2 and Figure 5). For the most part, the globular domain exhibits uniform spin relaxation behaviour, with slight localized decreases in the [1H]-15N NOE delineating the secondary structure elements centred at residue 35–37 (between helix 1 and the converged, predominantly helical region over residues 40–60), residue 61 (between residues 40–60 and helix 2), residues 79–80 (between helices 2 and 3), residues 91–93 (near the helix 3 C-terminus), and residues 128–132 (between helices 4 and 5).
Given the existence of discrete disordered and globular domains in the W unit, we employed the 15N reduced spectral density mapping approach [30] to analyze backbone dynamics, rather than the model-free [28] or extended model-free [29] formalism. This approach alleviates the requirement for defining specific motional modes and their independence or lack thereof, with demonstrated suitability for proteins of mixed ordered and disordered segments [52]. The resulting values of the spectral density function at three frequencies, J(0), JN), and J(0.87ωH), derived from relaxation parameters T1, T2, and [1H]-15N NOE provide complimentary information along the peptide backbone (Figure 3 and Figure 4) and unequivocally support our original model of W2, based on W1 restraints [19], with the tail/linker regions and the globular domain being noticeably segregated.
JN) is much less sensitive to internal motions at the ps-ns time scale in comparison to J(0) and J(0.87ωH) and displays very little variability between the folded domain and the linker. The residues in the folded domain have large J(0) and small J(0.87ωH), while the linker and tail regions display the opposite trend (Figure 3 and Figure 4). This is consistent with a situation where the linker and tails experience motion over a wider range of frequencies relative to the globular domain, as would be expected for an intrinsically disordered domain. Noticeably, the mean J(0) and JN) values over the globular domain differ significantly between W1, W2-1, and W2-2, increasing or decreasing, respectively, from W1 to W2-1 to W2-2. This behaviour is consistent with an increase in tumbling rates from W1 to W2-1 to W2-2.
Based upon both heteronuclear NMR [19] and 19F-NMR [22], helix 5 (residues 135–149) and the portion of the globular domain in contact with it (falling in proximity to residue 36) are less stable than the remainder of the protein. Chaotropic denaturation or treatment with the detergent dodecylphopshocholine lead to helix 5 destabilization and a concomitant structural rearrangement in the globular core of the W unit [19,22]. Notably, therefore, the spectral density in helix 5 deviates from the remainder of the globular domain. Direct comparison to the proximal helix 4 shows elevated spectral density at J(0.87ωH). J(0) is also qualitatively lower for helix 5 than for the remainder of the globular core (helix 1–4) (Figure 3). This behaviour, as a whole, is consistent with a greater sampling of high-frequency motion in this region of the W unit regardless of whether it is in an isolated W unit or a concatemeric construct.
Helix 5 falls immediately N-terminal to the intrinsically disordered linker. Our working hypothesis is that decompaction of the W unit occurs through loss of interaction of helix 5 with the core [22] followed by denaturation [19]. This would, in turn, greatly favour protein-protein entangling and interaction, inducing subsequent β-sheet formation during fibrillogenesis. Backbone-level dynamics are consistent with the distinct behaviour of helix 5 relative to the remainder of the globular domain and unambiguously demonstrate a propensity for increased high frequency motion.
Before considering rotational tumbling behaviour in more detail, it should be noted that the viscosities measured for the W1 and W2 samples in NMR buffer (Table 2) are significantly higher than the ~0.82 cP that is derived on the basis of a linear combination of the expected [58] H2O and D2O viscosities at 30 °C. The source of this elevated viscosity is not fully clear. Given that W1 will, for example, spontaneously form nanoparticle (or micellar) structures in aqueous solution [59], supramolecular assembly was certainly a distinct possibility. Neither spin relaxation behaviour (Table 2) nor translational diffusion observed by DOSY [19] are consistent with long-lived entanglement of the proteins or of stable oligomer formation. Were entanglement, oligomerization, or nanoparticle/micelle formation happening in the bulk of the sample, substantially slower tumbling and diffusion than observed would be expected. The fact that the vast majority of protein in solution is still fully observable on the basis of both spin relaxation behaviour and signal intensity by heteronuclear ([19] and herein) and 19F [22] NMR implies that if intermolecular entangling and/or supramolecular assembly are occurring and increasing solution viscosity that this only involves a small fraction of the total protein.
Tumbling of W1, reflected in the observed τc of 7.9 ns, is more rapid than would be anticipated strictly on the basis of the W1 hydrodynamic radius previously determined though DOSY [19] or through hydrodynamics calculations using the W1 structural ensemble (Table 2). W1, instead, exhibits tumbling consistent with a compact spherical particle of the same molecular weight with a half-shell of water. The overestimates in τc on the basis of overall W1 shape and dimensions are not surprising, given that the presence of intrinsically disordered domains in a protein leads to a general overestimation of τc by methods (such as HYDROPRO) that employ an assumption of rigid behaviour [60,61]. Truncation of the W1 structure either to the globular core or to the core without helix 5 lead to improved agreement between the inferred and observed τc values, with the helix 1–4 globular core leading to a predicted τc of ~8.4 ns. Rotational diffusion is, therefore, most consistent with a compact globular core where helix 5 is not always attached. Translational diffusion, conversely, agrees well with the overall shape of W1 [19].
Modest increases in τc, to 9.0 ns for W2-1 and 9.6 ns for W2-2, are observed relative to 7.9 ns for W1. These values are ~2/3 of those predicted for a compact sphere and ~1/2 those predicted on the basis of the DOSY-determined W2 hydrodynamic radius and <1/3 that predicted by HYDROPRO on the basis of the W2 structural ensemble. This behaviour is also directly reflected in the magnitude of the observed increases in 1/ρ from W1 to W2-1 to W2-2 (Figure 5). Namely, W2 does not exhibit anywhere near the expected [17] ~doubling of 1/ρ relative to W1 that would be observed if the two W units in W2 were rigidly tumbling together as a species of double the molecular weight. Following studies using ensemble methods to accurately predict rotational diffusion for molecules containing intrinsically-disordered linkers [61,62], this is instead consistent with mostly decoupled tumbling of each globular domain. The increased τc of W2-2 relative to W2-1 is consistent with greater hydrodynamic friction experienced from the asymmetric nature of the tails, with an ~11 residue disordered N-terminal tail for W2-1 vs. an ~50 residue disordered C-terminal tail for W2-2.

4. Materials and Methods

4.1. Sample Preparation

Protein samples were prepared by recombinantly expressing W1 and W2 in Escherichia coli BL21(DE3), following previously-described protocols [19,63]. It should be noted that W1 consists of residues 1–199 of the AcSp1 repeat unit from A. trifasciata while W2-1 and W2-2 each comprise the full 200 amino acid repeat unit concatenated to form a 400 residue protein. An N-terminal Met is also present in W2 from the initiation codon; for simplicity of comparison between W1 and each unit in W2, the Met is not included in residue numbering. Uniformly 15N-enriched W1 (~0.2 mM), and selectively 15N-enriched W2-1 and W2-2 (~0.2 mM) NMR samples were prepared in sodium acetate buffer (20 mM d3-acetate (Sigma-Aldrich Canada, Oakville, ON, Canada) in H2O:D2O (Sigma-Aldrich Canada) at 90%:10% (v/v), 1 mM NaN3 (Sigma-Aldrich Canada), 1 mM 2,2-dimethyl-2-silapentane-5-sulfonic acid (DSS) (Wilmad, Buena, NJ, USA); pH 5).

4.2. Spin-Relaxation NMR Experiments

NMR spin relaxation experiments were carried out at 30 °C on an Avance III NMR spectrometer operating at 16.4 T (Bruker Canada, Milton, ON, Canada) and equipped with a triple-resonance 5 mm indirect detect TCI cryoprobe. Two-dimensional phase-sensitive 1H-15N HSQC experiments were used to measure longitudinal relaxation times (T1; hsqct1etf3gpsi pulse program, Bruker library) and transverse relaxation times (T2; hsqct2etf3gpsi pulse program, Bruker library). All experiments were performed using 16 scans, 1.5 s recycle delay for W1 and 1.75 s for W2-1 and W2-2, spectral widths of 23 and 16 ppm with offsets of 115.5 ppm and at the water frequency (4.705 ppm), respectively, for 15N and 1H. W1 spectra contained 192 × 2048 complex points and W2-1 and W2-2 contained 128 × 2048 complex points for the 15N and 1H, respectively. The T1 data were collected using relaxation delays of 50, 100, 250, 500, 750, 1000, 1300, and 1700 ms and the T2 data were collected using 17, 34, 51, 85, 119, 152, 187, and 238 ms relaxation delays, with a Carr-Purcell-Meiboom-Gill pulse train applied as appropriate for a given relaxation delay during the recycle delay to compensate for heating effects. [1H]-15N steady-state heteronuclear nuclear Overhauser effects ([1H]-15N NOE; hsqcnoef3gpsi pulse program, Bruker library) for the 15N nuclei were measured in an interleaved manner as described previously [19]. Briefly, the [1H]-15N NOE measurements were performed using a total of 356 × 4096 complex points with 32 transients for W1 and 256 × 4096 complex points and 32 transients for both W2 domains.

4.3. Determination of Spin Relaxation Parameters and Reduced Spectral Density mapping

Backbone 15N T1, T2, and [1H]-15N NOE as a function of 1H-15N cross-peak position were determined and correlated to our previously assigned chemical shifts (deposited in the Biological Magnetic Resonance Data Bank for W1 (BMRB entry 17899) and W2 (BMRB entry 25197) [19,63]). The 15N T1 and T2 values with associated errors were determined using the Mathematica version 8.0.4 (Wolfram, Champaign, IL, USA) notebook Relaxation Decay, freely available from Leo Spyracopoulos [51]. R1 (R1 (s−1) = 1/T1) and R2 (R2 (s−1) = 1/T2) relaxation rates were determined from nonlinear least-square fits to a two-parameter monoexponential decay. Errors were estimated based on the average spectral noise. The [1H]-15N heteronuclear NOE was measured as the ratio of the saturated spectrum to the reference spectrum as Isat/Iref where Isat and Iref are the intensities of the peaks in the 1H-15N HSQC spectra, with and without proton saturation during the recycle delay, respectively. Non-linear fits were used to minimize the statistical value of χ2. The χ2 goodness-of-fit test per residue was used and compared to the exact critical χ2 determined from 100 Monte Carlo simulations (9.146) for a single residue at a 95% confidence interval:
1/T1’ = R1’ = R1[1 − 1.249|γN/γH|(1 − NOE)]
and:
1/T2’ = R2’ = R2 − 1.079|γNH|R1(1 − NOE)
where γN and γH are the gyromagnetic ratios of 15N and 1H, respectively. The ratio of these modified rates, was calculated as:
ρ = [(2R2’/R1’) − 1]−1
Finally, per-residue values of J(0), JN), and J(0.87ωH) were determined through 15N reduced spectral density mapping [30] using the Spectral Density Mathematica notebook [51].

4.4. Viscosity Determination

The viscosity (η) of each NMR sample was calculated using a dioxane internal standard [56]. DOSY experiments acquired and processed as detailed previously for W1 and W2 [19] were analyzed to directly determine the translational diffusion coefficient (DC) for dioxane in a given W sample. Coupling each measured DC with the known hydrodynamic diameter (dH) of dioxane (0.424 nm [56]), η may be determined through the Stokes-Einstein equation [64]:
DC = (kBT)/(3πηdH)
where kB is the Boltzmann constant and T the absolute temperature (303 K).

4.5. Analysis of Rotational Diffusion

To analyze rotational diffusion behaviour with respect the 15N spin relaxation data, isotropic, axially symmetric, and anisotropic diffusion tensors models were applied to W1, W2-1, and W2-2 using ROTDIF 3.1 [54]. Only residues with [1H]-15N NOE > 0.65 and not likely to be involved in conformational exchange were used for the analysis. For W1, W2-1, and W2-2, the 20-member W1 structural ensemble (PDB ID 2MU3) was iteratively analyzed through ROTDIF using robust least-square fitting to obtain global information with coordinates from the lowest energy member to model the diffusion tensor frame (D|| and D tensor axes for an axially symmetric system, or Dxx, Dyy, and Dzz tensor axes for a fully anisotropic system) and Euler angles (α, β, and/or γ). In addition, the W2 ensemble member with the calculated Rg closest to the experimental Rg was deemed the representative model for the reference frame of the diffusion tensor for W2 (merged W2-1 and W2-2 relaxation data). The robust least-squares optimization method was employed during fitting and full statistical analysis was employed to determine the most statistically upheld diffusion tensor model for a given ensemble member.

4.6. Estimations of Rotational Correlation Time

The rotational correlation time (τc), assuming a hydrated sphere, may be estimated through Stokes’ law [64]:
τc = (4πηrH3)/(3kBT)
where rH is the radius of hydration. For a hydrated protein, rH may be roughly estimated on the basis of the specific volume (υ = 0.73 cm3/g) as [65]:
rH = [3υMr/(4πNA)]1/3 + rw
where Mr is the molecular weight, NA is Avogadro’s number, and rw is radius of the hydration layer surrounding the protein (1.6–3.2 Å for ½-1 hydration shell [66]).
For direct comparison, the average ratios of T1/T2 (or T1′/T2′) for all residues with an NOE > 0.65 in a given protein were employed to estimate τc. Through neglecting of the high-frequency terms of the spectral density, the analysis of Kay et al. [27] may be simplified to:
τc = [1/(4πνN)] (6T1/T2 – 7)1/2
where νN is the resonance frequency of 15N (in Hz).
HYDROPRO [55] was also used to estimate ensemble-averaged τc values based upon the NMR-derived structural ensemble for W1 (PDB entry 2MU3) and the W2 ensemble inferred on the basis of concatenated NMR-derived restraints for W1 [19]. The resulting output was parsed for τc (harmonic mean (correlation) time) as calculated on the basis of the combined input of temperature, solvent viscosity, molecular weight, solute partial specific volume, solution density, and PDB structural coordinates. For comparison, calculations were carried out for W1 structural ensembles truncated using an in-house Tcl/Tk script to the globular core (residues 12–149) or the globular core excluding both the turn between helices 4 and 5 and helix 5 (residues 12–128).

4.7. Statistical Tests

Statistical analyses were performed between units and protein regions as described above to evaluate significance between means through ordinary one-way ANOVA test when comparing 3 or more means or unpaired two tailed t-test with Welch’s correction for unequal variances when comparing two means within the Prism 6 or InStat software packages (both from GraphPad Software Inc., La Jolla, CA, USA). All distributions were assumed to be Gaussian. Unless otherwise noted, significance was determined at an α of 0.05.

5. Conclusions

The core repetitive domain of AcSp1 is composed of concatenated 200 amino acid units, identical in sequence and very similar in tertiary structuring and internal motions. Through split intein-mediated trans-splicing, individual repeat units were selectively isotope-enriched and investigated in the context of the W2 protein capable of fibrillogenesis. Intein-mediated segmental-labelling is also highly promising for future studies of other modular proteins, whereby spectral complexity can be reduced without compromising the functional state of the protein. Backbone-level dynamics very clearly demonstrate the beads-on-a-string conformation of the AcSp1 repetitive domain, with structured globular domains linked by lengthy intrinsically-disordered segments forming a relatively viscous solubilized state. Although our previous translational diffusion studies imply that the linker is not highly extended, with W2 and W3 exhibiting relatively compact conformations, the 15N spin relaxation behaviour detailed herein demonstrate that each globular domain in W2 tumbles nearly independently of its neighbour. Regardless of the construct examined, helix 5 also exhibited elevated high-frequency dynamics relative to the remainder of the globular core. Rotational diffusion behaviour of W1 is also most consistent with a W unit globular core where helix 5 is not stably attached. Unambiguous measurement of backbone dynamics, therefore, improves our understanding of both AcSp1 repetitive domain modularity and allow direct demonstration of variations in localized stability that were implied by titration with chaotropes and detergent.

Acknowledgments

Thanks to Bruce Stewart for expert technical assistance; Leo Spyracopoulos for helpful discussions; and, Ian Burton, Nadine Merkley, and Ray Syvitski for 16.4 T NMR spectrometer support at the National Research Council Biological Magnetic Resonance Facility (NRC-BMRF, Halifax, NS, Canada) accessed through Dalhousie’s Nuclear Magnetic Resonance Resource (NMR3). This work was supported by Discovery Grants from the Natural Sciences and Engineering Research Council of Canada (NSERC; RGPIN/342034-2012 to Jan K. Rainey and RGPIN/41823-2015 to Xiang-Qin Liu); key infrastructure was provided through NSERC Research Tools and Instruments Grants and a Leaders Opportunity Fund award from the Canadian Foundation for Innovation (to Jan K. Rainey); and, a Dalhousie Medical Research Foundation Capital Equipment Grant (to Jan K. Rainey and Xiang-Qin Liu). The TCI probe for the 16.4 T NMR spectrometer at the NRC-BMRF were provided by Dalhousie University through an Atlantic Canada Opportunities Agency Grant. Jan K. Rainey is supported by a Canadian Institutes for Health Research New Investigator Award and Marie-Laurence Tremblay was supported by an NSERC Doctoral Postgraduate Scholarship.

Author Contributions

Xiang-Qin Liu and Jan K. Rainey conceived the research; Lingling Xu and Marie-Laurence Tremblay prepared protein samples; Marie-Laurence Tremblay, Muzaddid Sarker and Jan K. Rainey acquired experimental data; Marie-Laurence Tremblay, Lingling Xu, Muzaddid Sarker, Xiang-Qin Liu and Jan K. Rainey analyzed experimental data; Jan K. Rainey and Marie-Laurence Tremblay wrote the manuscript; all authors edited and commented on the manuscript.

Conflicts of Interest

The authors declare no conflict of interest.

References

  1. Lewis, R.V. Spider silk: Ancient ideas for new biomaterials. Chem. Rev. 2006, 106, 3762–3774. [Google Scholar] [CrossRef] [PubMed]
  2. Yigit, S.; Dinjaski, N.; Kaplan, D.L. Fibrous proteins: At the crossroads of genetic engineering and biotechnological applications. Biotechnol. Bioeng. 2016, 113, 913–929. [Google Scholar] [CrossRef] [PubMed]
  3. Zhou, C.Z.; Confalonieri, F.; Medina, N.; Zivanovic, Y.; Esnault, C.; Yang, T.; Jacquet, M.; Janin, J.; Duguet, M.; Perasso, R.; et al. Fine organization of Bombyx mori fibroin heavy chain gene. Nucleic Acids Res. 2000, 28, 2413–2419. [Google Scholar] [CrossRef] [PubMed]
  4. Hayashi, C.Y.; Blackledge, T.A.; Lewis, R.V. Molecular and mechanical characterization of aciniform silk: Uniformity of iterated sequence modules in a novel member of the spider silk fibroin gene family. Mol. Biol. Evol. 2004, 21, 1950–1959. [Google Scholar] [CrossRef] [PubMed]
  5. Pickford, A.R.; Campbell, I.D. NMR studies of modular protein structures and their interactions. Chem. Rev. 2004, 104, 3557–3566. [Google Scholar] [CrossRef] [PubMed]
  6. Han, J.H.; Batey, S.; Nickson, A.A.; Teichmann, S.A.; Clarke, J. The folding and evolution of multidomain proteins. Nat. Rev. Mol. Cell Biol. 2007, 8, 319–330. [Google Scholar] [CrossRef] [PubMed]
  7. Levitt, M. Nature of the protein universe. Proc. Natl. Acad. Sci. USA 2009, 106, 11079–11084. [Google Scholar] [CrossRef] [PubMed]
  8. Frueh, D.P.; Goodrich, A.C.; Mishra, S.H.; Nichols, S.R. NMR methods for structural studies of large monomeric and multimeric proteins. Curr. Opin. Struct. Biol. 2013, 23, 734–739. [Google Scholar] [CrossRef] [PubMed]
  9. Ravera, E.; Salmon, L.; Fragai, M.; Parigi, G.; Al-Hashimi, H.; Luchinat, C. Insights into domain-domain motions in proteins and RNA from solution NMR. Acc. Chem. Res. 2014, 47, 3118–3126. [Google Scholar] [CrossRef] [PubMed]
  10. Kikhney, A.G.; Svergun, D.I. A practical guide to small angle X-ray scattering (SAXS) of flexible and intrinsically disordered proteins. FEBS Lett. 2015, 589, 2570–2577. [Google Scholar] [CrossRef] [PubMed]
  11. Smith, J.L.; Skiniotis, G.; Sherman, D.H. Architecture of the polyketide synthase module: surprises from electron cryo-microscopy. Curr. Opin. Struct. Biol. 2015, 31, 9–19. [Google Scholar] [CrossRef] [PubMed]
  12. Maciejewski, M.; Barlow, P.N.; Tjandra, N. Decoding the components of dynamics in three-domain proteins. J. Comput. Chem. 2014, 35, 518–525. [Google Scholar] [CrossRef] [PubMed]
  13. Ryabov, Y.E.; Fushman, D. A model of interdomain mobility in a multidomain protein. J. Am. Chem. Soc. 2007, 129, 3315–3327. [Google Scholar] [CrossRef] [PubMed]
  14. Wagner, M.J.; Stacey, M.M.; Liu, B.A.; Pawson, T. Molecular mechanisms of SH2- and PTB-domain-containing proteins in receptor tyrosine kinase signaling. Cold Spring Harb. Perspect. Biol. 2013, 5, a008987. [Google Scholar] [CrossRef] [PubMed]
  15. Horn, A.H.; Sticht, H. Synthetic protein scaffolds based on peptide motifs and cognate adaptor domains for improving metabolic broductivity. Front. Bioeng. Biotechnol. 2015, 3, 191. [Google Scholar] [CrossRef] [PubMed]
  16. Castaneda, C.A.; Spasser, L.; Bavikar, S.N.; Brik, A.; Fushman, D. Segmental isotopic labeling of ubiquitin chains to unravel monomer-specific molecular behavior. Angew. Chem. Int. Ed. 2011, 50, 11210–11214. [Google Scholar] [CrossRef] [PubMed]
  17. Fushman, D.; Varadan, R.; Assfalg, M.; Walker, O. Determining domain orientation in macromolecules by using spin-relaxation and residual dipolar coupling measurements. Prog. Nucl. Magn. Reson. Spectrosc. 2004, 44, 189–214. [Google Scholar] [CrossRef]
  18. Walsh, J.D.; Meier, K.; Ishima, R.; Gronenborn, A.M. NMR studies on domain diffusion and alignment in modular GB1 repeats. Biophys. J. 2010, 99, 2636–2646. [Google Scholar] [CrossRef] [PubMed]
  19. Tremblay, M.L.; Xu, L.; Lefevre, T.; Sarker, M.; Orrell, K.E.; Leclerc, J.; Meng, Q.; Pezolet, M.; Auger, M.; Liu, X.Q.; et al. Spider wrapping silk fibre architecture arising from its modular soluble protein precursor. Sci. Rep. 2015. [Google Scholar] [CrossRef] [PubMed]
  20. Xu, L.; Rainey, J.K.; Meng, Q.; Liu, X.Q. Recombinant minimalist spider wrapping silk proteins capable of native-like fiber formation. PLoS ONE 2012, 7, e50227. [Google Scholar] [CrossRef] [PubMed]
  21. Lefèvre, T.; Boudreault, S.; Cloutier, C.; Pezolet, M. Diversity of molecular transformations involved in the formation of spider silks. J. Mol. Biol. 2011, 405, 238–253. [Google Scholar] [CrossRef] [PubMed]
  22. Sarker, M.; Orrell, K.E.; Xu, L.; Tremblay, M.L.; Bak, J.J.; Liu, X.Q.; Rainey, J.K. Tracking transitions in spider wrapping silk conformation and dynamics by 19F nuclear magnetic resonance spectroscopy. Biochemistry 2016, 55, 3048–3059. [Google Scholar] [CrossRef] [PubMed]
  23. Mita, K.; Ichimura, S.; James, T.C. Highly repetitive structure and its organization of the silk fibroin gene. J. Mol. Evol. 1994, 38, 583–592. [Google Scholar] [CrossRef] [PubMed]
  24. Weatherbee-Martin, N.; Xu, L.; Hupe, A.; Kreplak, L.; Fudge, D.S.; Liu, X.Q.; Rainey, J.K. Identification of wet-spinning and post-spin stretching methods amenable to recombinant spider aciniform silk. Biomacromolecules 2016, 17, 2737–2746. [Google Scholar] [CrossRef] [PubMed]
  25. Wang, S.; Ladizhansky, V. Recent advances in magic angle spinning solid state NMR of membrane proteins. Prog. Nucl. Magn. Reson. Spectrosc. 2014, 82, 1–26. [Google Scholar] [CrossRef] [PubMed]
  26. Ortega, G.; Pons, M.; Millet, O. Protein functional dynamics in multiple timescales as studied by NMR spectroscopy. Adv. Protein Chem. Struct. Biol. 2013, 92, 219–251. [Google Scholar] [PubMed]
  27. Kay, L.E.; Torchia, D.A.; Bax, A. Backbone dynamics of proteins as studied by 15N inverse detected heteronuclear NMR spectroscopy: application to staphylococcal nuclease. Biochemistry 1989, 28, 8972–8979. [Google Scholar] [CrossRef] [PubMed]
  28. Lipari, G.; Szabo, A. Model-free approach to the interpretation of nuclear magnetic resonance relaxation in macromolecules. 1. Theory and range of validity. J. Am. Chem. Soc. 1982, 104, 4546–4559. [Google Scholar] [CrossRef]
  29. Clore, G.M.; Szabo, A.; Bax, A.; Kay, L.E.; Driscoll, P.C.; Gronenborn, A.M. Deviations from the simple 2-parameter model-free approach to the interpretation of N-15 nuclear magnetic relaxation of proteins. J. Am. Chem. Soc. 1990, 112, 4989–4991. [Google Scholar] [CrossRef]
  30. Farrow, N.A.; Zhang, O.; Szabo, A.; Torchia, D.A.; Kay, L.E. Spectral density function mapping using 15N relaxation data exclusively. J. Biomol. NMR 1995, 6, 153–162. [Google Scholar] [CrossRef] [PubMed]
  31. Skrisovska, L.; Schubert, M.; Allain, F.H. Recent advances in segmental isotope labeling of proteins: NMR applications to large proteins and glycoproteins. J. Biomol. NMR 2010, 46, 51–65. [Google Scholar] [CrossRef] [PubMed]
  32. Volkmann, G.; Iwai, H. Protein trans-splicing and its use in structural biology: Opportunities and limitations. Mol. Biosyst. 2010, 6, 2110–2121. [Google Scholar] [CrossRef] [PubMed]
  33. Vila-Perello, M.; Muir, T.W. Biological applications of protein splicing. Cell 2010, 143, 191–200. [Google Scholar] [CrossRef] [PubMed]
  34. Evans, T.C., Jr.; Martin, D.; Kolly, R.; Panne, D.; Sun, L.; Ghosh, I.; Chen, L.; Benner, J.; Liu, X.Q.; Xu, M.Q. Protein trans-splicing and cyclization by a naturally split intein from the dnaE gene of Synechocystis species PCC6803. J. Biol. Chem. 2000, 275, 9091–9094. [Google Scholar] [CrossRef] [PubMed]
  35. Scott, C.P.; Abel-Santos, E.; Wall, M.; Wahnon, D.C.; Benkovic, S.J. Production of cyclic peptides and proteins in vivo. Proc. Natl. Acad. Sci. USA 1999, 96, 13638–13643. [Google Scholar] [CrossRef] [PubMed]
  36. Volkmann, G.; Murphy, P.W.; Rowland, E.E.; Cronan, J.E., Jr.; Liu, X.Q.; Blouin, C.; Byers, D.M. Intein-mediated cyclization of bacterial acyl carrier protein stabilizes its folded conformation but does not abolish function. J. Biol. Chem. 2010, 285, 8605–8614. [Google Scholar] [CrossRef] [PubMed]
  37. Buskirk, A.R.; Ong, Y.C.; Gartner, Z.J.; Liu, D.R. Directed evolution of ligand dependence: small-molecule-activated protein splicing. Proc. Natl. Acad. Sci. USA 2004, 101, 10505–10510. [Google Scholar] [CrossRef] [PubMed]
  38. Kanwar, M.; Wright, R.C.; Date, A.; Tullman, J.; Ostermeier, M. Protein switch engineering by domain insertion. Methods Enzymol. 2013, 523, 369–388. [Google Scholar] [PubMed]
  39. Mootz, H.D.; Blum, E.S.; Tyszkiewicz, A.B.; Muir, T.W. Conditional protein splicing: a new tool to control protein structure and function in vitro and in vivo. J. Am. Chem. Soc. 2003, 125, 10561–10569. [Google Scholar] [CrossRef] [PubMed]
  40. Ozawa, T.; Kaihara, A.; Sato, M.; Tachihara, K.; Umezawa, Y. Split luciferase as an optical probe for detecting protein-protein interactions in mammalian cells based on protein splicing. Anal. Chem. 2001, 73, 2516–2521. [Google Scholar] [CrossRef] [PubMed]
  41. De Rosa, L.; Russomanno, A.; Romanelli, A.; D’Andrea, L.D. Semi-synthesis of labeled proteins for spectroscopic applications. Molecules 2013, 18, 440–465. [Google Scholar] [CrossRef] [PubMed]
  42. Giriat, I.; Muir, T.W. Protein semi-synthesis in living cells. J. Am. Chem. Soc. 2003, 125, 7180–7181. [Google Scholar] [CrossRef] [PubMed]
  43. Muir, T.W. Studying protein structure and function using semisynthesis. Biopolymers 2008, 90, 743–750. [Google Scholar] [CrossRef] [PubMed]
  44. Buchinger, E.; Aachmann, F.L.; Aranko, A.S.; Valla, S.; Skjak-Braek, G.; Iwai, H.; Wimmer, R. Use of protein trans-splicing to produce active and segmentally 2H, 15N labeled mannuronan C5-epimerase AlgE4. Protein Sci. 2010, 19, 1534–1543. [Google Scholar] [CrossRef] [PubMed]
  45. Busche, A.E.; Aranko, A.S.; Talebzadeh-Farooji, M.; Bernhard, F.; Dotsch, V.; Iwai, H. Segmental isotopic labeling of a central domain in a multidomain protein by protein trans-splicing using only one robust DnaE intein. Angew. Chem. Int. Ed. 2009, 48, 6128–6131. [Google Scholar] [CrossRef] [PubMed]
  46. Muona, M.; Aranko, A.S.; Iwai, H. Segmental isotopic labelling of a multidomain protein by protein ligation by protein trans-splicing. ChemBioChem 2008, 9, 2958–2961. [Google Scholar] [CrossRef] [PubMed]
  47. Otomo, T.; Teruya, K.; Uegaki, K.; Yamazaki, T.; Kyogoku, Y. Improved segmental isotope labeling of proteins and application to a larger protein. J. Biomol. NMR 1999, 14, 105–114. [Google Scholar] [CrossRef] [PubMed]
  48. Yamazaki, T.; Otomo, T.; Oda, N.; Kyogoku, Y.; Uegaki, K.; Ito, N.; Ishino, Y.; Nakamura, H. Segmental isotope labeling for protein NMR using peptide splicing. J. Am. Chem. Soc. 1998, 120, 5591–5592. [Google Scholar] [CrossRef]
  49. Southworth, M.W.; Adam, E.; Panne, D.; Byer, R.; Kautz, R.; Perler, F.B. Control of protein splicing by intein fragment reassembly. EMBO J. 1998, 17, 918–926. [Google Scholar] [CrossRef] [PubMed]
  50. Wu, H.; Hu, Z.; Liu, X.Q. Protein trans-splicing by a split intein encoded in a split DnaE gene of Synechocystis sp. PCC6803. Proc. Natl. Acad. Sci. USA 1998, 95, 9226–9231. [Google Scholar] [CrossRef] [PubMed]
  51. Spyracopoulos, L. A suite of Mathematica notebooks for the analysis of protein main chain 15N NMR relaxation data. J. Biomol. NMR 2006, 36, 215–224. [Google Scholar] [CrossRef] [PubMed]
  52. Kaderavek, P.; Zapletal, V.; Rabatinova, A.; Krasny, L.; Sklenar, V.; Zidek, L. Spectral density mapping protocols for analysis of molecular motions in disordered proteins. J. Biomol. NMR 2014, 58, 193–207. [Google Scholar] [CrossRef] [PubMed]
  53. Tjandra, N.; Feller, S.E.; Pastor, R.W.; Bax, A. Rotational diffusion anisotropy of human ubiquitin from 15N NMR relaxation. J. Am. Chem. Soc. 1995, 117, 12562–12566. [Google Scholar] [CrossRef]
  54. Walker, O.; Varadan, R.; Fushman, D. Efficient and accurate determination of the overall rotational diffusion tensor of a molecule from 15N relaxation data using computer program ROTDIF. J. Magn. Reson. 2004, 168, 336–345. [Google Scholar] [CrossRef] [PubMed]
  55. Ortega, A.; Amoros, D.; Garcia de la Torre, J. Prediction of hydrodynamic and other solution properties of rigid proteins from atomic- and residue-level models. Biophys. J. 2011, 101, 892–898. [Google Scholar] [CrossRef] [PubMed]
  56. Jones, J.A.; Wilkins, D.K.; Smith, L.J.; Dobson, C.M. Characterisation of protein unfolding by NMR diffusion measurements. J. Biomol. NMR 1997, 10, 199–203. [Google Scholar] [CrossRef]
  57. Chaw, R.C.; Zhao, Y.; Wei, J.; Ayoub, N.A.; Allen, R.; Atrushi, K.; Hayashi, C.Y. Intragenic homogenization and multiple copies of prey-wrapping silk genes in Argiope garden spiders. BMC Evol. Biol. 2014. [Google Scholar] [CrossRef] [PubMed]
  58. Cho, C.H.; Urquidi, J.; Singh, S.; Robinson, G.W. Thermal offset viscosities of liquid H2O, D2O, and T2O. J. Phys. Chem. B 1999, 103, 1991–1994. [Google Scholar] [CrossRef]
  59. Xu, L.; Tremblay, M.L.; Orrell, K.E.; Leclerc, J.; Meng, Q.; Liu, X.Q.; Rainey, J.K. Nanoparticle self-assembly by a highly stable recombinant spider wrapping silk protein subunit. FEBS Lett. 2013, 587, 3273–3280. [Google Scholar] [CrossRef] [PubMed]
  60. Halle, B.; Davidovic, M. Biomolecular hydration: from water dynamics to hydrodynamics. Proc. Natl. Acad. Sci. USA 2003, 100, 12135–12140. [Google Scholar] [CrossRef] [PubMed]
  61. Bae, S.H.; Dyson, H.J.; Wright, P.E. Prediction of the rotational tumbling time for proteins with disordered segments. J. Am. Chem. Soc. 2009, 131, 6814–6821. [Google Scholar] [CrossRef] [PubMed]
  62. Rezaei-Ghaleh, N.; Klama, F.; Munari, F.; Zweckstetter, M. Predicting the rotational tumbling of dynamic multidomain proteins and supramolecular complexes. Angew. Chem. Int. Ed. 2013, 52, 11410–11414. [Google Scholar] [CrossRef] [PubMed]
  63. Xu, L.; Tremblay, M.L.; Meng, Q.; Liu, X.Q.; Rainey, J.K. 1H, 13C and 15N NMR assignments of the aciniform spidroin (AcSp1) repetitive domain of Argiope trifasciata wrapping silk. Biomol. NMR Assign. 2012, 6, 147–151. [Google Scholar] [CrossRef] [PubMed]
  64. Cantor, C.R.; Schimmel, P.R. Techniques for the study of biological structure and function. In Biophysical Chemistry; W.H. Freeman and Company: San Francisco, CA, USA, 1980; Volume 2, pp. 549–570. [Google Scholar]
  65. Cavanagh, J.; Fairbrother, W.J.; Palmer, A.G., III; Skelton, N.J. Protein NMR Spectroscopy: Principles and Practice; Academic Press: San Diego, CA, USA, 1996; pp. 16–18. [Google Scholar]
  66. Venable, R.M.; Pastor, R.W. Frictional models for stochastic simulations of proteins. Biopolymers 1988, 27, 1001–1014. [Google Scholar] [CrossRef] [PubMed]
Figure 1. 15N spin relaxation parameters as a function of residue at 16.4 T for W1, W2-1, and W2-2. Analysis and error propagation were carried out using Mathematica notebooks from Leo Spyracopoulos [51]. The secondary structuring of the W unit is depicted on the basis of PDB entry 2MU3 [19], with grey shading for each helical segment.
Ijms 17 01305 g001
Figure 2. Bar graphs representing the mean T1 and T2 (error bars: standard deviations) for key regions of the W unit. These were specifically defined as the core (residues 12–149 (W1, W2-1) and 212–349 (W2-2)), linker (residues 150–211 from W2-1 and W2-2), tails (W1: residues 1–11 and 150–199; W2: residues 1–11 and 350–400), and helix 5 (residues 135–149 (W1, W2-1) and 335–349 (W2-2)).
Ijms 17 01305 g002
Figure 3. 15N reduced spectral density mapping [30] at 16.4 T as a function of residue for W1, W2-1, and W2-2. Analysis and error propagation were carried out using Mathematica notebooks from Leo Spyracopoulos [51].
Ijms 17 01305 g003
Figure 4. Bar graphs representing the mean J(0), JN), and J(0.87ωH) (error bars: standard deviation) over key W unit regions. These were specifically defined as the core (residues 12–149 (W1, W2-1) and 212–349 (W2-2)), linker (residues 150–211 from W2-1 and W2-2), tails (W1: residues 1–11 and 150–199; W2: residues 1–11 and 350–400), and helix 5 (residues 135–149 (W1, W2-1) and 335–349 (W2-2)).
Ijms 17 01305 g004
Figure 5. Inverse of ρ ratio of T1’ to T2’ (relaxation times modified to remove high-frequency components of spectral density) as defined by Fushman et al. [17]. (A) Plotted as a function of residue (green circles: W1; blue triangles: W2-1, red squares: W2-2) with secondary structuring of the W unit depicted on the basis of PDB entry 2MU3 [19] using grey shading to delineate each helical segment (B) bar graphs for mean (green: W1; blue: W2-1, red: W2-2; error bars: standard deviation) over key W unit regions. These were specifically defined as the core (residues 12–149 (W1, W2-1) and 212–349 (W2-2)), linker (residues 150–211 from W2-1 and W2-2), tails (W1: residues 1–11 and 150–199; W2: residues 1–11 and 350–400), and helix 5 (residues 135–149 (W1, W2-1) and 335–349 (W2-2)); and (C) plotted for W1 on the lowest-energy NMR ensemble member of PDB entry 2MU3 [19], with both backbone thickness and colour varied as a function of 1/ρ, as indicated.
Ijms 17 01305 g005
Table 1. Rotational diffusion tensor parameters that best fit indicated 15N spin relaxation data set.
Protein 1N–H Bonds 2D (×10−7 s−1)D|| (×10−7 s−1)Anisotropyα (°)β (°)τc (ns)χ2/df 3
W11022.01 ± 0.052.30 ± 0.081.14 ± 0.1713 ± 5243 ± 197.91 ± 0.031.409
W2-11041.82 ± 0.071.93 ± 0.041.06 ± 0.13164 ± 87138 ± 208.98 ± 0.031.889
W2-2931.78 ± 0.031.63 ± 0.030.92 ± 0.0977 ± 37155 ± 109.65 ± 0.041.906
W21971.87 ± 0.041.68 ± 0.040.90 ± 0.1126 ± 3120 ± 229.24 ± 0.052.309
1 Diffusion tensor detailed for lowest-energy member of the W1 structural ensemble (PDB entry 2MU3 [19]) for W1, W2-1, and W2-2; and, for member of inferred [19] W2 structural ensemble with radius-of-gyration closest to that determined by diffusion ordered NMR spectroscopy for W2; 2 Residues having [1H]-15N NOE > 0.65 used in ROTDIF [54] fit; 3 df: degrees of freedom (equivalent to number of N–H bonds).
Table 2. Rotational correlation time (τc) for indicated protein according to given method.
Proteinη (cP) 1τc (ns)
Stokes (Ideal) 2Stokes (DOSY) 3Structure 4T1/T2 5T1′/T25ROTDIF 6
W11.0407.8–9.910.614.1 ± 0.3 7
9.4 ± 0.2 8
8.4 ± 0.1 9
7.98.07.9 ± 0.01
W2-11.056---9.09.19.0 ± 0.01
W2-21.056---9.59.69.6 ± 0.01
W21.05614.7–17.819.731.8 ± 0.79.39.49.3 ± 0.03
1 Viscosities determined using dioxane internal standard by DOSY (Equation (4)); 2 Calculated using Stokes’ law (Equation (5)) for a 100% 15N/13C-enriched protein mass using a hydration shell of either 1.6 Å (lower estimate) or 3.2 Å (upper estimate), assuming spherical shape (Equation (6)); 3 Calculated using Stokes’ law (Equation (5)) based upon hydrodynamic radii determined by DOSY [19]; 4 Average ± average deviation of HYDROPRO [55] predicted τc over 20-member ensembles of structures of W1 or W2 [19], or over globular core of W1; 5 Determined based upon indicated relaxation time constant ratio using Equation (7); 6 Average ± average deviation over all 20 structural ensemble members determined through axially-symmetric diffusion tensor ROTDIF in identical manner to Table 1; 7 Entire W1 structure; 8 Globular core (residues 12–149); and, 9 Globular core excluding helix 5 (residues 12–128).

