
Correlation between Gene Expression and Osteoarthritis Progression in Human


Abstract
:1. Introduction
2. Results
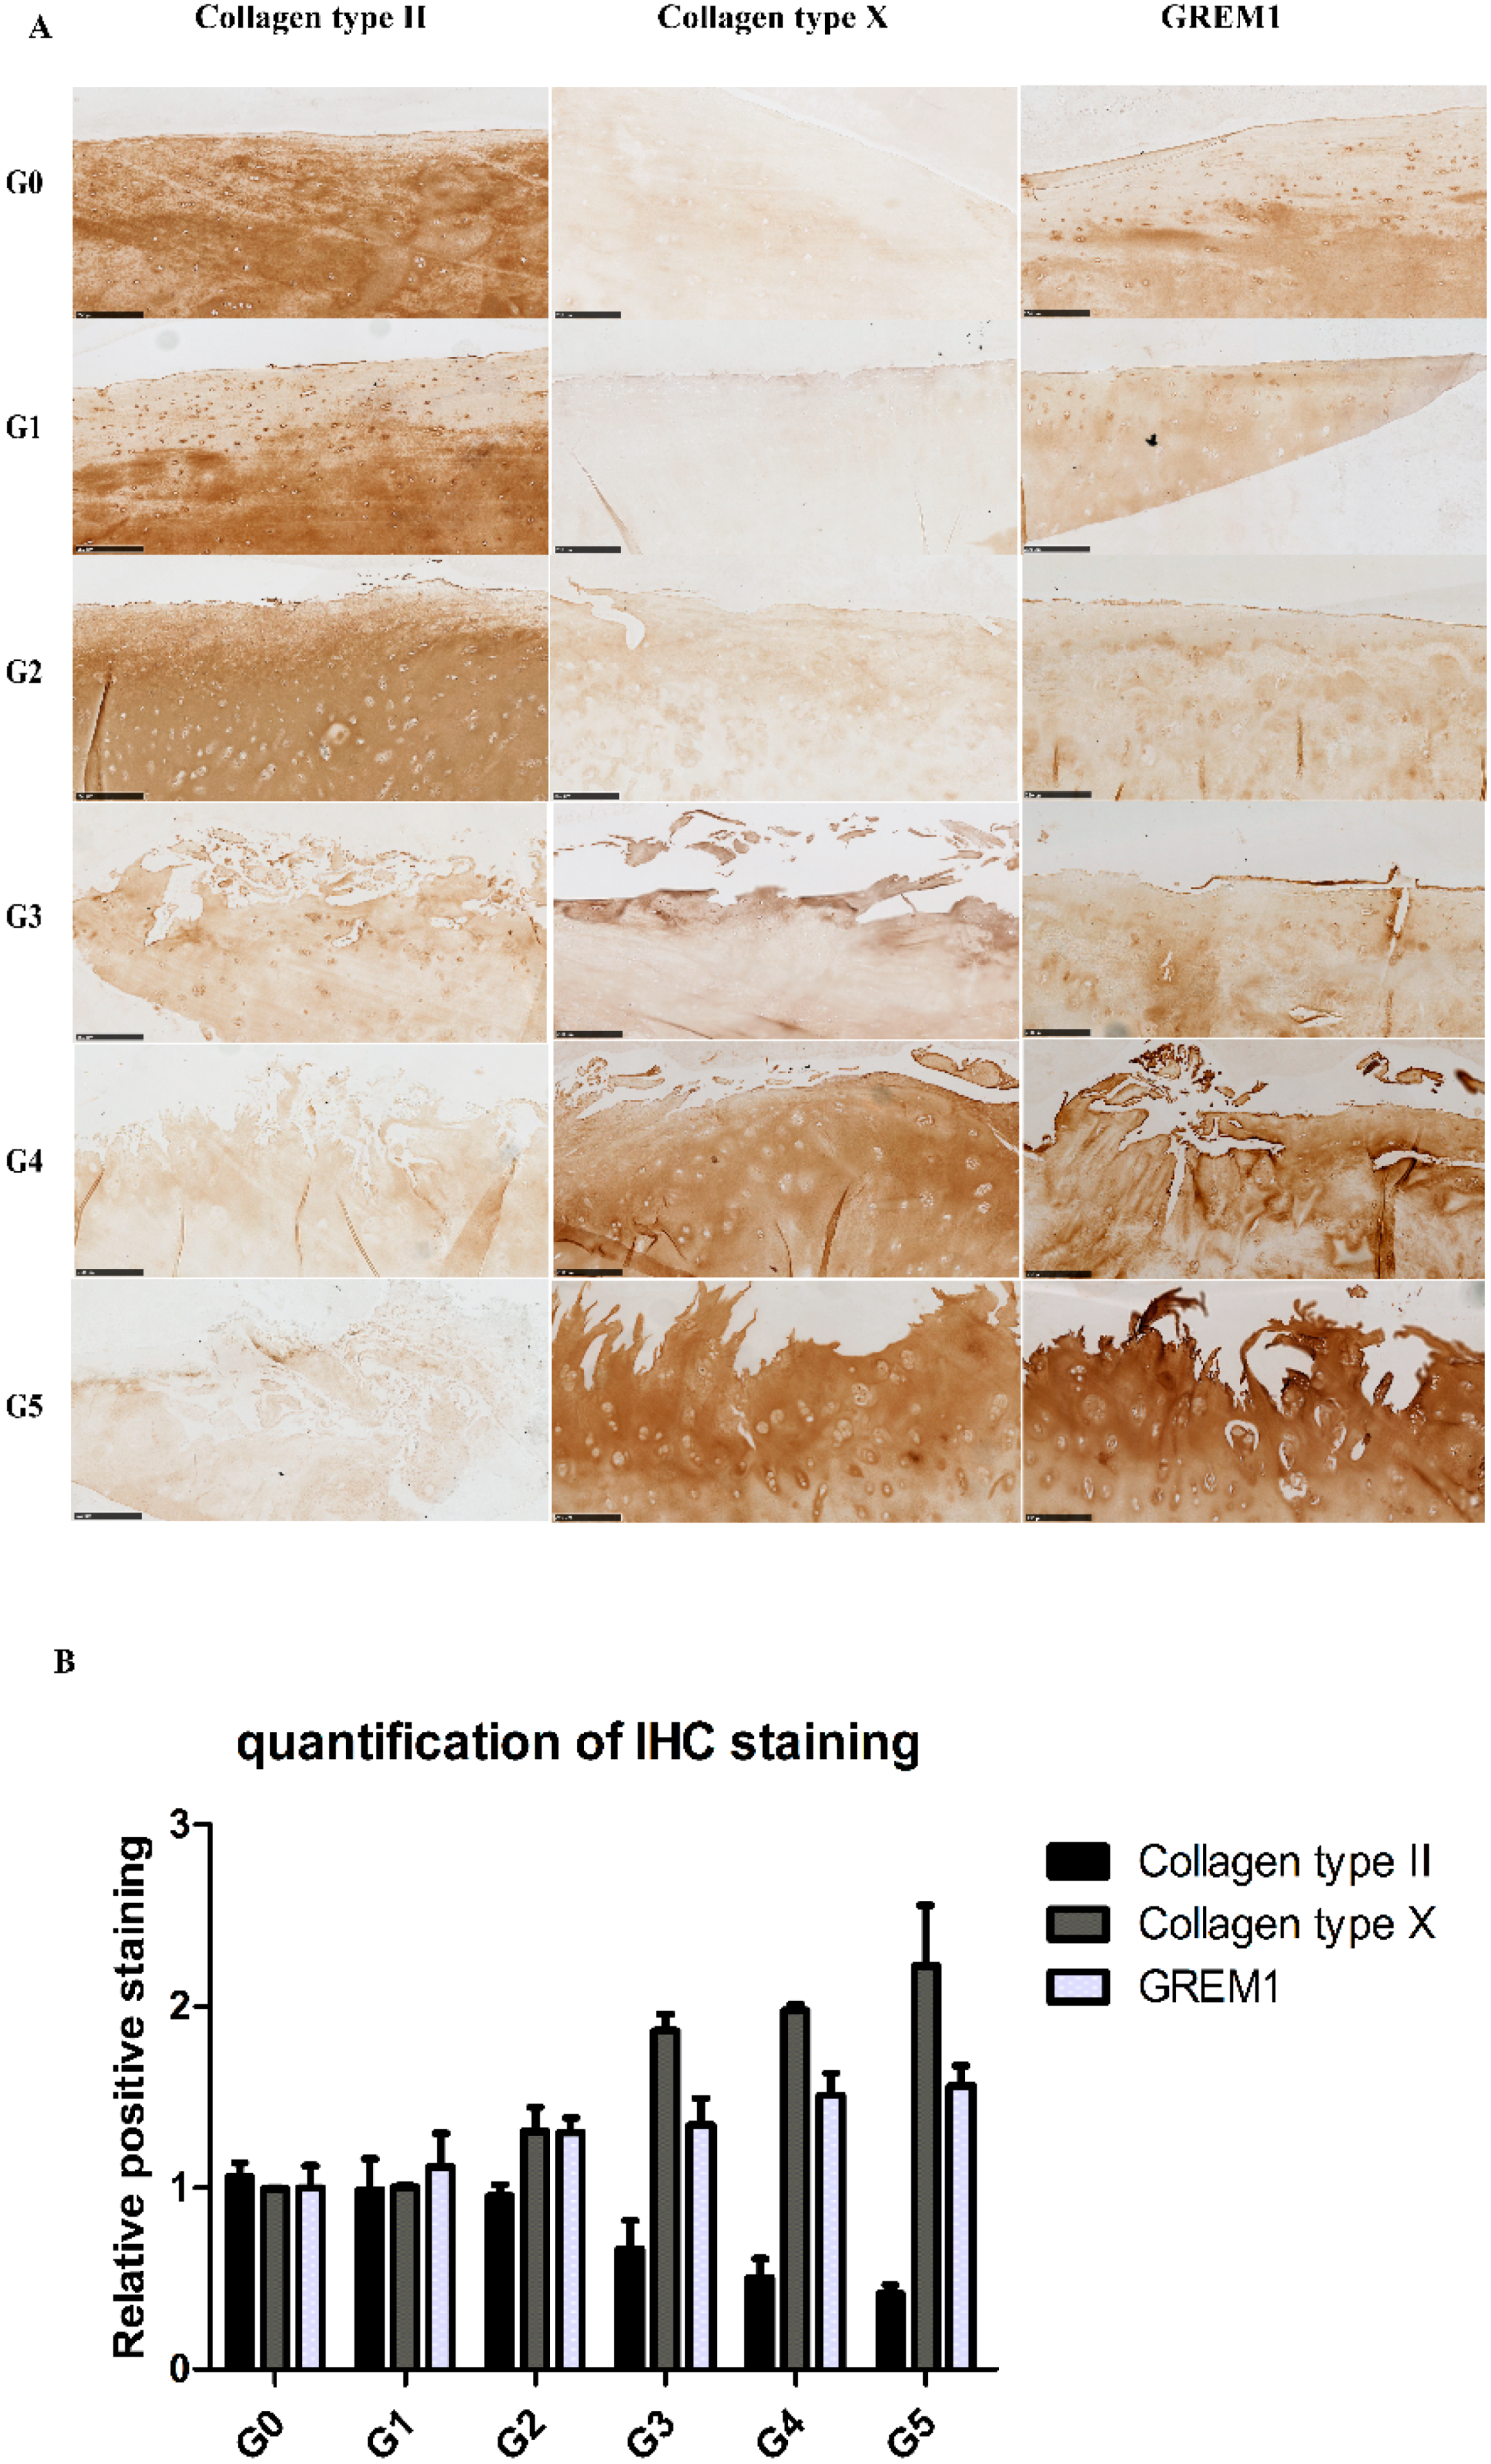
2.1. During OA Progression, the Expression of COL2A1 Decreases, while the Expression of GREM1 and COL10A1 Increases
2.2. Gene Expression Profiles in Cartilage at Different Stages
2.3. Correlation between Gene Expression and the Severity of OA
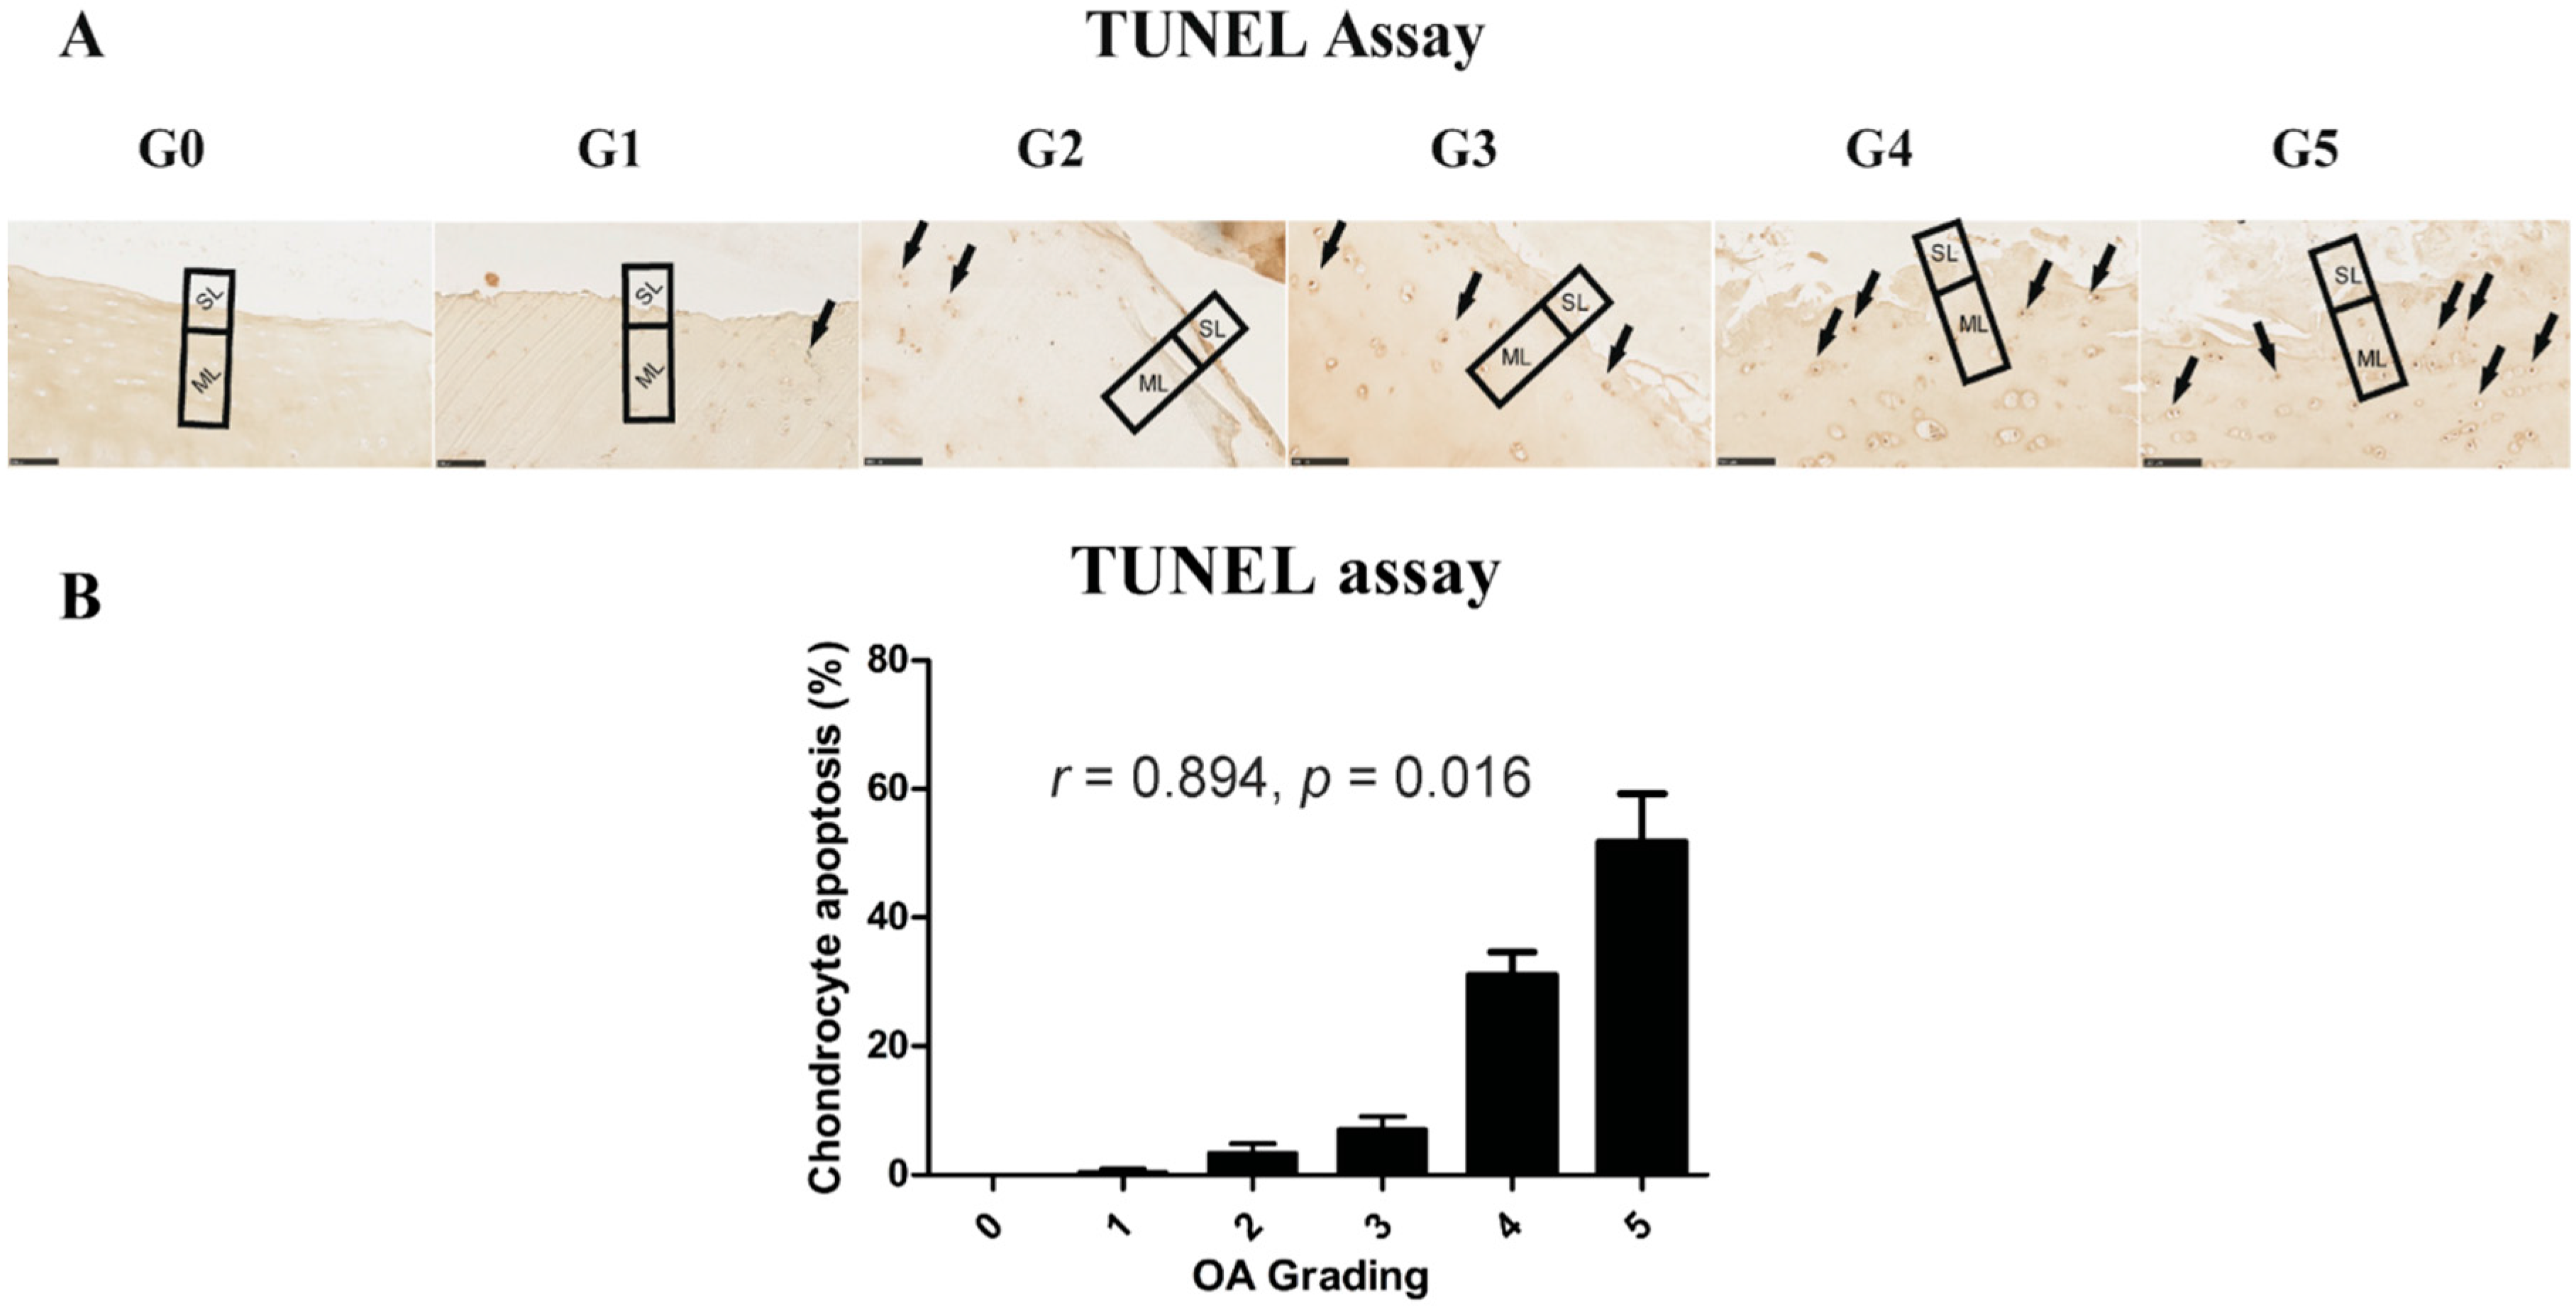
2.4. Chondrocyte Apoptosis Is Associated with the Severity of OA
3. Discussion
4. Materials and Methods
4.1. Cartilage Samples Collection
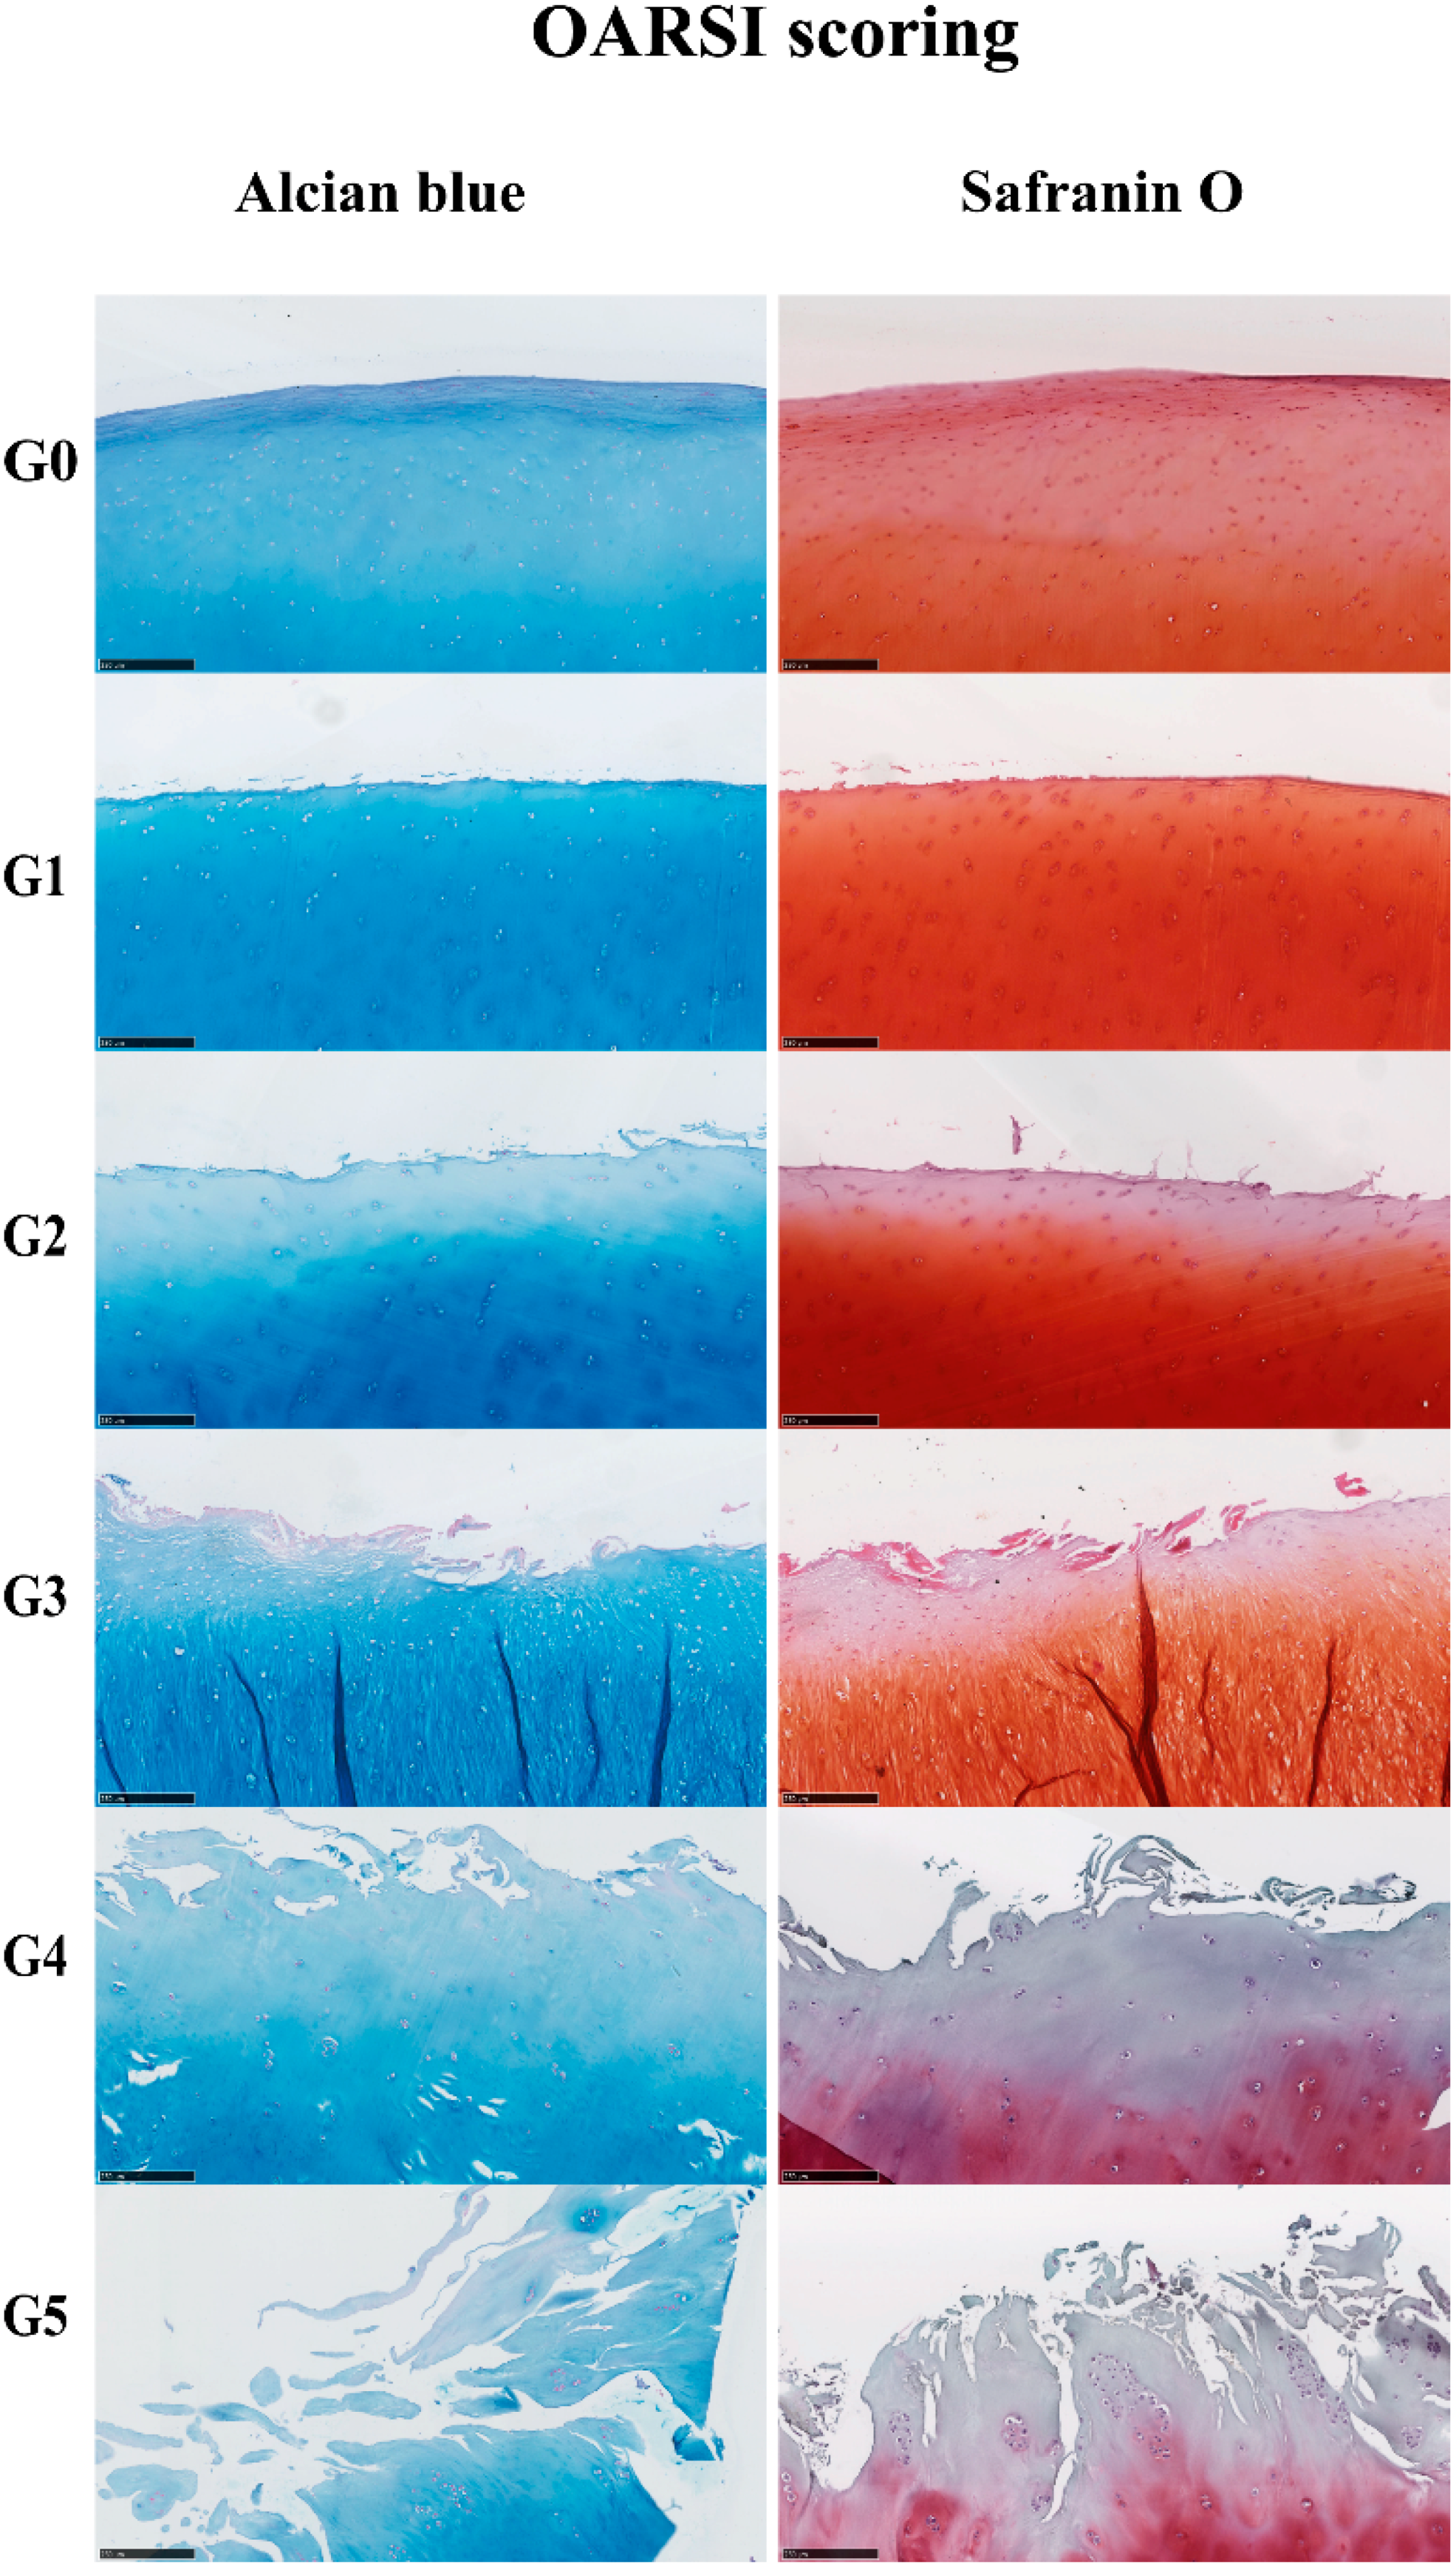
4.2. Histological Analysis
4.3. Safranin O and Alcian Blue Staining
4.4. Immunohistochemistry
4.5. RNA Isolation and qPCR
4.6. Apoptosis Assay
4.7. Statistical Analysis
5. Conclusions
Supplementary Materials
Acknowledgments
Author Contributions
Conflicts of Interest
References
- Felson, D.T.; Zhang, Y.; Hannan, M.T.; Naimark, A.; Weissman, B.N.; Aliabadi, P.; Levy, D. The incidence and natural history of knee osteoarthritis in the elderly. The Framingham Osteoarthritis Study. Arthritis Rheum. 1995, 38, 1500–1505. [Google Scholar] [CrossRef] [PubMed]
- Goldring, M.B.; Goldring, S.R. Osteoarthritis. J. Cell. Physiol. 2007, 213, 626–634. [Google Scholar] [CrossRef] [PubMed]
- Altman, R.D.; Dean, D.D. Osteoarthritis research: Animal models. Semin. Arthritis Rheum. 1990, 19, 21–25. [Google Scholar] [CrossRef]
- Bendele, A.; McComb, J.; Gould, T.; McAbee, T.; Sennello, G.; Chlipala, E.; Guy, M. Animal models of arthritis: Relevance to human disease. Toxicol. Pathol. 1999, 27, 134–142. [Google Scholar] [CrossRef] [PubMed]
- Bendele, A.M. Animal models of osteoarthritis. J. Musculoskelet. Neuronal. Interact. 2001, 1, 363–376. [Google Scholar] [PubMed]
- Ramos, Y.F.; den Hollander, W.; Bovee, J.V.; Bomer, N.; van der Breggen, R.; Lakenberg, N.; Keurentjes, J.C.; Goeman, J.J.; Slagboom, P.E.; Nelissen, R.G.; et al. Genes involved in the osteoarthritis process identified through genome wide expression analysis in articular cartilage; the RAAK study. PLoS ONE 2014, 9, e103056. [Google Scholar] [CrossRef] [PubMed] [Green Version]
- Tardif, G.; Hum, D.; Pelletier, J.P.; Boileau, C.; Ranger, P.; Martel-Pelletier, J. Differential gene expression and regulation of the bone morphogenetic protein antagonists follistatin and gremlin in normal and osteoarthritic human chondrocytes and synovial fibroblasts. Semin. Arthritis Rheum. 2004, 50, 2521–2530. [Google Scholar] [CrossRef] [PubMed]
- Kim, K.I.; Park, Y.S.; Im, G.I. Changes in the epigenetic status of the SOX-9 promoter in human osteoarthritic cartilage. J. Bone Miner. Res. 2013, 28, 1050–1060. [Google Scholar] [CrossRef] [PubMed]
- Miosge, N.; Hartmann, M.; Maelicke, C.; Herken, R. Expression of collagen type I and type II in consecutive stages of human osteoarthritis. Histochem. Cell Biol. 2004, 122, 229–236. [Google Scholar] [CrossRef] [PubMed]
- Leijten, J.C.; Emons, J.; Sticht, C.; van Gool, S.; Decker, E.; Uitterlinden, A.; Rappold, G.; Hofman, A.; Rivadeneira, F.; Scherjon, S.; et al. Gremlin 1, frizzled-related protein, and Dkk-1 are key regulators of human articular cartilage homeostasis. Arthritis Rheum. 2012, 64, 3302–3312. [Google Scholar] [CrossRef] [PubMed]
- Leijten, J.; Georgi, N.; Moreira Teixeira, L.; van Blitterswijk, C.A.; Post, J.N.; Karperien, M. Metabolic programming of mesenchymal stromal cells by oxygen tension directs chondrogenic cell fate. Proc. Natl. Acad. Sci. USA 2014, 111, 13954–13959. [Google Scholar] [CrossRef] [PubMed]
- Enomoto, H.; Enomoto-Iwamoto, M.; Iwamoto, M.; Nomura, S.; Himeno, M.; Kitamura, Y.; Kishimoto, T.; Komori, T. Cbfa1 is a positive regulatory factor in chondrocyte maturation. J. Biol. Chem. 2000, 275, 8695–8702. [Google Scholar] [CrossRef] [PubMed]
- Orfanidou, T.; Iliopoulos, D.; Malizos, K.N.; Tsezou, A. Involvement of SOX9 and FGF-23 in RUNX2 regulation in osteoarthritic chondrocytes. J. Cell. Mol. Med. 2009, 13, 3186–3194. [Google Scholar] [CrossRef] [PubMed]
- Zheng, Q.; Zhou, G.; Morello, R.; Chen, Y.; Garcia-Rojas, X.; Lee, B. Type X collagen gene regulation by RUNX2 contributes directly to its hypertrophic chondrocyte-specific expression in vivo. J. Cell Biol. 2003, 162, 833–842. [Google Scholar] [CrossRef] [PubMed]
- Von der Mark, K.; Frischholz, S.; Aigner, T.; Beier, F.; Belke, J.; Erdmann, S.; Burkhardt, H. Upregulation of type X collagen expression in osteoarthritic cartilage. Acta Orthop. Scand. Suppl. 1995, 266, 125–129. [Google Scholar] [PubMed]
- Zhou, J.; Wei, X.; Wei, L. Indian hedgehog, a critical modulator in osteoarthritis, could be a potential therapeutic target for attenuating cartilage degeneration disease. Connect. Tissue Res. 2014, 55, 257–261. [Google Scholar] [CrossRef] [PubMed]
- Wei, F.; Zhou, J.; Wei, X.; Zhang, J.; Fleming, B.C.; Terek, R.; Pei, M.; Chen, Q.; Liu, T.; Wei, L. Activation of Indian hedgehog promotes chondrocyte hypertrophy and upregulation of MMP-13 in human osteoarthritic cartilage. Osteoarthr. Cartil. 2012, 20, 755–763. [Google Scholar] [CrossRef] [PubMed]
- Dell’Accio, F.; De Bari, C.; El Tawil, N.M.; Barone, F.; Mitsiadis, T.A.; O'Dowd, J.; Pitzalis, C. Activation of WNT and BMP signaling in adult human articular cartilage following mechanical injury. Arthritis Res. Ther. 2006, 8, R139. [Google Scholar] [CrossRef] [PubMed] [Green Version]
- Pritzker, K.P.; Gay, S.; Jimenez, S.A.; Ostergaard, K.; Pelletier, J.P.; Revell, P.A.; Salter, D.; van den Berg, W.B. Osteoarthritis cartilage histopathology: Grading and staging. Osteoarthr. Cartil. 2006, 14, 13–29. [Google Scholar] [CrossRef] [PubMed]
- Bi, W.; Deng, J.M.; Zhang, Z.; Behringer, R.R.; de Crombrugghe, B. SOX9 is required for cartilage formation. Nat. Genet. 1999, 22, 85–89. [Google Scholar] [PubMed]
- Zhao, Q.; Eberspaecher, H.; Lefebvre, V.; de Crombrugghe, B. Parallel expression of SOX9 and Col2a1 in cells undergoing chondrogenesis. Dev. Dyn. 1997, 209, 377–386. [Google Scholar] [CrossRef]
- Leijten, J.C.; Bos, S.D.; Landman, E.B.; Georgi, N.; Jahr, H.; Meulenbelt, I.; Post, J.N.; van Blitterswijk, C.A.; Karperien, M. GREM1, FRZB and DKK1 mRNA levels correlate with osteoarthritis and are regulated by osteoarthritis-associated factors. Arthritis Res. Ther. 2013, 15, R126. [Google Scholar] [CrossRef] [PubMed]
- Mariani, E.; Pulsatelli, L.; Facchini, A. Signaling pathways in cartilage repair. Int. J. Mol. Sci. 2014, 15, 8667–8698. [Google Scholar] [CrossRef] [PubMed]
- Almonte-Becerril, M.; Navarro-Garcia, F.; Gonzalez-Robles, A.; Vega-Lopez, M.A.; Lavalle, C.; Kouri, J.B. Cell death of chondrocytes is a combination between apoptosis and autophagy during the pathogenesis of Osteoarthritis within an experimental model. Apoptosis 2010, 15, 631–638. [Google Scholar] [CrossRef] [PubMed]
- Pascual Garrido, C.; Hakimiyan, A.A.; Rappoport, L.; Oegema, T.R.; Wimmer, M.A.; Chubinskaya, S. Anti-apoptotic treatments prevent cartilage degradation after acute trauma to human ankle cartilage. Osteoarthr. Cartil. 2009, 17, 1244–1251. [Google Scholar] [CrossRef] [PubMed]
- Buckwalter, J.A.; Saltzman, C.; Brown, T. The impact of osteoarthritis: Implications for research. Clin. Orthop. Relat. Res. 2004, 427, S6–S15. [Google Scholar] [CrossRef] [PubMed]
- Brew, C.J.; Clegg, P.D.; Boot-Handford, R.P.; Andrew, J.G.; Hardingham, T. Gene expression in human chondrocytes in late osteoarthritis is changed in both fibrillated and intact cartilage without evidence of generalised chondrocyte hypertrophy. Ann. Rheum. Dis. 2010, 69, 234–240. [Google Scholar] [CrossRef] [PubMed]
- Haag, J.; Gebhard, P.M.; Aigner, T. SOX gene expression in human osteoarthritic cartilage. Pathobiology 2008, 75, 195–199. [Google Scholar] [CrossRef] [PubMed]
- Aigner, T.; Fundel, K.; Saas, J.; Gebhard, P.M.; Haag, J.; Weiss, T.; Zien, A.; Obermayr, F.; Zimmer, R.; Bartnik, E. Large-scale gene expression profiling reveals major pathogenetic pathways of cartilage degeneration in osteoarthritis. Arthritis Rheum. 2006, 54, 3533–3544. [Google Scholar] [CrossRef] [PubMed]
- Aigner, T.; Gebhard, P.M.; Schmid, E.; Bau, B.; Harley, V.; Poschl, E. SOX9 expression does not correlate with type II collagen expression in adult articular chondrocytes. Matrix Biol. 2003, 22, 363–372. [Google Scholar] [CrossRef]
- Ma, B.; Leijten, J.C.; Wu, L.; Kip, M.; van Blitterswijk, C.A.; Post, J.N.; Karperien, M. Gene expression profiling of dedifferentiated human articular chondrocytes in monolayer culture. Osteoarthr. Cartil. 2013, 21, 599–603. [Google Scholar] [CrossRef] [PubMed]
- Marlovits, S.; Hombauer, M.; Truppe, M.; Vecsei, V.; Schlegel, W. Changes in the ratio of type-I and type-II collagen expression during monolayer culture of human chondrocytes. J. Bone. Jt. Surg. Br. 2004, 86, 286–295. [Google Scholar] [CrossRef]
- Casagrande, D.; Stains, J.P.; Murthi, A.M. Identification of shoulder osteoarthritis biomarkers: Comparison between shoulders with and without osteoarthritis. J. Shoulder Elbow Surg. 2015, 24, 382–390. [Google Scholar] [CrossRef] [PubMed]
- Aigner, T.; Zien, A.; Gehrsitz, A.; Gebhard, P.M.; McKenna, L. Anabolic and catabolic gene expression pattern analysis in normal versus osteoarthritic cartilage using complementary DNA-array technology. Arthritis Rheum. 2001, 44, 2777–2789. [Google Scholar] [CrossRef]
- Gebhard, P.M.; Gehrsitz, A.; Bau, B.; Soder, S.; Eger, W.; Aigner, T. Quantification of expression levels of cellular differentiation markers does not support a general shift in the cellular phenotype of osteoarthritic chondrocytes. J. Orthop. Res. 2003, 21, 96–101. [Google Scholar] [CrossRef]
- Lane, N.E.; Nevitt, M.C.; Lui, L.Y.; de Leon, P.; Corr, M. Wnt signaling antagonists are potential prognostic biomarkers for the progression of radiographic hip osteoarthritis in elderly Caucasian women. Arthritis Rheum. 2007, 56, 3319–3325. [Google Scholar] [CrossRef] [PubMed]
- Voorzanger-Rousselot, N.; Ben-Tabassi, N.C.; Garnero, P. Opposite relationships between circulating Dkk-1 and cartilage breakdown in patients with rheumatoid arthritis and knee osteoarthritis. Ann. Rheum. Dis. 2009, 68, 1513–1514. [Google Scholar] [CrossRef] [PubMed]
- Honsawek, S.; Tanavalee, A.; Yuktanandana, P.; Ngarmukos, S.; Saetan, N.; Tantavisut, S. Dickkopf-1 (Dkk-1) in plasma and synovial fluid is inversely correlated with radiographic severity of knee osteoarthritis patients. BMC Musculoskelet. Disord. 2010, 11. [Google Scholar] [CrossRef] [PubMed]
- Lories, R.J.; Peeters, J.; Bakker, A.; Tylzanowski, P.; Derese, I.; Schrooten, J.; Thomas, J.T.; Luyten, F.P. Articular cartilage and biomechanical properties of the long bones in Frzb-knockout mice. Arthritis Rheum. 2007, 56, 4095–4103. [Google Scholar] [CrossRef] [PubMed]
- Huebner, J.L.; Johnson, K.A.; Kraus, V.B.; Terkeltaub, R.A. Transglutaminase 2 is a marker of chondrocyte hypertrophy and osteoarthritis severity in the Hartley guinea pig model of knee OA. Osteoarthr. Cartil. 2009, 17, 1056–1064. [Google Scholar] [CrossRef] [PubMed]
- Kim, D.Y.; Taylor, H.W.; Moore, R.M.; Paulsen, D.B.; Cho, D.Y. Articular chondrocyte apoptosis in equine osteoarthritis. Vet. J. 2003, 166, 52–57. [Google Scholar] [CrossRef]
- Kamekura, S.; Kawasaki, Y.; Hoshi, K.; Shimoaka, T.; Chikuda, H.; Maruyama, Z.; Komori, T.; Sato, S.; Takeda, S.; Karsenty, G.; et al. Contribution of runt-related transcription factor 2 to the pathogenesis of osteoarthritis in mice after induction of knee joint instability. Arthritis Rheum. 2006, 54, 2462–2470. [Google Scholar] [CrossRef] [PubMed]
- Van der Kraan, P.M.; van den Berg, W.B. Chondrocyte hypertrophy and osteoarthritis: Role in initiation and progression of cartilage degeneration? Osteoarthr. Cartil. 2012, 20, 223–232. [Google Scholar] [CrossRef] [PubMed]
- Gouttenoire, J.; Valcourt, U.; Ronziere, M.C.; Aubert-Foucher, E.; Mallein-Gerin, F.; Herbage, D. Modulation of collagen synthesis in normal and osteoarthritic cartilage. Biorheology 2004, 41, 535–542. [Google Scholar] [PubMed]
- Boos, N.; Nerlich, A.G.; Wiest, I.; von der Mark, K.; Ganz, R.; Aebi, M. Immunohistochemical analysis of type-X-collagen expression in osteoarthritis of the hip joint. J. Orthop. Res. 1999, 17, 495–502. [Google Scholar] [CrossRef] [PubMed]
- Blom, A.B.; Brockbank, S.M.; van Lent, P.L.; van Beuningen, H.M.; Geurts, J.; Takahashi, N.; van der Kraan, P.M.; van de Loo, F.A.; Schreurs, B.W.; Clements, K.; et al. Involvement of the Wnt signaling pathway in experimental and human osteoarthritis: Prominent role of Wnt-induced signaling protein 1. Arthritis Rheum. 2009, 60, 501–512. [Google Scholar] [CrossRef] [PubMed]
- Corr, M. Wnt-β-catenin signaling in the pathogenesis of osteoarthritis. Nat. Clin. Pract. Rheumatol. 2008, 4, 550–556. [Google Scholar] [CrossRef] [PubMed]
- Shen, J.; Li, S.; Chen, D. TGF-β signaling and the development of osteoarthritis. Bone Res. 2014, 2. [Google Scholar] [CrossRef] [PubMed]
- Papathanasiou, I.; Malizos, K.N.; Tsezou, A. Bone morphogenetic protein-2-induced Wnt/β-catenin signaling pathway activation through enhanced low-density-lipoprotein receptor-related protein 5 catabolic activity contributes to hypertrophy in osteoarthritic chondrocytes. Arthritis Res. Ther. 2012, 14. [Google Scholar] [CrossRef] [PubMed]
- Blaney Davidson, E.N.; Vitters, E.L.; van der Kraan, P.M.; van den Berg, W.B. Expression of transforming growth factor-β (TGFβ) and the TGFβ signalling molecule SMAD-2P in spontaneous and instability-induced osteoarthritis: Role in cartilage degradation, chondrogenesis and osteophyte formation. Ann. Rheum. Dis. 2006, 65, 1414–1421. [Google Scholar] [CrossRef] [PubMed]
- Nakase, T.; Miyaji, T.; Tomita, T.; Kaneko, M.; Kuriyama, K.; Myoui, A.; Sugamoto, K.; Ochi, T.; Yoshikawa, H. Localization of bone morphogenetic protein-2 in human osteoarthritic cartilage and osteophyte. Osteoarthr. Cartil. 2003, 11, 278–284. [Google Scholar] [CrossRef]
- Schmal, H.; Salzmann, G.M.; Langenmair, E.R.; Henkelmann, R.; Sudkamp, N.P.; Niemeyer, P. Biochemical characterization of early osteoarthritis in the ankle. Sci. World J. 2014, 2014. [Google Scholar] [CrossRef] [PubMed]
- Archer, C.W.; Francis-West, P. The chondrocyte. Int. J. Biochem. Cell Biol. 2003, 35, 401–404. [Google Scholar] [CrossRef]
- Zamli, Z.; Sharif, M. Chondrocyte apoptosis: A cause or consequence of osteoarthritis? Int. J. Rheum. Dis. 2011, 14, 159–166. [Google Scholar] [CrossRef] [PubMed]
- Landman, E.B.; Miclea, R.L.; van Blitterswijk, C.A.; Karperien, M. Small molecule inhibitors of WNT/β-catenin signaling block IL-1β- and TNFα-induced cartilage degradation. Arthritis Res. Ther. 2013, 15, R93. [Google Scholar] [CrossRef] [PubMed]


| Gene Name | Protein Function | Gene Expression Trend | Correlation between Gene Expression and OA Severity | Correlation Significant | |
|---|---|---|---|---|---|
| SOX9 | Chondrogenic transcription factor for chondrogenesis | 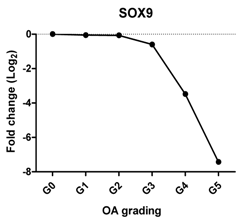 | Pearson Correlation Coefficients (r) | p-Values | ** |
| −0.927 | 0.008 | ||||
| ACAN | Extracellular matrix protein, provides strength to cartilage | 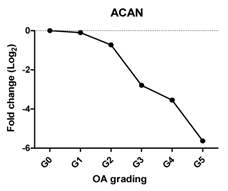 | −0.959 | 0.002 | ** |
| COL2A1 | Extracellular matrix protein, provides cartilaginous framework and tensile strength | 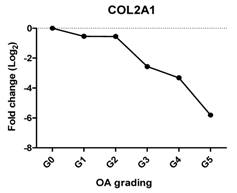 | −0.960 | 0.002 | ** |
| COL1A1 | Provides cartilaginous framework, the marker of dedifferentiated chondrocyte | 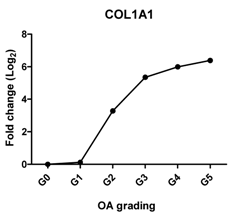 | 0.963 | 0.002 | ** |
| Col2A1/COL1A1 | Reflects the replacement of collagen type II by collagen type I during OA | 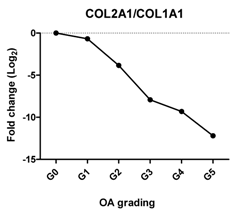 | −0.868 | 0.025 | * |
| DKK1 | Blocks chondrocyte hypertrophy, promotes chondrogenesis | 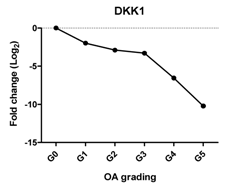 | −0.812 | 0.050 | * |
| FRZB | Inhibits chondrocyte hypertrophy, promotes chondrogenesis | 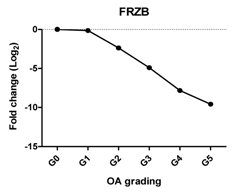 | −0.896 | 0.016 | * |
| GREM1 | Inhibits terminal chondrocyte differentiation and endochondral bone formation |  | 0.714 | 0.111 | ns |
| Gene Name | Protein Function | Gene Expression Trend | Correlation between Gene Expression and OA Severity | Correlation Significant | |
|---|---|---|---|---|---|
| RUNX2 | Promotes chondrocyte hypertrophy and bone formation | 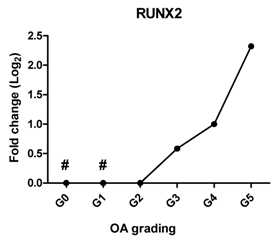 | 0.908 | 0.012 | * |
| COL10A1 | The marker of hypertrophic chondrocytes, regulates matrix mineralization | 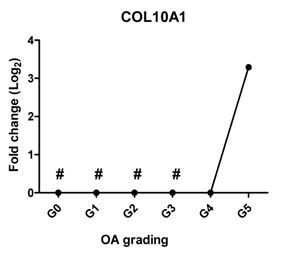 | 0.705 | 0.118 | ns |
| IHH | Promotes chondrocyte hypertrophy and bone formation | 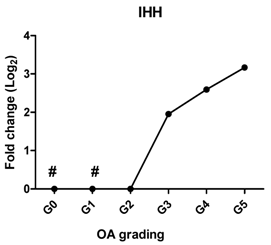 | 0.961 | 0.002 | ** |
| AXIN2 | Induces chondrogenesis at low level while inhibits chondrogenic differentiation at high level | 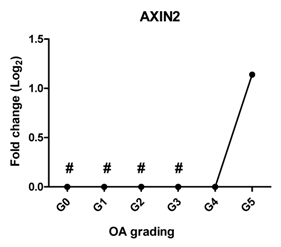 | 0.827 | 0.052 | ns |
| BMP2 | Stimulates chondrogenesis and increases cartilage matrix turnover |  | −0.007 | 0.990 | ns |
© 2016 by the authors; licensee MDPI, Basel, Switzerland. This article is an open access article distributed under the terms and conditions of the Creative Commons Attribution (CC-BY) license (http://creativecommons.org/licenses/by/4.0/).
Share and Cite
Zhong, L.; Huang, X.; Karperien, M.; Post, J.N. Correlation between Gene Expression and Osteoarthritis Progression in Human. Int. J. Mol. Sci. 2016, 17, 1126. https://doi.org/10.3390/ijms17071126
Zhong L, Huang X, Karperien M, Post JN. Correlation between Gene Expression and Osteoarthritis Progression in Human. International Journal of Molecular Sciences. 2016; 17(7):1126. https://doi.org/10.3390/ijms17071126
Chicago/Turabian StyleZhong, Leilei, Xiaobin Huang, Marcel Karperien, and Janine N. Post. 2016. "Correlation between Gene Expression and Osteoarthritis Progression in Human" International Journal of Molecular Sciences 17, no. 7: 1126. https://doi.org/10.3390/ijms17071126