Article

Stanniocalcin-1 Protects a Mouse Model from Renal Ischemia-Reperfusion Injury by Affecting ROS-Mediated Multiple Signaling Pathways

Department of Nephrology, Shengjing Affiliated Hospital of China Medical University, Shenyang 110036, China
*
Author to whom correspondence should be addressed.
Int. J. Mol. Sci. 2016, 17(7), 1051; https://doi.org/10.3390/ijms17071051
Submission received: 4 April 2016 / Revised: 5 June 2016 / Accepted: 27 June 2016 / Published: 12 July 2016
(This article belongs to the Section Molecular Pathology, Diagnostics, and Therapeutics)

Abstract

:
Stanniocalcin-1 (STC-1) protects against renal ischemia-reperfusion injury (RIRI). However, the molecular mechanisms remain widely unknown. STC-1 inhibits reactive oxygen species (ROS), whereas most ROS-mediated pathways are associated with ischemic injury. Therefore, to explore the mechanism, the effects of STC-1 on ROS-medicated pathways were studied. Non-traumatic vascular clamps were used to establish RIRI mouse models. The serum levels of STC-1, interleukin-6 (IL-6), interferon (IFN) γ, P53, and capase-3 were measured by ELISA kits. Superoxide dismutase (SOD) and malondialdehyde (MDA) were measured by fluorescence spectrofluorometer. All these molecules changed significantly in a RIRI model mouse when compared with those in a sham control. Kidney cells were isolated from sham and model mice. STC-1 was overexpressed or knockout in these kidney cells. The molecules in ROS-medicated pathways were measured by real-time quantitative PCR and Western blot. The results showed that STC-1 is an effective ROS scavenger. The serum levels of STC-1, MDA and SOD activity were increased while the serum levels of IL-6, iIFN-γ, P53, and capase-3 were decreased in a model group when compared with a sham control (p < 0.05). Furthermore, the levels of STC-1,p53, phosphorylated mitogen-activated protein kinase kinase (p-MEKK-1), c-Jun N-terminal kinase (p-JNK), extracellular signal-regulated kinase (p-ERK), IkB kinase (p-IKK), nuclear factor (NF) κB, apoptosis signal-regulating kinase 1 (ASK-1) and caspase-3 changed significantly in kidney cells isolated from a RIRI model when compared to those isolated from a sham control (p < 0.05). Meanwhile, STC-1 overexpression or silence caused significant changes of the levels of these ROS-mediated molecules. Therefore, STC-1 maybe improve anti-inflammation, anti-oxidant and anti-apoptosis activities by affecting ROS-mediated pathways, especially the phospho-modifications of the respective proteins, resulting in the increase of SOD and reduce of capase-3, p53, IL-6 and IFN-γ.

Graphical Abstract

1. Introduction

Ischemia/reperfusion renal injury (RIRI) has been characterized with restricted blood flow to kidney and then restores the normal blood flow and oxygen supply. Renal injury often occurs after kidney infarction [1], kidney sepsis [2] and kidney transplantation [3]. The situation will exacerbate renal damage by affecting inflammatory activities of various cytokines and the production of reactive oxygen species (ROS) [4], cellular function [5], inflammatory responses [6], and cellular apoptosis [7], which are the main factors for the pathogenesis of RIRI. RIRI is a clinical symptom with renal dysfunction and high mortality rates [8]. The pathogenesis of RIRI is complicated and hard to be treated. It is necessary to understand the more molecular mechanisms for causing the RIRI or preventing the damage caused by RIRI.
Stanniocalcin-1 (STC-1) exists in various tissues and has been regarded as autocrine or paracrine factor [9]. STC-1 is an important regulator for kidney and intestinal calcium transport, which can affect cellular metabolism and calcium homeostasis [10]. STC-1 is expressed in many cells and can be released into extracellular milieu [11], and binds the proteins from cell surface, and also interacts mitochondrial membrane [12,13].
STC-1 can suppress superoxide generation [14], inflammation and apoptosis [15] in mammalians. Much evidence suggests that STC-1 has potent anti-inflammatory and protective functions for RIRI [16,17], especially for ischemic tolerance [18]. According to a previous report, STC-1 is critical elements for activation of AMP-activated protein kinase (AMPK) activity in kidney. AMPK regulates STC-1-induced expression of UCP2 and sirtuin 3, and shows protecting functions for RIRI [16]. Another report showed that STC-1 reduced ROS production and caused higher ratio of activated extracellular regulated kinase (ERK)/activated Jun-N-terminal kinase (JNK) [17]. ROS can be associated with many different pathways, suggesting that there are other molecular mechanisms that need to be explored. In response to ischemic condition caused by RIRI, kidney shows protective functions for subsequent ischemic stresses. Apoptosis signaling kinase-1 [19], protein kinase C (PKC) [20], ERK [21], p53 [22], IkB kinase (IKK) [23], mitogen-activated protein kinase kinase (MEKK-1) [24], JNK [25], caspase-3 [26] and nuclear factor NF-κB [27] are associated with oxygen homeostasis and ischemic injury. All of them are associated with ROS-mediated pathways [28,29,30,31], whereas the overexpression of STC-1 has been reported to inhibit ROS production [32]. Furthermore, phosphate-modification plays an important role in the most molecules. For example, the inhibition of phosphate-modification of JNK (p-JNK) ameliorated myocardial I/R injury [33]. Another example, cardioprotective effects were associated with the levels of p-ERK [34]. The role phosphate modification of these important proteins was seldom reported in RIRI. Therefore, we investigated the effects of STC-1 on the main molecules ASK-1, p-ERK, ERK, PKC, p53, p-IKK, IKK, p-MEKK-1, MEKK, p-JNK, JNK, caspase-3 and nuclear factor NF-κB. Meanwhile, anti-oxidant, anti-inflammation and anti-apoptosis activities were also investigated by measuring the levels of superoxide dismutase (SOD), malondialdehyde (MDA), interleukin-6 (IL), interferon-γ (IFN-γ) and p53.

2. Results

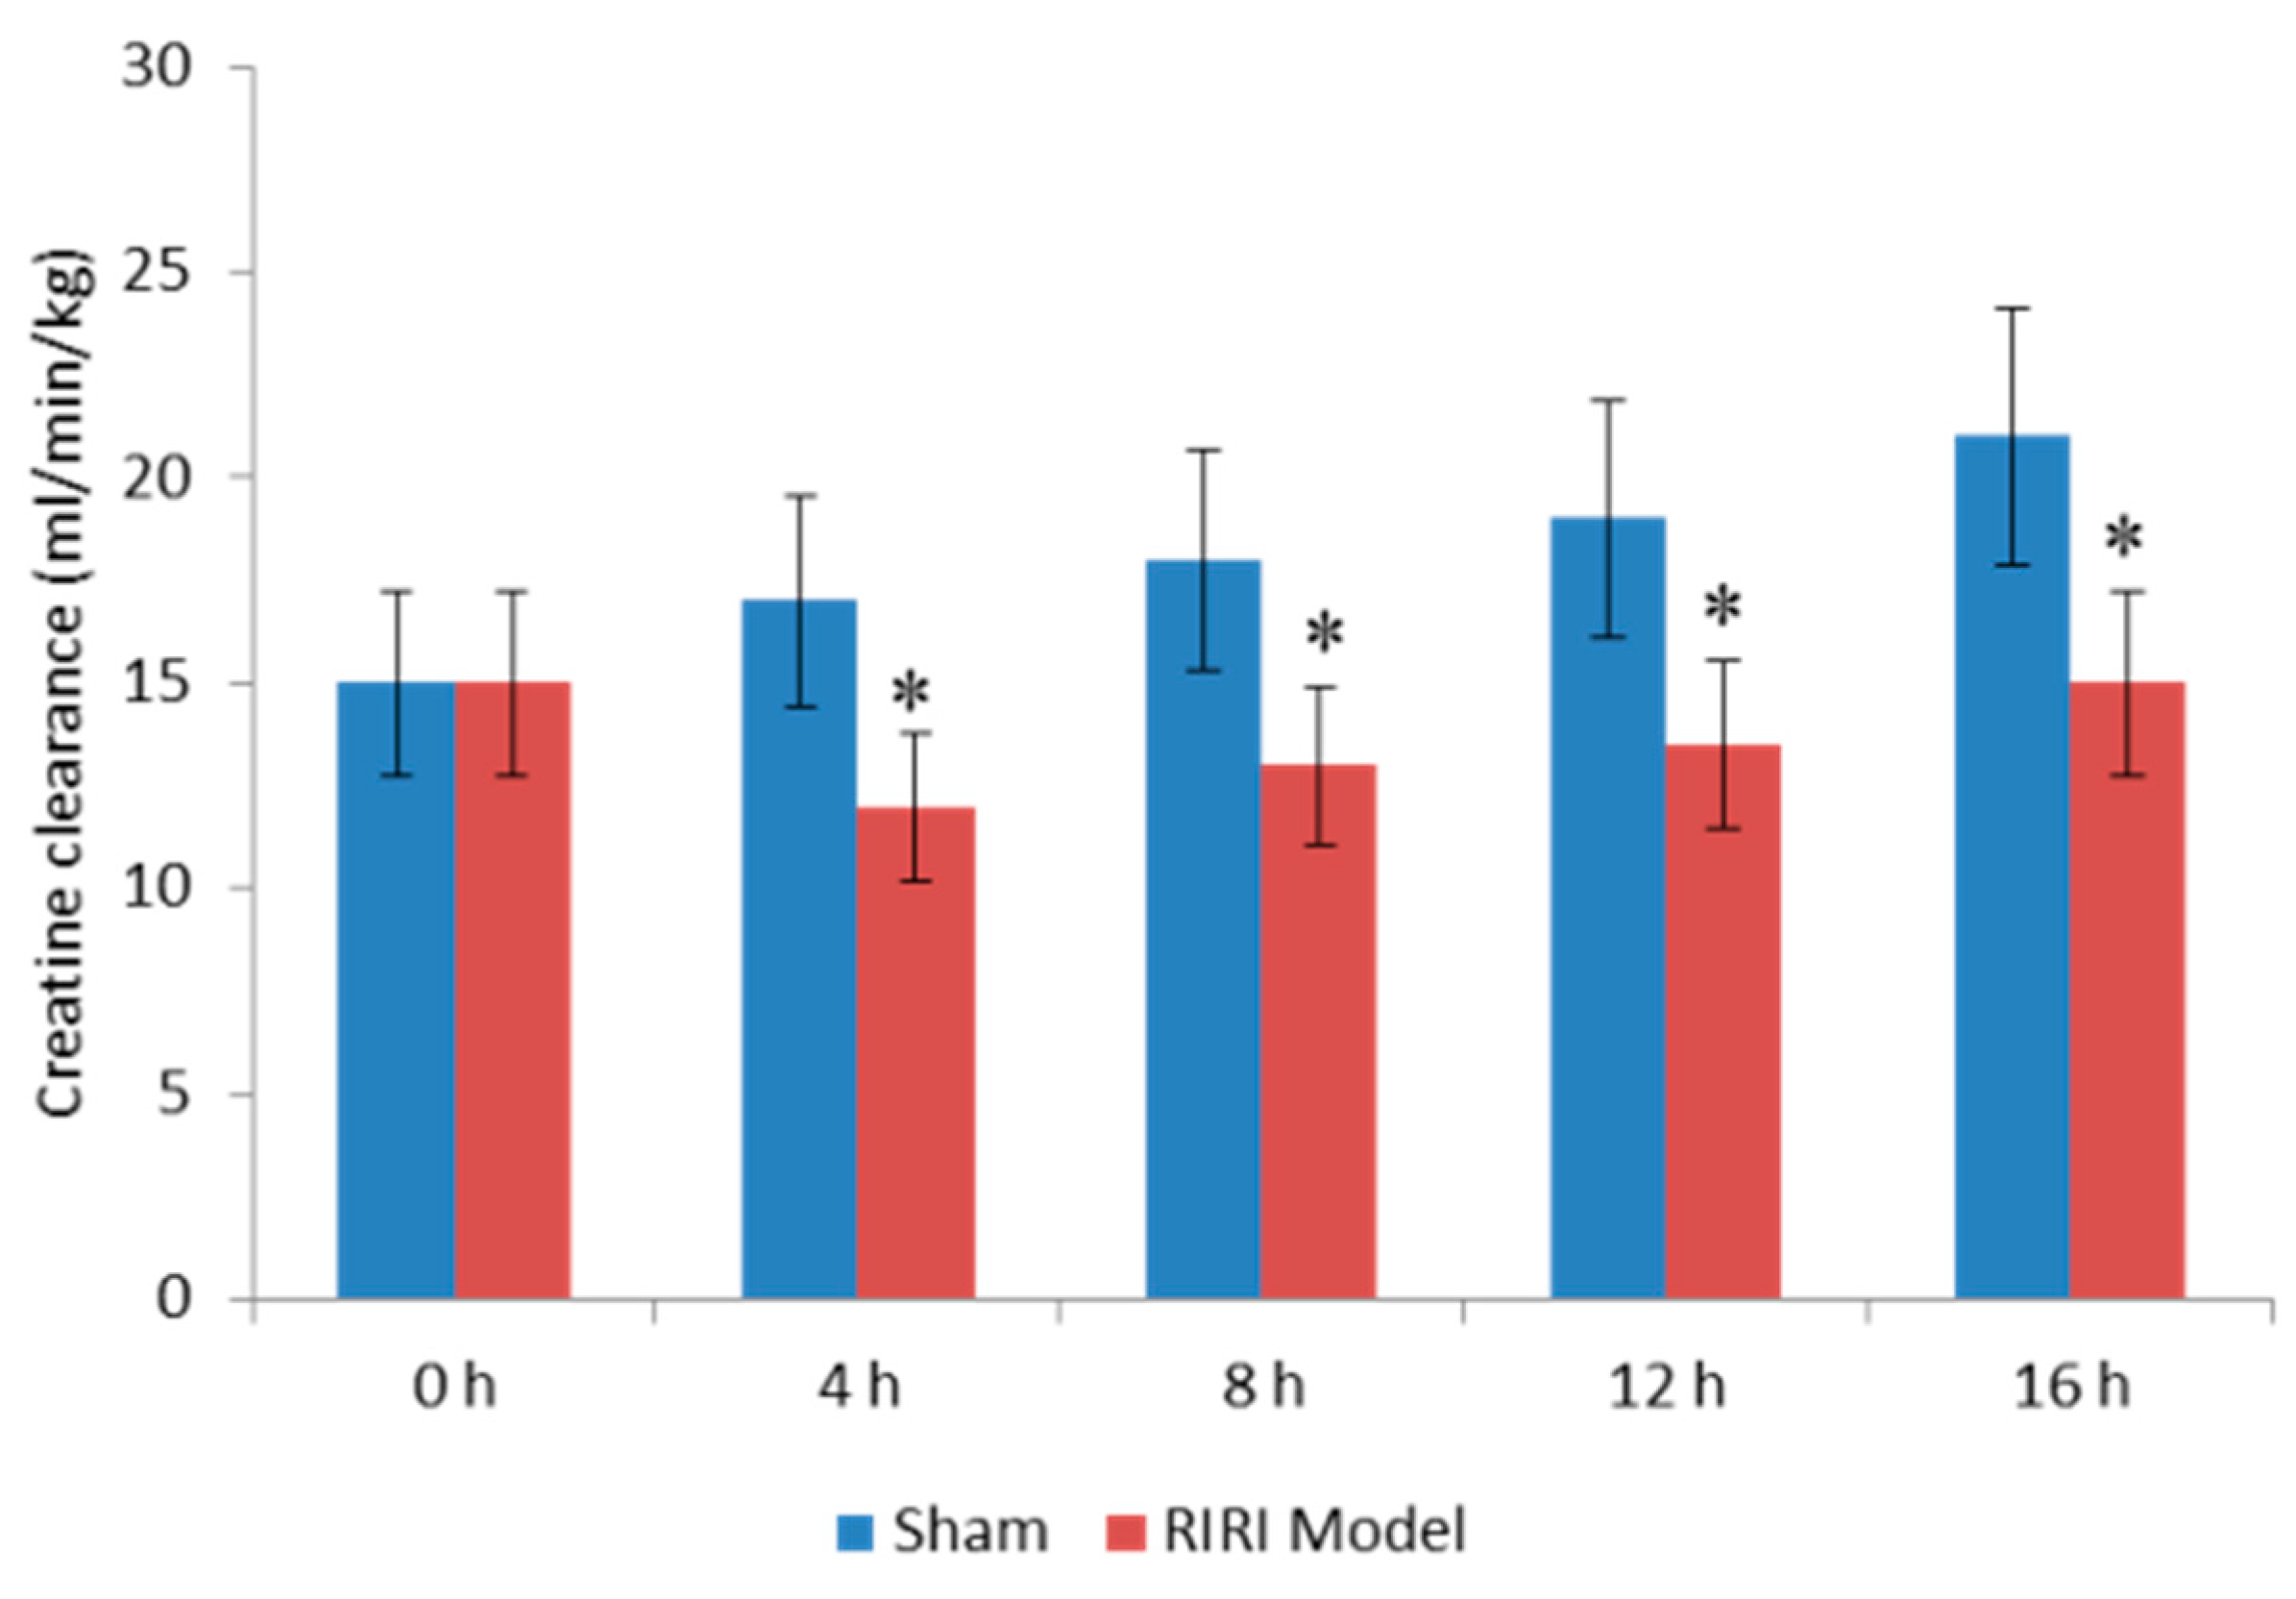
2.1. Evaluation for Renal Dysfunction of RIRI Model

Renal function was evaluated by measuring the changes of serum creatinine after establishment of RIRI model. The results showed that serum creatinine clearance was higher in subsequent period than before surgery. However, there was no significantly statistic difference for the changes in the same group. Comparatively, as seen in Figure 1, the creatinine clearance was significantly reduced in RIRI mice models when compared with the sham controls after four-hour establishment of RIRI model (p < 0.05) (Figure 1).

2.2. Increased Expression of STC-1 in the Kidney of Mouse Model

ELISA analysis showed that the average serum levels of STC-1 were 6.88 ± 1.56 ng/mL in a MSG group and 14.96 ± 3.24 ng/mL in a MG group (p = 0.002). Serum levels of STC-1 were increased in RIRI models when compared with sham controls. The result suggested that STC-1 functionally participated in physiological activity after the establishment of RIRI model.
Comparatively, the average values of serum STC-1 were 9.34 ± 2.18 ng/mL and 19.22 ± 4.58 ng/mL in SSG and MSG groups, which were significantly higher than the groups without STC-1 transfection (p = 0.001). The average values of serum STC-1 were 4.76 ± 1.09 ng/mL and 5.41 ± 1.12 ng/mL in SSShG and MSSG groups, respectively, which were significantly lower than the groups without STC-1 transfection (p = 0.001). All of these results suggested that the mice were successfully transfected with the vector with STC-1 gene or STC-1 shRNA.

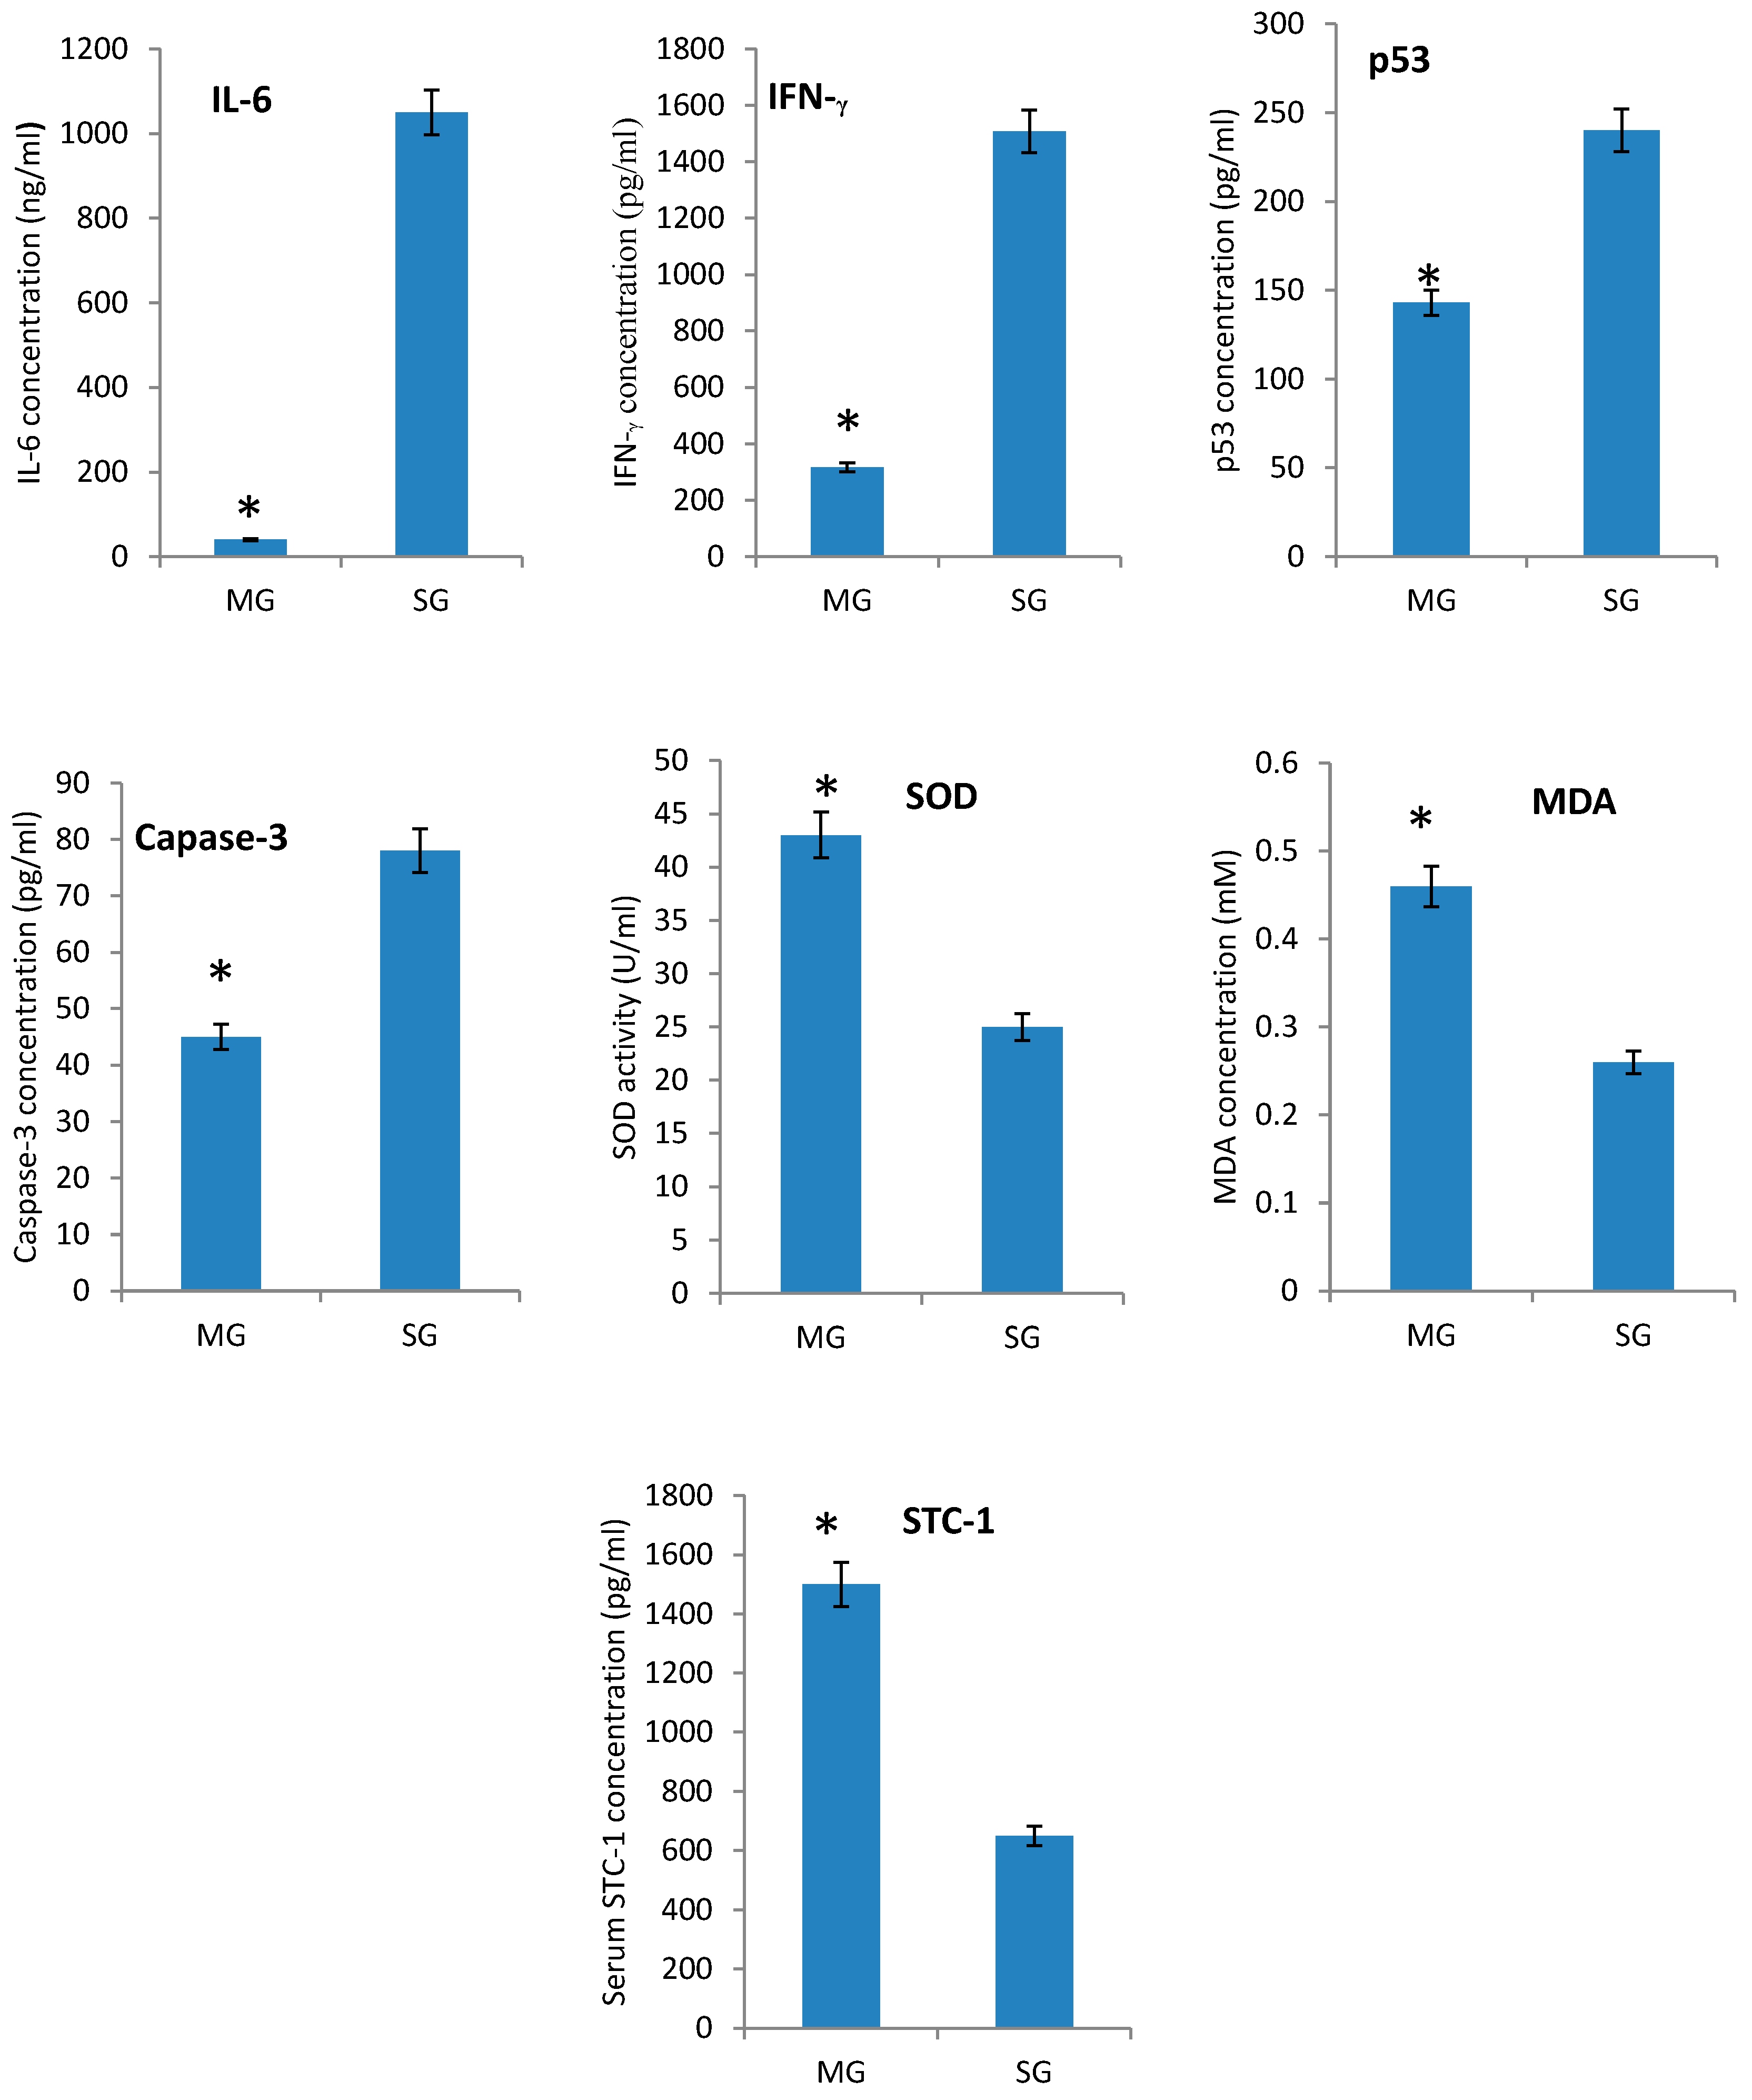
2.3. The Effects of STC-1 on Immunological and Biochemical Parameters

Meanwhile, the serum levels of inflammatory cytokines IL-6 and IFN-γ also decreased in a model group when compared with a sham group (Figure 2A,B, p < 0.05) while more inflammatory cytokines IL-6 and IFN-γ will make renal injury worse [23,35]. In contrast, the apoptotic factors, the serum levels of p53 and capase-3 decreased in a model group when compared with a sham group (Figure 2C,D, p < 0.05). ROS plays an important role in the pathogenesis of RIRI [36]. To protect against RIRI, SOD activity was improved, and serum levels of MDA increased in RIRI models when compared with Sham controls (Figure 2E,F, p < 0.05).
Comparatively, the serum level of STC-1 was higher in a model group than in a sham group (Figure 2G, p < 0.05). The serum levels of SOD and MDA increased (Figure 2E,F, p < 0.05). In contrast, the levels of IL-6, IFN-γ, p53 and caspase-3 were decreased in a model group (Figure 2A–D, p < 0.05). All of these findings might suggest that STC-1 plays an important role for protecting mice from RIRI by controlling the oxidant apoptosis and inflammatory responses by affecting the activities of SOD, MDA, p53, caspase-3, IL-6 and IFN-γ.

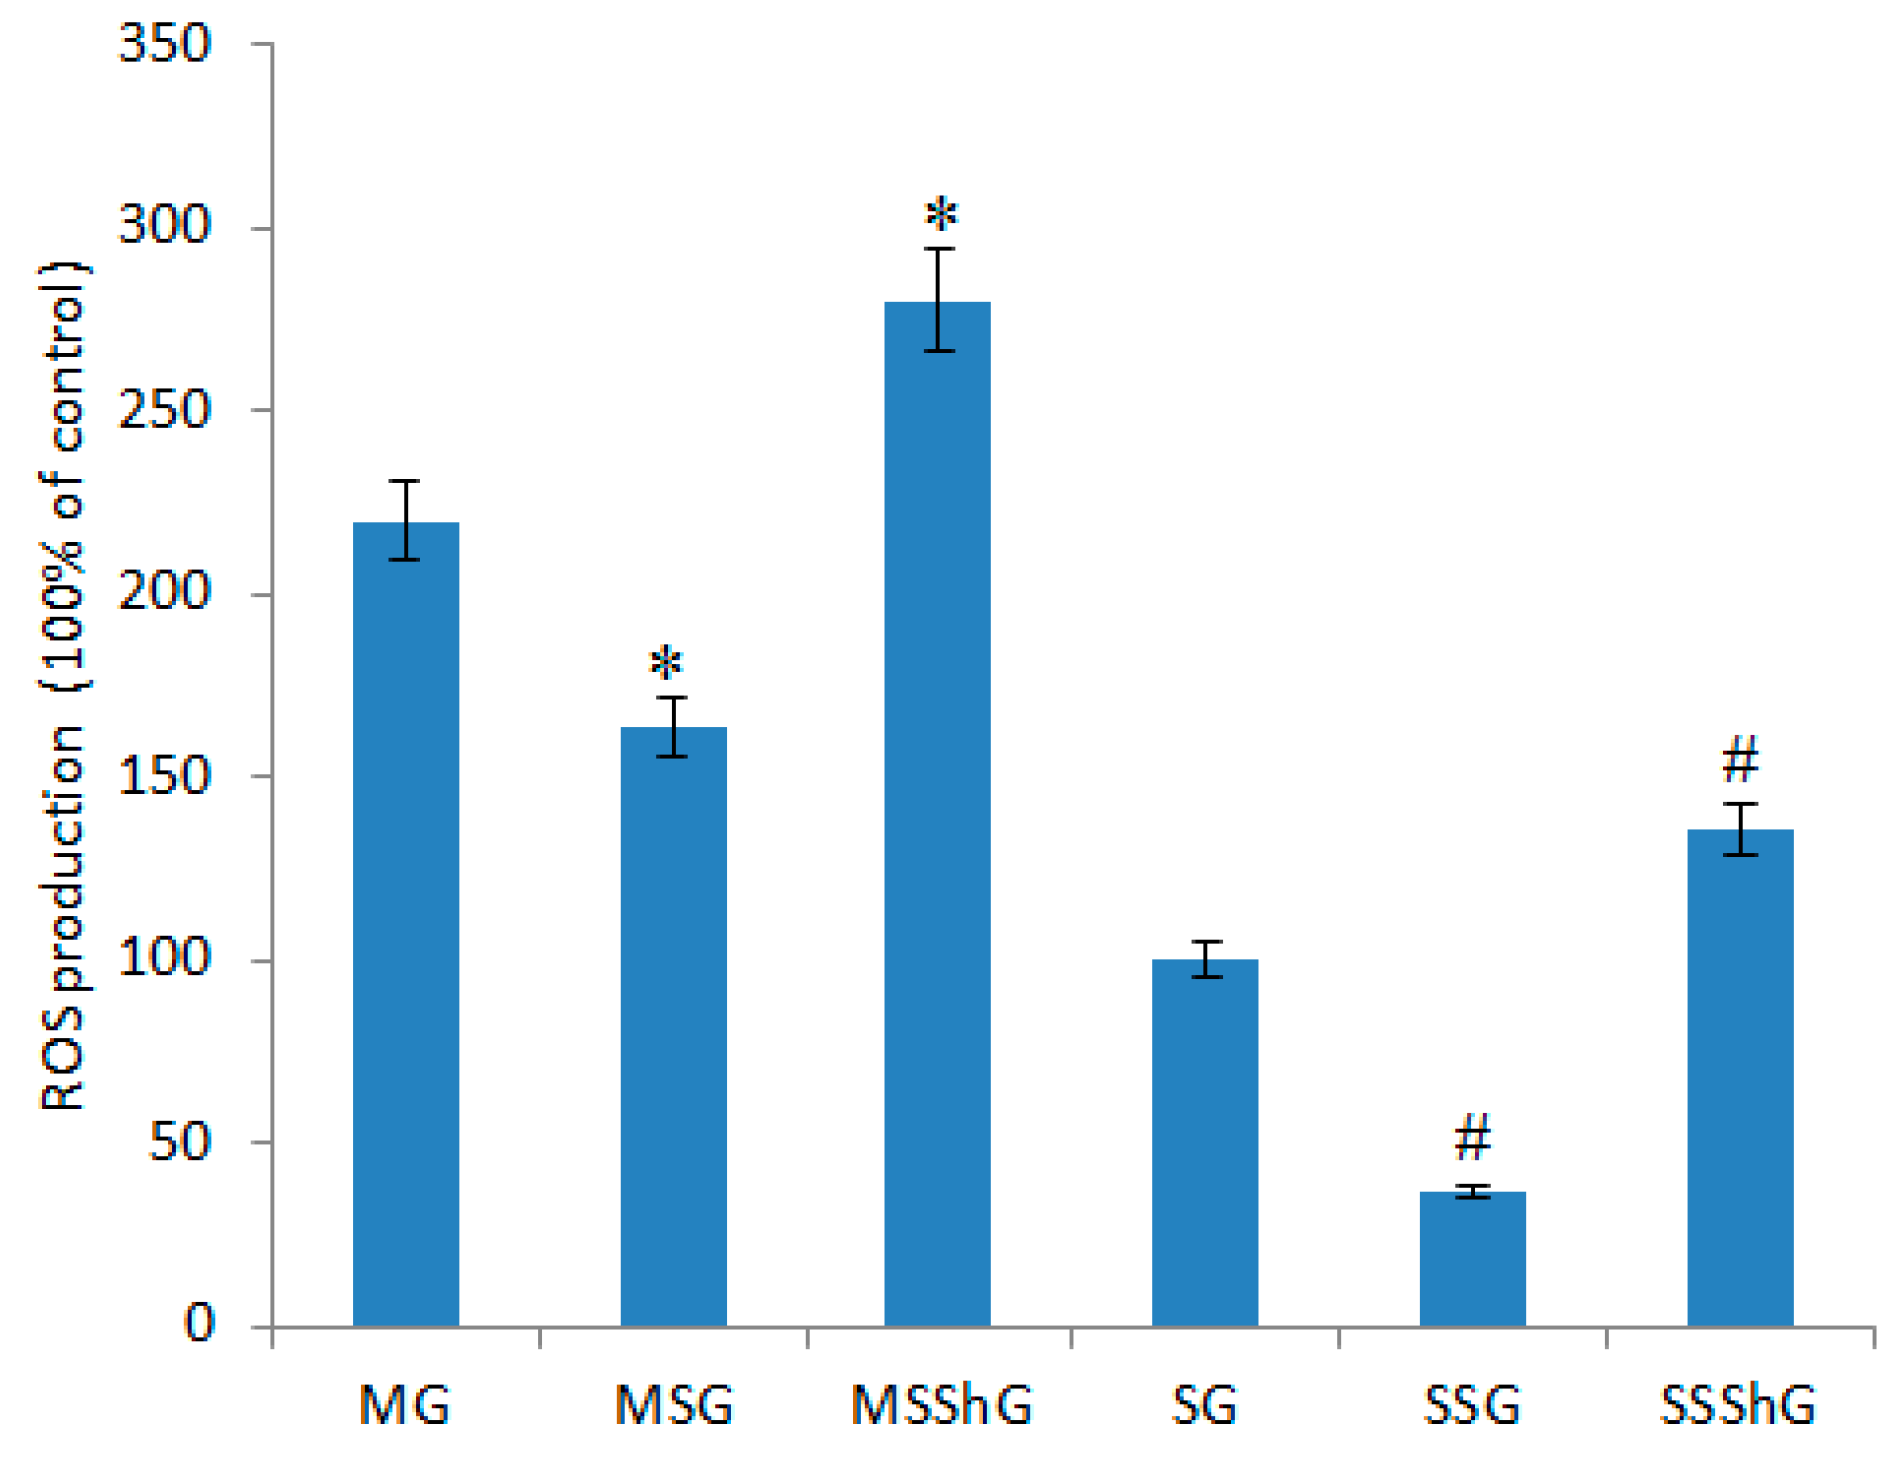
2.4. Intercellular ROS Concentration

ROS levels were significantly increased (to 120%) when compared to the concentrations in the cells isolated from sham mice (p < 0.05, Figure 3). The overexpression of STC-1 can significantly reduce ROS production in the cells isolated from model and sham mice (p < 0.05, Figure 3). In contrast, the STC-1 silence increased ROS levels (p < 0.05, Figure 3). Taken together, these results suggest that STC-1 is an effective ROS scavenger.

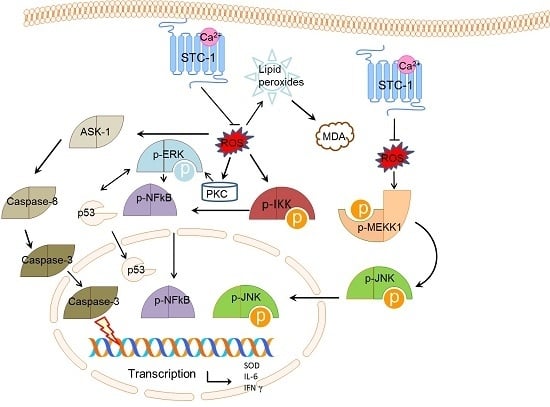
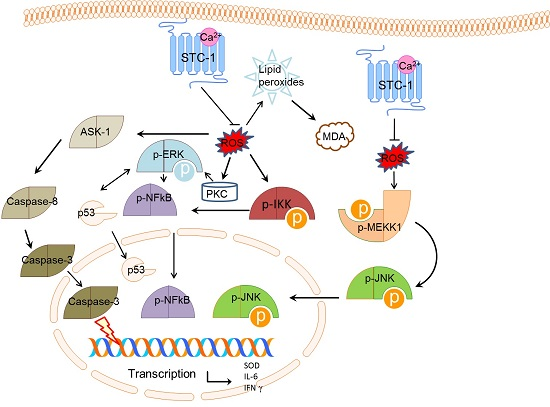
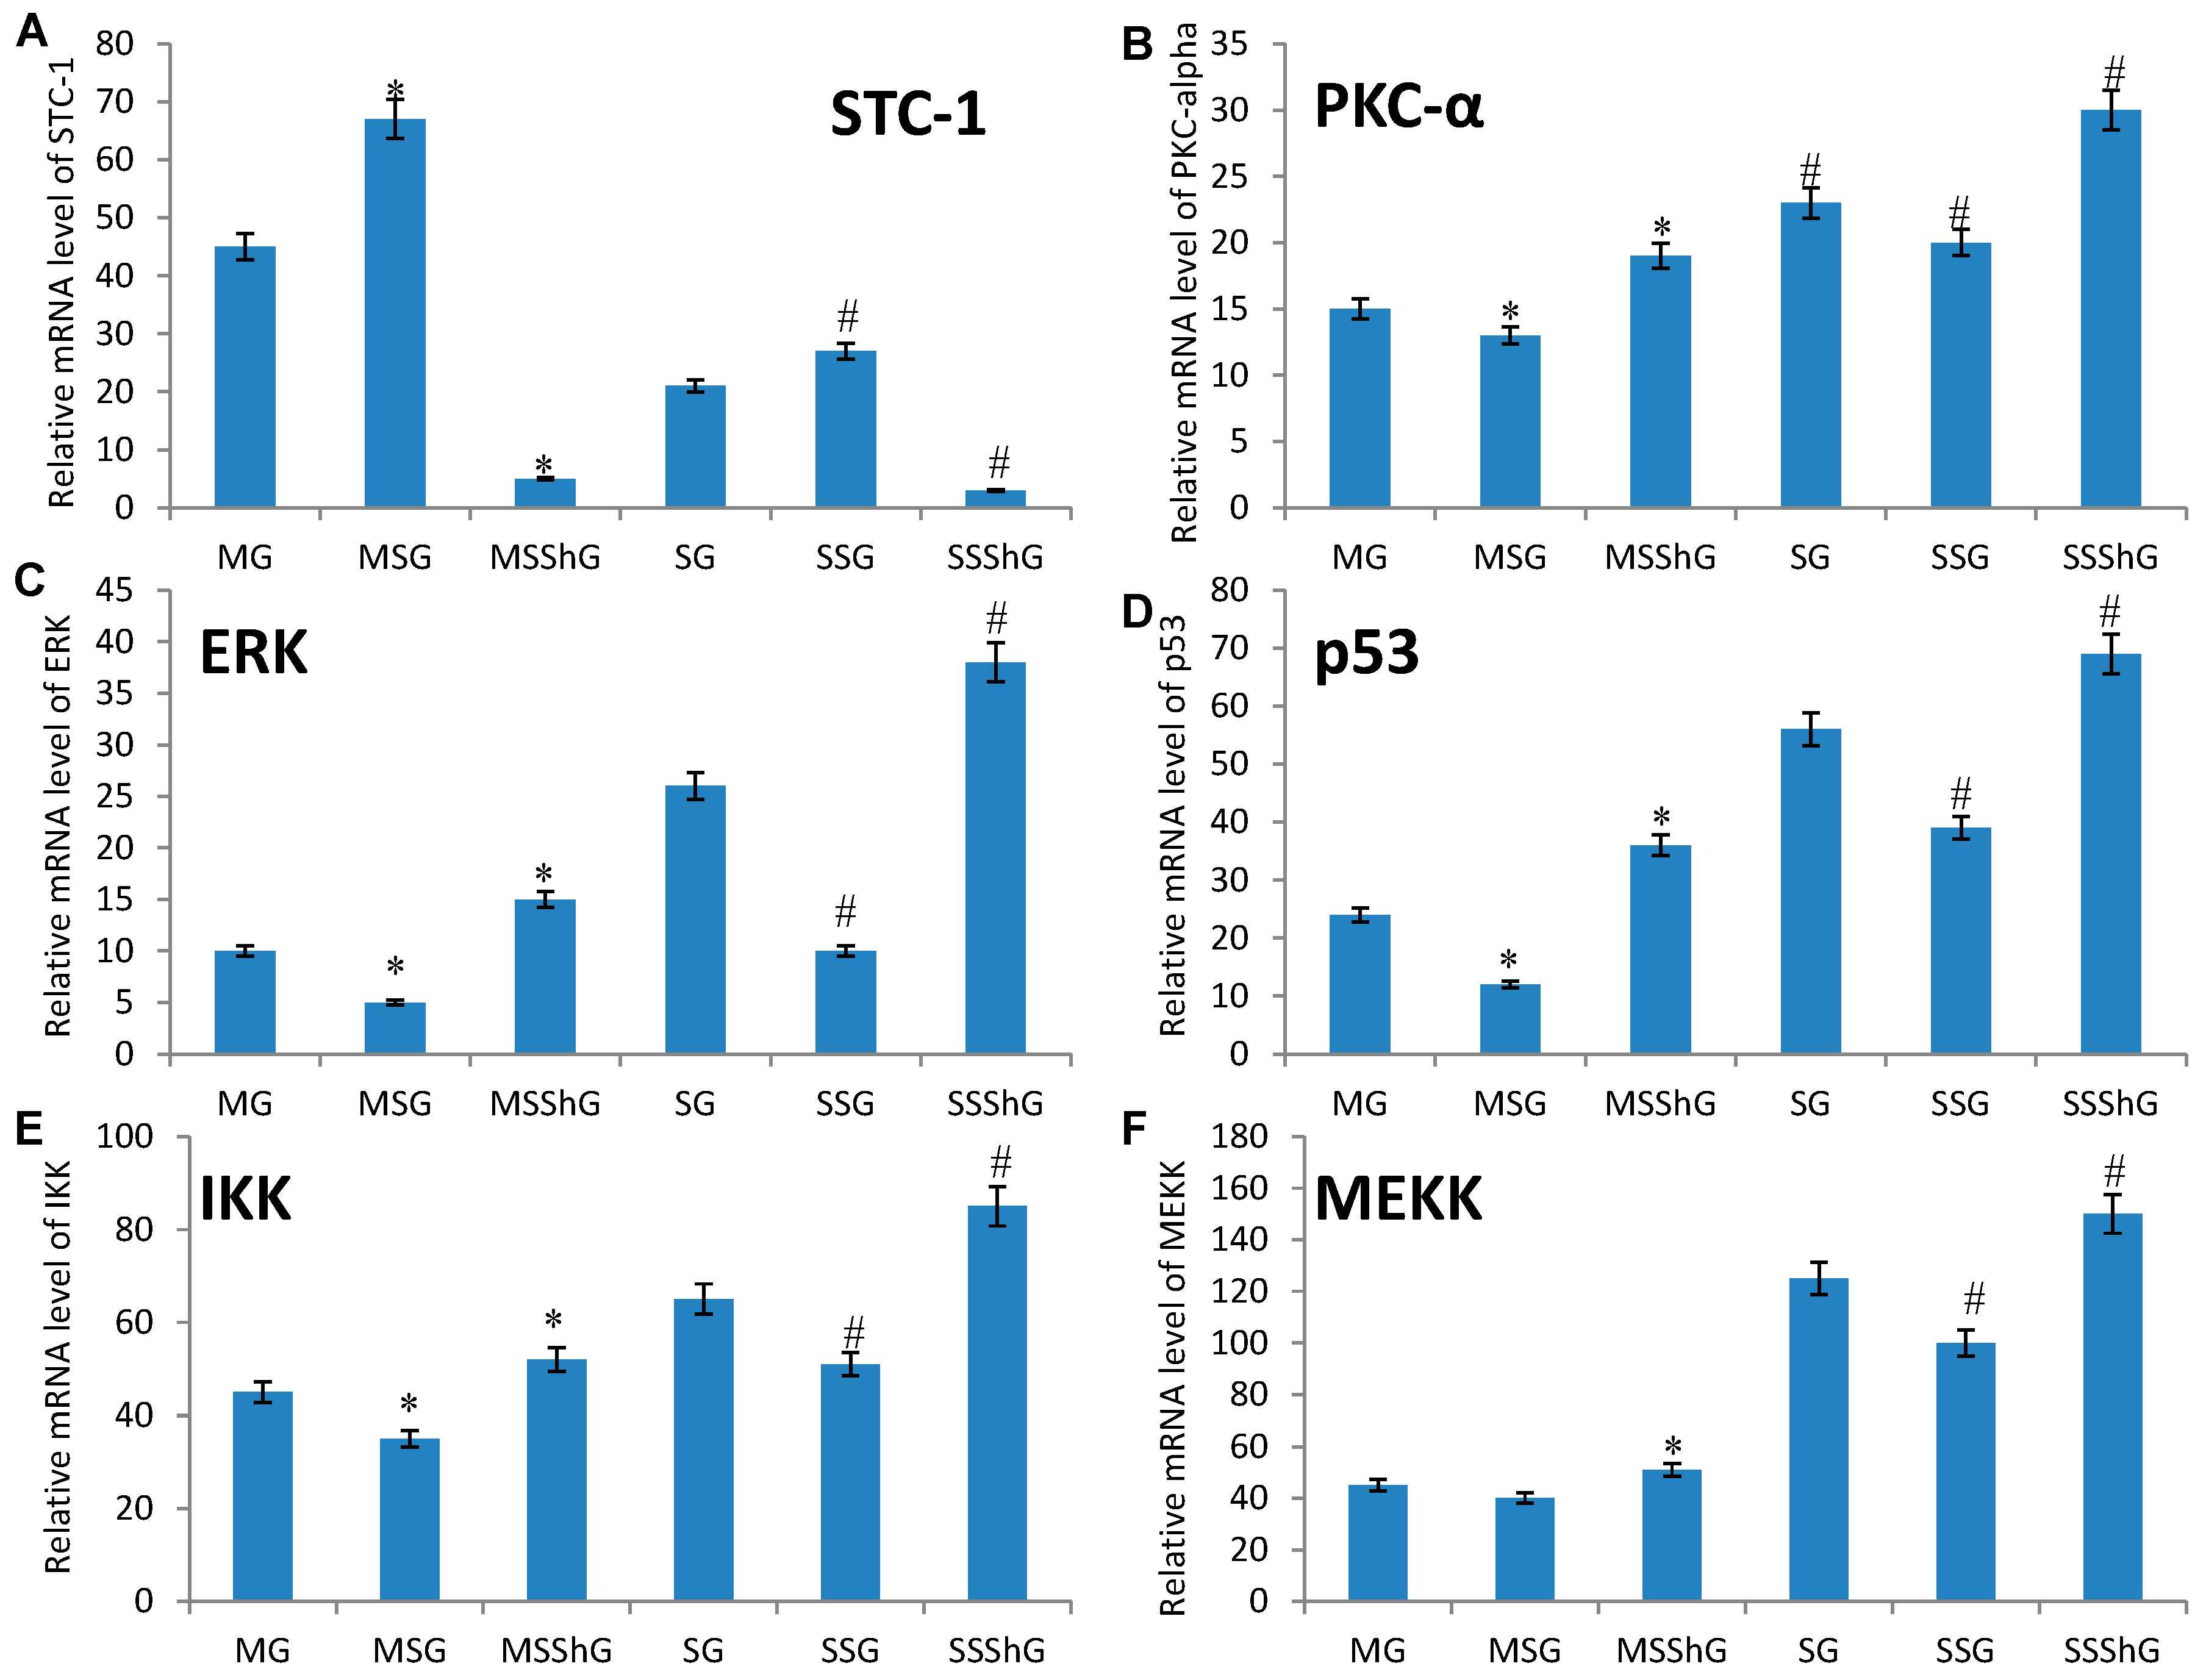
2.5. STC-1 Affects the mRNA Levels of ROS-Mediated Molecules

Among 16 mice, eight mice were used to create RIRI models as a model group and another eight mice were used as a sham group. Renal progenitor cells were isolated from the kidney cortex of RIRI model and sham mice after 16-h surgery. For the kidney cells isolated from eight model mice, they were further subdivided into three groups based on different treatment options (model group (MG); STC-1 expression group (MSG), the mice were transfected with STC-1 gene to overexpress STC-1; and STC-1 shRNA group (MSShG), the mice were transfected with STC-1 shRNA to knockdown STC-1). In the same way, the kidney cells from eight sham mice were subdivided into another three groups based on different treatment options (sham group (SG); STC-1 expression group (SSG), the mice were transfected with STC-1 gene to overexpress STC-1; and STC-1 shRNA group (SSShG), the mice were transfected with STC-1 shRNA to knockdown STC-1). Present results showed that mRNA level of STC-1 increased when compared with a sham group (Figure 4A, p < 0.05). The mRNA level of STC-1 increased in MSG and MSSG groups and decreased in SSG and SSShG groups (Figure 4A, p < 0.05), suggested that the cells were successfully transfected with the constructed vectors, STC-1 and or STC-1 shRNA.
In contrast, the mRNA level of PKC-α (Figure 4B), ERK (Figure 4C), p53 (Figure 4D), IKK (Figure 4E), MEKK (Figure 4F), JNK (Figure 4G), ASK-1 (Figure 4H), caspase-3 (Figure 4I), and NF-κB (Figure 4J) decreased when compared with a sham group (p < 0.05). The overexpression of STC-1 decreased the mRNA level of PKC-α (Figure 4B), ERK (Figure 4C), p53 (Figure 4D), IKK (Figure 4E), MEKK (Figure 4F), JNK (Figure 4G), ASK-1 (Figure 4H), caspase-3 (Figure 4I), and NF-κB (Figure 4J) in MSG and SSG groups. On the other hand, STC-1 silence increased mRNA levels of PKC-α (Figure 4B), ERK (Figure 4C), p53 (Figure 4D), IKK (Figure 4E), MEKK (Figure 4F), JNK (Figure 4G), ASK-1 (Figure 4H), caspase-3 (Figure 4I), and NF-κB (Figure 4J) in MSShG and SSShG groups (p < 0.05), suggested STC-1 reduces the mRNA level of PKC-α (Figure 4B), ERK (Figure 4C), p53 (Figure 4D), IKK (Figure 4E), MEKK (Figure 4F), JNK (Figure 4G), ASK-1 (Figure 4H), caspase-3 (Figure 4I), and NF-κB (Figure 4J).

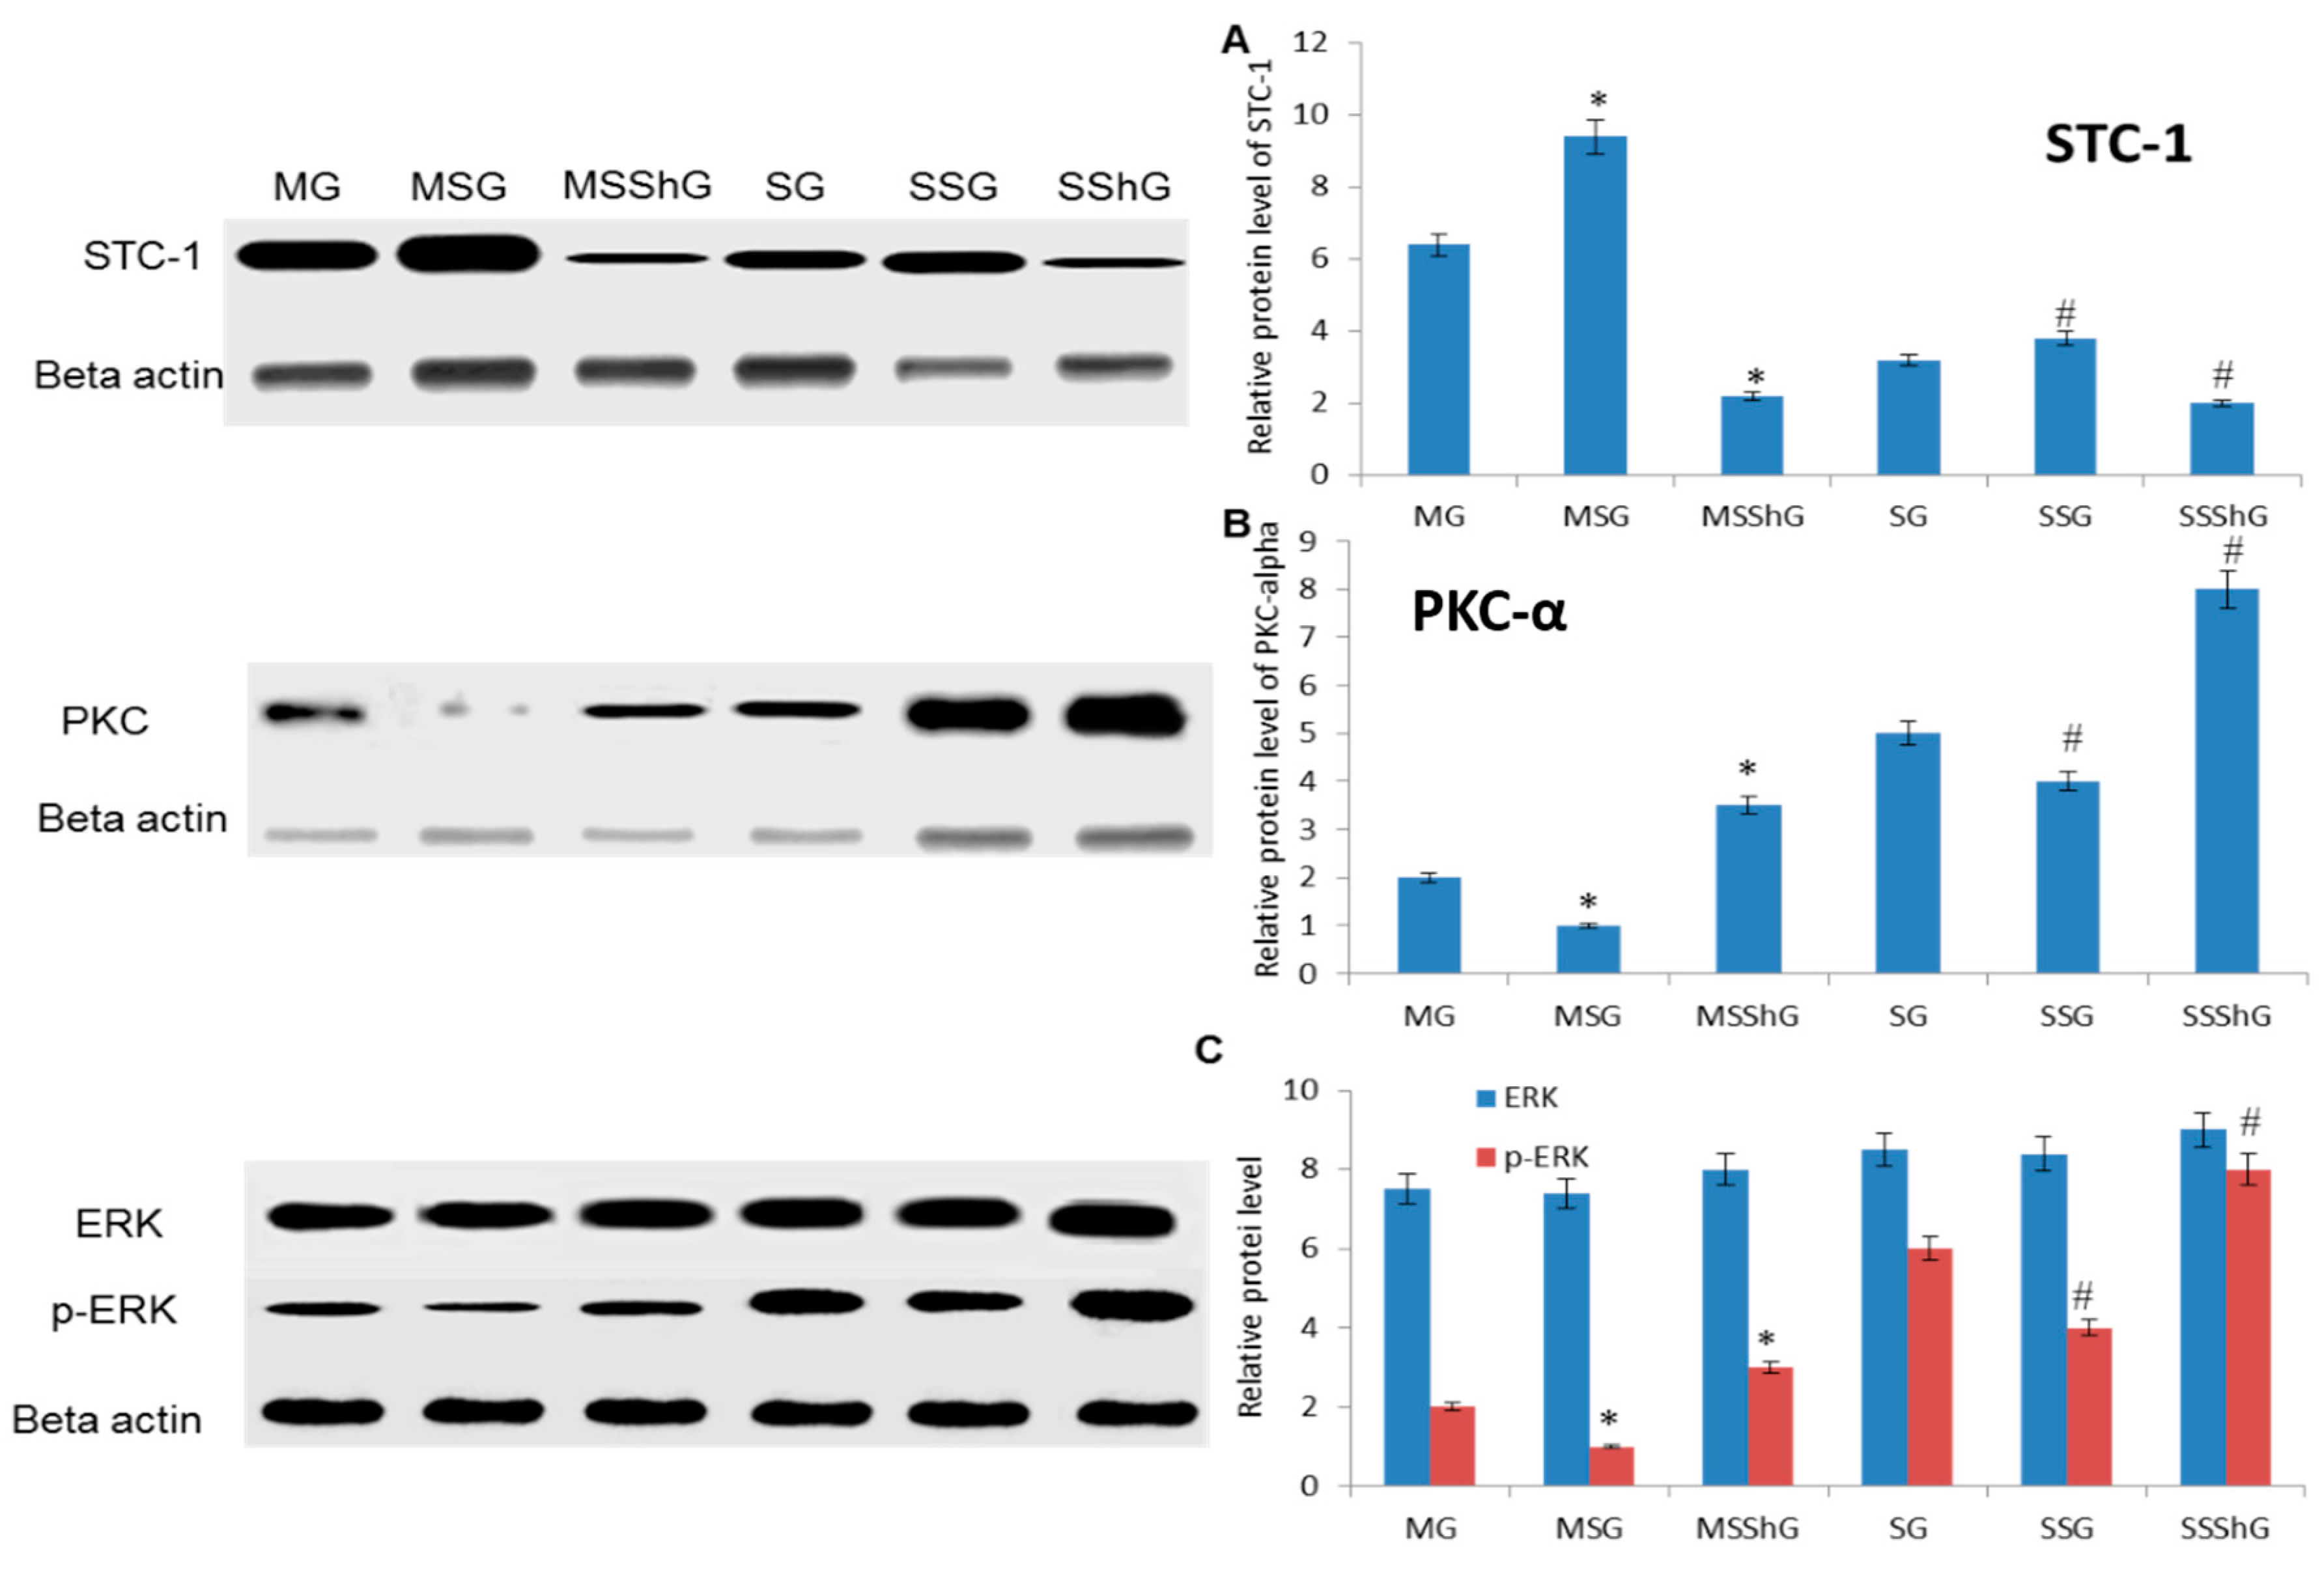
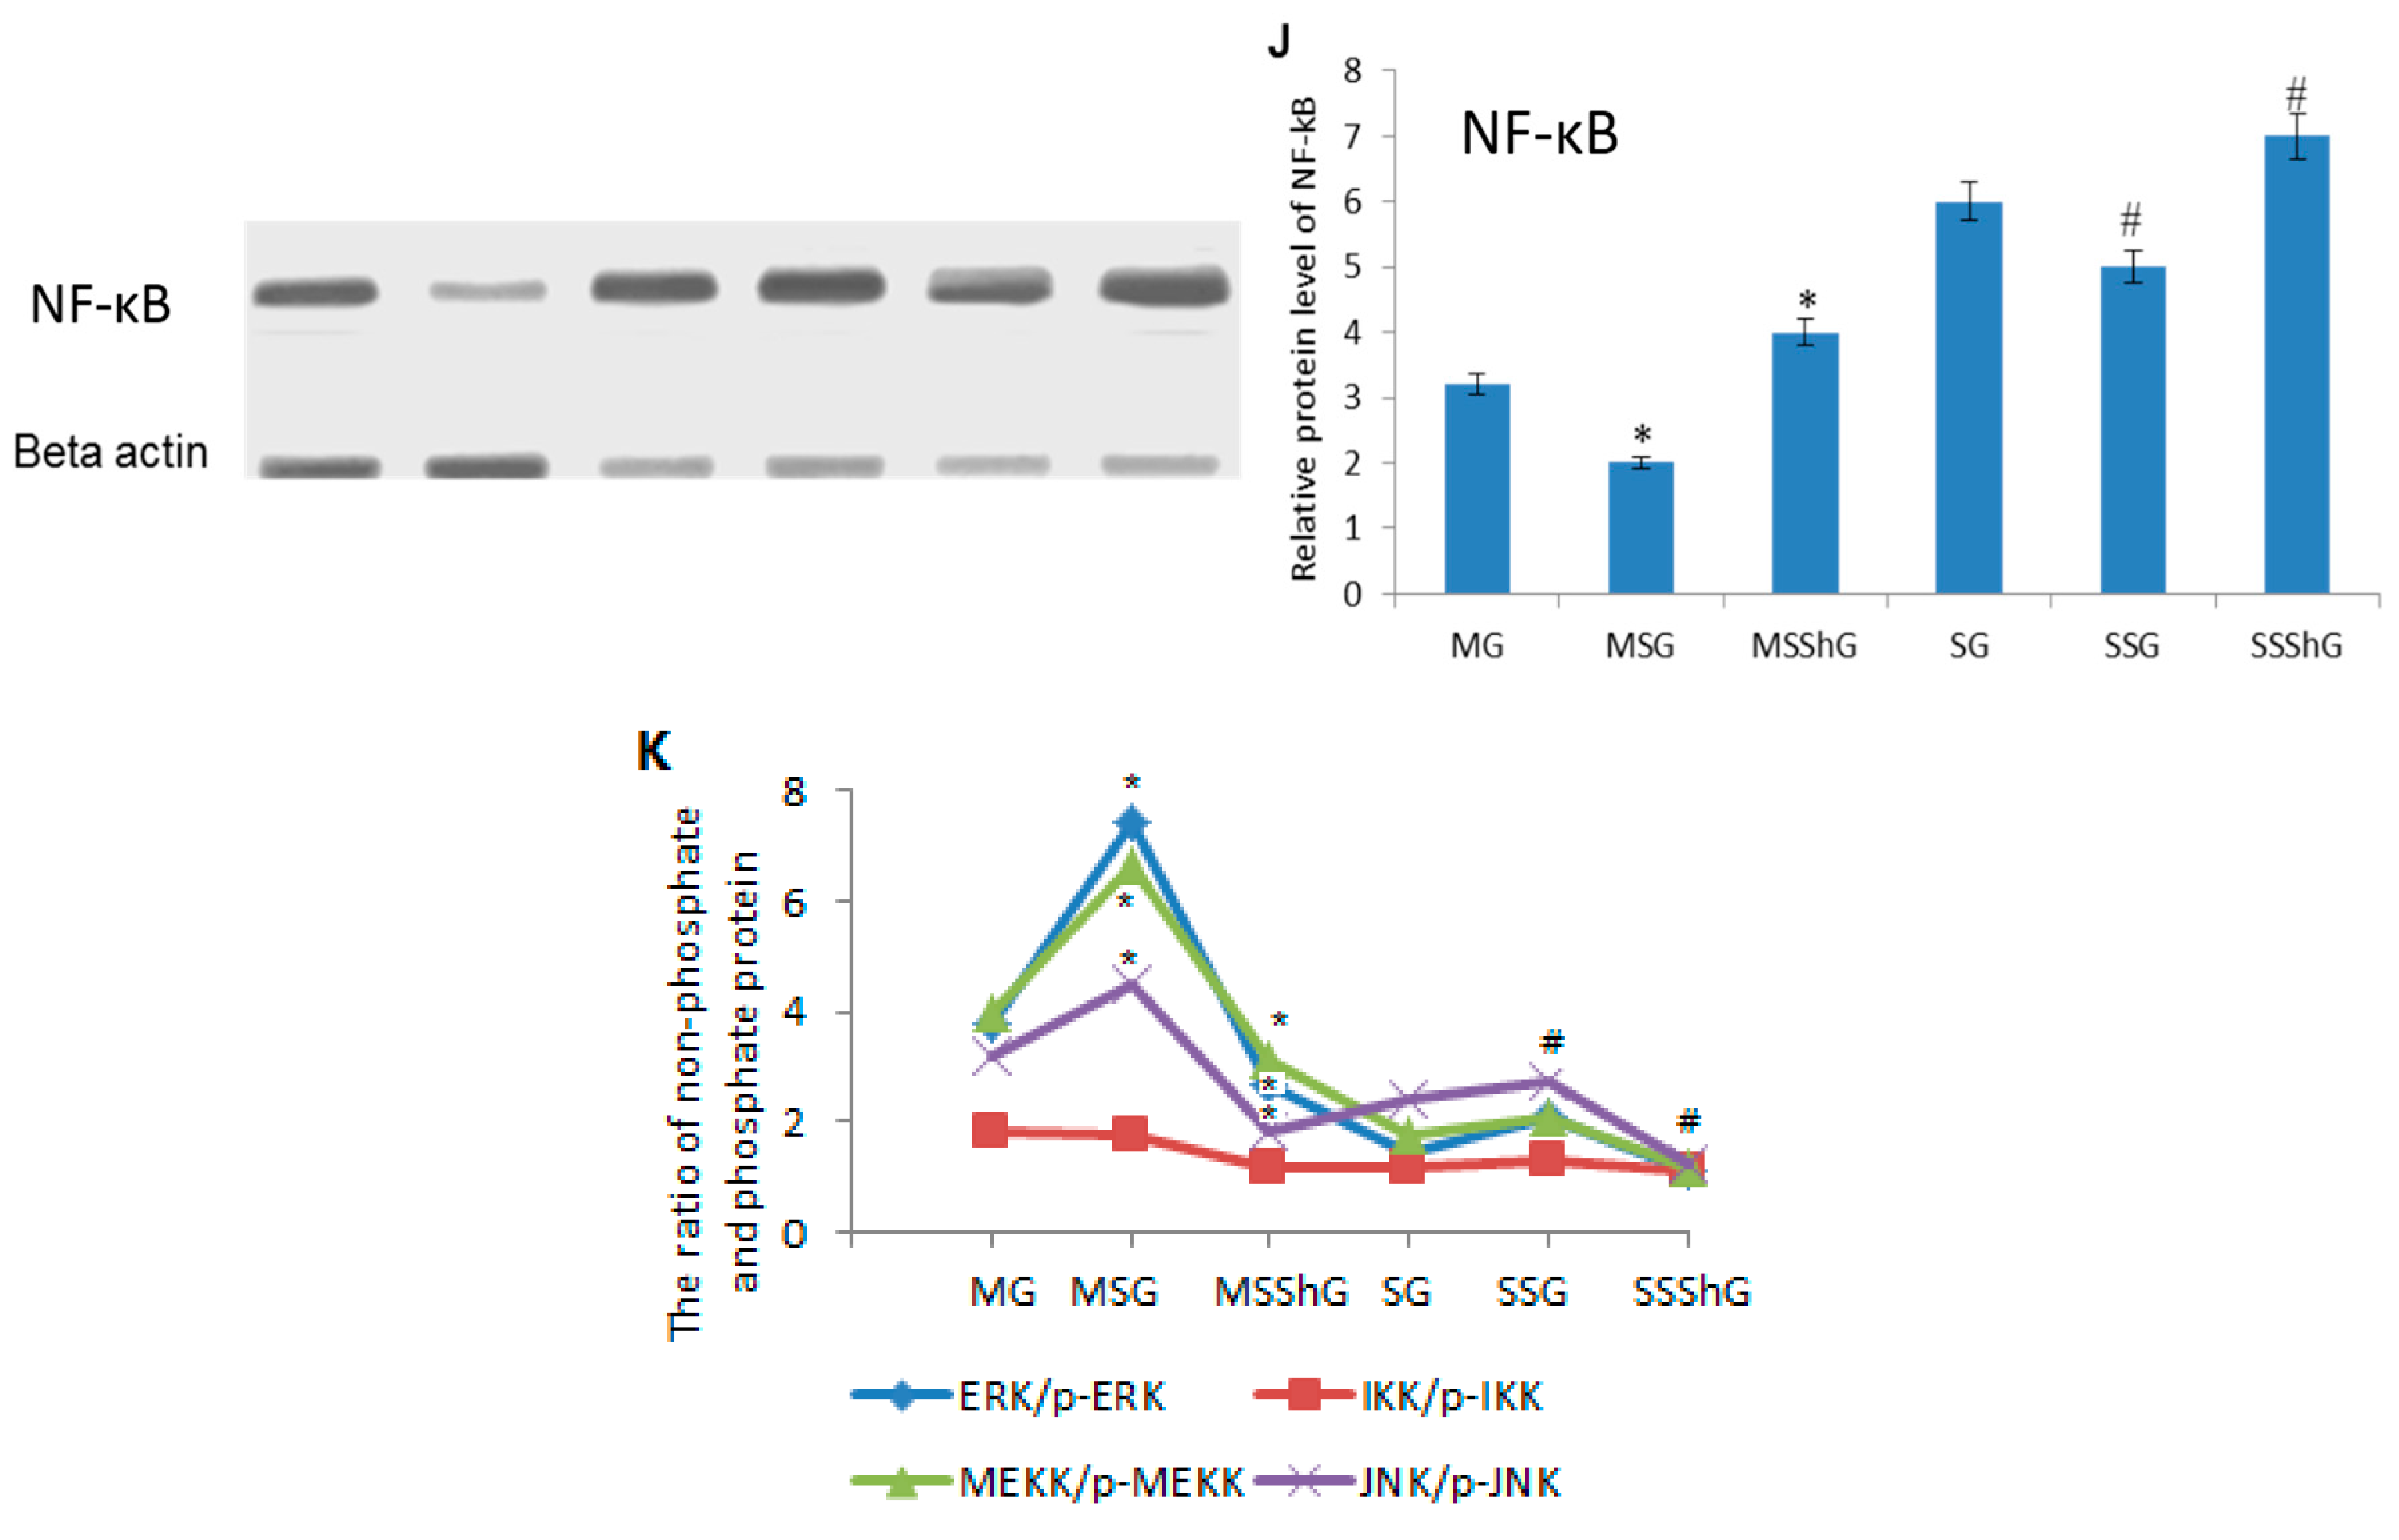
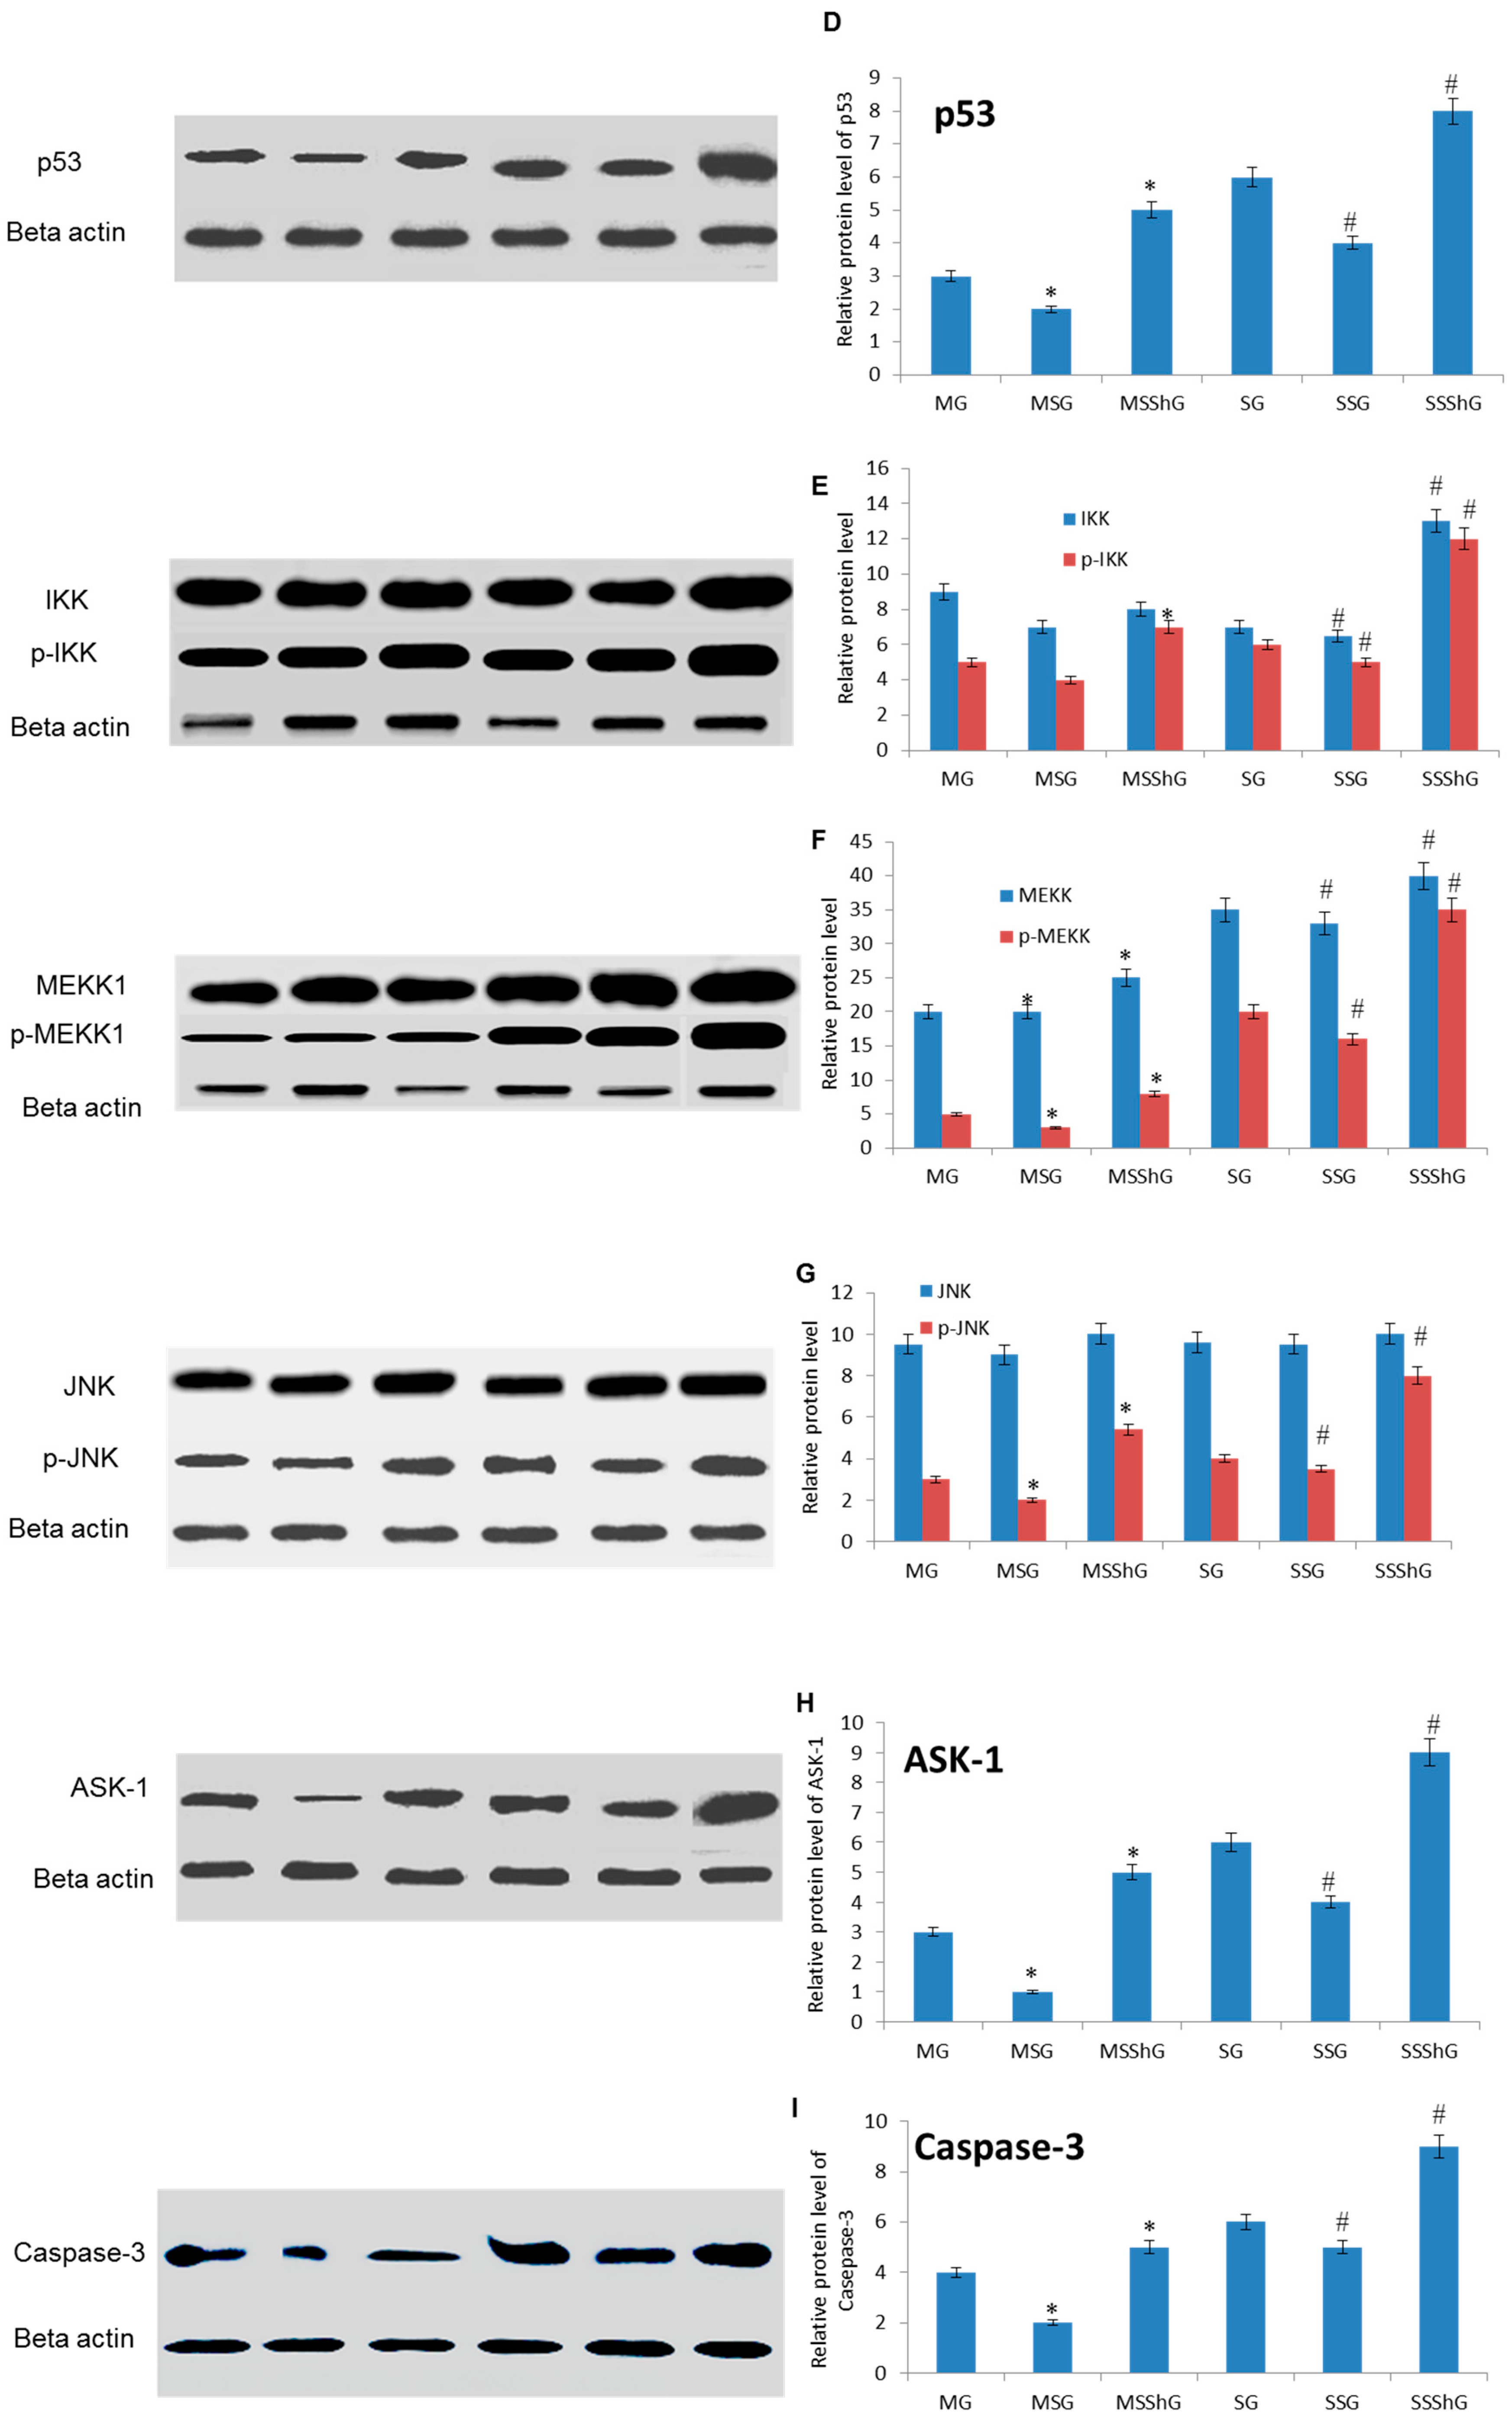
2.6. STC-1 Decreased the Protein Levels of ROS-Mediated Molecules

Just like the results from qRT-PCR, our results also showed that protein level of STC-1 increased after 4-h RIRI surgery when compared with that from a sham group (Figure 5A, p < 0.05). The protein level of STC-1 increased in MSG and SSG groups and decreased in SSG and SSShG groups (Figure 5A, p < 0.05), suggested the changes of mRNA levels results in the corresponding changes of protein levels of STC-1 in the mice.
In contrast, protein levels of PKC-α (Figure 5B), p-ERK, ERK (Figure 5C), p53 (Figure 5D), IKK (Figure 5E), p-MEKK, MEKK (Figure 5F), p-JNK (Figure 5G), ASK-1 (Figure 5H), caspase-3 (Figure 5I), and NF-κB (Figure 5J) decreased in the cells isolated from RIRI model when compared with the cells isolated from a sham group (p < 0.05). The overexpression of STC-1 decreased the protein level of PKC-α (Figure 5B), p-ERK, ERK (Figure 5C), p53 (Figure 5D), p-IKK, IKK (Figure 5E), p-MEKK, MEKK (Figure 5F), p-JNK, JNK (Figure 5G), ASK-1 (Figure 5H), caspase-3 (Figure 5I), and NF-κB (Figure 5J) in MSG and MSSG groups. On the other hand, STC-1 silence increased the protein levels of PKC-α (Figure 5B), p-ERK (Figure 5C), p53 (Figure 5D), IKK (Figure 5E), p-MEKK (Figure 5F), p-JNK (Figure 5G), ASK-1 (Figure 5H), caspase-3 (Figure 5I), and NF-κB (Figure 5J) in MSShG and SSShG groups (p < 0.05), suggested STC-1 reduces the protein level of PKC-α (Figure 5B), p-ERK (Figure 5C), p53 (Figure 5D), IKK (Figure 5E), p-MEKK (Figure 5F), p-JNK (Figure 5G), ASK-1 (Figure 5H), caspase-3 (Figure 5I), and NF-κB (Figure 5J). All the results suggest that the variance of STC-1 can affect the phosphate modification of some key enzymes, which are closely related with the functions of these proteins. Comparatively, the changes for the ratios of non-phosphate proteins and phosphate protein were significant in JNK, ERK and MEKK but not for IKK (p < 0.05) (Figure 5K). STC-1 significantly affects the phosphate situation of JNK, ERK and MEKK.

3. Discussion

Present findings suggest that overexpression of STC-1 repairs the injury of RIRI mouse model from three main aspects: improving the anti-oxidant activity of RIRI mouse model by improving the levels of SOD and reducing MDA level; increasing the anti-inflammation activity of RIRI mouse model by reducing the concentrations of IL-6 and IFN-γ; and inhibiting the apoptosis activity of RIRI mouse model by decreasing the levels of p53 and capase-3. However, many of these functions cannot performed by STC-1 alone since it can affect the levels of many other cytokines. Thus, present work mainly focuses on the relationship between STC-1 and multiple pathways.
Much work showed that STC-1 has protective functions for normal physiological activity of cells [13] as an anti-inflammatory factor [13,15,37,38]. In macrophages, STC-1 affects macrophage mobility by inhibiting intracellular calcium signaling pathway or suppressing the generation of superoxide species [39]. Other research showed that STC-1 inhibited inflammatory signaling by affecting the levels of nuclear factor NF-κB and Jun N-terminal kinase [40]. All of these results suggest there are more other molecular mechanisms for anti-inflammatory activity of STC-1 and a number of novel mechanisms need to be explored to understand the functions of STC-1 well.
Present results showed that STC-1 affected at least four ROS-mediated signaling pathways (Figure 6).
(1) Hypoxic condition inhibits ROS generation and intracellular Ca2+ overload [41] while overexpression of STC-1 reduces the level of ROS [17]. STC-1 inhibits the Ca2+ level by controlling ROS production (Figure 6). Meanwhile, the reduce of Ca2+ level controls ASK-1- and caspase-3-induced apoptosis [42]. Therefore, STC-1 prevents the development of kidney apoptosis by affecting ROS-mediated ASK-1 pathway [43].
(2) PKC deletion has been reported to increase the survival rate and to attenuate the kidney injury [44]. However, present results showed that the level of PKC increased when STC-1 was overexpressed, and the level of PKC increased when STC-1 gene was blocked (Figure 4 and Figure 5). ERK-1 signaling pathway plays an important role in the balance for the cell death and proliferation. ERK-1 is necessary for repairing the damage of tubular epithelial cells and inhibiting the fibrosis caused by renal injury [45]. Here, we also found that the overexpression of STC-1 reduced the level of ERK-1 (Figure 4 and Figure 5). For NF-κB, it has been widely report to accelerate the renal injury [46,47]. Toll-like receptor 4 can mediate inflammatory responses after renal injury. AT13387 is an inhibitor of heat shock protein 90, which can repair renal injury with low toxicity. AT13387 treatment can inhibit the activity of NF-κB, which can abolish Toll-like receptor 4-mediated NF-κB activity via hyaluronan. AT13387 is a potential drug for repressing the inflammatory activity caused by NF-κB [47]. Our results indicated that the overexpression of STC-1 decreased the level of NF-κB while the deletion of STC-1 increased the level of p-NF-κB (Figure 4D and Figure 5D). The result accelerates the repair of RIRI. PKC/ERK/NF-κB pathway promotes cell apoptosis by affecting the level of p53 [48]. Thus, STC-1 prevents the development of kidney cell apoptosis by affecting ROS-mediated PKC/ERK/NF-κB pathways (Figure 6).
(3) JNK and its upstream activator p-MEKK-1, stress-activated kinase, regulate cell growth and apoptosis [49]. Previous work showed that aloeemodin-mediated photodynamic therapy induced the autophagy and apoptosis of human cells by activating ROS-JNK signaling pathway [50]. Present results showed that the increase of STC-1 reduced the level of PMEKK-1 and JNK (Figure 4, Figure 5 and Figure 6), suggesting that STC-1 affects cell apoptosis by affecting ROS-mediated MEKK-JNK pathway (Figure 6).
(4) ROS acting as the upstream molecule of NF-κB, also affects IKK-NF-κB pathway [30]. Previous work showed that IKK expression and NF-κB secretion can increase rheumatoid arthritis synovial fibroblasts apoptosis by improving the level of IL-6 and CD147 [51]. IKK/NF-κB signaling pathway plays a critical role in the tissue injury by affecting cell apoptosis [52]. Thus, IKK-NF-κB pathway is associated with the cell apoptosis and inflammation. Present results showed that the increase of STC-1 reduced the level of IKK and NF-κB (Figure 4, Figure 5 and Figure 6), suggesting that STC-1 affects cell apoptosis and inflammation by affecting ROS-mediated IKK-NF-κ pathways (Figure 6).
Moreover, our results showed that STC-1 overexpression and knockout affected the phosphate-modification ERK, IKK, JNK, and MEKK-1, which was seldom reported in the molecular mechanism for RIRI. Many data showed that NF-κB and JNK pathways are involved with the expression of IL-6 [53], while ERK and JNK pathways are involved with the expression of IFN [54]. SOD expression suppressed JNK and p38 phosphorylation, and attenuated intracellular injury [55]. These results suggest that STC-1 protects a mouse model from RIRI by affecting SOD-mediated multiple pathways and increasing anti-oxidant, anti-apoptosis and immune activity in kidney cells.
Although many molecules were investigated, present work was still limited. Many interactions among these important molecules involving in the progression of renal injury were not considered here. The molecules affecting the expression of IL-6, IFN-γ and SOD were not explored either. On the other hand, all ROS-mediated pathways are not independent and they affect each other. Finally, the detail molecular mechanism remains unknown although the modification is an important factor for the activities of these molecules. Therefore, much work needs to be done to confirm the mechanism in detail.

4. Materials and Methods

4.1. Materials

A plasmid shuttle for packaged Adeno-associated virus (AAV), pSNAV, was purchased from AGTC Gene Technology (Beijing, China). Lentiviral vector pLL3.7 was purchased from Shanghai CPG Biotech Co., Ltd. (Shanghai, China). ELISA for stanniocalcin-1 (STC-1) (Production No. SEC874Mu) ELISA Kit for mouse p53 (Product No., SEA928Mu), ELISA Kit for mouse caspase 3 (Product No., SEA626Mu), ELISA Kit for mouse interleukin-6 (Production No., SCA079Mu) and ELISA Kit for mouse IFN-γ (Production No., SCA049Mu), were purchased from Wuhan USCN Business Co., Ltd. (Wuhan, China). The following antibodies were purchased from Santa Cruz Biotech (Dallas, TX, USA): Rabbit anti-mouse STC-1 antibody (Cat. No. sc-30183, dilution 1:1000), rabbit anti-mouse NF- κB antibody (Cat. No. sc-372, dilution 1:1000), rabbit anti-mouse p53 antibody (Cat. No. sc-1311-R, dilution 1:1000), rabbit anti-mouse ASK-1 antibody (Cat. No. sc-7931, dilution 1:1000), rabbit anti-mouse caspase-3 antibody (Cat. No. sc-7148, dilution 1:1000), rabbit anti-mouse p-MEKK-1 antibody (Cat. No. sc-130202, dilution 1:1000), mouse anti-mouse p-MEKK-1 antibody (Cat. No. sc-219, dilution 1:1000), rabbit anti-mouse p-JNK antibody (Cat. No. sc-135642, dilution 1:1000), rabbit anti-mouse JNK antibody (Cat. No. sc-571, dilution 1:1000), rabbit anti-mouse p-ERK antibody (Cat. No. sc-16982-R, dilution 1:1000), rabbit anti-mouse ERK antibody (Cat. No. sc-94, dilution 1:1000), rabbit anti-mouse p-IKK antibody (Cat. No. sc-21661-R, dilution 1:1000), rabbit anti-mouse IKK antibody (Cat. No. sc-10760, dilution 1:1000) and rabbit anti-mouse PKC antibody (Cat. No. sc-10800, dilution 1:1000), rabbit anti-mouse B-Actin antibody (Cat. No. sc-130656, dilution 1:1000) and Goat anti-rabbit horseradish peroxidase-conjugated secondary antibody (IgG-HRP, Cat. No. Sc-2004, dilution 1:5000). A total of 64 male C57BL/6 mice (25 to 35 g, four weeks) were purchased from animal center of Chongqing University (Chongqing, China).

4.2. Establishment of Renal Ischemia-Reperfusion Model

All protocols were conducted based on the guidance for the use of laboratory animals [56] and approved by ethics review board of China Medical University. Briefly, eight male C57BL/6 mice were anesthetized using pentobarbital at 40 mg/kg, received bilateral flank incisions and exposed the renal pedicles. Non-traumatic vascular clamps (Roboz Surgical Instrument Co., Gaithersburg, MD, USA) were used to clamp each renal pedicle for 30 min. Kidney turned into dark brown, suggesting that ischemia was established successfully. After 30-min ischemia, the clamps were removed, kidney recovered as red, suggesting that blood re-perfused successfully. Eight sham animals received the similar surgical operation but no clamps for the renal pedicles. During the surgery, mice were treated with warm lamp and saline. Mice were sacrificed after 16-h RIRI surgery, blood was taken by cardiac puncturing (the samples would be used for the assay of creatinine clearance) and kidneys were obtained for the subsequent analysis.

4.3. Assessment of Renal Function

For urine collection at 0, 4, 8, 12 and 16 h, mice were placed in metabolic cages for 16 h before being killed in a euthanized way. Serum creatinine was measured by capillary electrophoresis (Beijing Kaiao Technology Development Co., Ltd., Beijing, China). Urine creatinine was measured by a creatinine assay kit according to manufacturer’s instructions of Sigma (Production No. MAK079, St. Louis, MO, USA).

4.4. Biodices Index Assay

The serum levels of IL-6, IFN-γ, p53, capase-3 and STC-1 were measured by Mouse IL-6 ELISA Kit (The Thermo Fisher Scientific, Inc., Cat. No. EM2IL6, Waltham, MA, USA), Mouse IFN-γ ELISA Kit (The Thermo Fisher Scientific, Inc., Cat. No. EM1001, Waltham, MA, USA), Mouse p53 ELISA Kit (The Thermo Fisher Scientific, Inc., Cat. No.62216, Waltham, MA, USA), Mouse caspase-3 ELISA Kit (The Thermo Fisher Scientific, Inc., Cat. No. EM1001, Waltham, MA, USA), mouse Sandwich ELISA (enzyme-linked immunosorbent assay) kit (LifeSpan Biosciences, Inc., Seattle, Cat. No. LS-F7190, WA, USA). The activity of SOD was measured as previously described [57]. SOD activity was assessed by referring the amounts of superoxide radicals produced by xanthine and xanthine oxidase. The final products were measured using steady-state fluorescence spectrofluorometer (HORIBA (China) Trading Co., Ltd., Shanghai, China) at 525 nm. The level of malondialdehyde (MDA) was measured by using a fluorometric method [57]. Briefly, 50-µL MDA buffer was added to ten-mL glass tubes with one-mL ddH2O. Final 29 mmol/L thiobarbituric acid was added and mixed. All samples were incubated with water at 98 °C for one h. The mixture was placed on ice for 10 min and 20-µL five M HCl was used, and agitated for ten min by adding 4-mL n-butanol. The butanol phase was separated by centrifugation at 2000 g for 10 min. The absorbing values were measured by using the same steady-state fluorescence spectrofluorometer.

4.5. Isolation of Renal Progenitor Cells from Renal Cortex of Mouse

Renal progenitor cells were isolated from the renal cortex of model and sham mice after 16-h RIRI surgery. Kidney was perfused via the aorta with the buffer (50 mM PBS and 80 U/mL heparin). Renal capsules were removed by using forceps. Isolated renal tissues were immersed in ice-cold DMEM medium. The tissues were was sliced and homogenized into 1 mm3 pieces, and resuspended in collagenase type IV solution (Collagenase type IV 1 mg/mL), Deoxyribonuclease 0.1 mg/mL, Bovine serum albumin (BSA) 1 mg/mL, and all regents were from Sigma Chemical Co (St. Louis, MO, USA). The mixture was cultured at 37 °C in with 100-rpm shaking for 15 min. The mixture was homogenized by pipetting ten times through a sterile transfer pipette. One-milliliter collagenase type IV solution was added and whole procedure was repeated three times. A total of 20-mL DMEM medium was added into the digestive solution. The suspension was centrifuged at 200 g for 5 min. The pellets were resuspended and washed by DMEM medium for three times. Renal progenitor cells were collected via density-gradient centrifugation of 45% (v/v) sterile Percoll solution. Isolated cells were washed three times with cold DMEM for next step.

4.6. Assay of Intracellular ROS

Intracellular ROS were measured using Dichloro-dihydro-fluorescein diacetate (DCFH-DA) assay according to previous report [58]. The isolated kidney cells were incubated with DCFH-DA (20 µM) in DMEM at 37 °C for half an hour. Subsequently, the medium was removed and the samples were washed three times by using PBS buffer. The fluorescence was measured by using a fluorescence plate reader (BMG Labtech, Ortenberg, Germany). The excitation wavelength was 485 nm and emission wavelength was 535 nm. Relative ROS generation was calculated as the percentage of fluorescence for the models over sham controls.

4.7. Construction of Plasmids

The recombinant adeno-associated virus pSNAV-STC-1 vectors were constructed according to a previous report [59]. Briefly, a mouse STC-1 gene was cloned by RT-PCR from mouse cDNA and inserted into pSNAV to construct pSNAV-STC-1, which encoded STC-1 under the control of the CMV promoter. The reconstructed plasmids were transferred to into NRK-52E cells using Lipofectamine 2000 (Invitrogen, Carlsbad, CA, USA). Subsequently, the confluent cells were infected by helper virus HSV1-rc/UL2 to construct rAAV2/1-STC-1 vectors. rAAV2/1-STC-1 vectors were purified by chloroform and NaCl. Chloroform (10%, v/v) was added to infected cells and incubated at 37 °C with vigorous shake until the mixture became clear, and then NaCl was added to final 1 mol/L. PEG 8000 was added to the final concentration of 8% (w/v) and centrifuged at 2000 g for 30 min, and the supernatant was discarded. The pellets were re-suspended in 20 mM PBS buffer (pH 8.0). An equal volume of chloroform was added and centrifuged at 5000 g for 30 min. The aqueous phases with the rAAV-STC-1 vectors were collected, aliquoted in high titer (1012 to 1013 particles/mL) and stored at −80 °C. NRK-52E cells were maintained in DMEM medium (Invitrogen, Carlsbad, CA, USA) with 10% FBS (Invitrogen, Carlsbad, CA, USA) and 2 mM l-glutamine. All the cells were cultured at 37 °C with 5% CO2.

4.8. Construction of STC-1 shRNA

ShRNA STC-1 was cloned into the XhoI and Hap I sites of pLL3.7 vector and packaging plasmids pRSVRev, pMDLgpRRE, and pMD.G were used for the third-generation lentiviral vector reconstruction. NRK-52E cells were cultured in flasks, trypsinized and seeded into flasks on the day before transduction. Lentiviral-shRNA was diluted to ten lentiviral particles/cell. After 48 h, the transduced cells were harvested and lentiviral-STC-1-shRNA was purified and diluted to 7.0 × 10⁶ particles/μL.

4.9. Groups

The RIRI model was evaluated by comparing the creatine clearance rate between RIRI models and sham controls. Isolated renal progenitor cells from sham and model mice were transfected with rAAV-STC-1 or 2-μL lentiviral-STC-1-shRNA particles. The mutant cells were further cultured in DMEM medium for 24 h. As Figure 7 showed, Among 16 mice, eight mice were used to create RIRI models as a model group and another eight mice were used as a sham group. Renal progenitor cells were isolated from the kidney cortex of RIRI model and sham mice after 16-h surgery. For the kidney cells isolated from eight model mice, they were further subdivided into three groups based on different treatment options (model group (MG); STC-1 expression group (MSG), the mice were transfected with STC-1 gene to overexpress STC-1; and STC-1 shRNA group (MSShG), the mice were transfected with STC-1 shRNA to knockdown STC-1). In the same way, the kidney cells from 8 sham mice were subdivided into another three groups based on different treatment options: sham groups (sham group (SG); STC-1 expression group (SSG), the mice were transfected with STC-1 gene to overexpress STC-1; and STC-1 shRNA group (SSShG), the mice were transfected with STC-1 shRNA to knockdown STC-1).

4.10. qRT-PCR (Real-Time Reverse Transcription-PCR)

Total RNA from kidney cells was isolated using TaKaRa MiniBEST Universal RNA Extraction Kit (TaKaRa Biotechnology (Dalian) Co., Ltd., Dalian, China). One-ug RNA from each sample was used for cDNA synthesis using TaKaRa RNA PCR Kit (AMV) Ver.2.1 (TaKaRa Biotechnology (Dalian) Co., Ltd., Dalian, China). QPCR was performed using the primers: STC-1, sense 5’-gaagtggttcgctgcctcaa-3’, antisense 5’-tgagtgtcaaatttagcagc-3’ (140 bp); PKC-α, sense 5’-gcccgcttcttcaagcaacc-3’, antisense 5’-ggacaagagaacgtaacgaa-3’ (160 bp); ERK, sense 5’-ctcaagatctgtgactttgg-3’, antisense 5’-ccaaatatcaatggacttgg-3’ (210 bp); p53, sense 5’-atggacgatctgttgctgcc-3’, antisense 5’-gagaagggacaaaagatgac-3’ (169 bp); NF-κB, sense 5’-taccttcaaatattagagca-3’, antisense 5’-tagttgcaaattttgacctg-3’ (140 bp); IKK, sense 5’-aacactaccagctacctgcg-3’, antisense 5’-ggctcccactggagcagtac-3’ (160 bp); MEKK-1, sense 5’-cggcagctgcgcaaagtgcg-3’, antisense 5’-tcggtaaggtgggcgccgcg-3’ (200 bp); JNK, sense 5’-agcaggaaggagcgtcccac-3’, antisense 5’-ctggagctggactgtagctg-3’ (140 bp); ASK-1, sense 5’-cgccctttgcgtccgtgggc-3’, antisense 5’-gcgctctccacgttccagaa-3’ (160 bp); caspase-3, sense 5’-gaagatgatgagacagaggc-3’, antisense 5’-tcttctgagcaaatgtctcc-3’ (140 bp); β actin: sense 5’-ttcccctccatcgtgggccg-3’, antisense 5’-gtcccagttggtaacaatgc-3’.

4.11. Western Blotting

All samples were suspended in RIPA buffer, homogenized by a homogenizer (Beijing Kwinbon Biotechnology CO., Ltd., Beijing, China) and centrifuged at 10,000 g for 30 min to remove tissue debris. The proteins in the mixture solution were separated by 12% SDS-PAGE, transferred to nitrocellulose membrane and incubated with the first antibodies for STC-1, ASK-1, PKC-α, p-ERK, ERK, p53, p-IKK, IKK, p-MEKK-1, MEKK-1, p-JNK, JNK, NF-κB, Casepase-3 and B actin. After wash with PBS containing 0.1% Tween-20, the membrane was incubated with IgG-HRP. The target proteins were viewed by chemiluminescence. The densitometric analysis was conducted by NIH ImageJ Software (National Institutes of Health, Bethesda, MA, USA).

4.12. Statistical Analysis

Data are expressed as means ± S.D. and are compared by one way analysis of variance (ANOVA) for different groups. Statistical significance of difference was defined by a p-value of less than 0.05.

5. Conclusions

STC-1 affected ROS-mediated ASK-1, IKK-NF-κB, PKC-ERK-NF-κB and MEKK-JNK pathways, especially through phospho-modifications of the respective proteins, resulting in the enhancement of anti-inflammation, anti-oxidant and anti-apoptosis activities, probably by affecting the levels of SOD, capase-3, p53, IL-6 and IFN-γ. The improvement of these activities may be the main molecular mechanisms for enhancing ischemic tolerance caused by RIRI, suggesting that STC-1 plays an important role in reducing RIRI by affecting ROS-mediated multiple pathways. To make sure of the conclusion, much work still needs to be done in the future.

Acknowledgments

The project was supported by The Youth Project from Shengjing Affiliated Hospital of China Medical University.

Author Contributions

Dajun Liu conceived and designed the experiments; Huiping Shang and Ying Liu performed the experiments; Ying Liu analyzed the data; Huiping Shang contributed reagents/materials/analysis tools; and Ying Liu wrote the paper.

Conflicts of Interest

The authors declare no conflict of interest. The founding sponsors had no role in the design of the study; in the collection, analyses, or interpretation of data; in the writing of the manuscript, and in the decision to publish the results.

Abbreviations

The following abbreviations are used in this manuscript:
ASK-1apoptosis signal-regulating kinase 1
STC-1stanniocalcin-1
RIRIrenal ischemia-reperfusion injury
ROSreactive oxygen species
IL-6interleukin-6
SODsuperoxide dismutase
MDAmalondialdehyde
IFNinterferon
p-MEKK-1phosphorylated mitogen-activated protein kinase kinase kinase
JNKc-Jun N-terminal kinase
NFnuclear factor
ERKextracellular signal-regulated kinase
IKKIkB kinase

References

  1. Jakobsson, S.; Graipe, A.; Huber, D.; Bjorklund, F.; Mooe, T. The risk of ischemic stroke after an acute myocardial infarction in patients with decreased renal function. Cerebrovasc. Dis. 2014, 37, 460–469. [Google Scholar] [CrossRef] [PubMed]
  2. Gao, Y.; Zeng, Z.; Li, T.; Xu, S.; Wang, X.; Chen, Z.; Lin, C. Polydatin inhibits mitochondrial dysfunction in the renal tubular epithelial cells of a rat model of sepsis-induced acute kidney injury. Anesth. Analg. 2015, 121, 1251–1260. [Google Scholar] [CrossRef] [PubMed]
  3. Benck, U.; Schnuelle, P.; Kruger, B.; Nowak, K.; Riester, T.; Mundt, H.; Lutz, N.; Jung, M.; Birck, R.; Kramer, B.K.; et al. Excellent graft and patient survival after renal transplantation from donors after brain death with acute kidney injury: A case-control study. Int. Urol. Nephrol. 2015, 47, 2039–2046. [Google Scholar] [CrossRef] [PubMed]
  4. Wahhabaghai, H.; Heidari, R.; Zeinoddini, A.; Soleyman-Jahi, S.; Golmanesh, L.; Rasoulian, B.; Akbari, H.; Foadoddoni, M.; Esmailidehaj, M. Hyperoxia-induced preconditioning against renal ischemic injury is mediated by reactive oxygen species but not related to heat shock proteins 70 and 32. Surgery 2015, 157, 1014–1022. [Google Scholar] [CrossRef] [PubMed]
  5. Khader, A.; Yang, W.L.; Kuncewitch, M.; Prince, J.M.; Marambaud, P.; Nicastro, J.; Coppa, G.F.; Wang, P. Novel resveratrol analogues attenuate renal ischemic injury in rats. J. Surg. Res. 2015, 193, 807–815. [Google Scholar] [CrossRef] [PubMed]
  6. Chen, H.; Wang, L.; Xing, B.Z.; Liu, X.H.; Chen, Z.Y.; Weng, X.D.; Qiu, T.; Liu, L. Ischemic postconditioning attenuates inflammation in rats following renal ischemia and reperfusion injury. Exp. Ther. Med. 2015, 10, 513–518. [Google Scholar] [CrossRef] [PubMed]
  7. Hashemi, M. The study of pentoxifylline drug effects on renal apoptosis and Bcl-2 gene expression changes following ischemic reperfusion injury in rat. Iran. J. Pharm. Res. 2014, 13, 181–189. [Google Scholar] [PubMed]
  8. Ma, D.; Lim, T.; Xu, J.; Tang, H.; Wan, Y.; Zhao, H.; Hossain, M.; Maxwell, P.H.; Maze, M. Xenon preconditioning protects against renal ischemic-reperfusion injury via HIF-1α activation. J. Am. Soc. Nephrol. 2009, 20, 713–720. [Google Scholar] [CrossRef] [PubMed]
  9. Yoshiko, Y.; Aubin, J.E.; Maeda, N. Stanniocalcin 1 (STC1) protein and mRNA are developmentally regulated during embryonic mouse osteogenesis: The potential of stc1 as an autocrine/paracrine factor for osteoblast development and bone formation. J. Histochem. Cytochem. 2002, 50, 483–492. [Google Scholar] [CrossRef] [PubMed]
  10. Ma, X.; Gu, L.; Li, H.; Gao, Y.; Li, X.; Shen, D.; Gong, H.; Li, S.; Niu, S.; Zhang, Y.; et al. Hypoxia-induced overexpression of stanniocalcin-1 is associated with the metastasis of early stage clear cell renal cell carcinoma. J. Transl. Med. 2015, 13, 56. [Google Scholar] [CrossRef] [PubMed]
  11. Block, G.J.; DiMattia, G.D.; Prockop, D.J. Stanniocalcin-1 regulates extracellular ATP-induced calcium waves in human epithelial cancer cells by stimulating ATP release from bystander cells. PLoS ONE 2010, 5, e10237. [Google Scholar] [CrossRef] [PubMed]
  12. Ellard, J.P.; McCudden, C.R.; Tanega, C.; James, K.A.; Ratkovic, S.; Staples, J.F.; Wagner, G.F. The respiratory effects of stanniocalcin-1 (STC-1) on intact mitochondria and cells: STC-1 uncouples oxidative phosphorylation and its actions are modulated by nucleotide triphosphates. Mol. Cell. Endocrinol. 2007, 264, 90–101. [Google Scholar] [CrossRef] [PubMed]
  13. Sheikh-Hamad, D. Mammalian stanniocalcin-1 activates mitochondrial antioxidant pathways: New paradigms for regulation of macrophages and endothelium. Am. J. Physiol. Renal. Physiol. 2010, 298, F248–F254. [Google Scholar] [CrossRef] [PubMed]
  14. Liu, D.; Huang, L.; Wang, Y.; Wang, W.; Wehrens, X.H.; Belousova, T.; Abdelrahim, M.; DiMattia, G.; Sheikh-Hamad, D. Human stanniocalcin-1 suppresses angiotensin II-induced superoxide generation in cardiomyocytes through UCP3-mediated anti-oxidant pathway. PLoS ONE 2012, 7, e36994. [Google Scholar]
  15. Tang, S.E.; Wu, C.P.; Wu, S.Y.; Peng, C.K.; Perng, W.C.; Kang, B.H.; Chu, S.J.; Huang, K.L. Stanniocalcin-1 ameliorates lipopolysaccharide-induced pulmonary oxidative stress, inflammation, and apoptosis in mice. Free Radic. Biol. Med. 2014, 71, 321–331. [Google Scholar] [CrossRef] [PubMed]
  16. Pan, J.S.; Huang, L.; Belousova, T.; Lu, L.; Yang, Y.; Reddel, R.; Chang, A.; Ju, H.; DiMattia, G.; Tong, Q.; et al. Stanniocalcin-1 inhibits renal ischemia/reperfusion injury via an AMP-activated protein kinase-dependent pathway. J. Am. Soc. Nephrol. 2015, 26, 364–378. [Google Scholar] [CrossRef] [PubMed]
  17. Huang, L.; Belousova, T.; Chen, M.; DiMattia, G.; Liu, D.; Sheikh-Hamad, D. Overexpression of stanniocalcin-1 inhibits reactive oxygen species and renal ischemia/reperfusion injury in mice. Kidney Int. 2012, 82, 867–877. [Google Scholar] [CrossRef] [PubMed]
  18. Durukan Tolvanen, A.; Westberg, J.A.; Serlachius, M.; Chang, A.C.; Reddel, R.R.; Andersson, L.C.; Tatlisumak, T. Stanniocalcin 1 is important for poststroke functionality, but dispensable for ischemic tolerance. Neuroscience 2013, 229, 49–54. [Google Scholar] [CrossRef] [PubMed]
  19. Harada, C. Role of apoptosis signal-regulating kinase 1 (ASK 1)-mediated signaling pathway during ischemic retinal injury. Nippon Ganka Gakkai Zasshi 2008, 112, 965–974. [Google Scholar] [PubMed]
  20. Hafeez, A.; Elmadhoun, O.; Peng, C.; Ding, J.Y.; Geng, X.; Guthikonda, M.; Ding, Y. Reduced apoptosis by ethanol and its association with PKC-δ and Akt signaling in ischemic stroke. Aging Dis. 2014, 5, 366–372. [Google Scholar] [PubMed]
  21. Jing, Y.; Liu, L.Z.; Jiang, Y.; Zhu, Y.; Guo, N.L.; Barnett, J.; Rojanasakul, Y.; Agani, F.; Jiang, B.H. Cadmium increases HIF-1 and VEGF expression through ROS, ERK, and AKT signaling pathways and induces malignant transformation of human bronchial epithelial cells. Toxicol. Sci. 2012, 125, 10–19. [Google Scholar] [CrossRef] [PubMed]
  22. Filichia, E.; Shen, H.; Zhou, X.; Qi, X.; Jin, K.; Greig, N.; Hoffer, B.; Luo, Y. Forebrain neuronal specific ablation of p53 gene provides protection in a cortical ischemic stroke model. Neuroscience 2015, 295, 1–10. [Google Scholar] [CrossRef] [PubMed]
  23. Li, L.; Huang, L.; Sung, S.S.; Lobo, P.I.; Brown, M.G.; Gregg, R.K.; Engelhard, V.H.; Okusa, M.D. NKT cell activation mediates neutrophil IFN-γ production and renal ischemia-reperfusion injury. J. Immunol. 2007, 178, 5899–5911. [Google Scholar] [CrossRef] [PubMed]
  24. Cuevas, B.D.; Abell, A.N.; Johnson, G.L. Role of mitogen-activated protein kinase kinase kinases in signal integration. Oncogene 2007, 26, 3159–3171. [Google Scholar] [CrossRef] [PubMed]
  25. Wang, L.W.; Chang, Y.C.; Chen, S.J.; Tseng, C.H.; Tu, Y.F.; Liao, N.S.; Huang, C.C.; Ho, C.J. TNFR1-JNK signaling is the shared pathway of neuroinflammation and neurovascular damage after LPS-sensitized hypoxic-ischemic injury in the immature brain. J. Neuroinflammation 2014, 11, 215. [Google Scholar] [CrossRef] [PubMed]
  26. Yang, J.; Pan, Y.; Li, X.; Wang, X. Atorvastatin attenuates cognitive deficits through Akt1/caspase-3 signaling pathway in ischemic stroke. Brain Res. 2015, 1629, 231–239. [Google Scholar] [CrossRef] [PubMed]
  27. Jiang, Y.; Zhu, Y.; Wang, X.; Gong, J.; Hu, C.; Guo, B.; Zhu, B.; Li, Y. Temporal regulation of HIF-1 and NF-κB in hypoxic hepatocarcinoma cells. Oncotarget 2015, 6, 9409–9419. [Google Scholar] [CrossRef] [PubMed]
  28. Ngo, H.K.; Lee, H.G.; Piao, J.Y.; Zhong, X.; Lee, H.N.; Han, H.J.; Kim, W.; Kim, D.H.; Cha, Y.N.; Na, H.K.; et al. Helicobacter pylori induces Snail expression through ROS-mediated activation of Erk and inactivation of GSK-3β in human gastric cancer cells. Mol. Carcinog. 2016. [Google Scholar] [CrossRef] [PubMed]
  29. Huo, Y.N.; Chen, W.; Zheng, X.X. ROS, MAPK/ERK and PKC play distinct roles in EGF-stimulated human corneal cell proliferation and migration. Cell. Mol. Biol. (Noisy-le-Grand) 2015, 61, 6–11. [Google Scholar]
  30. Fu, J.; Shi, Q.; Song, X.; Xia, X.; Su, C.; Liu, Z.; Song, E.; Song, Y. Tetrachlorobenzoquinone exhibits neurotoxicity by inducing inflammatory responses through ROS-mediated IKK/IκB/NF-κB signaling. Environ. Toxicol. Pharmacol. 2016, 41, 241–250. [Google Scholar] [CrossRef] [PubMed]
  31. Kaleem, S.; Siddiqui, S.; Siddiqui, H.H.; Badruddeen; Hussain, A.; Arshad, M.; Akhtar, J.; Rizvi, A. Eupalitin induces apoptosis in prostate carcinoma cells through ROS generation and increase of caspase-3 activity. Cell. Biol. Int. 2016, 40, 196–203. [Google Scholar] [CrossRef] [PubMed]
  32. Kim, S.J.; Ko, J.H.; Yun, J.-H.; Kim, J.-A.; Kim, T.E.; Lee, H.J.; Kim, S.H.; Park, K.H.; Oh, J.Y. Stanniocalcin-1 protects retinal ganglion cells by inhibiting apoptosis and oxidative damage. PLoS ONE 2013, 8, e63749. [Google Scholar] [CrossRef] [PubMed]
  33. Meng, Y.; Li, W.Z.; Shi, Y.W.; Zhou, B.F.; Ma, R.; Li, W.P. Danshensu protects against ischemia/reperfusion injury and inhibits the apoptosis of H9c2 cells by reducing the calcium overload through the p-JNK-NF-κB-TRPC6 pathway. Int. J. Mol. Med. 2016, 37, 258–266. [Google Scholar] [CrossRef] [PubMed]
  34. Duan, J.; Yang, Y.; Liu, H.; Dou, P.C.; Tan, S.Y. Osthole ameliorates acute myocardial infarction in rats by decreasing the expression of inflammatory-related cytokines, diminishing MMP-2 expression and activating p-ERK. Int. J. Mol. Med. 2016, 37, 207–216. [Google Scholar] [CrossRef] [PubMed]
  35. Kimura, A.; Ishida, Y.; Wada, T.; Hisaoka, T.; Morikawa, Y.; Sugaya, T.; Mukaida, N.; Kondo, T. The absence of interleukin-6 enhanced arsenite-induced renal injury by promoting autophagy of tubular epithelial cells with aberrant extracellular signal-regulated kinase activation. Am. J. Pathol. 2010, 176, 40–50. [Google Scholar] [CrossRef] [PubMed]
  36. Gao, S.; Oh, Y.B.; Park, B.M.; Park, W.H.; Kim, S.H. Urotensin II protects ischemic reperfusion injury of hearts through ROS and antioxidant pathway. Peptides 2012, 36, 199–205. [Google Scholar] [CrossRef] [PubMed]
  37. Ito, Y.; Zemans, R.; Correll, K.; Yang, I.V.; Ahmad, A.; Gao, B.; Mason, R.J. Stanniocalcin-1 is induced by hypoxia inducible factor in rat alveolar epithelial cells. Biochem. Biophys. Res. Commun. 2014, 452, 1091–1097. [Google Scholar] [CrossRef] [PubMed]
  38. Huang, L.; Garcia, G.; Lou, Y.; Zhou, Q.; Truong, L.D.; DiMattia, G.; Lan, X.R.; Lan, H.Y.; Wang, Y.; Sheikh-Hamad, D. Anti-inflammatory and renal protective actions of stanniocalcin-1 in a model of anti-glomerular basement membrane glomerulonephritis. Am. J. Pathol. 2009, 174, 1368–1378. [Google Scholar] [CrossRef] [PubMed]
  39. Kanellis, J.; Bick, R.; Garcia, G.; Truong, L.; Tsao, C.C.; Etemadmoghadam, D.; Poindexter, B.; Feng, L.; Johnson, R.J.; Sheikh-Hamad, D. Stanniocalcin-1, an inhibitor of macrophage chemotaxis and chemokinesis. Am. J. Physiol. Renal. Physiol. 2004, 286, F356–F362. [Google Scholar] [CrossRef] [PubMed]
  40. Chen, C.; Jamaluddin, M.S.; Yan, S.; Sheikh-Hamad, D.; Yao, Q. Human stanniocalcin-1 blocks TNF-α-induced monolayer permeability in human coronary artery endothelial cells. Arterioscler. Thromb. Vasc. Biol. 2008, 28, 906–912. [Google Scholar] [CrossRef] [PubMed]
  41. Sun, H.Y.; Wang, N.P.; Kerendi, F.; Halkos, M.; Kin, H.; Guyton, R.A.; Vinten-Johansen, J.; Zhao, Z.Q. Hypoxic postconditioning reduces cardiomyocyte loss by inhibiting ROS generation and intracellular Ca2+ overload. Am. J. Physiol. Heart. Circ. Physiol. 2005, 288, H1900–H1908. [Google Scholar] [CrossRef] [PubMed]
  42. Lee, J.-H.; Li, Y.-C.; Ip, S.-W.; Hsu, S.-C.; Chang, N.-W.; Tang, N.-Y.; Yu, C.-S.; Chou, S.-T.; Lin, S.-S.; Lin, C.-C. The role of Ca2+ in baicalein-induced apoptosis in human breast MDA-MB-231 cancer cells through mitochondria-and caspase-3-dependent pathway. Anticancer Res. 2008, 28, 1701–1711. [Google Scholar] [PubMed]
  43. Basu, K.; Mukhopadhyay, A.; Ghosh, I.; Datta, K. Nuclear morphology and c-Jun N-terminal kinase 1 expression differentiate serum-starved oxidative stress signalling from hydrogen peroxide-induced apoptosis in retinal neuronal cell line. Cell. Biol. Int. 2012, 36, 1021–1027. [Google Scholar] [CrossRef] [PubMed]
  44. Rong, S.; Hueper, K.; Kirsch, T.; Greite, R.; Klemann, C.; Mengel, M.; Meier, M.; Menne, J.; Leitges, M.; Susnik, N.; et al. Renal PKC-epsilon deficiency attenuates acute kidney injury and ischemic allograft injury via TNF-α-dependent inhibition of apoptosis and inflammation. Am. J. Physiol. Renal. Physiol. 2014, 307, F718–F726. [Google Scholar] [CrossRef] [PubMed]
  45. Jang, H.S.; Han, S.J.; Kim, J.I.; Lee, S.; Lipschutz, J.H.; Park, K.M. Activation of ERK accelerates repair of renal tubular epithelial cells, whereas it inhibits progression of fibrosis following ischemia/reperfusion injury. Biochim. Biophys. Acta 2013, 1832, 1998–2008. [Google Scholar] [CrossRef] [PubMed]
  46. Zhou, L.; Xu, D.Y.; Sha, W.G.; Shen, L.; Lu, G.Y.; Yin, X.; Wang, M.J. High glucose induces renal tubular epithelial injury via Sirt1/NF-κB/microR-29/Keap1 signal pathway. J. Transl. Med. 2015, 13, 352. [Google Scholar] [CrossRef] [PubMed]
  47. O'Neill, S.; Humphries, D.; Tse, G.; Marson, L.P.; Dhaliwal, K.; Hughes, J.; Ross, J.A.; Wigmore, S.J.; Harrison, E.M. Heat shock protein 90 inhibition abrogates TLR4-mediated NF-κB activity and reduces renal ischemia-reperfusion injury. Sci. Rep. 2015, 5, 12958. [Google Scholar] [CrossRef] [PubMed]
  48. Filip, G.A.; Postescu, I.D.; Bolfa, P.; Catoi, C.; Muresan, A.; Clichici, S. Inhibition of UVB-induced skin phototoxicity by a grape seed extract as modulator of nitrosative stress, ERK/NF-κB signaling pathway and apoptosis, in SKH-1 mice. Food Chem. Toxicol. 2013, 57, 296–306. [Google Scholar] [CrossRef] [PubMed]
  49. DeFuria, J.; Chen, P.; Shea, T.B. Divergent effects of the MEKK-1/JNK pathway on NB2a/d1 differentiation: Some activity is required for outgrowth and stabilization of neurites but overactivation inhibits both phenomena. Brain Res. 2006, 1123, 20–26. [Google Scholar] [CrossRef] [PubMed]
  50. Tu, P.; Huang, Q.; Ou, Y.; Du, X.; Li, K.; Tao, Y.; Yin, H. Aloe-emodin-mediated photodynamic therapy induces autophagy and apoptosis in human osteosarcoma cell line MG63 through the ROS/JNK signaling pathway. Oncol. Rep. 2016, 35, 3209–3215. [Google Scholar] [PubMed]
  51. Zhai, Y.; Wu, B.; Li, J.; Yao, X.Y.; Zhu, P.; Chen, Z.N. CD147 promotes IKK/IκB/NF-κB pathway to resist TNF-induced apoptosis in rheumatoid arthritis synovial fibroblasts. J. Mol. Med. (Berl.) 2016, 94, 71–82. [Google Scholar] [CrossRef] [PubMed]
  52. Wei, H.Y.; Ma, X. Tamoxifen reduces infiltration of inflammatory cells, apoptosis and inhibits IKK/NF-κB pathway after spinal cord injury in rats. Neurol. Sci. 2014, 35, 1763–1768. [Google Scholar] [CrossRef] [PubMed]
  53. Bhargavan, B.; Woollard, S.M.; Kanmogne, G.D. Data in support of NF-κB and JNK pathways involvement in TLR3-mediated HIV-1 transactivation, expression of IL-6 and transcription factors associated with HIV-1 replication. Data Brief. 2016, 6, 345–351. [Google Scholar] [CrossRef] [PubMed]
  54. Deng, J.; Qian, Y.; Geng, L.; Xie, H.; Wang, Y.; Jiang, G.; Zhou, L.; Zhang, M.; Zheng, S. Involvement of ERK and JNK pathways in IFN-γ-induced B7-DC expression on tumor cells. J. Cancer Res. Clin. Oncol. 2011, 137, 243–250. [Google Scholar] [CrossRef] [PubMed]
  55. Afonso, V.; Santos, G.; Collin, P.; Khatib, A.M.; Mitrovic, D.R.; Lomri, N.; Leitman, D.C.; Lomri, A. Tumor necrosis factor-α down-regulates human Cu/Zn superoxide dismutase 1 promoter via JNK/AP-1 signaling pathway. Free Radic. Biol. Med. 2006, 41, 709–721. [Google Scholar] [CrossRef] [PubMed]
  56. Bayne, K. Revised guide for the care and use of laboratory animals available. American Physiological Society. Physiologist 1996, 39, 199 and 208–211. [Google Scholar] [PubMed]
  57. Balahoroglu, R.; Dulger, H.H.; Ozbek, H.; Bayram, I.; Sekeroglu, M.R. Protective effects of antioxidants on the experimental liver and kidney toxicity in mice. Clin. Chem. 2006, 52, A3. [Google Scholar]
  58. Song, J.L.; Choi, J.H.; Seo, J.H.; Kil, J.H.; Park, K.Y. Antioxidative effects of fermented sesame sauce against hydrogen peroxide-induced oxidative damage in LLC-PK1 porcine renal tubule cells. Nutr. Res. Pract. 2014, 8, 138–145. [Google Scholar] [CrossRef] [PubMed]
  59. Song, L.K.; Ma, K.L.; Yuan, Y.H.; Mu, Z.; Song, X.Y.; Niu, F.; Han, N.; Chen, N.H. Targeted overexpression of α-synuclein by rAAV2/1 vectors induces progressive nigrostriatal degeneration and increases vulnerability to MPTP in mouse. PLoS ONE 2015, 10, e0131281. [Google Scholar] [CrossRef] [PubMed]
Figure 1. Creatinine clearance rate in mice. RIRI, Renal ischemia-reperfusion injury. All data were presented as mean values ± S.D. n = eight in each group. * p < 0.05 compared to the sham group.
Ijms 17 01051 g001
Figure 2. The serum biochemical and immunological parameters in different treated mice: (A) the serum protein levels of IL-6; (B) the serum protein levels of IFN-γ; (C) the serum protein levels of p53; (D) the serum protein levels of caspase-3; (E) the serum activity of SOD; (F) the serum protein levels of MDA; and (G) the serum protein levels of STC-1. Among 16 mice, eight mice were used to create RIRI models and another eight mice were used as a sham group. All data were presented as mean values ± S.D. * p < 0.05 compared to the model group.
Ijms 17 01051 g002
Figure 3. ROS production in different cells. Among 16 mice, eight mice were used to create RIRI models as a model group and eight mice were used as a sham group. Renal progenitor cells were isolated from the kidney cortex of RIRI model and sham mice after 16-h surgery. For the kidney cells isolated from eight model mice, they were further subdivided into three groups based on different treatment options (model group (MG); STC-1 expression group (MSG), the mice were transfected with STC-1 gene to overexpress STC-1; and STC-1 shRNA group (MSShG), the mice were transfected with STC-1 shRNA to knockdown STC-1). In the same way, the kidney cells from eight sham mice were subdivided into another three groups based on different treatment options sham groups (sham group (SG); STC-1 expression group (SSG), the mice were transfected with STC-1 gene to overexpress STC-1; and STC-1 shRNA group (SSShG), the mice were transfected with STC-1 shRNA to knockdown STC-1). The ROS levels were measured from all the cells cultured for 24 h. All data were presented as the mean values ± S.D. * p < 0.05 via a model group and # p < 0.05 via a sham group.
Ijms 17 01051 g003
Figure 4. The effects of STC-1 on the mRNA levels of ROS-mediated molecules. Among 16 mice, eight mice were used to create RIRI models as a model group and eight mice were used as a sham group. Renal progenitor cells were isolated from the kidney cortex of RIRI model and sham mice after 16-h surgery. For the kidney cells isolated from eight model mice, they were further subdivided into three groups based on different treatment options (model group (MG); STC-1 expression group (MSG), the mice were transfected with STC-1 gene to overexpress STC-1; and STC-1 shRNA group (MSShG), the mice were transfected with STC-1 shRNA to knockdown STC-1). In the same way, the kidney cells from 8 sham mice were subdivided into another three groups based on different treatment options (sham group (SG); STC-1 expression group (SSG), the mice were transfected with STC-1 gene to overexpress STC-1; and STC-1 shRNA group (SSShG), the mice were transfected with STC-1 shRNA to knockdown STC-1). The mRNA levels were measured from the same part of renal tissues obtained after 4-h surgery: (A) the changes of mRNA levels of STC-1 in different groups; (B) the changes of mRNA levels of PKC-α in different groups; (C) the changes of mRNA levels of ERK in different groups; (D) the changes of mRNA levels p53 in different groups; (E) the changes of mRNA levels of IKK in different groups; (F) the changes of mRNA levels of MEKK-1 in different groups; (G) the changes of mRNA levels of JNK in different groups; (H) the changes of mRNA levels of ASK-1 in different groups; (I) the changes of mRNA levels of caspase-3 in different groups; and (J) the changes of mRNA levels of NF-κB in different groups. All data were normalized to actin, and presented as the mean values ± S.D. * p < 0.05 compared to the model group and # p < 0.05 compared to the sham group.
Ijms 17 01051 g004
Figure 5. The effects of STC-1 on the protein levels of PKC-α, p-IKK, p-MEKK-1, p-NF-κB and caspase-3. Among 16 mice, eight mice were used to create RIRI models as a model group and eight mice were used as a sham group. Renal progenitor cells were isolated from the kidney cortex of RIRI model and sham mice after 16-h surgery. For the kidney cells isolated from eight model mice, they were further subdivided into three groups based on different treatment options (model group (MG); STC-1 expression group (MSG), the mice were transfected with STC-1 gene to overexpress STC-1; and STC-1 shRNA group (MSShG), the mice were transfected with STC-1 shRNA to knockdown STC-1). In the same way, the kidney cells from 32 sham mice were subdivided into another three groups based on different treatment options (sham group (SG); STC-1 expression group (SSG), the mice were transfected with STC-1 gene to overexpress STC-1; and STC-1 shRNA group (SSShG), the mice were transfected with STC-1 shRNA to knockdown STC-1). The mRNA levels were measured from the same part of renal tissues obtained after 4-h surgery: (A) the changes of protein levels of STC-1 in different groups; (B) the changes of protein levels of PKC-α in different groups; (C) the changes of protein levels of p-ERK in different groups; (D) the changes of protein levels p53 in different groups; (E) the changes of protein levels of p-IKK in different groups; (F) the changes of protein levels of p-MEKK-1 in different groups; (G) the changes of protein levels of p-JNK in different groups; (H) the changes of protein levels of ASK-1 in different groups; (I) the changes of protein levels of caspase-3 in different groups; (J) the changes of protein levels of NF-κB in different groups; and (K) the ratio of non-phosphate proteins and phosphate proteins. All data were normalized to actin, and presented as the mean values ± S.D. * p < 0.05 via model group and # p < 0.05 via sham group.
Ijms 17 01051 g005aIjms 17 01051 g005bIjms 17 01051 g005c
Figure 6. STC-1 acts a modulator for renal injury via affecting ROS-mediated multiple pathways. STC-1 is an effective ROS scavenger, which affects the levels of phosphorylated mitogen-activated protein kinase kinase kinase (p-MEKK-1), c-Jun N-terminal kinase (p-JNK), nuclear factor (NF) κB, extracellular signal-regulated kinase (p-ERK), IkB kinase (p-IKK), apoptosis signal-regulating kinase 1 (ASK-1), p53 and caspase-3. STC-1 affects ROS-mediated IKK-NF-κB, PKC-ERK-NF-κB, ASK-1-NF-κB, p53 and MEKK-JNK pathways, and improves anti-inflammation, anti-oxidant and anti-apoptosis activities by increasing level of superoxide dismutase (SOD) and reducing the level of capase-3, p53, interleukin-6 (IL-6) and IFN-γ.
Ijms 17 01051 g006
Figure 7. The flowchart of the study. Among 16 mice, eight mice were used to create RIRI models as a model group and another eight mice were used as a sham group. The RIRI model was evaluated by comparing the creatine clearance rate between RIRI models and sham controls. The serum levels of interleukin-6 (IL-6), interferon (IFN) γ, P53, capase-3, superoxide dismutase (SOD) and malondialdehyde (MDA) were measured in these mice. Renal progenitor cells were isolated from the kidney cortex of RIRI model and sham mice after 16-h surgery. For the kidney cells isolated from eight model mice, they were further subdivided into three groups based on different treatment options (model group (MG); STC-1 expression group (MSG), the mice were transfected with STC-1 gene to overexpress STC-1; and STC-1 shRNA group (MSShG), the mice were transfected with STC-1 shRNA to knockdown STC-1). In the same way, the kidney cells from 32 sham mice were subdivided into another three groups based on different treatment options (sham group (SG); STC-1 expression group (SSG), the mice were transfected with STC-1 gene to overexpress STC-1; and STC-1 shRNA group (SSShG), the mice were transfected with STC-1 shRNA to knockdown STC-1). Real-time quantitative PCR and Western blot analysis analyzed the levels of Stanniocalcin-1 (STC-1), apoptosis signaling kinase (ASK-1), protein kinase C (PKC-α), phosphate mitogen-activated protein kinase kinase kinase (p-MEKK-1), MEKK-1, phosphate c-Jun N-terminal kinase (p-JNK), JNK, nuclear factor (NF) κB, phosphate extracellular signal-regulated kinase (p-ERK), ERK, phosphate IkB kinase (p-IKK), IKK, and caspase-3.
Ijms 17 01051 g007

