Article

Anion Channel Inhibitor NPPB-Inhibited Fluoride Accumulation in Tea Plant (Camellia sinensis) Is Related to the Regulation of Ca2+, CaM and Depolarization of Plasma Membrane Potential

1
State Key Laboratory of Tea Plant Biology and Utilization, Anhui Agricultural University, Hefei 230036, China
2
School of Resources and Environment, Anhui Agricultural University, Hefei 230036, China
3
College of Resources and Environmental Science, Nanjing Agricultural University, Nanjing 210095 China
4
School of Land and Food, University of Tasmania, Hobart, Tasmania 7001, Australia
*
Author to whom correspondence should be addressed.
These authors contributed equally to this work.
Int. J. Mol. Sci. 2016, 17(1), 57; https://doi.org/10.3390/ijms17010057
Submission received: 4 December 2015 / Revised: 20 December 2015 / Accepted: 22 December 2015 / Published: 5 January 2016
(This article belongs to the Special Issue Plant Molecular Biology)

Abstract

:
Tea plant is known to be a hyper-accumulator of fluoride (F). Over-intake of F has been shown to have adverse effects on human health, e.g., dental fluorosis. Thus, understanding the mechanisms fluoride accumulation and developing potential approaches to decrease F uptake in tea plants might be beneficial for human health. In the present study, we found that pretreatment with the anion channel inhibitor NPPB reduced F accumulation in tea plants. Simultaneously, we observed that NPPB triggered Ca2+ efflux from mature zone of tea root and significantly increased relative CaM in tea roots. Besides, pretreatment with the Ca2+ chelator (EGTA) and CaM antagonists (CPZ and TFP) suppressed NPPB-elevated cytosolic Ca2+ fluorescence intensity and CaM concentration in tea roots, respectively. Interestingly, NPPB-inhibited F accumulation was found to be significantly alleviated in tea plants pretreated with either Ca2+ chelator (EGTA) or CaM antagonists (CPZ and TFP). In addition, NPPB significantly depolarized membrane potential transiently and we argue that the net Ca2+ and H+ efflux across the plasma membrane contributed to the restoration of membrane potential. Overall, our results suggest that regulation of Ca2+-CaM and plasma membrane potential depolarization are involved in NPPB-inhibited F accumulation in tea plants.

Graphical Abstract

1. Introduction

Fluoride (F) is phytotoxic to most plants by influencing a series of basal metabolism and enzyme activities [1]; however, it can be accumulated in tea plants. Fluoride content in tea leaves ranges from hundreds to thousands of milligrams, which is 20 to 30 times higher than that of other edible plants [2]. Approximately 40% to 90% of fluoride in tea leaves can be dissolved in tea-based liquids and accumulated in the human body through tea drinking [3]. The uptake of fluoride through drinking tea with normal fluoride concentrations is somewhat considered to be safe and even beneficial to health; however, over-intake of fluoride through excessive daily consumption of brick tea causes dental and skeletal fluorosis [4,5]. As tea plants are F hyper-accumulators, understanding the underlying mechanisms beyond F accumulation is beneficial to control F accumulation in tea plants in agricultural practices. Previous study found that anion channel inhibitor A-9-C (anthracene-9-carboxylic acid) or NFA (niflumic acid) significantly blocked F net uptake (Longjing 43) [6]. In our lab, we reported that an anion channel inhibitor NPPB (5-nitro -2-(3-phenylpropylamino) benzoic acid) inhibited anion channels activity in tea roots and significantly reduced F accumulation in tea plants (Fuding) [7]. However, the possible mechanism involved in NPPB-inhibited F uptake in tea plants via anion channels was not yet investigated and still largely unknown.
Anion channels, integral membrane proteins that form aqueous pores, regulate transport of anions across the membrane [8,9]. Most anion channels are located on plant membranes, such as the plasma membrane [10,11], tonoplast [12], and mitochondria membrane [13]. Nevertheless, several lines of evidences have shown that Ca2+, acts as a ubiquitous intracellular signal messenger, modulating anion channels distributed at the plasma membranes in higher plants [14,15]. For example, the increase in Ca2+ concentration-activated anion channels was found in guard cells [16], pollen tubes [17], and Nicotiana tabacum [18]. In addition, ABA (abscisic acid) or pathogen-regulated Ca2+ oscillations activated anion channels in Arabidopsis thaliana guard cells and root [19,20].
Ca2+ signatures are decoded by several Ca2+ sensors such as calmodulin (CaM), calcium-dependent protein kinase (CDPK), and calcineurin B-like protein (CBL). CaM is a small acidic protein that contains four EF (elongation factor) hands, and is one of the best-characterized Ca2+ receptors [21]. The binding of Ca2+ to CaM induces a conformational change of ion channel [22,23,24,25]. Furthermore, most anion channels belong to the class of voltage-dependence, and regulate anion influx and efflux in plant root through controlling their open and closed states according to the electrochemical gradients [26,27,28]. NA (niflumic acid) induced membrane depolarization and depressed anion channel activity in maize roots, thereby regulating NO3 and Cl efflux [29]. Besides in anion channels, modulation of membrane potential was also found to be involved in regulating other ion channels, e.g., the K+ channel [30]. However, the connection between Ca–CaM, anion channels, and membrane potential in F accumulation in tea plants is still obscure.
To investigate whether Ca2+ and CaM integrated in NPPB inhibited F accumulation in tea plants, Ca2+ flux, intracellular Ca2+ fluorescence intensity, and CaM level in tea roots were examined. Additionally, Ca2+ chelator EGTA (ethylene glycol tetraacetic acid), CaM antagonist CPZ (chlorpromazine hydrochloride), and TFP (trifluoperazine dihydrochloride) were also used to investigate the role of Ca2+ and CaM in the NPPB-inhibited F accumulation in tea plants. Further, we studied membrane potential, net H+ flux, and plasma membrane H+-ATPase activity in tea roots to investigate the possible role of regulation of membrane potential in NPPB-inhibited F accumulation in tea plants. Taken together, the present study offers some potential clues to benefit the understanding of possible regulation mechanisms beyond NPPB-inhibited F accumulation in tea plants.

2. Results

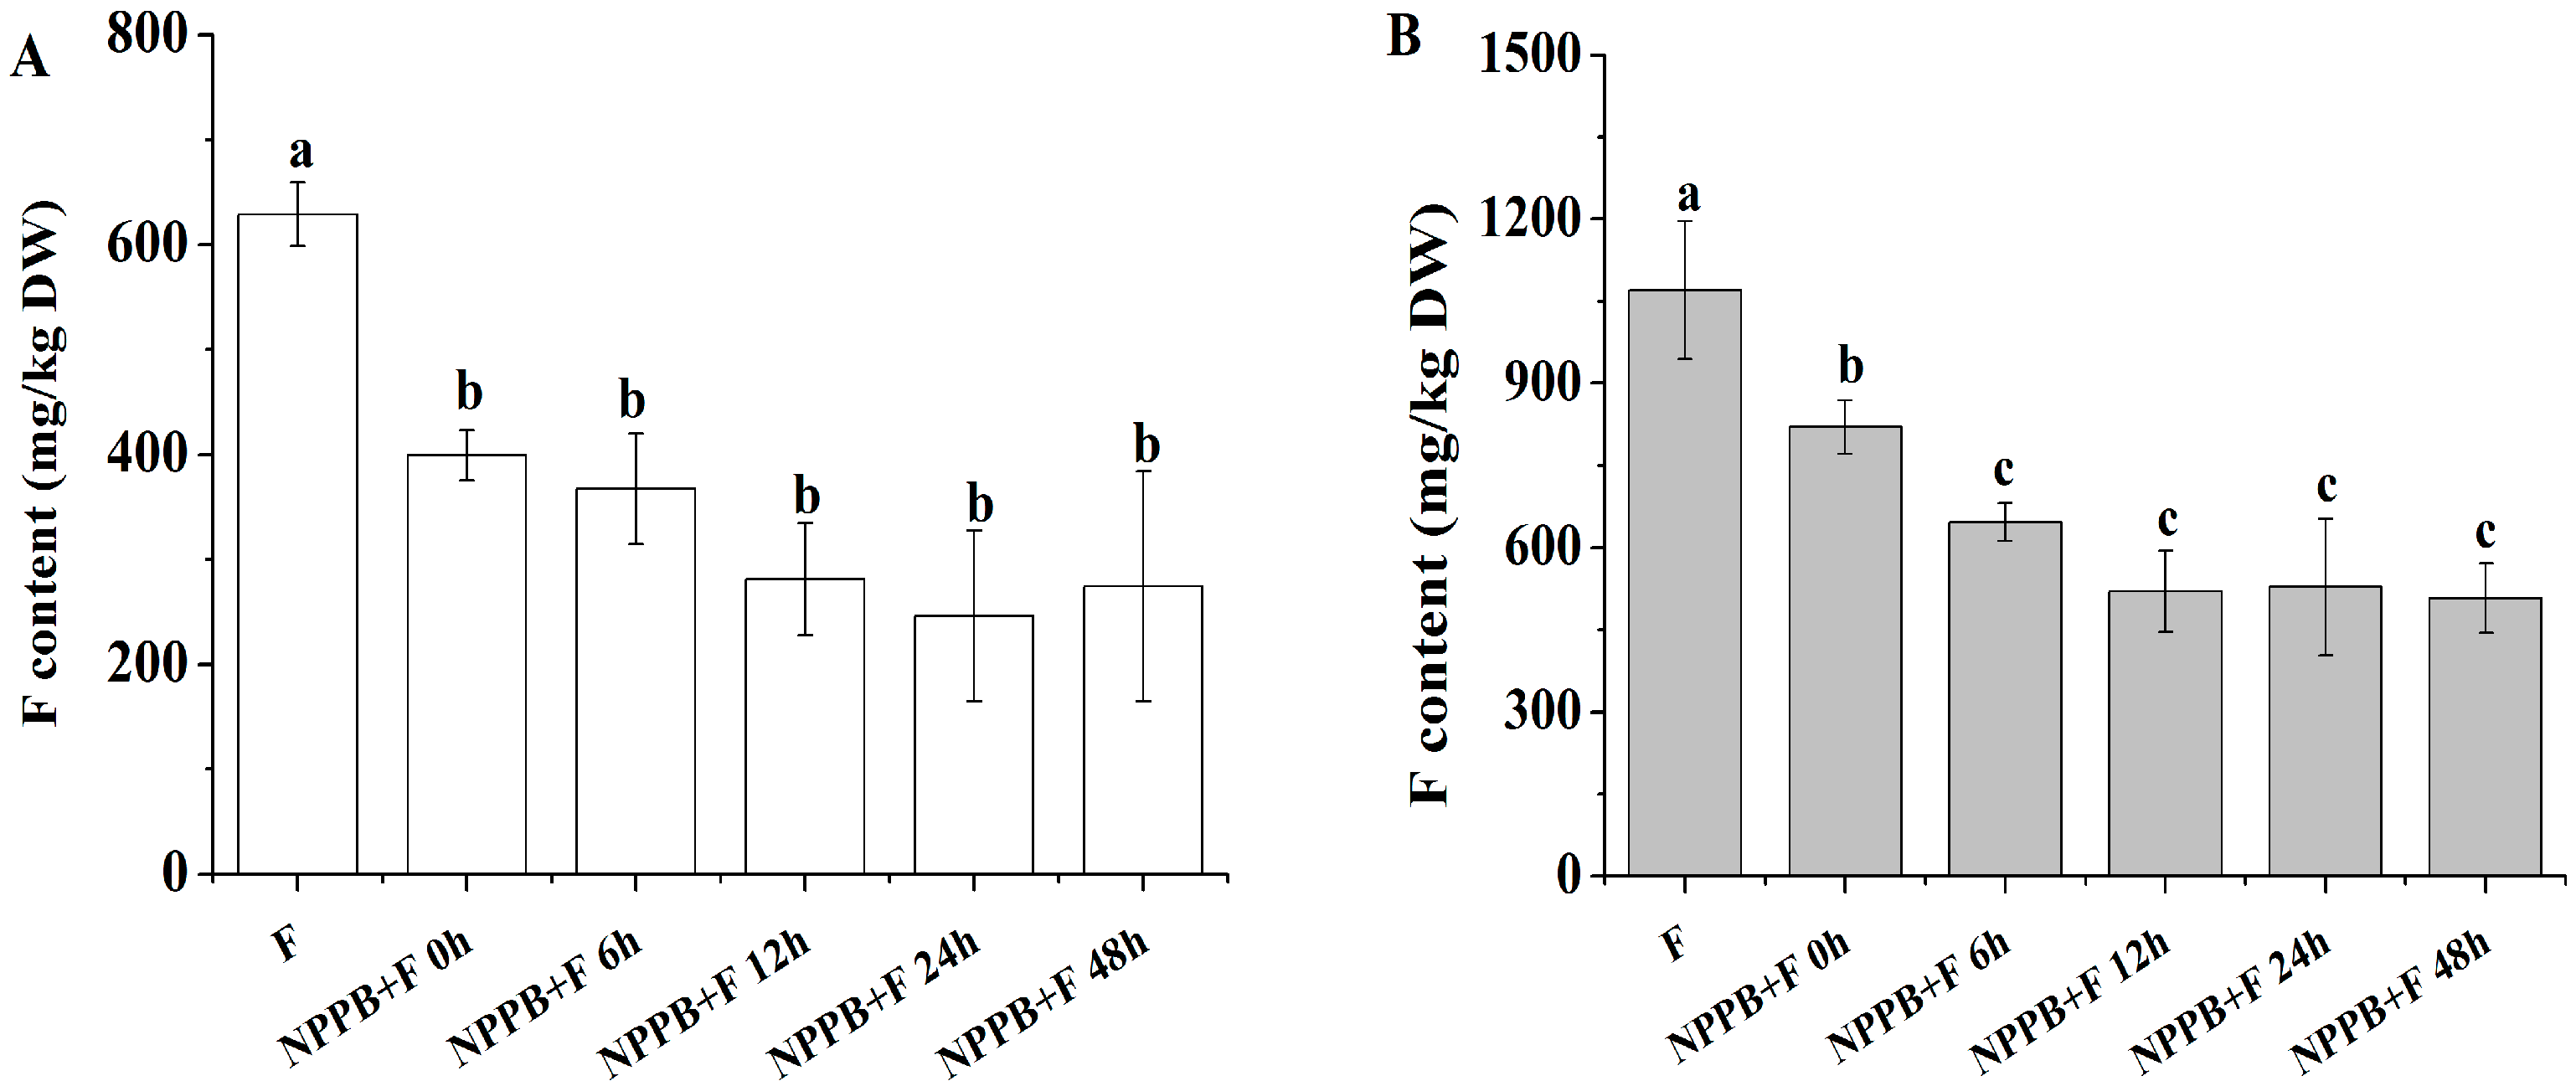
2.1. NPPB Significantly Inhibited F Accumulation in Tea Roots and Its Whole Plant

In this study, the amounts of F accumulated in tea roots and in tea plants were 629.01 and 1070.19 mg/kg at the concentration of 200 mg/L fluoride for 1 day, respectively. Pretreatment with NPPB significantly inhibited F content by 36.52% and 23.37% as compared with the control roots and the tea plants, respectively (Figure 1).
To further estimate the timing effect of NPPB treatment on inhibition of F accumulation, the F content in tea roots and plants was monitored under different NPPB pretreatment times. Results in Figure 1A showed that F content in tea roots gradually decreased by 41.61% and 55.32% after the addition of NPPB in solution for 6 and 12 h, respectively. Meanwhile, these values were reduced by 39.56% and 51.40%, respectively in whole tea plants (Figure 1B). After 12 h treatment of NPPB, a very similar accumulation of F content was found at the level of either tea roots (Figure 1A) or whole plants (Figure 1B). Thus, all further studies were conducted at this treatment time.
Figure 1. Effect of NPPB on F concentration in tea roots (A) and plants (B) with different pretreatment times. Data indicate mean ± SD (n = 4). Different low case numbers above the chart bars indicate the level of significance compared with the case without the addition of NPPB at p < 0.05.
Ijms 17 00057 g001

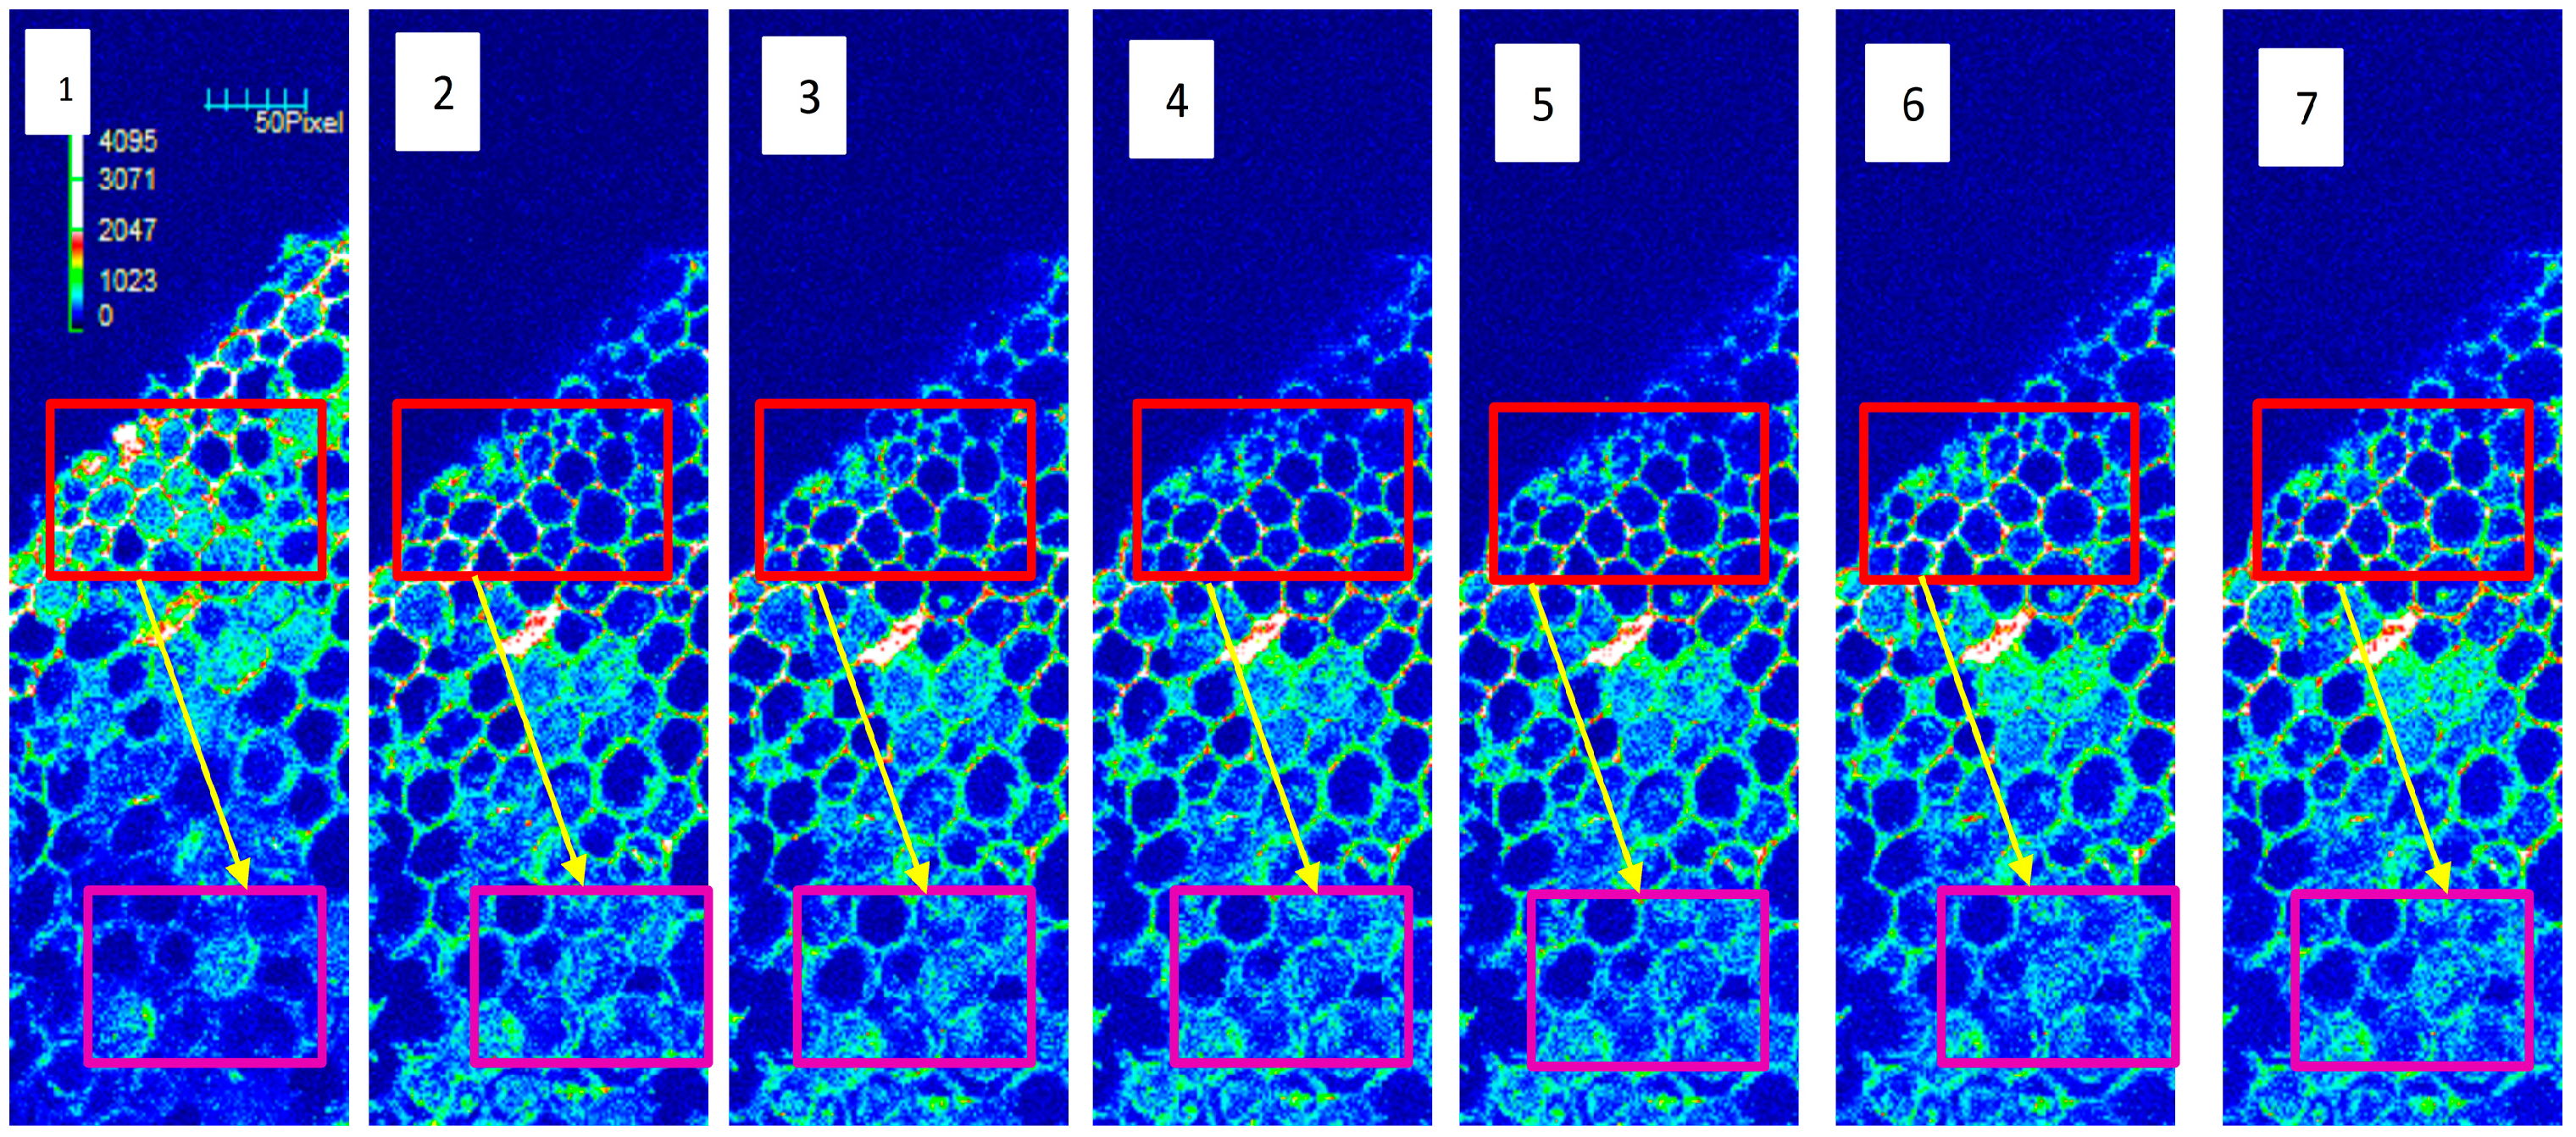
2.2. The Changes of Net Ca2+ Flux and Cytosolic Ca2+ Intensity in Tea Roots in Response to NPPB

As mentioned in the introduction, various extracellular stimuli elicit specific calcium signatures and the production of Ca2+ oscillation modulates ion channel activity in plants. Therefore, the effect of NPPB on Ca2+ signal in tea root was investigated. By using NMT (Non-invasive Micro-test Technique), calcium flux was measured in the maturation zone of tea root under NPPB treatment. As shown in Figure 2, the influx of Ca2+ remained stable at a range of −72.55 to −89.26 pmol·cm−2·s−1 for 120.75 s in the absence of NPPB. The application of NPPB caused a rapid Ca2+ efflux at a range of 68.93 to 128.76 pmol·cm−2·s−1 between 160 and 632.5 s (Figure 2A). The mean Ca2+ flux value reached 103.37 pmol·cm−2·s−1, which was significantly higher by 97.69% as compared with the control (Figure 2B).
Figure 2. NPPB-induced Ca2+ flux in tea root on the mature zone cells. (A) The kinetics of net Ca2+ flux in tea root mature zone cells treated with NPPB; (B) Net Ca2+ flux at state of before (0 to 120.76 s, without 50 µM NPPB), and after (160 to 632.5 s, with NPPB). Data indicate mean ± SD (n = 6). Error bars indicate difference among the treatments and different low case numbers near the chart bars indicate the level of significance as compared with control at p < 0.05.
Ijms 17 00057 g002
To visualize clearly the kinetics of Ca2+ change induced by NPPB, a non-invasive loading method was used to load the Ca2+-sensitive fluorescent probe Fluo-3/AM ester into the mature zone cells of tea roots. We created a 3D-LSCM (laser scanning confocal microscope) image of tea root cells for 12 min without the addition of NPPB into the solution. The relative fluorescence intensity did not significantly change within 12 min cited from [31]. The treatment of NPPB caused different trends of calcium fluorescence intensity in two regions of maturation zone of tea roots (Figure 3). The Fluo-3 fluorescence intensity of region A decreased from 889.60 to 452.2 AU in 7 min followed with a relatively stable level from 536.4 to 594 AU after 8 min under NPPB condition. However, NPPB caused an increase in the calcium fluorescence intensity of the region B. The intracellular calcium fluorescence intensity in the mature zone cells of tea root was 371.14 AU in the absence of NPPB, but this value increased to 515.28 AU after 2 min and then kept stable from 497.85 to 539.42 AU with the addition of NPPB (Figure S1).
Figure 3. Effect of NPPB on the Ca2+ signal in tea root mature zone cells. 3D Ca2+ pseudo-color images in tea root mature zone cells in the absence of NPPB (1) and presence of NPPB treatment (27); Lanes 2 to 7 represent 3D Ca2+ pseudocolor images of tea roots cells at 2, 4, 6, 8, 10, and 12 min after NPPB treatment, respectively. Red represents region A; purple represents region B; arrows represent the direction of Ca2+ transmission.
Ijms 17 00057 g003

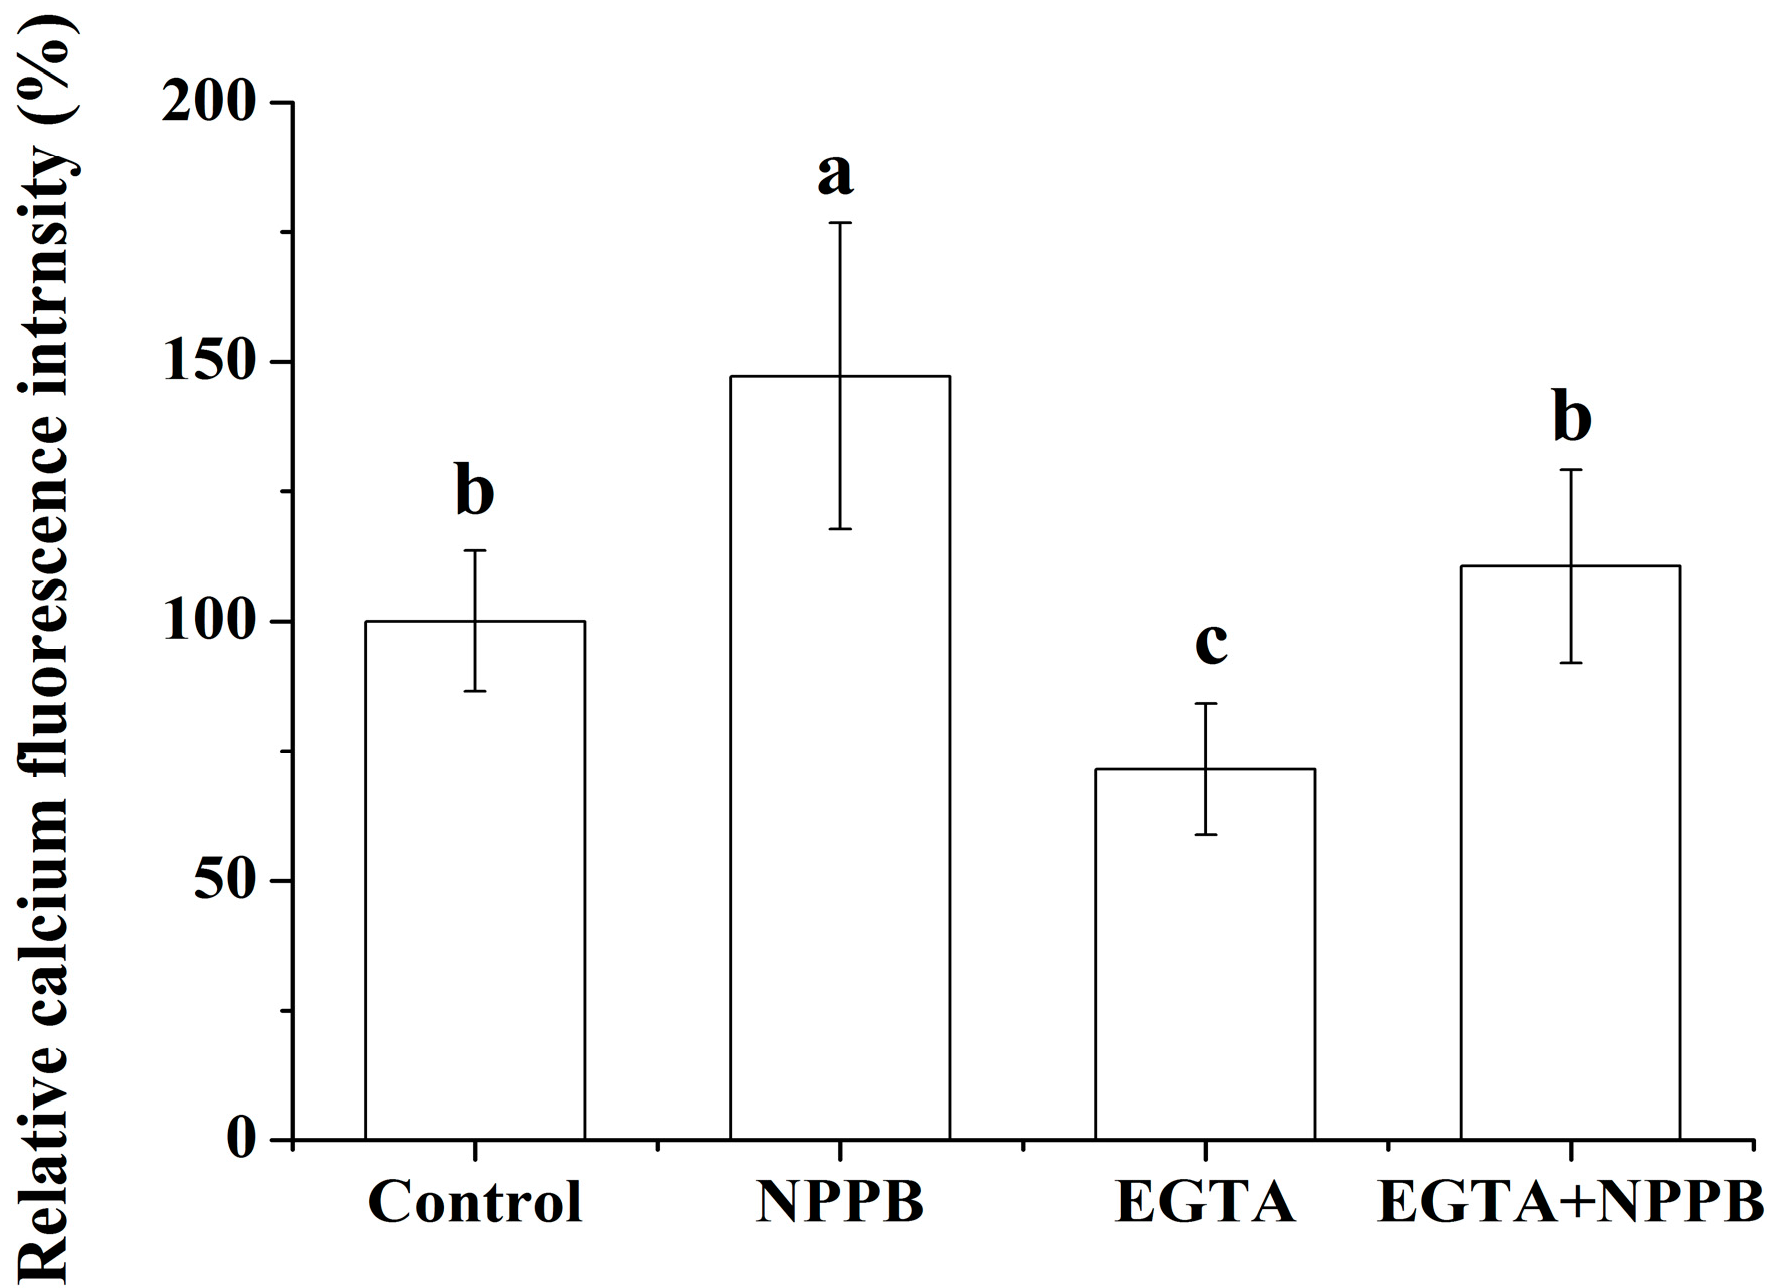
2.3. The Pretreatment of EGTA on NPPB-Induced Change of Ca2+ Fluorescence Intensity

To further analyze the role of Ca2+ in the inhibition of F accumulation in tea plants, EGTA was used in the following experiment. In contrast to the lowest level of intracellular Ca2+ fluorescence intensity in lateral root treated with EGTA, the highest one was found in NPPB treatment in comparison with control treatment. NPPB-elevated (p < 0.05) intracellular Ca2+ fluorescence intensity in lateral root was significantly suppressed to a level similar to the control by EGTA pretreatment (Figure 4).
Figure 4. Effect of Ca2+ chelator (EGTA) on cytosolic Ca2+ fluorescence intensity in NPPB-treated tea roots. Control, NPPB and EGTA indicate distilled water, 50 µM NPPB, and 1 mM EGTA for 0.5 h respectively; EGTA + NPPB refers to tea roots were placed in 1 mM EGTA for 0.25 h, then subjected to a direct 50 µM NPPB for 0.5 h; Ca2+ fluorescence was determined after control, NPPB, EGTA and EGTA + NPPB treatment in tea lateral roots. Data indicate mean ± SD (n = 4). Error bars indicate difference among the treatments and different low case numbers near the chart bars indicate the level of significance as compared with control at p < 0.05.
Ijms 17 00057 g004

2.4. Effects of Ca2+ Chelator and CaM Antagonists on NPPB-Induced CaM Content

Transient Ca2+ elevations are sensed by Ca2+ receptors and CaM is one of the best-characterized calcium sensors in plants. Thus CaM level in tea roots exposed to NPPB was investigated. The CaM concentration in tea roots in the control treatment (distilled water) stayed constant throughout the 4 h of the experiment, ranging from 77.62 to 89.27 ng·g−1. However, NPPB-stimulated tea roots caused a significant (p < 0.05) fluctuation of the CaM content at 2 h; it was higher by 37.94% as compared with the controls. Afterwards, the value returned to a level similar to that of control at 4 h (Figure S2).
To further illustrate the relationship between Ca2+ and CaM, the Ca2+ chelator EGTA was applied (Figure 5A). EGTA treatment significantly reduced the CaM concentration by 24.40% as compared with the controls at 2 h, in contrast to significant higher relative CaM content in tea roots treated with NPPB than control. In addition, after tea roots were placed in 1 mM EGTA for 0.5 h then subjected to NPPB for 2 h, similar results of CaM protein level were found between treatments of EGTA and EGTA + NPPB. These results indicate that CaM accumulation in tea roots induced by NPPB was dependent on Ca2+ in tea roots. Not surprisingly, about one fold higher relative CaM content was found in tea roots supplied with Ca2+ than control. Significant reduced relative CaM content than control was found in tea roots treated with CaM(calmodulin) antagonists CPZ (chlorpromazine hydrochloride)and TFP (trifluoperazine dihydrochloride), whereas these treatments were not sufficient to reduce relative CaM content in tea roots when co-treated with NPPB (Figure 5B).
Figure 5. Effect of Ca2+ chelator (EGTA) and CaM antagonists (CPZ and TFP) pre-treatment on CaM levels in NPPB-treated tea roots, respectively. (A) Control, NPPB, EGTA and Ca2+ indicate the application of distilled water, 50 µM NPPB, 1 mM EGTA and 1 mM Ca2+ for 2 h, respectively; EGTA + NPPB refers to tea roots were placed in 1 mM EGTA for 0.5 h, then directly subjected to 50 µM NPPB for 2 h; (B) Control, NPPB and CPZ, TFP indicate distilled water, 50 µM NPPB and 50 µM CPZ or TFP for 2 h, respectively; CPZ + NPPB and TFP + NPPB refer to tea roots were placed in 50 µM CPZ and TFP for 0.5 h respectively, then subjected to a direct 50 µM NPPB for 2 h. CaM level was detected after control, NPPB and CPZ, TFP, CPZ + NPPB and TFP + NPPB treatment in tea roots. Data indicate mean ± SD (n = 4). Error bars indicate differences among the treatments and different low case numbers near the chart bars indicate the level of significance as compared with control at p < 0.05; Note: The data for Ca2+ treatment was adapted from [31].
Ijms 17 00057 g005

2.5. Endogenous Ca2+ and CaM Involved in NPPB-Inhibited F Accumulation in Tea Plants

The above results indicate that NPPB stimulated internal Ca2+ and CaM level in tea roots, and that the Ca2+ chelator EGTA or CaM antagonist CPZ and TFP decreased NPPB induced Ca2+ and CaM levels. Therefore, the effect of EGTA, CPZ, and TFP was examined to test the role of Ca2+ and CaM in the NPBB-inhibited F accumulation in tea plants. Firstly, no significant inhibition effect of EGTA, CPZ and TFP on F content in tea plants was found. However, we found that NPPB-inhibited F accumulation in tea roots was significantly alleviated using Ca2+ chelator EGTA. Similarly, the pretreatment of CaM antagonist CPZ and TFP remarkably impaired NPPB-inhibited F accumulation in tea plants (Figure 6).

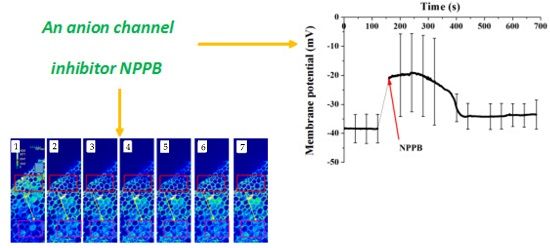
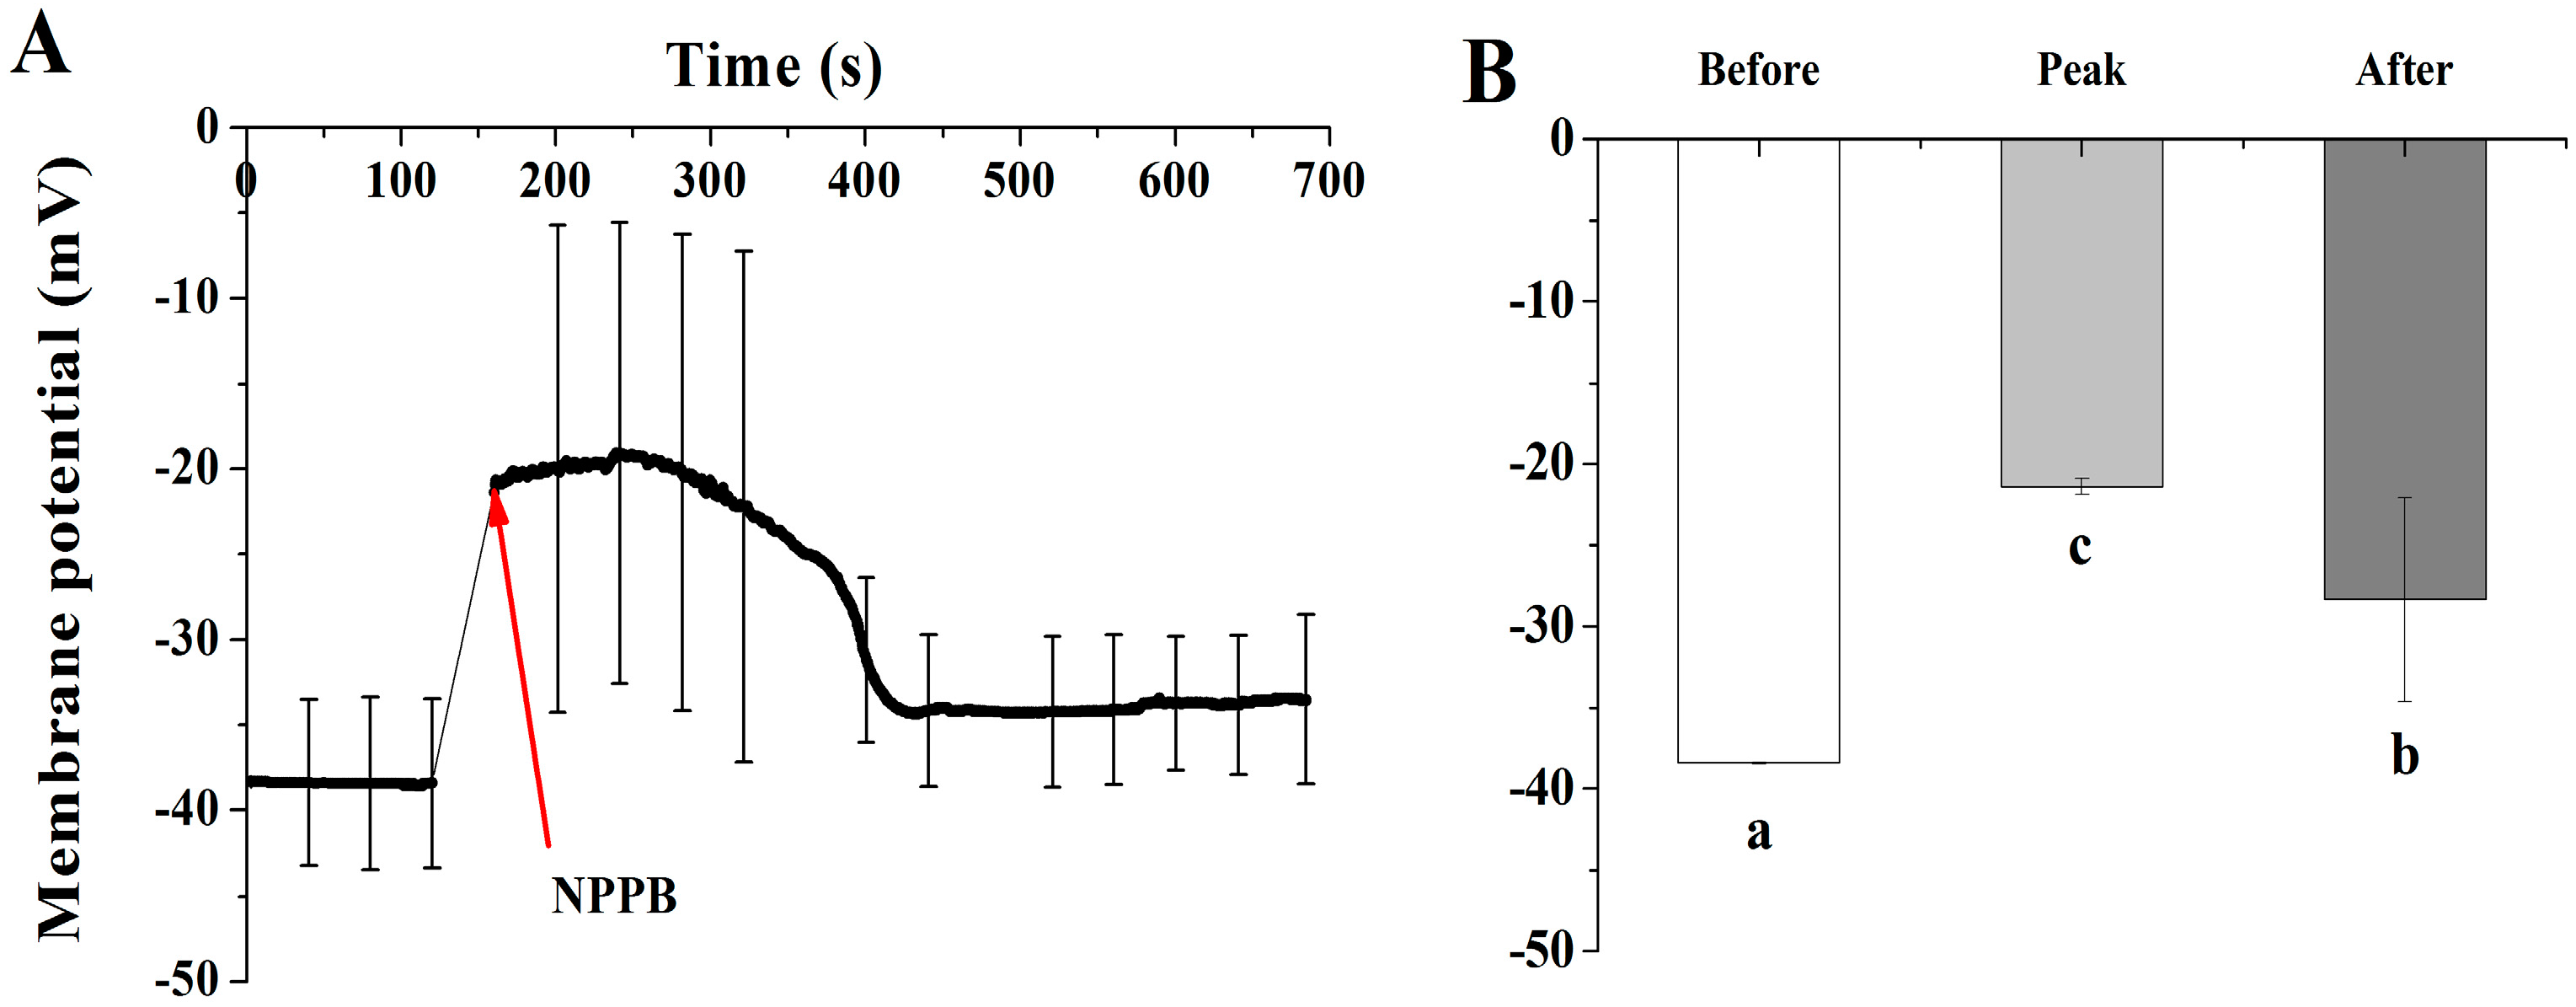
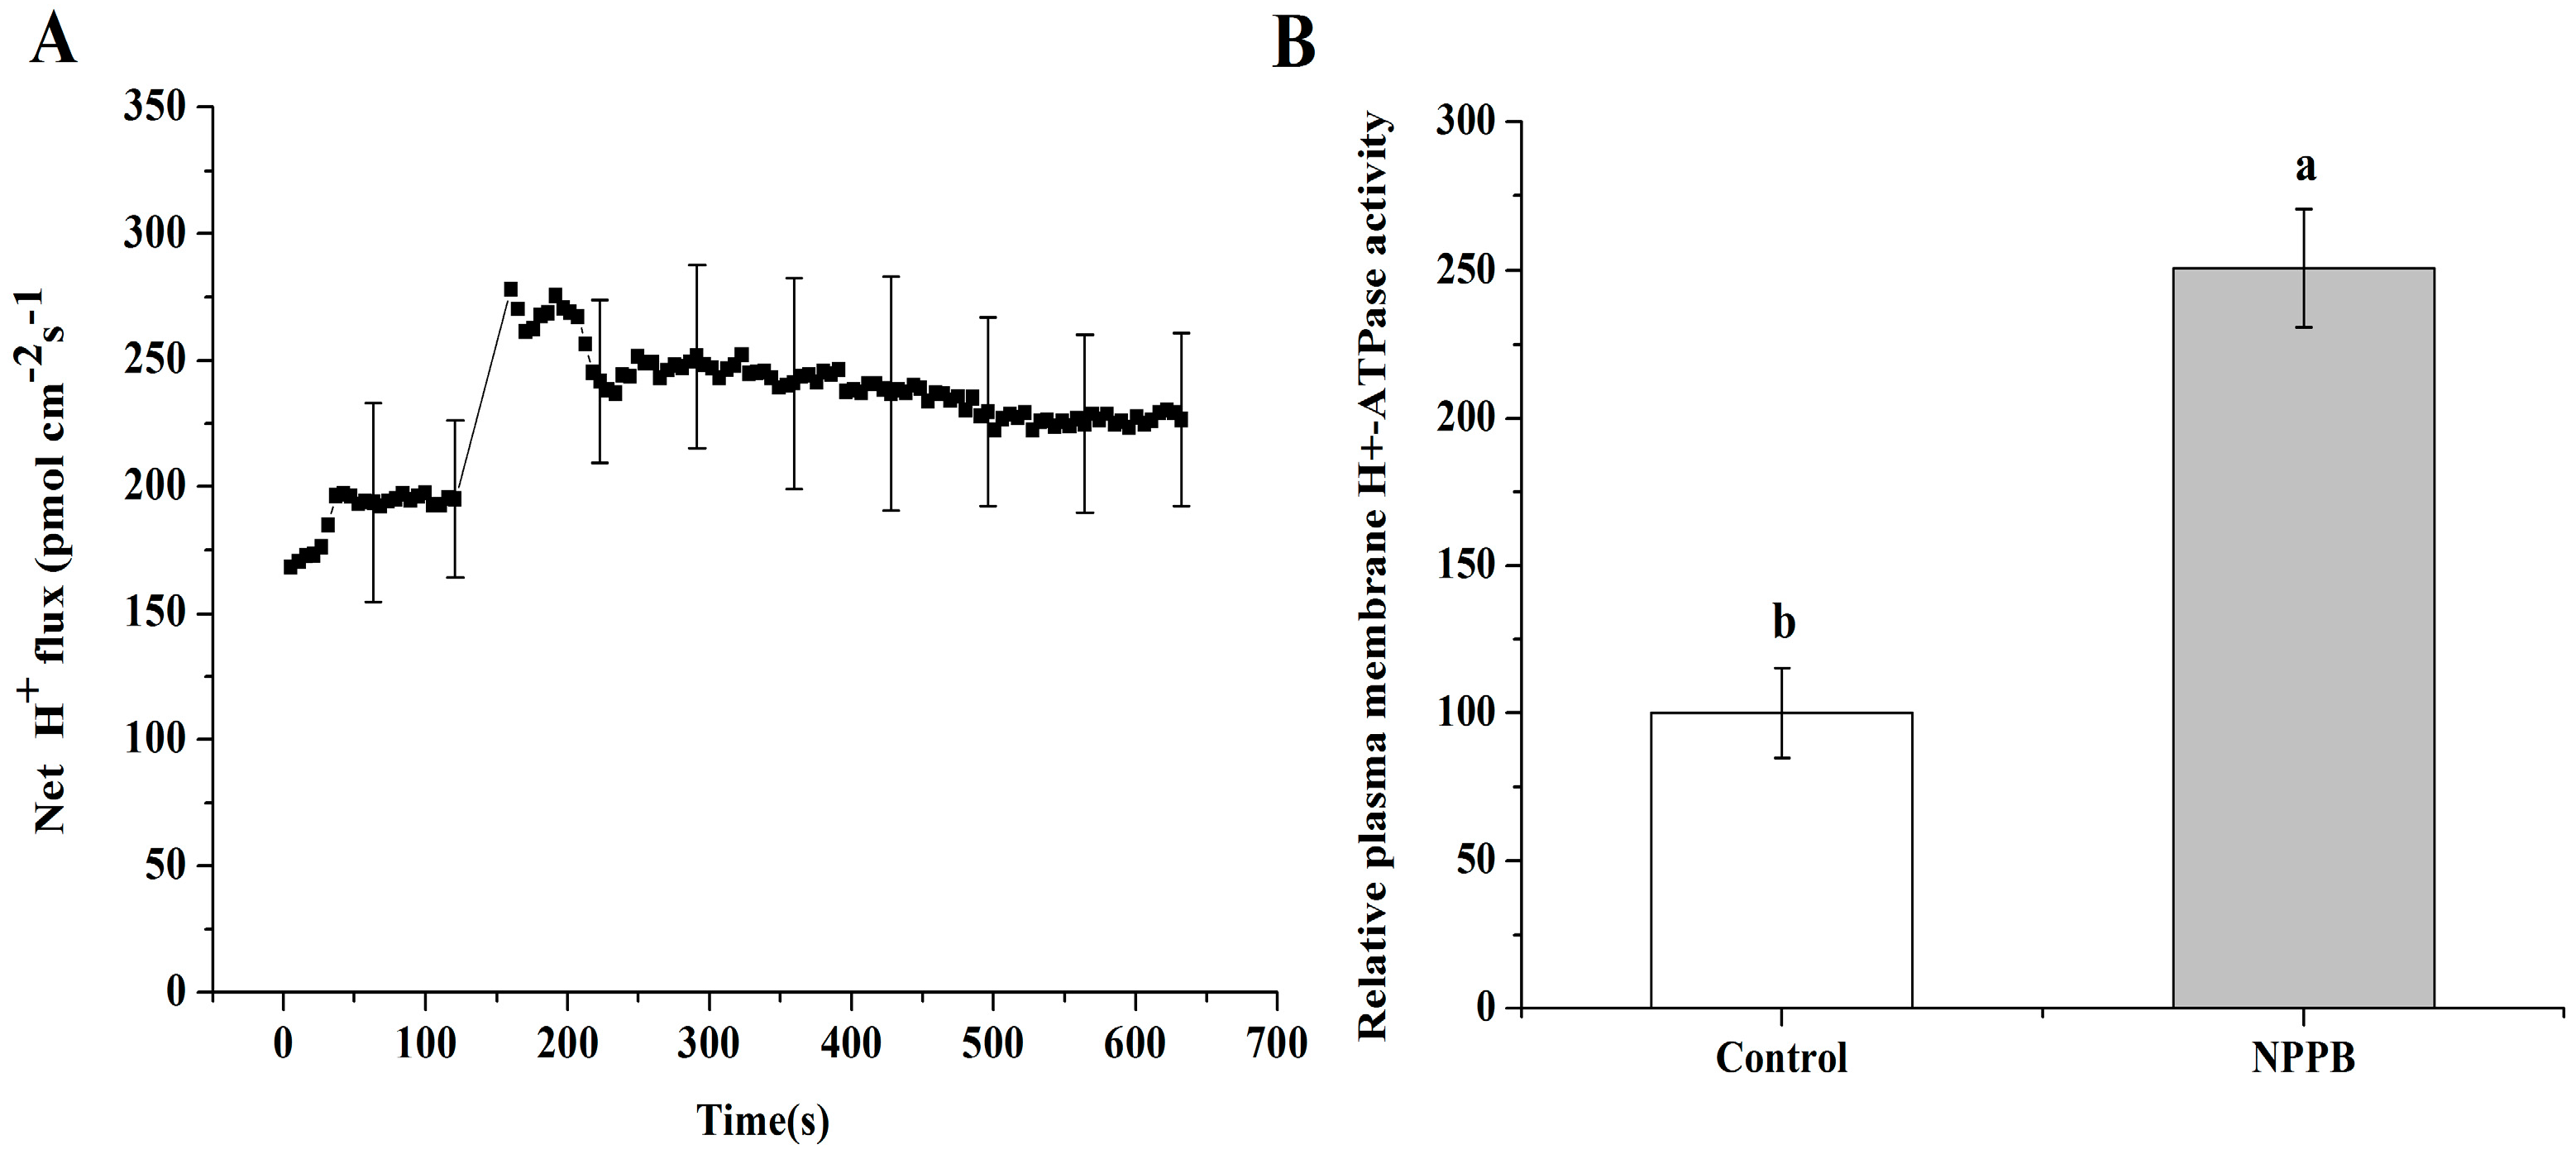
2.6. NPPB Depolarized Membrane Potential and Stimulated the Net H+ Effluxes in the Maturation Zone of Tea Roots

In plant cells, most of anion channels are related to voltage dependence. Thus the regulation of anion channels’ activity in tea roots under stimuli might be related to modulation of its plasma membrane potential. In our study, NPPB treatment caused the instant depolarization of plasma membrane potential (Figure 7A). Then the extent of the membrane potential depolarization gradually diminished from 300.96 to 684.64 s (Figure 7A,B). Not surprisingly, increased net H+ efflux was found in tea roots treated with NPPB (Figure 8A). Consistently, plasma membrane H+-ATPase activity was significantly activated by 149.44% in tea root under NPPB condition than control (Figure 8B).
Figure 6. Effect of EGTA, CPZ and TFP pre-treatment on relative F accumulation in NPPB-treated tea plants. NPPB + F indicates tea roots were applied with 50 µM NPPB for 12 h and then followed with 10.5 mM F for 1 day; EGTA + F, CPZ + F, and TFP + F indicate that 6 h pretreament with 1 mM EGTA, 50 µM CPZ and 50 µM TFP and then treated with F treatment; EGTA + NPPB + F, CPZ + NPPB + F, and TFP + NPPB + F indicate that 6 h pretreament with 1 mM EGTA, 50 µM CPZ and 50 µM TFP were applied to the tea roots under NPPB + F treatment, respectively. Data indicate mean ± SD (n = 4). The error bars indicate difference among the treatments and different low case numbers near the chart bars indicate the level of significant difference compared with control at p < 0.05.
Ijms 17 00057 g006
Figure 7. Effect of NPPB on the membrane potential in tea root mature zone cells. (A) The kinetics of plasma membrane potential in tea root mature zone cells treated with NPPB; (B) Plasma membrane potential at state of before (0 to 120.75 s, without 50 µM NPPB), peak (160 to 300.96 s, with NPPB), and after (120.75 s, with NPPB). Data indicate mean ± SD (n = 8). Error bars indicate the difference among the treatments and different low case numbers near the chart bars indicate the level of significant difference compared with control at p < 0.05.
Ijms 17 00057 g007
Figure 8. Influence of NPPB on the H+ flux and plasma membrane H+-ATPase activity in tea roots. (A) The kinetics of net H+ flux in tea root mature zone cells treated with NPPB. Data indicate mean ± SD (n = 6). Error bars indicate differences among the treatments; (B) Control and NPPB indicate that tea roots were treated with distilled water and 50 µM NPPB for 12 h, respectively; Data indicate mean ± SD (n = 4). Error bars indicate differences among the treatments and the letters a, b near the chart bars indicate the level of significance as compared with control at p < 0.05.
Ijms 17 00057 g008

3. Discussion

Previous results from our laboratory have shown that the anion channel inhibitor NPPB significantly decreased F absorption, suggesting that anion channels are involved in F accumulation in tea plants [6]. However, the components in regulation of NPPB inhibited F accumulation in tea plants are still obscure.

3.1. Ca2+ and CaM Are Involved in NPPB-Inhibited F Accumulation in Tea Plants

Ca2+ is a well-known important second messenger, and a wide range of stimuli trigger a change of the intracellular Ca2+ concentration [32,33,34]. In the present work, a net Ca2+ efflux (Figure 2) and a change of cytosolic Ca2+ intensity (Figure 3) was seen in tea root in response to the anion channel inhibitor, NPPB. Ion channel inhibitor-activated Ca2+ signals were also reported in other plants. Chen et al. [35] found that the addition of Ca2+ channel inhibitor La3+ obviously elevated Ca2+ concentration in the cytoplasm in Picea meyeri pollen tube. GdCl3, a nonspecific cationic channel blocker, induced Ca2+ influx and increased Ca2+ concentration in the cytoplasm in the gamete cells of maize [36]. Similar results were also found in plants, e.g., rice root [37] and populus euphratica cells [38] under other abiotic stress. Further, EGTA decreased NPPB-increased Ca2+ fluorescence intensity in the lateral root (Figure 4) and impaired NPPB-inhibited F accumulation in tea plants (Figure 6), which suggests that intracellular Ca2+ change was related to NPPB inhibited F accumulation in tea plants. Roberts et al. [39] reported that an anion channel inhibitor niflumic acid depressed anion channel and modulated NO3, Cl, and I uptake in maize root stele via Ca2+ signal regulation. Similar result of involvement of Ca2+ in regulation anion channels was also found in other plant species, e.g., Chara corallina [40].
CaM is a primary calcium sensor in most of eukaryotes. It binds calcium and regulates the activities of a wide range of effect proteins in response to calcium signals [41]. We found that CaM accumulation induced by NPPB is dependent on Ca2+ in tea roots in 4 h (Figure 6A) and the inhibition of NPPB on F accumulation in tea plants were significantly alleviated by the presence of either Ca2+ chelator EGTA or the CaM antagonists CPZ and TFP (Figure 6B), suggesting that both Ca2+ and CaM are involved in NPPB inhibited F accumulation in tea plants. Similarly, results showed that NaCl stress-regulated Na+ and K+ uptake was associated with CaM in barley roots [42]. However, it should be noted here that CaM antagonists TFP and CPZ can not only inhibit CaM but also impair the function of CBL and CDPK [43]. Several lines of evidences showed that CDPK and CBL involved in ion uptake are well known. For example, Pei et al. reported that CDPK activated chloride channels in Vicia faba guard cell vacuoles, which enabled Cl entry into vacuoles [44]. Cheong et al. found that CBL1 and CBL9 are involved in regulating K uptake and transport in Arabidopsis root under low K condition [45]. Thus, it is possible that Ca2+ sensors CDPK or CBL might also interact with components involved in NPPB-inhibited F accumulation in tea plants. To better understand the mechanisms behind F accumulation in tea plants, CDPK and CBL might be interesting targets in future studies.

3.2. A Possible Link between Regulation of Ca-CaM and Plasma Membrane Potential in NPPB-Inhibited F Accumulation in Tea Plants

NPPB inhibited anion channels and significantly reduced F accumulation in tea plants. As described above, the regulation of anion channel activity in tea root under stimuli might also be related to regulation of its plasma membrane potential. In the present study, we found that NPPB caused a rapid depolarization of membrane potential and then the extent was gradually impaired (Figure 7). In addition, NPPB significantly promoted Ca2+ (Figure 2A) and H+ efflux (Figure 8A) in tea root, which in turn contributed to alleviate membrane potential depolarization. Similarly, Shabala et al. [46] and Cuin et al. [47] reported that NaCl rapidly depolarized the plasma membrane and resulted in net Ca2+ and H+ efflux in barely roots, which weakened the extent of membrane potential depolarization. Also, a restoration of depolarized plasma membrane potential and increased plasma membrane H+-ATPase activity were found in barely roots under salt stress [48]. Taken together, a possible link between regulation of plasma membrane potential and Ca–CaM in NPPB inhibited F accumulation in tea plants is suggested. Buchanan et al. [28] reported that environmental stimuli increased the concentration of cytosolic free Ca2+ and evoked a rapid depolarization of the membrane potential, which activated K+ channel in Arabidopsis root. Similar results were also found in NaCl-stimulated Populus euphratica cells [49]. Lamottea et al. showed evidence that NO mediated free cytosolic Ca2+ concentration and activated plasma membrane Ca2+ channels by inducing rapid membrane potential depolarization in Nicotiana plumbaginifolia (It is correct)cells under abiotic stress [50]. Additionally, binding with Ca2+ and calmodulin was shown to be induce the dimerization of K+ channel domains, leading to channel gating and then directly coupling cytosolic Ca2+ change and altered plasma membrane potential [22]. Thus, in combination with our results, one possible mechanism for NPPB-inhibited F accumulation in tea plants can be proposed: NPPB triggers membrane potential depolarization, generates Ca2+ signal, and then rearranges anion channel conformation through interaction with increased CaM activity in tea root cells; thus, resulting in NPPB-inhibited F accumulation in tea plants. However, whether the possible link between regulation of Ca–CaM and NPPB evoked depolarization of plasma membrane potential in tea root is specific or not remains unknown. Further investigation of the regulation network between cytosolic Ca2+, CaM, plasma membrane potential, and anion channel activity might be beneficial to understanding the mechanism beyond anion channel inhibitor/blocker e.g., NPPB-inhibited F accumulation in tea plants. Furthermore, it is generally known that NPPB is a Cl channel inhibitor and Cl is the predominant permeating anion species in all organisms, and thus anion channels are often referred to as Cl channels [51]. However, the identity of channels in mediating F uptake in tea plants is still largely unknown. In our study, we found that NPPB (known as Cl channel inhibitor) significantly inhibited F accumulation in tea plants. Whether F uptake in tea roots was mediated by Cl anion channels, e.g., F/Cl co-transport or by its specific F uptake channel still needs to be clarified in future study.

4. Materials and Methods

4.1. Cultivation of Tea Plants

Tea seeds of the Fuding variety (Camellia sinensis cv. Fuding-dabaicha) were obtained from the tea garden of Anhui Agricultural University located in Hefei, Anhui province of China. These seeds were first immersed in water for 2 days. Healthy tea seeds were placed on clean quartz sand (particle size—0.3 cm), and then transferred into an artificial climate chamber for one month with a day length of 12 h per day, temperature of 22 ± 1°C, irradiance of 27 µmol·m−2·s−1, and relative humidity of 45% to 50% after germination. Germinated seeds (root length of 2–5 cm) with similar growth conditions were used to determine the net Ca2+/H+ flux, intracellular Ca2+ concentration, CaM level, and membrane potential in tea roots.
Tea plants (grown for 3 months) at the same growth conditions (three to five leaves) were washed with deionized water, and then transferred to ventilated plastic basins (50 × 30 cm) containing 25% strength of advanced Kimura nutrient solution (NH4NO3 114 mg·L−1, KH2PO4 13.6 mg·L−1, and KCl 38.69 mg·L−1; pH 5.00 to 5.50). After growing more lateral roots, the tea plants were left in the nutrient solution for one week before treatment. Water in plastic basins was renewed every 2 to 3 days before the experiment. Tea plants were used to measure plasma membrane H+-ATPase activity in tea roots and F content in tea plants [31].

4.2. NPPB Treatment

A group of 3 or 4 tea plants (20 to 25 cm high, 5 mm stem OD) at the same growth stage (3 to 5 leaves) were rinsed in deionized water to remove the excess absorbed solutions on the roots, and then dried with filter paper. The tea plants were transferred to 250 mL glass bottles containing either distilled water for the controls or 50 µM NPPB (dissolved in DMSO). The bottles were covered with absorbent cotton and wrapped with black adhesive tape to enable efficient tea root growth. Then, tea plants were exposed to NPPB solutions for 0 h (the inhibitors plus F directly for 1 day without the pretreatment with inhibitors), 6, 12, 24 and 48 h. Subsequently, they were transplanted into 10.5 mM (200 mg·L−1) F (NaF) solution (containing 25% strength of advanced Kimura nutrient solution) for 1 day.

4.3. Determination of F

Fluoride concentrations were measured as described by Zhang et al. [6]. Briefly, tea plants were separated into roots, stems, and leaves, respectively. They were washed with distilled water and then dried at 80 °C. Fluoride concentration was determined by a fluoride ion-measuring instrument (9609 BNWP fluoride ion selective electrode). Samples were accurately weighed, placed in a 50 mL centrifugal tube with 30 mL of distilled water, and extracted at 100 °C for 30 min in water baths. The extraction mixture was cooled to room temperature, and then centrifuged for 10 min at 1700× g to separate the supernatant. Fifteen mL of extracts and 15.0 mL of total ionic strength adjustment buffer (TISAB) were completely mixed in a 50 mL polyethylene beaker with a clean glass bar. The fluoride ionic electrode was immersed into the solution, and the meter reading was recorded as soon as the reading was stable. The treatment time of NPPB that caused the minimum F accumulation in tea plants was used for further experiments.

4.4. Flux Measurement of Ca2+ and H+

The net fluxes of Ca2+ and H+ were measured by using non-invasive micro-test technique at the Younger USA (Xuyue Beijing) NMT Service Center. The concentration of Ca2+ and H+ concentration gradients were positioned vertically 400 μm above the cell for 3 to 5 min to record the background signals and measured by moving the electrode repeatedly between two positions (5 and 35 µm). During the process, the tea root was analyzed in the measuring solution containing 0.02 mM CaCl2, 50 mM sorbitol, 0.3 mM MES, and pH 6.0 for 2 min. The steady Ca2+/H+ fluxes were record for 4–5 min before the application of NPPB. Subsequently, 50 µM NPPB was immediately added to the measuring solution and each sample were tested. The microelectrodes were positioned at 2 μm away from the tea root via the computer-controlled NMT system. The net Ca2+ and H+ flux was calculated by Fick’s law of diffusion:
J = −D(dc/dx)
where J indicates the ion flux in the x direction, dc/dx is the calcium ion concentration gradient and D is the ion diffusion constant in a particular medium [52].

4.5. Measurement of Cytosolic Ca2+ Intensity

The cytosolic Ca2+ was illustrated by using Ca2+-sensitive fluorescent dye Fluo-3/AM ester purchased from Molecular Probes (Eugene, OR, USA) according to the method described in Zhang et al. [53]. The mature zone segment isolated from tea root was incubated in a solution containing 40 µM Fluo-3/AM, 50 mM sorbitol, and 0.2 mM CaCl2 at 4 °C for 2 h in the dark. The Fluo-3/AM ester (50 µg) was dissolved in DMSO (dimethylsulfoxide). The final DMSO concentration in the incubation solution was approximately 1% (v/v). After incubation at 4 °C for 2h, the roots were then incubated in the 0.2 mM CaCl2 solution for 2 h at room temperature in the dark. The mature zone segment of tea root which was covered with the cover-slip and mounted in the chamber treated with 50 µM NPPB, and the pictures were taken by scanning every 1 min with a three dimensional XY-T project step over a period of 12 min in the bathing solution. Finally, fluorescence emission from the mature zone of tea root was detected, and the wavelength of excitation light and emission was 488 and 515 nm, respectively. The recorded fluorescence intensity was the average value obtained by scanning the cells of a specific area.

4.6. Plasma Membrane H+-ATPase Assay

About three and a half grams of fresh tea roots (a group of three or four tea plants) were sampled, rinsed with distilled water, and homogenized in a mortar with ice in 18 mL of buffer solution. This buffer contained 25 mM Hepes–Tris (pH 7.6), 50 mM Mannitol, 3 mM EGTA, 3 mM EDTA, 250 mM KCl, 2 mM PMSF, 1% PVP, 0.1% BSA, and 2 mM DTT. The homogenate was filtered through four layers of cheesecloth filter and centrifuged at 10,000× g for 10 min. Afterwards it was centrifuged at 50,000× g for 45 min to obtain a microsomal fraction. Plasma membranes were isolated from the microsomal fraction by partitioning at 6.2% Dexrean T-500 and 6.2% PEG 3350 in an aqueous polymer two-phase system as described by Chen et al. [48]. To examine the purity of plasma membrane, the enzyme activity was reduced over 75% by vanadate, and inhibited less than 10% by nitrate and azide. These results demonstrated that the purity of plasma membranes isolated from the microsomal fraction can be used for further experiments. The plasma membrane H+-ATPase hydrolysis assays were performed by measuring the release of phosphate [54].

4.7. CaM Extraction and Analysis

Tea roots were treated with 50 µM NPPB for 0, 0.5, 1, 2 and 4 h. At the end of each experiment, the tea roots were weighted and grounded in buffer solution (50 mM Tris–HCl (pH 8.0), 1 mM EGTA, 0.5 mM PMSF (phenylmethylsulfonyl fluoride), 20 mM NaHSO4, and 0.15 mM NaCl) at about 1:3 (weight/volume) at 4 °C. The homogenate was kept at 90 °C to 95 °C for 3 min and then the centrifuged at 20,000× g for 20 min at 4 °C. The supernatants were used to determine CaM content by ELISA according to the method described in Sun et al. [55]. The antibody used for ELISA was purchased from Promega (Madison, WI, USA) [33]. Protein content of tea roots was determined using the method of Bradford [56] with bovine serum albumin (BSA) as standard.

4.8. Membrane Potential Measurements

The membrane potential was measured at the Younger USA NMT Service Center via NMT and the iFluxes 1.0 Software. The membrane potential microelectrodes were provided by the NMT Service Center and made prior to each test to ensure the best performance. Briefly, glass microelectrodes were backfilled with 3 mM KCl to ca. 1 cm in length. An Ag/AgCl wire electrode holder was inserted at the back of the electrode to make electrical contact with the electrolyte solution. The YG003-Y05, provided by the NMT Service Center was used as the reference electrode. After cell penetration, the membrane potential from the mature zone of tea roots was recorded for 2 min. Subsequently, 50 µM NPPB was added to each treatment, and each sample was measured for at least 10 min. At least eight individual roots (n ≥ 8) were used for membrane potential measurements [48].

4.9. Data Analysis

The F content, intracellular Ca2+ fluorescence intensity, net Ca2+/H+ flux, CaM protein concentration, and plasma membrane H+-ATPase activity were analyzed using Origin Pro 8.5 and SPSS. Significant differences were analyzed by one-way Tukey’s multiple range tests and regarded as statistically significant at p < 0.05.

Supplementary Materials

Supplementary materials can be found at https://www.mdpi.com/1422-0067/17/1/57/s1.

Acknowledgments

We thank Jing-Ling He and Xiu-Hong Zhou from Anhui Agricultural University. This work was supported by the National Natural Science Foundation of China (41071158 and 31272254) and the Science Foundation for Distinguished Young Scholars of Anhui Province (1408085J01).

Author Contributions

Xian-Chen Zhang, Hong-Jian Gao participated in measuring H+-ATPase activities, cytoplasm Ca2+ concentration, CaM content, F concentration, Ca2+/H+ flux and membrane potential; Zheng-Zhu Zhang, Yu-Mei Wang and Xiao-Chun Wan carried out tea plants cultivation. Xian-Chen Zhang, Hong-Jian Gao, Tian-Yuan Yang, Hong-Hong Wu and Xiao-Chun Wan participated in the design of the study and performed the statistical analysis. Xiao-Chun Wan conceived the study. Xian-Chen Zhang and Hong-Hong Wu wrote the paper. All the authors read and approved the final manuscript.

Conflicts of Interest

The authors declare no conflict of interest.

Abbreviations

ABA: abscisic acid; CaM:calmodulin; CPZ:chlorpromazine hydrochloride; EF: elogation factor; LSCM: laser scanning confocal microscope; NA: niflumic acid; NMT: non-invasive Micro-test Technique; TFP: trifluoperazine dihydrochloride.

References

  1. Ruan, J.Y.; Ma, L.F.; Shi, Y.Z.; Han, W.Y. Uptake of fluoride by tea plant (Camellia sinensis L.) and the impact of aluminium. J. Sci. Food Agric. 2003, 83, 1342–1348. [Google Scholar] [CrossRef]
  2. Gao, H.J.; Zhao, Q.; Zhang, X.C.; Wan, X.C.; Mao, J.D. Localization of Fluoride and Aluminum in Subcellular Fractions of Tea Leaves and Roots. J. Agric. Food Chem. 2014, 62, 2313–2319. [Google Scholar] [CrossRef] [PubMed]
  3. Simpson, A.; Shaw, L.; Smith, A.J. The bioavailability of fluoride from black tea. J. Dent. 2001, 29, 15–21. [Google Scholar] [CrossRef]
  4. Cao, J.; Zhao, Y.; Liu, J. Brick tea consumption as the cause of dental fluorosis among children from Mongol, Kazak and Yugu populations in China. Food Chem. Toxicol. 1997, 35, 827–833. [Google Scholar] [CrossRef]
  5. Lu, Y.; Guo, W.F.; Yang, X.Q. Fluoride Content in Tea and Its Relationship with Tea Quality. J. Agric. Food Chem. 2004, 52, 4472–4476. [Google Scholar] [CrossRef] [PubMed]
  6. Zhang, L.; Li, Q.; Ma, L.F.; Ruan, J.Y. Characterization of fluoride uptake by roots of tea plants (Camellia sinensis (L.) O. Kuntze). Plant Soil 2013, 366, 659–669. [Google Scholar] [CrossRef]
  7. Zhang, X.C.; Gao, H.J.; Zhang, Z.Z.; Wan, X.C. Influences of different ion channel inhibitors on the absorption of fluoride in tea plants. Plant Growth Regul. 2013, 69, 99–106. [Google Scholar]
  8. Angeli, A.D.; Thominea, S.; Frachissea, J.M.; Ephritikhinea, G.; Gambale, F.; Barbier-Brygooa, H. Anion channels and transporters in plant cell membranes. FEBS Lett. 2007, 581, 2367–2374. [Google Scholar] [CrossRef] [PubMed]
  9. Barbier-Brygoo, H.; Vinauger, M.; Colcombet, J.; Ephritikhine, G.; Frachisse, J.M.; Maurel, C. Anion channels in higher plants: Functional characterization, molecular structure and physiological role. Biochim. Biophy. Acta 2000, 1465, 199–218. [Google Scholar] [CrossRef]
  10. Ryan, P.R.; Skerrett, M.; Findlay, G.P.; Delhaize, E.; Tyerman, S.D. Aluminum activates an anion channel in the apical cells of wheat roots. Proc. Natl. Acad. Sci. USA 1997, 94, 6547–6552. [Google Scholar] [CrossRef] [PubMed]
  11. Zhang, W.H.; Ryan, P.R.; Tyerman, S.D. Malate-Permeable Channels and Cation Channels Activated by Aluminum in the Apical Cells of Wheat Roots. Plant Physiol. 2001, 125, 1459–1472. [Google Scholar] [CrossRef] [PubMed]
  12. Liu, J.L.; Yang, L.; Luan, M.D.; Wang, Y.; Zhang, C.; Zhang, B.; Shi, J.S.; Zhao, F.G.; Lan, W.Z.; Luan, S. A vacuolar phosphate transporter essential for phosphate homeostasis in Arabidopsis. Proc. Natl. Acad. Sci. USA 2015, 112, 6571–6578. [Google Scholar]
  13. Takahashi, Y.; Tateda, C. The functions of voltage-dependent anion channels in plants. Apoptosis 2013, 18, 917–924. [Google Scholar] [CrossRef] [PubMed]
  14. Ward, J.M.; Pei, Z.M.; Schroeder, J.I. Roles of ion channels in initiation of signal transduction in higher plants. Plant Cell 1995, 7, 833–844. [Google Scholar] [CrossRef] [PubMed]
  15. Luan, S. CBL-CIPK network in plant calcium signaling. Trends Plant Sci. 2009, 14, 1360–1385. [Google Scholar] [CrossRef] [PubMed]
  16. Ward, J.M.; Pascal Maser, P.; Julian, I.; Schroeder, J.I. Plant Ion Channels: Gene Families, Physiology, and Functional Genomics Analyses. Annu. Rev. Physiol. 2009, 71, 59–82. [Google Scholar] [CrossRef] [PubMed]
  17. Hetherington, A.M.; Brownlee, C. The generation of Ca2+ signals in plants. Annu. Rev. Plant Biol. 2004, 55, 401–427. [Google Scholar] [CrossRef] [PubMed]
  18. Marten, H.; Konrad, K.R.; Dietrich, P.; Roelfsema, M.R.G.; Hedrich, R. Ca2+-Dependent and-Independent Abscisic Acid Activation of Plasma Membrane Anion Channels in Guard Cells of Nicotiana tabacum. Plant Physiol. 2007, 143, 28–37. [Google Scholar] [CrossRef] [PubMed]
  19. Kudla, J.; Batistic, O.; Hashimoto, K. Calcium Signals: The Lead Currency of Plant Information Processing. Plant Cell 2010, 22, 541–563. [Google Scholar] [CrossRef] [PubMed]
  20. Chen, Z.H.; Hills, A.; Lim, C.K.; Blatt, M.R. Dynamic regulation of guard cell anion channels by cytosolic free Ca2+ concentration and protein phosphorylation. Plant J. 2012, 61, 816–825. [Google Scholar] [CrossRef] [PubMed]
  21. Kim, M.C.; Chung, W.S.; Yun, D.J.; Cho, M.J. Calcium and Calmodulin-Mediated Regulation of Gene Expression in Plants. Mol. Plant 2009, 2, 13–21. [Google Scholar] [CrossRef] [PubMed]
  22. Yang, T.B.; Poovaiah, B.W. Calcium/calmodulin-mediated signal network in plants. Trends Plant Sci. 2003, 8, 505–512. [Google Scholar] [CrossRef] [PubMed]
  23. Adelman, J.P. SK Channels and Calmodulin. Channels 2015. [Google Scholar] [CrossRef] [PubMed]
  24. Halling, D.B.; Aracena-Parks, P.; Hamilton, S.L. Regulation of voltage-gated Ca2+ channels by calmodulin. Sci. Signal. 2006, 318, 1–11. [Google Scholar] [CrossRef] [PubMed]
  25. Wang, C.J.; Chung, B.C.; Yan, H.D.; Wang, H.G.; Lee, S.Y.; Pitt, G.S. Structural analyses of Ca2+/CaM interaction with NaV channel C-termini reveal mechanisms of calcium-dependent regulation. Nat. Commun. 2014, 5, 1–12. [Google Scholar] [CrossRef] [PubMed]
  26. Kollist, H.; Jossier, M.; Laanemets, K.; Thomine, S. Anion channel in plant cells. FEBS J. 2011, 278, 4277–4292. [Google Scholar] [CrossRef] [PubMed]
  27. Michelet, B.; Boutr, M. The Plasma Membrane H+-ATPase. Plant Physiol. 1995, 108, 1–6. [Google Scholar] [PubMed]
  28. Palmgren, M.G. Plant plasma membrane H+-ATPases: Powerhouses for nutrient uptake. Annu. Rev. Plant Physiol. Plant Mol. Biol. 2001, 52, 817–845. [Google Scholar] [CrossRef] [PubMed]
  29. Gilliham, M.; Tester, M. The regulation of anion loading to the maize root xylem. Plant Physiol. 2005, 137, 819–828. [Google Scholar] [CrossRef] [PubMed]
  30. Buchanan, B.B.; Gruissem, W.; Jones, R.L. Biochemistry & Molecular Biology of Plants; American Society of Plant Physiologists: Rockville, MD, USA, 2000. [Google Scholar]
  31. Zhang, X.C.; Gao, H.J.; Wu, H.H.; Yang, T.Y.; Zhang, Z.Z.; Mao, J.D.; Wan, X.C. Ca2+ and CaM are involved in Al3+ pretreatment-promoted fluoride accumulation in tea plants (Camellia sinesis L.). Plant Physiol. Biochem. 2015, 96, 288–295. [Google Scholar] [CrossRef] [PubMed]
  32. Hoeflich, K.P.; Ikura, M. Calmodulin in action: Diversity in target recognition and activation mechanisms. Cell 2002, 108, 739–742. [Google Scholar] [CrossRef]
  33. Liao, W.B.; Zhang, M.L.; Huang, G.B.; Yu, G.H. Ca2+ and CaM are involved in NO and H2O2-induced Adventitious Root Development in Marigold. J. Plant Growth Regul. 2012, 31, 253–264. [Google Scholar] [CrossRef]
  34. Hu, X.L.; Jiang, M.Y.; Zhang, J.H.; Zhang, A.Y.; Lin, F.; Tan, M.P. Calcium-calmodulin is required for abscisic acid-induced antioxidant defense and functions both upstream and downstream of H2O2 production in leaves of maize (Zea mays) plants. New Phytol. 2007, 173, 27–38. [Google Scholar] [CrossRef] [PubMed]
  35. Chen, T.; Wu, X.Q.; Chen, Y.M.; Li, X.; Huang, M.; Zheng, M.; Baluska, F.; Samaj, J.; Lin, J. Combined proteomic and cytological analysis of Ca2+-calmodulin regulation in picea meyeri pollen tube growth. Plant Physiol. 2009, 149, 1111–1126. [Google Scholar] [CrossRef] [PubMed]
  36. Antoine, A.F.; Faure, J.E.; Dumas, C.; Feijó, J.A. Differential contribution of cytoplasmic Ca2+ and Ca2+ influx to gamete fusion and egg activation in maize. Nat. Cell Biol. 2001, 3, 1120–1123. [Google Scholar] [CrossRef] [PubMed]
  37. Kim, Y.H.; Wang, M.Q.; Yu, B.; Zeng, Z.H.; Guo, F.; Han, N.; Bian, H.; Wang, J.; Pan, J.; Zhu, M. Bcl-2 suppresses activation of VPEs by inhibiting cytosolic Ca2+ level with elevated K+ efflux in NaCl-induced PCD in rice. Plant Physiol. Biochem. 2014, 80, 168–175. [Google Scholar] [CrossRef] [PubMed]
  38. Sun, J.; Zhang, X.; Deng, S.; Zhang, C.L.; Wang, M.J.; Ding, M.; Rui, D.; Xin, S.; Zhou, X.Y.; Lu, C.F.; et al. Extracellular ATP Signaling Is Mediated by H2O2 and Cytosolic Ca2+ in the Salt Response of Populus euphratica Cells. PLoS ONE 2012, 7, 1–15. [Google Scholar] [CrossRef] [PubMed]
  39. Roberts, S.K. Plasma membrane anion channels in higher plants and their putative functions in roots. New Phytol. 2006, 169, 647–666. [Google Scholar] [CrossRef] [PubMed]
  40. Johannes, E.; Crofts, A.; Sanders, D. Control of Cl Efflux in Chara corallina by Cytosolic pH, Free Ca2+, and Phosphorylation Indicates a Role of Plasma Membrane Anion Channels in Cytosolic pH Regulation. Plant Physiol. 1998, 118, 173–181. [Google Scholar] [CrossRef] [PubMed]
  41. Perochon, A.; Aldon, D.; Galaud, J.P.; Ranty, B. Calmodulin and calmodulin-like proteins in plant calcium signaling. Biochimie 2011, 93, 2048–2053. [Google Scholar] [CrossRef] [PubMed]
  42. Zhang, W.H.; Chen, Q.; Liu, Y.L. Relationship between tonoplast H+-ATPase activity, ion uptake and calcium in barley roots under NaCl stress. Acta Bot. Sin. 2002, 44, 667–672. [Google Scholar]
  43. Bouche, N.; Yellin, A.; Snedden, W.A.; Fromm, H. Plant-specific calmodulin-binding proteins. Annu. Rev. Plant Biol. 2005, 56, 435–466. [Google Scholar] [CrossRef] [PubMed]
  44. Pei, Z.M.; Ward, J.M.; Harper, J.F.; Schroeder, J.I. A novel chloride channel in Vicia faba guard cell vacuoles activated by the serine/threonine kinase, CDPK. EMBO J. 1996, 15, 6564–6574. [Google Scholar] [PubMed]
  45. Cheong, Y.H.; Pandey, G.K.; Grant, J.J.; Batistic, O.; Li, L.; Kim, B.G.; Li, L.G.; Kim, B.G.; Lee, S.C.; Kudla, J.; et al. Two calcineurin B-like calcium sensors, interacting with protein kinase CIPK23, regulate leaf transpiration and root potassium uptake in Arabidopsis. Plant J. 2007, 52, 223–239. [Google Scholar] [CrossRef] [PubMed]
  46. Shabala, S.; Cuin, T.A.; Pang, J.Y.; Percey, W.; Chen, Z.H.; Conn, S.; Eing, C.; Wegner, L.H. Xylem ionic relations and salinity tolerance in barley. Plant J. 2010, 61, 839–853. [Google Scholar] [CrossRef] [PubMed]
  47. Cuin, T.A.; Shabala, S. Exogenously Supplied Compatible Solutes Rapidly Ameliorate NaCl-induced Potassium Efflux from Barley Roots. Plant Cell Physiol. 2005, 46, 1924–1933. [Google Scholar] [CrossRef] [PubMed]
  48. Chen, Z.H.; Pottosin, I.I.; Cuin, T.A.; Fuglsang, A.T.; Tester, M.; Jha, D.; Isaac, Z.J.; Zhou, M.; Michael, G.P.; Newman, I.A. Root Plasma Membrane Transporters Controlling K+/Na+ Homeostasis in Salt-Stressed Barley. Plant Physiol. 2007, 145, 1714–1725. [Google Scholar] [CrossRef] [PubMed]
  49. Sun, J.; Wang, M.J.; Ding, M.Q.; Deng, S.R.; Liu, M.Q.; Lu, C.F.; Zhou, X.Y.; Shen, X.; Zheng, X.J.; Zhang, Z.K.; et al. H2O2 and cytosolic Ca2+ signals triggered by the PM H+-coupled transport system mediate K+/Na+ homeostasis in NaCl-stressed Populus euphratica cells. Plant Cell Environ. 2010, 33, 943–958. [Google Scholar] [CrossRef] [PubMed]
  50. Lamottea, O.; Courtoisa, C.; Dobrowolsk, G.; Bessona, A.; Pugina, A.; Wendehennea, D. Mechanisms of nitric-oxide-induced increase of free cytosolic Ca2+ concentration in Nicotiana plumbaginifolia cells. Free Radic. Biol. Med. 2006, 40, 1369–1376. [Google Scholar] [CrossRef] [PubMed]
  51. Nilius, B.; Droogmans, G. Amazing chloride channels: An overview. Acta Physiol. Scand. 2003, 177, 119–147. [Google Scholar] [CrossRef] [PubMed]
  52. Shabala, S.N.; Newman, I.A.; Morris, J. Oscillations in H+ and Ca2+ ion fluxes around the elongation region of corn roots and effects of external pH. Plant Physiol. 2000, 113, 111–118. [Google Scholar]
  53. Zhang, W.H.; Rengel, Z.; Kuo, J. Determination of intracellular Ca2+ in cells of intact wheat roots: loading of acetoxymethyl ester of Fluo-3 under low temperature. Plant J. 1998, 15, 147–151. [Google Scholar] [CrossRef]
  54. Yang, Y.L.; Guo, J.K.; Zhang, F.; Zhao, L.Q.; Zhang, L.X. NaCl induced changes of the H+-ATPase in root plasma membrane of two wheat cultivars. Plant Sci. 2004, 166, 913–938. [Google Scholar] [CrossRef]
  55. Sun, D.Y.; Bian, Y.Q.; Zhao, B.H.; Zhao, L.Y.; Yu, X.M.; Duan, S.J. The effects of extracellular calmodulin on cell wall regeneration of protoplasts and cell division. Plant Cell Physiol. 1995, 36, 133–138. [Google Scholar]
  56. Bradford, M.M. A rapid and sensitve method for the quantitation of microgram quantities of protein utilizing the principle of potein-dye binging. Anal. Biochem. 1976, 72, 248–254. [Google Scholar] [CrossRef]

