Article

SOCS3 Methylation Predicts a Poor Prognosis in HBV Infection-Related Hepatocellular Carcinoma

1
Department of Radiotherapy, Harbin Medical University Cancer Hospital, Harbin 150081, China
2
Department of Microbiology and Infectious Disease Center, School of Basic Medical Sciences, Peking University Health Science Center, Beijing 100191, China
*
Author to whom correspondence should be addressed.
These authors contributed equally to this work.
Int. J. Mol. Sci. 2015, 16(9), 22662-22675; https://doi.org/10.3390/ijms160922662
Submission received: 18 August 2015 / Revised: 11 September 2015 / Accepted: 11 September 2015 / Published: 18 September 2015
(This article belongs to the Special Issue Molecular Classification of Human Cancer: Diagnosis and Treatment)

Abstract

:
Suppressor of cytokine signaling 3 (SOCS3) plays crucial roles in JAK/STAT signaling pathway inhibition in hepatocellular carcinoma (HCC). However, the methylation status of SOCS3 in HBV infection-related HCC and the relationship between SOCS3 methylation and the clinical outcome remain unknown. Here, we reported that in HCC tumor tissues, two regions of the CpG island (CGI) in the SOCS3 promoter were subjected to methylation analysis and only the region close to the translational start site of SOCS3 was hypermethylated. In HCC tumor tissues, SOCS3 showed an increased methylation frequency and intensity compared with that in the adjacent non-tumor tissues. Moreover, SOCS3 expression was significantly down-regulated in HCC cell lines and tumor tissues, and this was inversely correlated with methylation. Kaplan–Meier curve analysis revealed that in patients with an hepatitis B virus (HBV) infection background, SOCS3 hypermethylation was significantly correlated with a poor clinical outcome of HCC patients. Our findings indicated that SOCS3 hypermethylation has already happened in non-tumor tissues and increased in both frequency and intensity in tumor tissues. This suggests that the methylation of SOCS3 could predict a poor prognosis in HBV infection-related HCC patients.

1. Introduction

Hepatocellular carcinoma (HCC) is a common malignancy worldwide with rapid progress and high short-term mortality. The initiation of HCC is intimately associated with chronically diseased liver tissue, induced by etiological factors such as hepatitis HBV or hepatitis C virus (HCV) infection, toxin exposure, excessive alcohol consumption, and/or other environmental or genetic factors [1]. Over 80% of HCC cases in China are attributed to chronic HBV infection [2,3]. Although surgical excision is still the most effective treatment so far, a large proportion of HCC patients show symptoms of intrahepatic metastases or post-surgical recurrence [1]. Therefore, the identification of more sensitive and specific biomarkers associated with HCC prognosis is essential to improve HCC management in China [4].
In the liver, the sequential progression to carcinoma is a multistep process with an accumulation of genetic and epigenetic alterations leading to the activation of oncogenes and the inactivation of tumor suppressor genes (TSG) [5,6]. DNA methylation, which is the first epigenetic regulation, has been suggested as one of the most important molecular mechanisms in hepatocarcinogenesis [5,7]. Mounting studies have revealed that HCC tumors exhibit specific DNA methylation signatures that are associated with major risk factors and tumor progression [8]. However, the methylation status of TSGs in HCC with different virus infection, especially HBV infection, is not fully understood.
The suppressor of cytokine signaling (SOCS) gene family has been found to play essential roles in suppressing tumor progression by inhibiting JAK/STAT, NFκB signaling, and promoting p53 signaling [9,10,11,12]. Among the SOCS family, SOCS3 has been reported to be hypermethylated in various kinds of cancers, including head and neck cancer, lung cancer, prostate cancer, Barrett esophagus carcinoma, and ulcerative colitis-related colorectal cancer [13,14,15,16,17,18,19]. In HCC, Niwa et al. revealed that SOCS3 was hypermethylated in 33.3% (6/18) of HCC tissues [20]. However, in our previous report, we did not observe SOCS3 hypermethylation in HBV-related HCC tissues [21]. These conflicting results may be due to the complicated etiological mechanism of HCC and the different detected loci in the SOCS3 promoter region. Therefore, it is imperative to explore the detailed methylation status of SOCS3 in HCC with different virus infection backgrounds and the relationship between its methylation and clinicopathology.
In this study, the methylation status of two loci of the CpG island (CGI) in the SOCS3 promoter was quantitatively investigated, with particular attention to the change in methylation intensities in primary HCC tissues with different virus infection backgrounds. Also, the clinicopathological significance of SOCS3 methylation status was statistically analyzed.

2. Results and Discussion

2.1. Results

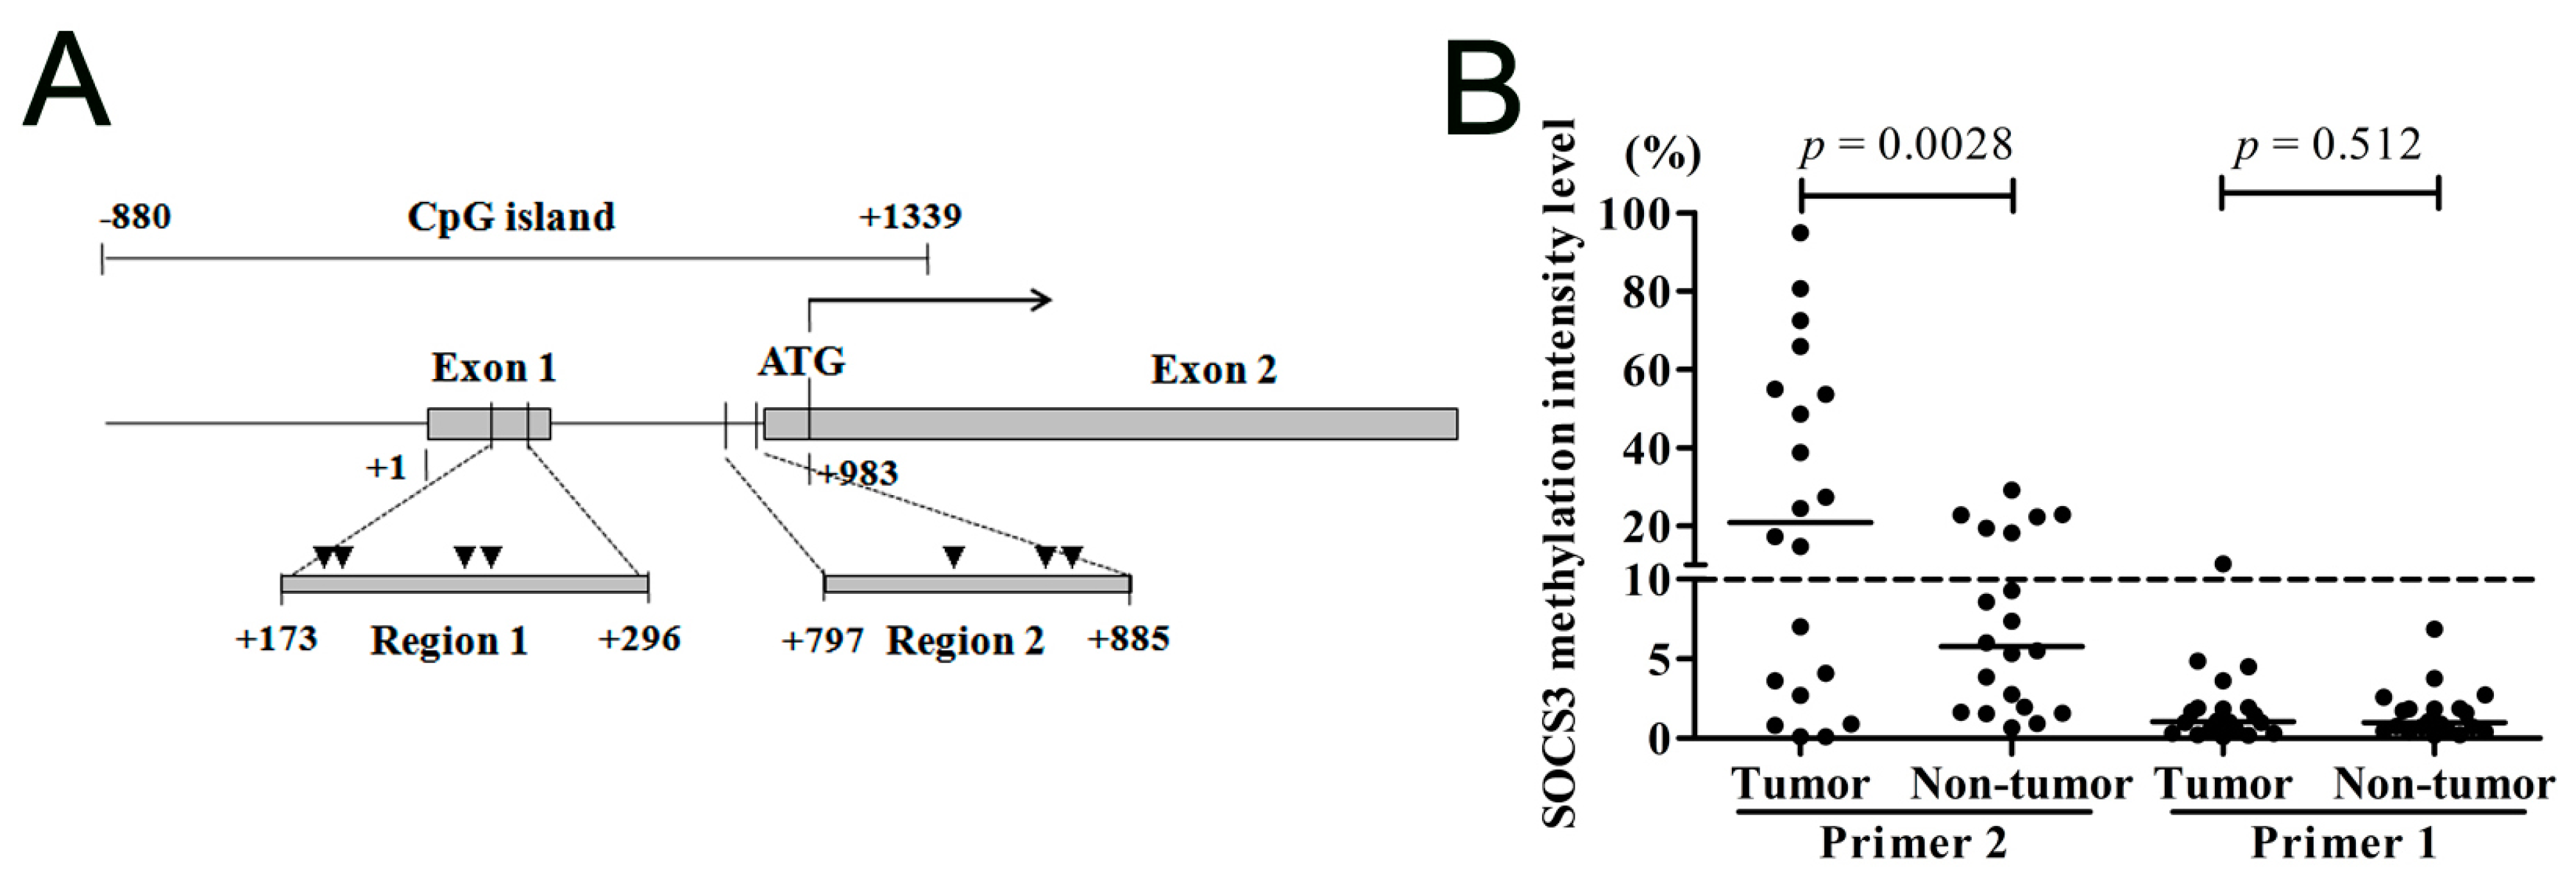
2.1.1. Suppressor of Cytokine Signaling 3 (SOCS3) CpG Island (CGI) Is Hypermethylated in the Region Close to the Translational Start Site

Using the online University of California Santa Cruz (UCSC) database, we searched for CGI at the SOCS3 promoter region and one CGI surrounding the SOCS3 gene promoter was predicted. This CGI region starts from −880 nt and ends at +1339 nt, covering the translation initiation site of the SOCS3 gene. In our previous study, we detected the methylation status in the CGI region from +173 to +296 nt (region 1) in HCC tissues and did not find any methylation in this region. However, Niwaet et al. observed obvious methylation in the CGI region in HCC tissues, which was close to the translational start site (Figure 1A). To investigate whether the above conflicting results were due to the different detected regions in the SOCS3 promoter, we designed another pair of primers to amplify the CGI region from +797 to +885 nt (region 2), which was close to the translational start site and near the locus reported in the Niwaet et al. report [20].
Firstly, we detected the methylation statuses of both region 1 and region 2 in 20 pairs of the HCC tumor and non-tumor tissues. With the cut-off value setting at 10%, any tissue that had a hypermethylation intensity ≥10% would be judged as the hypermethylation status, and the higher value implicated a higher CGI hypermethylation status in intensity [15]. As shown in Figure 1B, at target region 2, 12 of the 20 tumor tissues and six of the non-tumor tissues showed hypermethylation. The methylation intensity in HCC tumor tissues was also found to be significantly higher than that in the adjacent non-tumor tissues (p = 0.0028). However, the methylation status at region 1 showed no hypermethylation in both tumor and non-tumor tissues. Next, we detected the methylation statuses of both regions in eight HCC cell lines. We found that region 2 of the SOCS3 CGI was hypermethylated in cell lines Huh-7, Hep3B, PLC/PRF/5, and SMMC7721, while it was unmethylated in SNU449, SNU182, SK-Hep1, and Huh-1 cells (Figure 1C). Similar to that in HCC tissues, no methylation was detected in region 1 in all these cell lines (data not shown). These results indicated that it was the locus close to the translational start site that showed increased methylation, rather than that near the transcription start site.
Figure 1. The methylation statuses of two loci of the SOCS3 promoter in HCC tissues and cell lines. (A) Schematic representation of the two detected CGI loci of the SOCS3 gene. The transcriptional start site for SOCS3 gene is defined as +1. Shaded boxes are exons of SOCS3. “▼” represents the restriction enzyme cutting site; (B) The methylation statuses in the located regions of Primer 1 and Primer 2 in 20 pairs of tumors tissues and the adjacent non-tumor tissues; and (C) The methylation status of SOCS3 at region 2 in eight HCC cell lines.
Ijms 16 22662 g001aIjms 16 22662 g001b

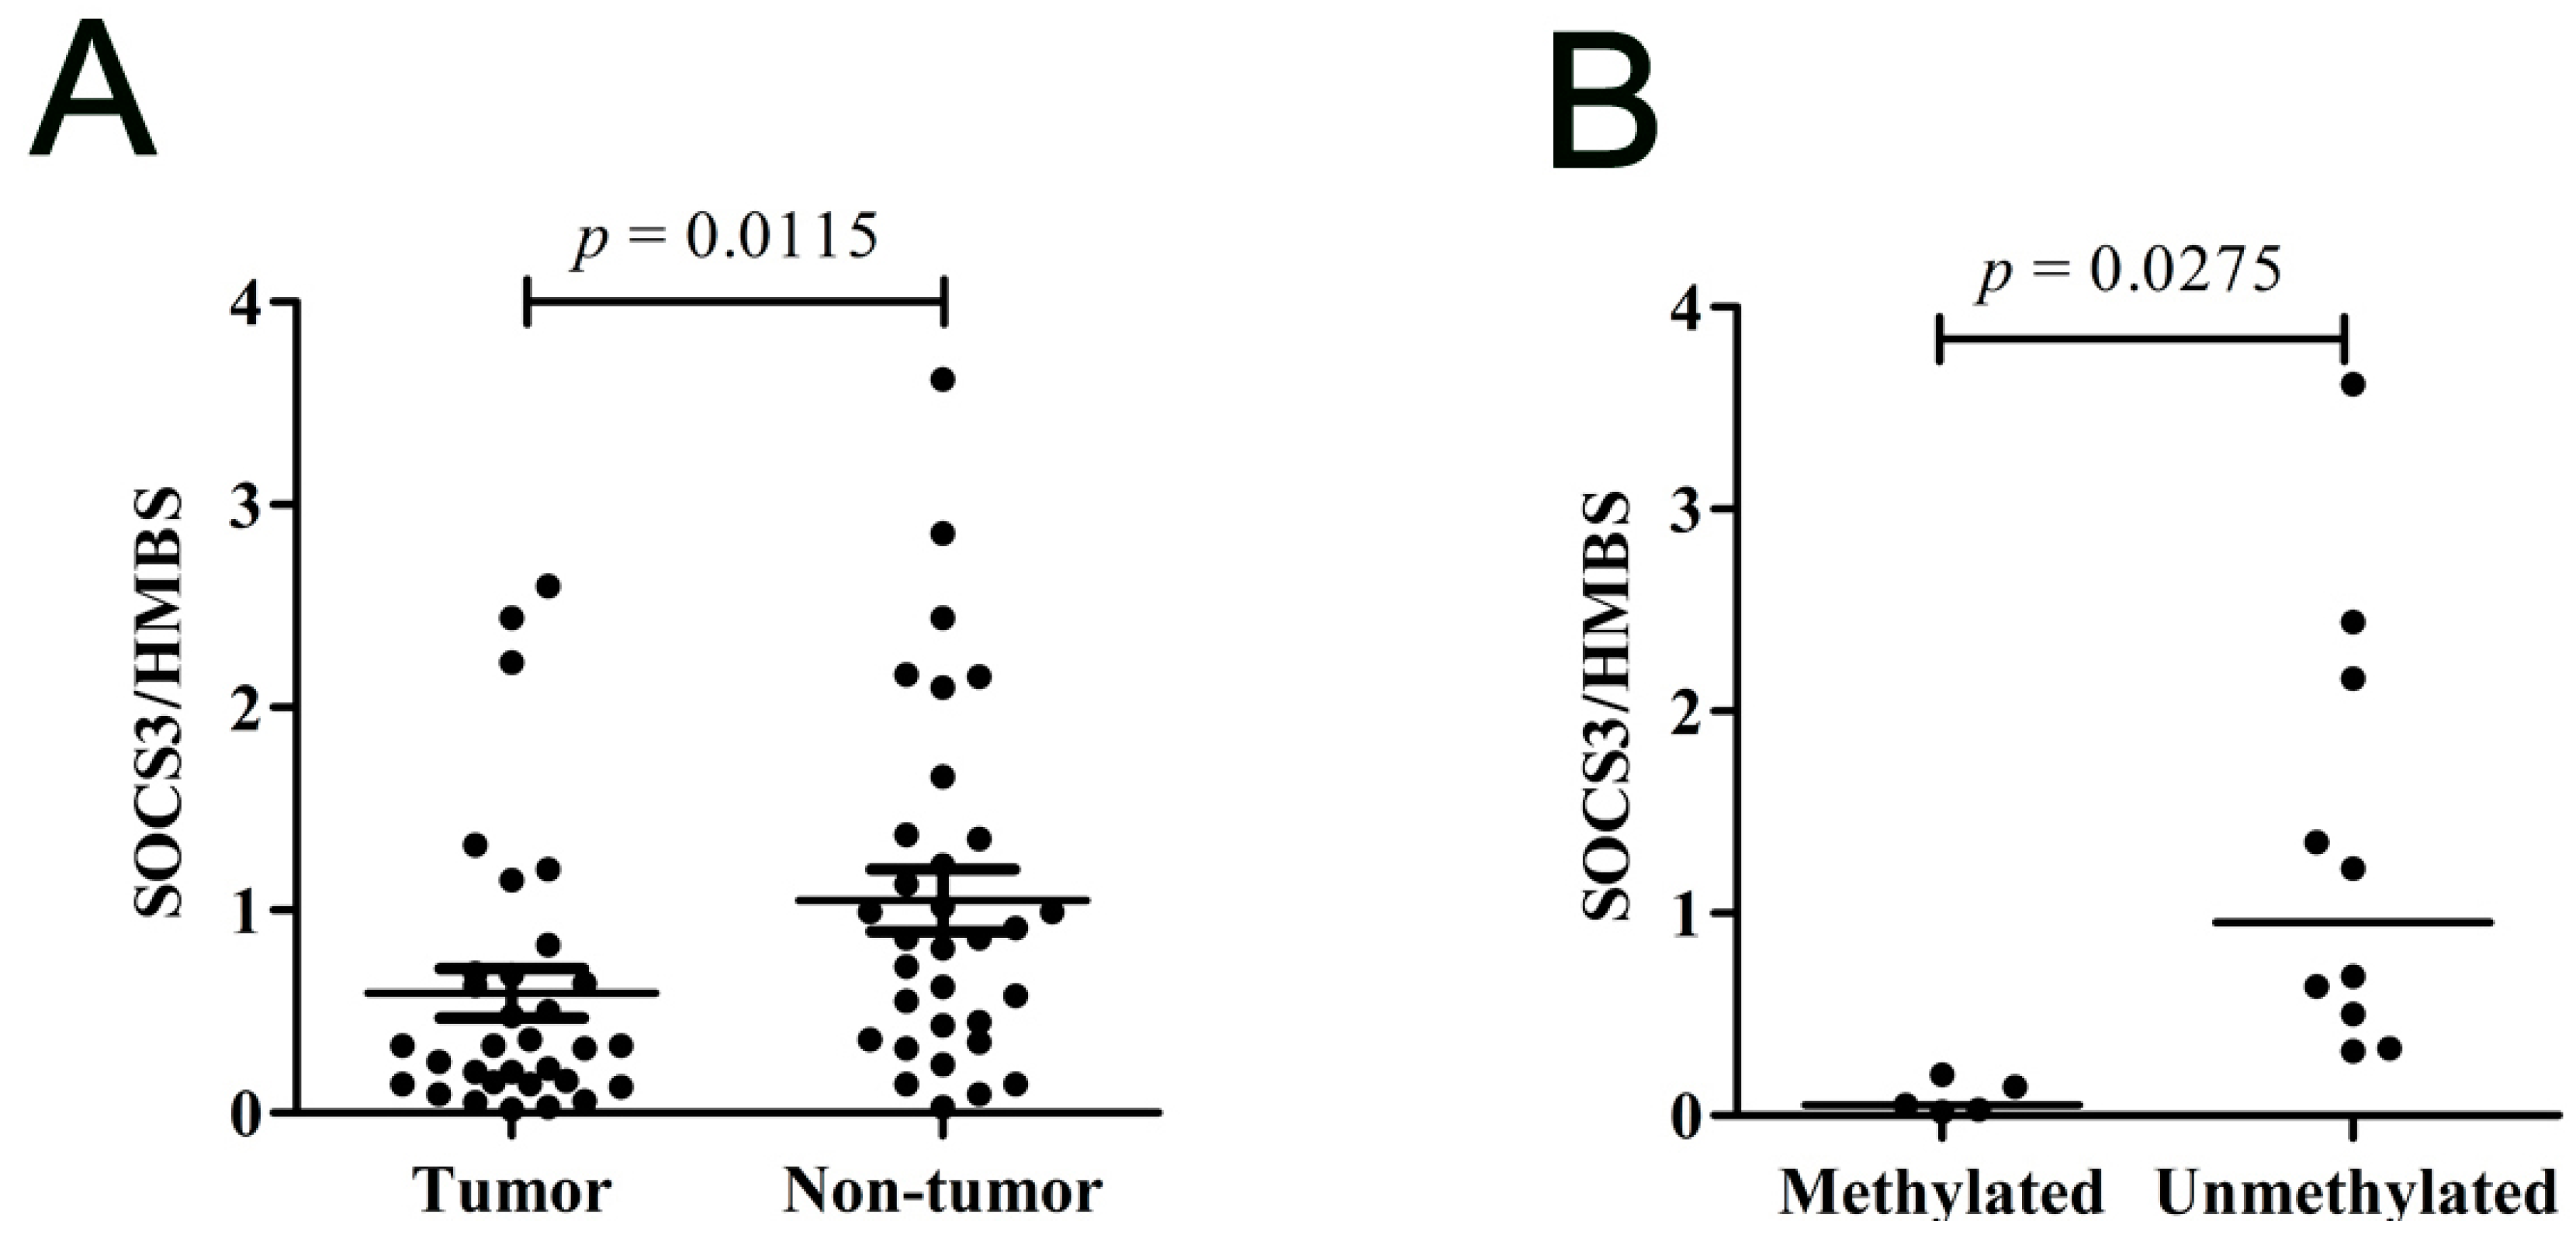
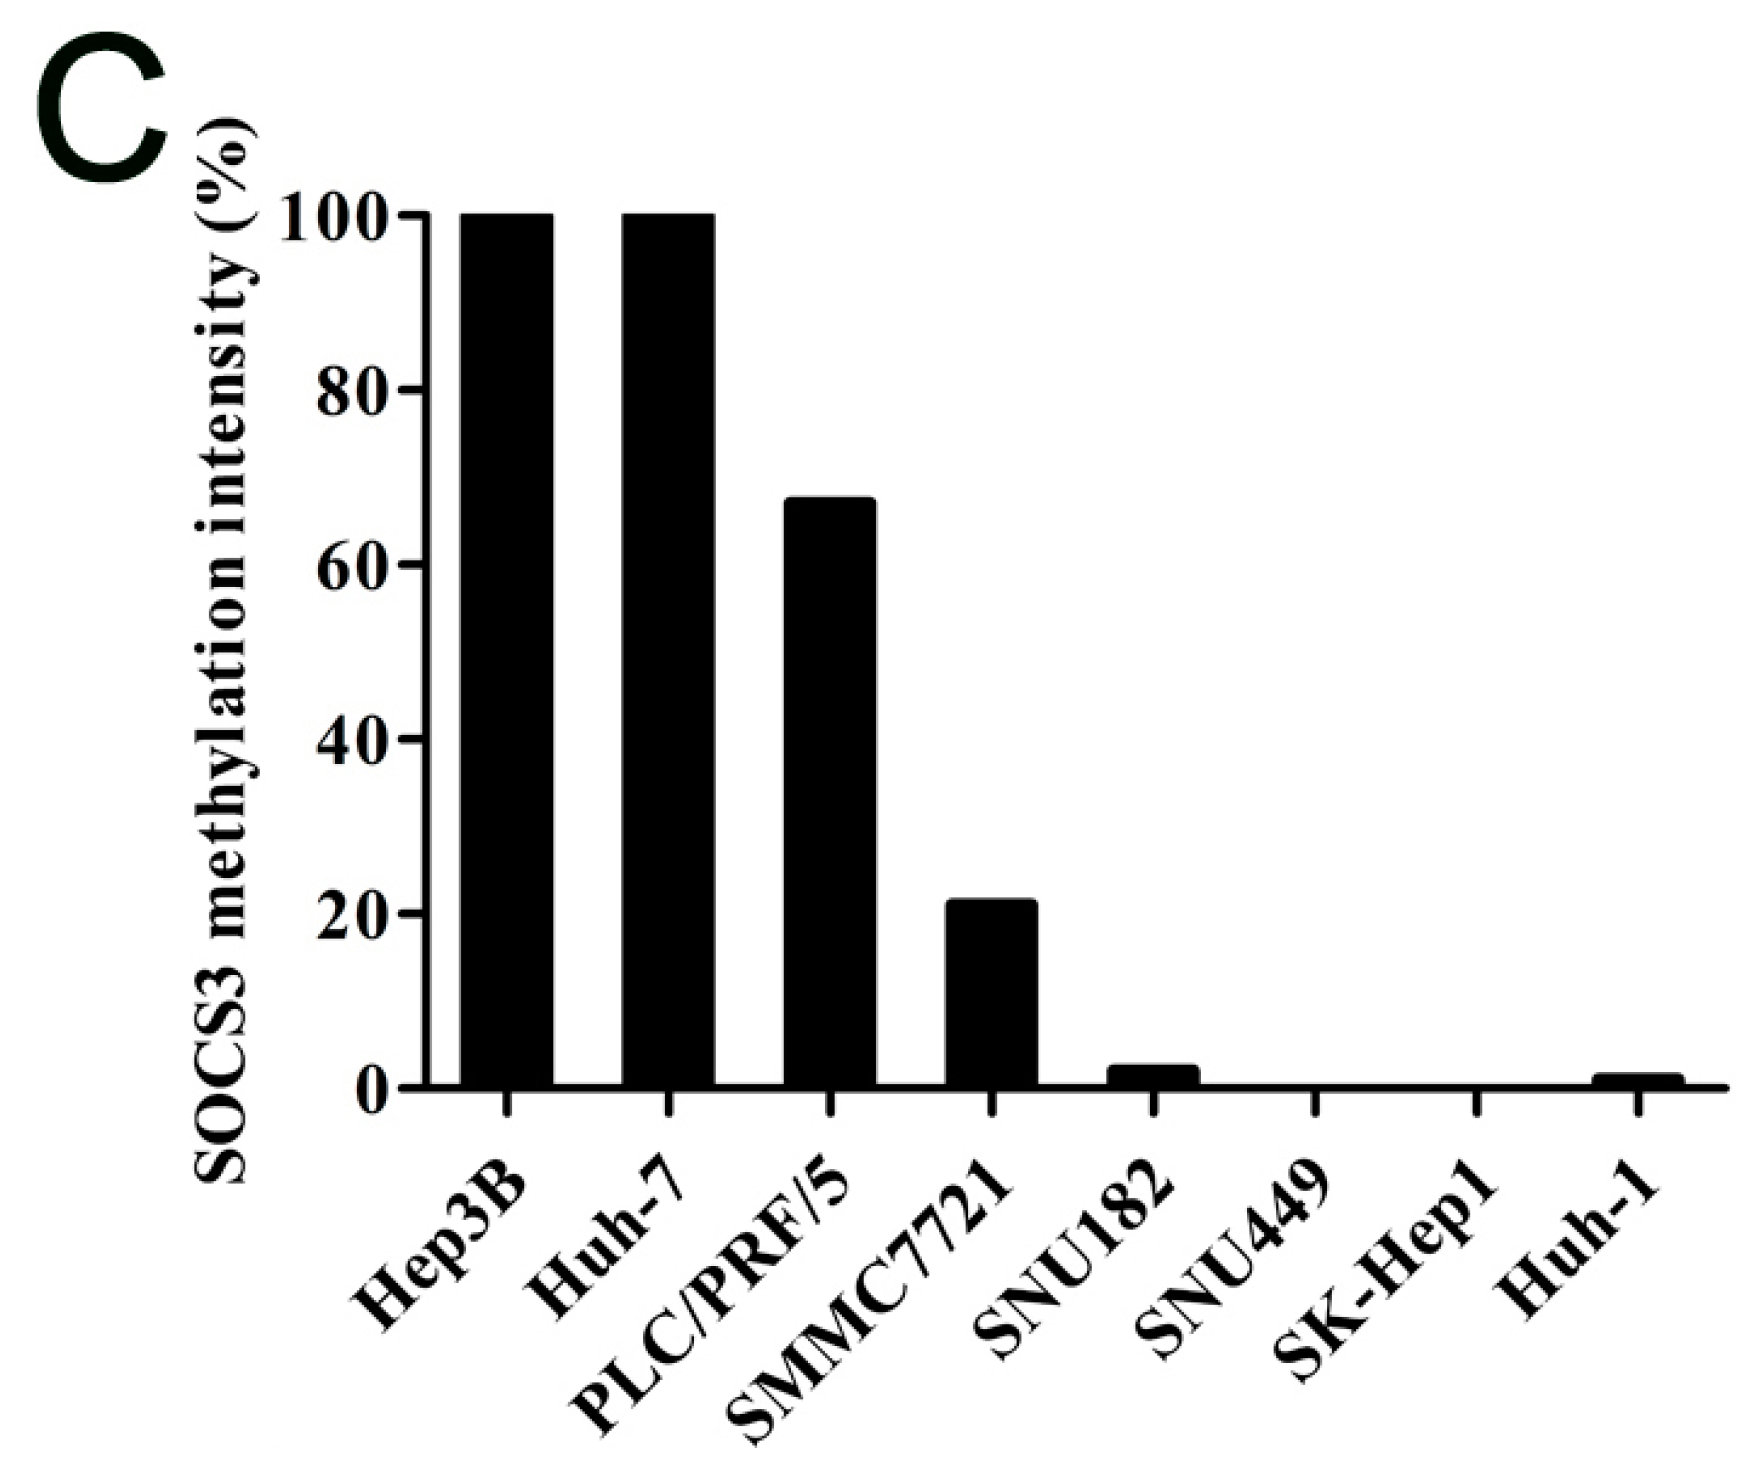
2.1.2. SOCS3 Methylation Is Associated with Altered mRNA Expression in Hepatocellular Carcinoma (HCC) Cell Lines

To further investigate whether the hypermethylation of region 2 in the SOCS3 CGI could suppress SOCS3 gene expression, the expression levels of SOCS3 in these eight HCC cell lines were quantitatively measured by real-time qPCR. As shown in Figure 2A, the SOCS3 mRNA expression level was relatively lower in cell lines with high SOCS3 CGI methylation such as Huh-7, Hep3B, PLC/PRF/5, and SMMC7721. In contrast, in cell lines with SOCS3 CGI non-methylation, such as SNU449, SNU182, and SK-Hep1 cells, the mRNA expression of SOCS3 was relatively higher. Next, we processed Huh-7, Hep3B, and SK-Hep1 cells with the treatment of DNA demethylation reagent 5-aza-2ʹ-deoxycytidine. We found that after 5-aza treatment, the mRNA levels of SOCS3 significantly increased in Huh-7 and Hep3B cells with hypermethylation, but not in the SK-Hep1 cells with non-methylation (Figure 2B). These data suggest that the methylation in CGI region 2 is associated with the down-regulation of SOCS3 expression in HCC cell lines. In addition, we noticed that the mRNA expression level of SOCS3 was also very low in Huh-1 cells with non-methylation, suggesting that besides methylation modulation, there might be other regulation mechanisms of SOCS3 expression, such as acetylation [22].
Figure 2. The mRNA expression of SOCS3 in HCC cell lines. (A) The mRNA expression levels of SOCS3 in eight cell lines; and (B) the normalized mRNA expression levels of SOCS3 in cell lines Huh-7, Hep3B, and SK-Hep1 after treatment with 5-Aza-2ʹ-deoxycytidine for three days.
Ijms 16 22662 g002

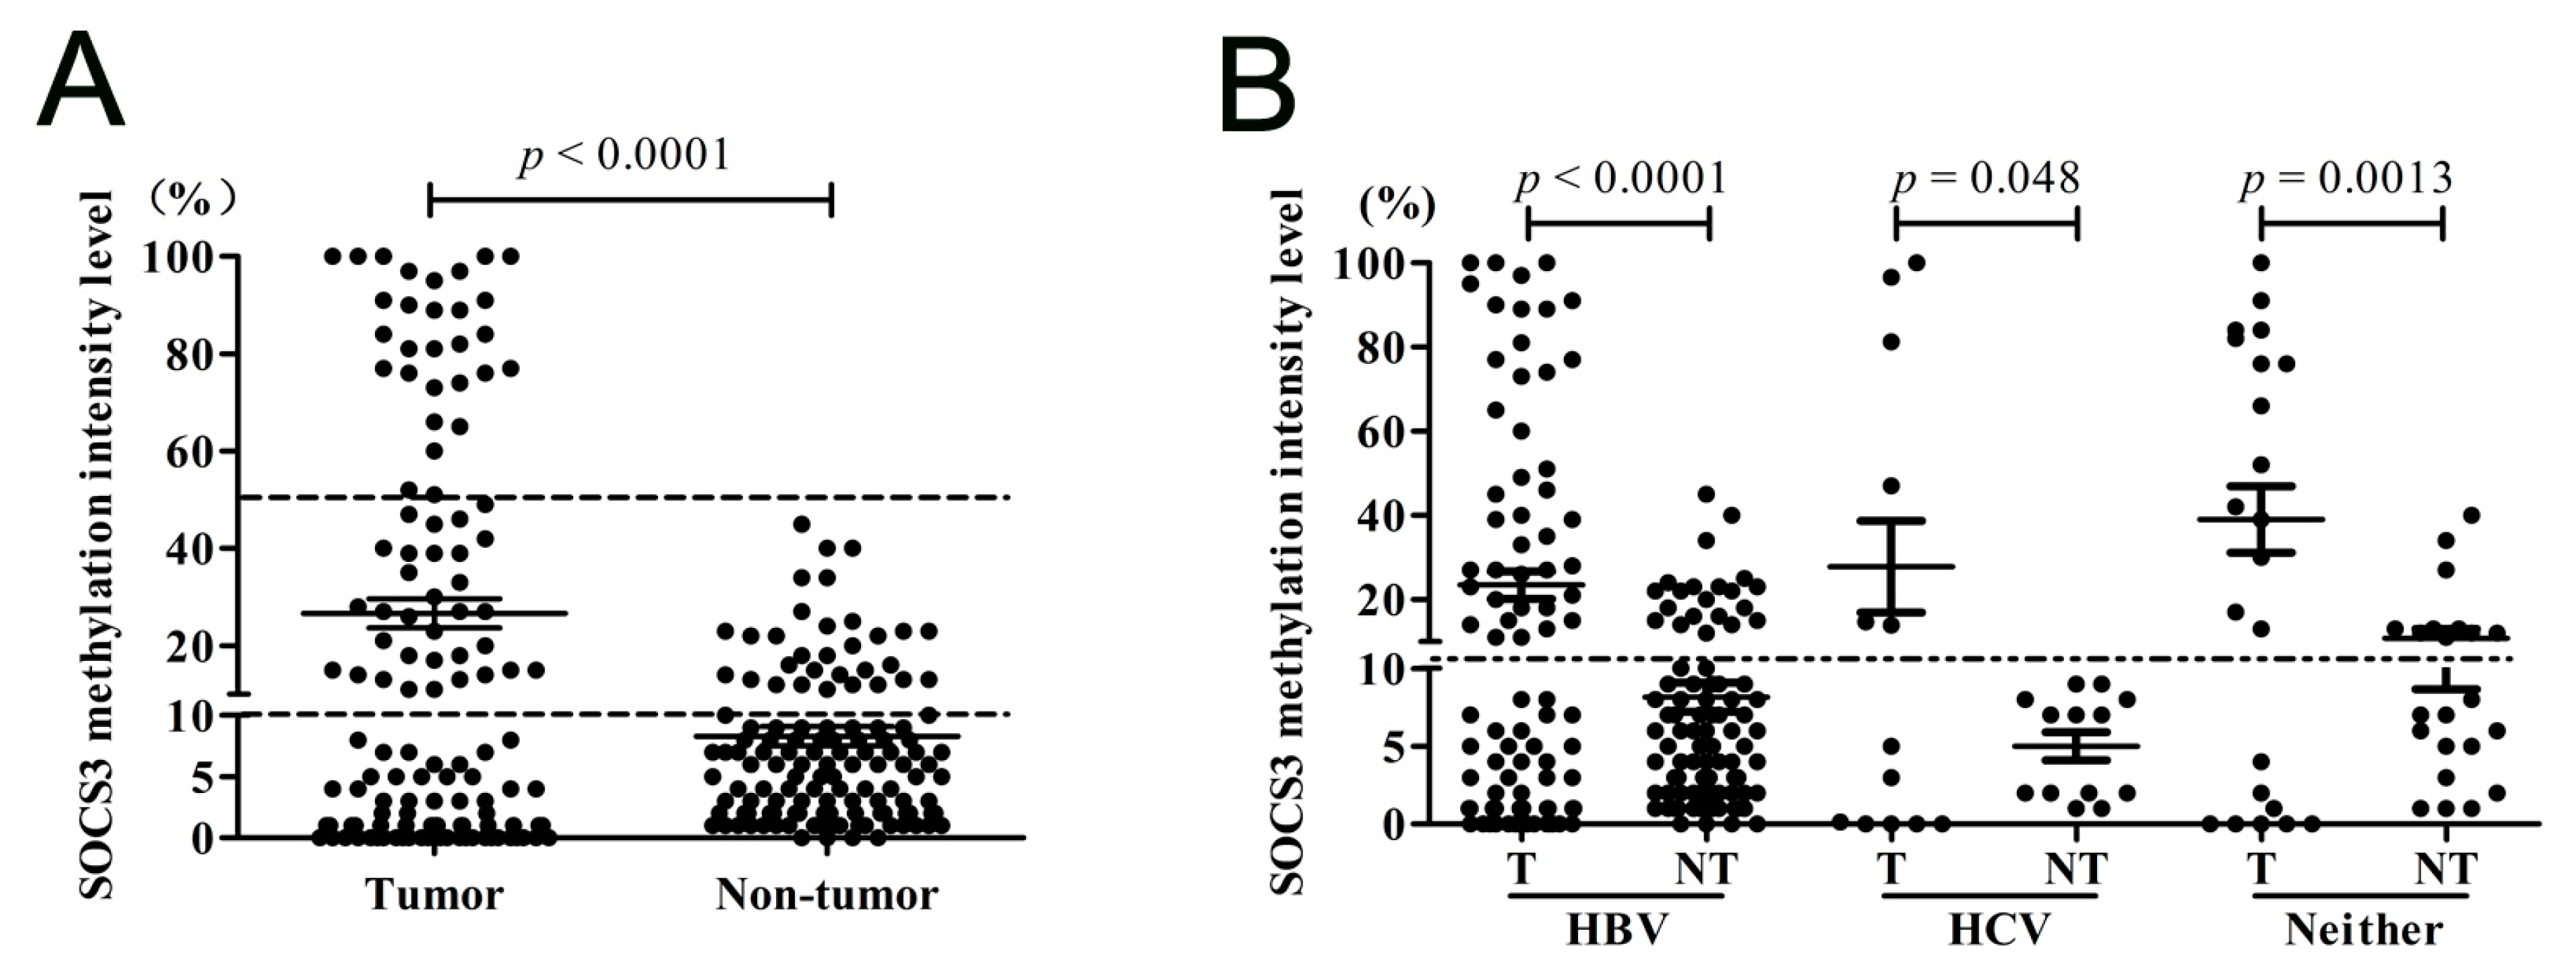
2.1.3. SOCS3 CGI Is Hypermethylated in Primary HCC Tumor Tissues

Next, we detected the methylation status of region 2 in SOCS3 CGI in an enlarged HCC sample. In the paired 127 HCC specimens, 61 (48.03%) of the tumor tissues and 32 (25.21%) of the adjacent non-tumor tissues showed methylation (p = 0.0002), which meant that in non-tumor tissues, the SOCS3 methylation had already happened. Meanwhile, the hypermethylation intensity in tumor tissues was significantly higher than that in the adjacent non-tumor tissues (26.63% vs. 8.31%, p < 0.0001, Figure 3A). In addition, in tumor tissues, there were 26.77% (34/127) specimens in which he SOCS3 methylation intensity was over 40%, while there were only 2.36% (3/127) in non-tumor tissues.
To test whether the SOCS3 CGI methylation in HCC tissues was associated with different virus infections, we analyzed the methylation frequency and intensity among 92 pairs of HCC tissues with HBV infection, 13 pairs with HCV infection, and 22 pairs with neither HBV nor HCV infection. In these three groups of HCC, the methylation frequencies in tumor tissues were 44.57% (41/92), 46.15% (6/13), and 63.63% (14/22), respectively; and in the adjacent non-tumor tissues, 25% (23/92), 0 (0/13), and 45.45% (10/22). Additionally, the methylation intensity of tumor tissues in each group was significantly higher than that in their corresponding non-tumor tissues (p < 0.0001, p = 0.048, and p = 0.0013). However, no marked difference was found among the tumor tissues with different virus infection backgrounds (Figure 3B). Taken together, these results suggested that the frequency of SOCS3 CGI hypermethylation in HCC tissues was not related to the different virus infection backgrounds of HCC.
Figure 3. The methylation statuses of SOCS3 at region 2 in HCC tumor and adjacent non-tumor tissues. (A) The methylation status in 127 enlarged paired tumor tissues and non-tumor tissues; and (B) the methylation status in tumor tissues and adjacent non-tumor tissues with different virus infection backgrounds.
Ijms 16 22662 g003

2.1.4. SOCS3 Is down-Regulated in Primary HCC Tumor Tissues

We also detected SOCS3 mRNA expression levels in 32 pairs of HBV-related HCC tumor tissues and non-tumor tissues (Figure 4A). As expected, the level of SOCS3 mRNA in tumor tissues was statistically lower than that in non-tumor tissues (p = 0.0115). Among these 32 tumor tissues, the SOCS3 methylation intensity in five tumor tissues was extremely high (≥40%) and 10 specimens unmethylated (<3%). We found that the expression level of SOCS3 in tumor tissues with extremely high SOCS3 methylation was significantly lower than that in the tumor tissues without methylation (Figure 4B). Comparing the SOCS3 expression levels of these two groups, they was inversely correlated with the CGI hypermethylation status. These data further demonstrated that the down-regulation of SOCS3 expression in HCC tissues was associated with SOCS3 methylation.
Figure 4. SOCS3 mRNA expression levels in tumor and non-tumor tissues. (A) SOCS3 mRNA expression level in 32 pairs of HCC tumor and non-tumor tissues; and (B) SOCS3 expression level in hypermethylated HCC tissues (intensity ≥ 40%) and unmethylated tissues (intensity < 3%).
Ijms 16 22662 g004

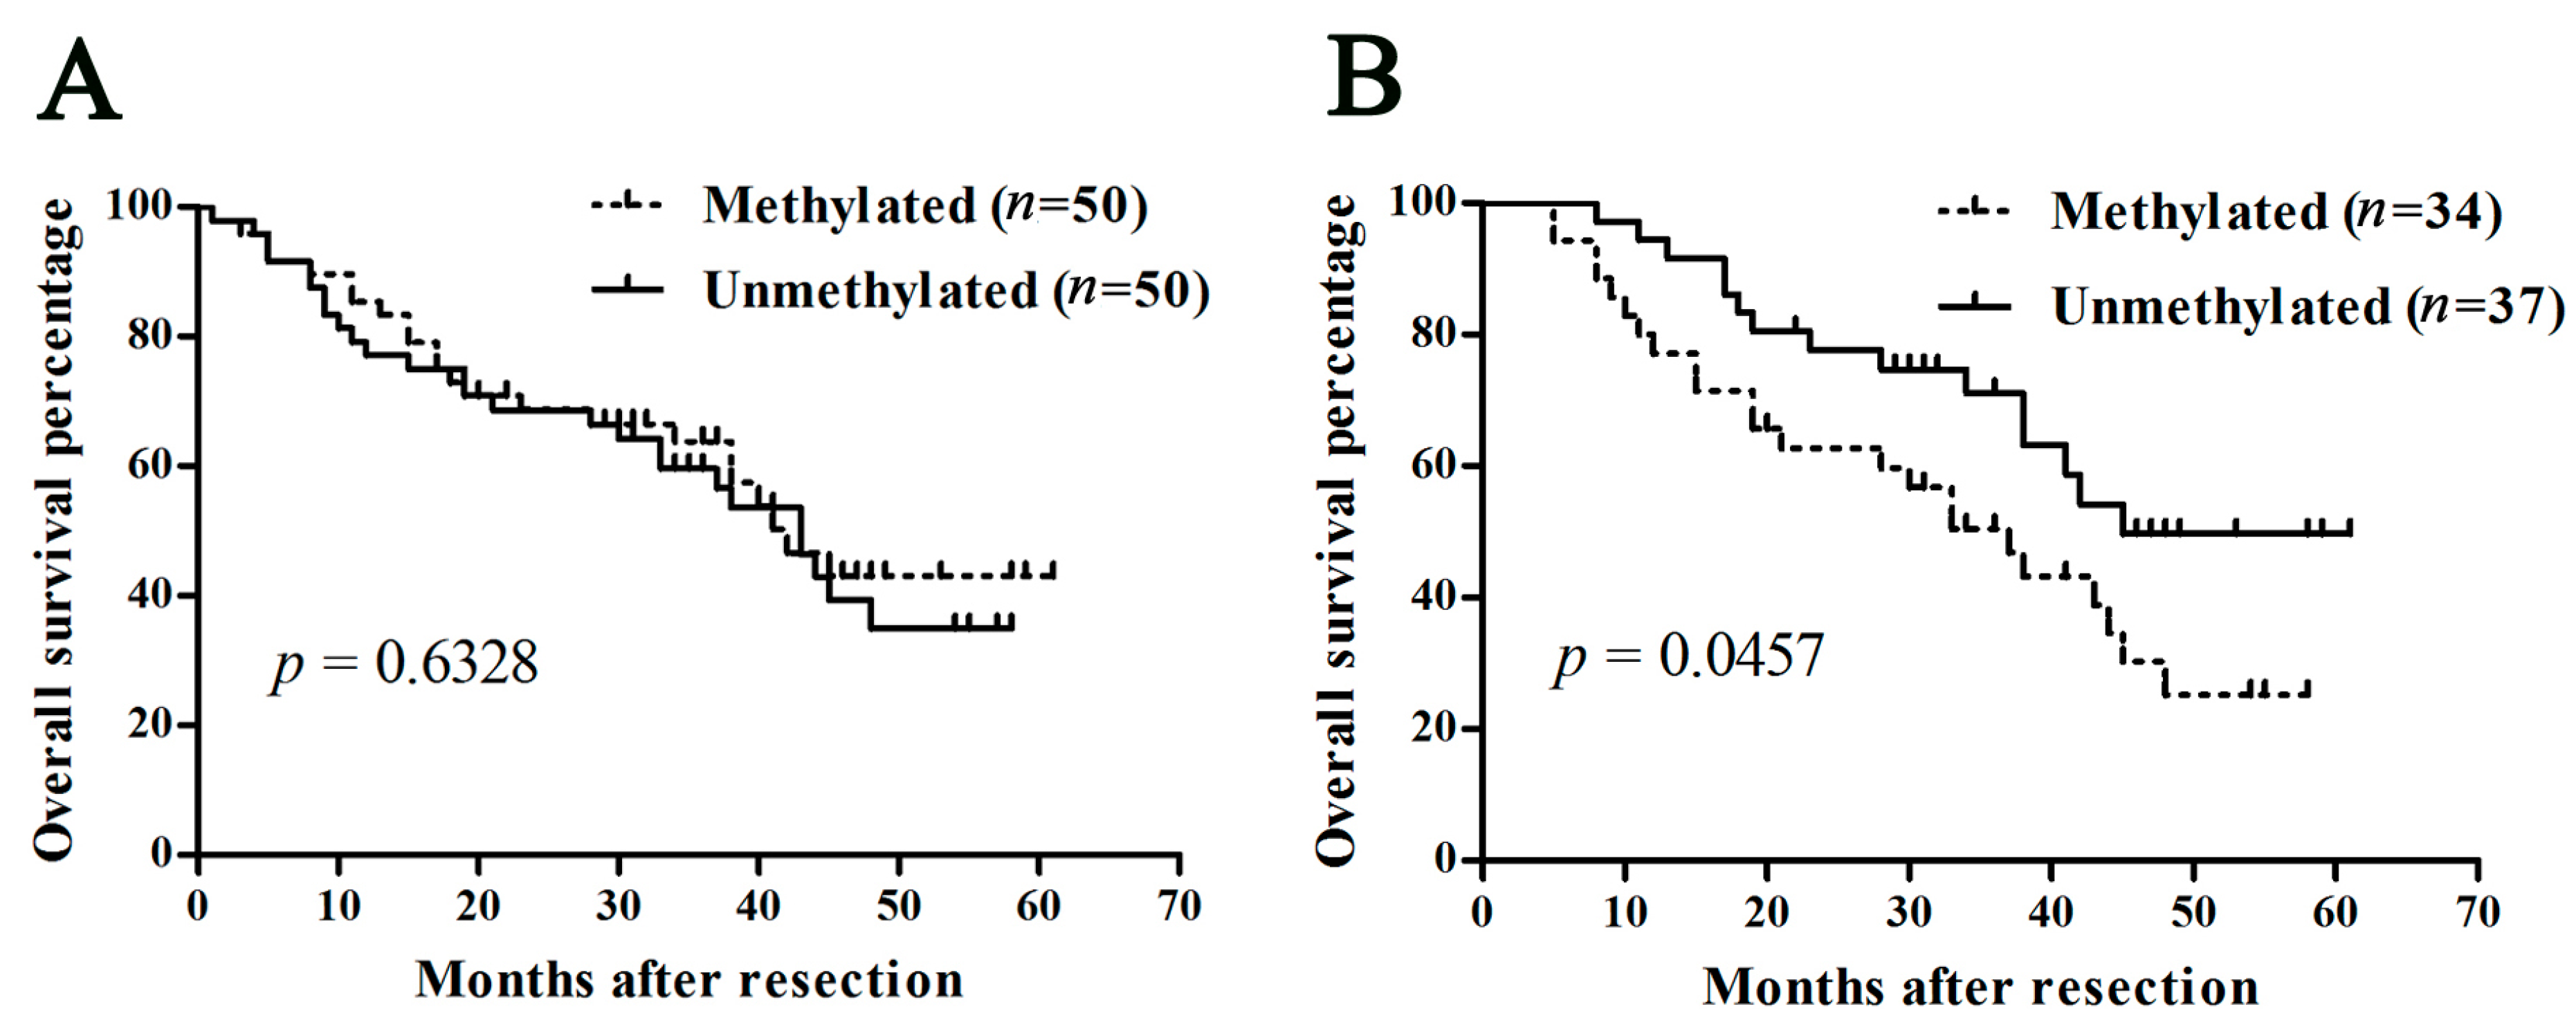
2.1.5. Methylation of SOCS3 Is Associated with the Poor Prognosis of HCC with Hepatitis B Virus (HBV) Infection

We then statistically analyzed the association between SOCS3 hypermethylation and patient clinicopathological features in HCC cases. As shown in Table 1, SOCS3 methylation was not correlated with the tumor size, tumor-node-metastasis (TNM) stage, cirrhosis background, portal vein tumor thrombosis, and tumor encapsulation of the HCC patients. It was worth noting that in the older group of HCC patients (≥55 years), the methylation frequency of SOCS3 in HCC tissues was higher than that in the younger group (<55 years). However, the difference of SOCS3 methylation between younger and older HCC groups was not statistically significant.
We then evaluated the prognostic value of the SOCS3 methylation status in HCC patients. The Kaplan–Meier curve analysis indicated that, for all the patients, there was no difference in clinical outcome between the methylated and unmethylated patients (p = 0.633, Figure 5A). However, in patients with an HBV infection background, SOCS3 hypermethylation was significantly correlated with the poor prognosis of HCC patients (p = 0.0457, Figure 5B), which meant that HCC patients with SOCS3 hypermethylation exhibited shortened overall survival compared with those with SOCS3 unmethylation, while no correlation was found in the rest of the patients with HCV or no virus infection background (data not shown).
Table 1. SOCS3 CGI hypermethylation and clinicopathological correlations in HCC.
FeatureHypermethylation (n = 61)Unmethylation (n = 66)p-Value
Gender
Male46 (52.87%)41 (47.13%)0.107
Female15 (37.5%)25 (62.5%)
Age
≥5542 (54.5%)35 (45.5%)0.068
<5519 (38%)31 (62%)
Cirrhosis
Yes47 (47.47%)52 (52.53%)0.813
No14 (50%)14 (50%)
TNM stage
I–II22 (48.89%)23 (51.11%)0.886
III–IV39 (47.56%)43 (52.44%)
Portal vein tumor thrombosis
Present9 (40.91%)13 (59.09%)0.267
Absent52 (50.98%)50 (49.02%)
Tumor size
≥5 cm46 (47.92%)50 (52.08%)0.964
<5 cm15 (48.39%)16 (51.61%)
Tumor encapsulation
Complete52 (50%)52 (50%)0.800
Incomplete6 (37.5%)10 (62.5%)
Figure 5. Kaplan–Meier survival plots for SOCS3 methylation in HCC patients. Overall survival after surgery according to SOCS3 methylation status in (A) general HCC patients and (B) HBV infection-related HCC patients.
Ijms 16 22662 g005

2.2. Discussion

The aberration of SOCS3 in human malignancy has been noted in recent years, but the detailed methylation status of SOCS3 in HCC with different virus infection backgrounds has not been well understood. Here, we confirmed that SOCS3 was hypermethylated in HCC tissues and SOCS3 hypermethylation was significantly correlated with the poor prognosis of HCC patients with HBV infection.
Using Methylation-sensitive restriction enzyme-based quantitative PCR (MSRE-qPCR) assay, we found that it was the CGI region close to the translational start site of the SOCS3 gene that was frequently hypermethylated in HCC tumor tissues and cell lines. SOCS3 hypermethylation in HCC tissues was not related to the etiological mechanism of HCC. However, SOCS3 CGI methylation was associated with poor prognosis in HCC with an HBV infection background, while it was not associated with poor prognosis in HCC with HCV or no virus infection background, which indicated that SOCS3 might play a more powerful role in HBV infection-related HCC; the detection of the methylation of the SOCS3 gene was of value for the prognosis of HCC with HBV infection. Additionally, we also found that SOCS3 CGI hypermethylation occurred partially in non-tumor tissues, although its intensity and frequency were far lower than those in tumor tissues. Since most of these HCC patients had a cirrhosis background, it was reasonable to suppose a potential oncogenic role for SOCS3 hypermethylation during hepatocarcinogenesis from as early as the precancerous cirrhotic stage. Furthermore, no methylation was found in non-tumor tissues in HCC patients with HCV infection, suggesting that different hepatitis viruses might have different effects on the methylation status of SOCS3.
Aberrant methylation of gene promoter regions is one of the mechanisms for TSG inactivation in cancers. The decreased expression of SOCS3 has been reported to be correlated with poor patient survival in HCC tissues [23]. We also observed the frequent down-regulation of SOCS3 mRNA levels in HCC cell lines and tumor tissues, which was inversely associated with the SOCS3 methylation status. In addition, treatment by the demethylation agent could restore SOCS3 expression in the methylated cell lines. These findings confirmed that methylation modulation was an important inhibiting factor for SOCS3 expression. However, in Huh-1 cell lines and some HCC tissues with low expression of SOCS3, no methylation was detected, which indicated that other mechanisms could also lead to the down-regulation of SOCS3, including mutation, acetylation, and microRNA regulation, etc.
It has been reported that through inhibiting the JAK/STAT signaling pathway, the SOCS gene family plays an important role in suppressing tumor initiation and development [14]. As an essential member of this gene family, SOCS3 may function as a tumor suppressor gene. In previous reports, SOCS3 down-regulation was associated with vascular invasion and overall survival [24,25]. The silence of SOCS3 expression facilitated tumor formation and growth in lung and liver [26], while the loss of SOCS3 could promote aggressiveness in hepatocellular carcinoma [27]. However, the underlying mechanism of SOCS3 in the pathogenesis of HCC remains elusive. Further study should be conducted to determine the precise intracellular signaling and explore potential mechanisms of SOCS3 in the initiation and development of HCC.
In conclusion, our findings suggest that it is the CGI region close to the translational start site that is methylated in HCC, which might contribute to the aberrant expression of SOCS3. The hypermethylation of SOCS3 has already happened in non-tumor tissues and increased in tumors in both frequency and intensity. SOCS3 CGI methylation was associated with poor prognosis in HCC with a HBV infection background. However, it still needs a larger cohort to confirm this result.

3. Experimental Section

3.1. Tissue Samples

Primary HCC and the adjacent non-tumor tissues were obtained from 127 patients who underwent routine curative surgical treatment at Henan Cancer Hospital in Zhengzhou, Henan Province, China, from 2008 to 2014. Among the 127 patients, 92 patients were infected with HBV, 13 patients with HCV, and 22 patients with no virus infection background. All patients were diagnosed by ultrasonography and computed tomography, and confirmed by liver biopsy. No patients had received radiotherapy or chemotherapy prior to surgery. The 127 patients were histologically diagnosed with HCC. The clinicopathological characteristics were shown in Table 2. The follow-up data were described in detail previously [28]. The study protocol was approved by the institute ethics committee, and informed consent was acquired from all patients and donors before the study commenced.
Table 2. Clinicopathological parameters of 127 patients with HCC.
Clinicopathological Parameter VariablesCases n (%) n = 127
Age
Median (Range)57 (11–80)
Gender
Male87 (68.50)
Female40 (31.50)
Liver cirrhosis
Yes99 (77.95)
No28 (22.05)
TNM stage
I–II45 (35.43)
III–IV82 (64.57)
Portal vein tumor thrombosis
Present22 (17.32)
Absent102 (80.32)
N/A3 (2.36)
Tumor size
≥5 cm96 (75.59)
<5 cm31 (24.41)
Tumor encapsulation
Complete104 (81.89)
Incomplete16 (12.60)
N/A7 (5.51)
All patients were from the local ethnic Chinese Han population. TNM: Tumor, Lymph Node; Metastasis; and N/A: Not available.

3.2. Cell Culture and 5-Aza-2ʹ-Deoxycytidine Treatment

Human HCC cell lines SMMC7721, Huh-1, Huh-7, Hep3B, SNU449, SK-Hep1, SNU182, and PLC/PRF/5 were kept in our laboratory and maintained in either Dulbecco’s Modified Eagle Medium (DMEM) or Roswell Park Memorial Institute (RPMI) 1640 supplemented with 10% fetal bovine serum (GIBCO, Carlsbad, CA, USA). For 5-aza-2′-deoxycytidine treatment, cells were seeded in six-well plates at a concentration of 2–2.5 × 10⁵ cells per well and treated with 2 μM of 5-aza-2ʹ-deoxycytidine for three days.

3.3. DNA Extraction and Methylation Assay

Genomic DNA was isolated using DNeasy Blood & Tissue Kit (Qiagen, Germantown, MD, USA) and was quantified using NanoDrop 2000 spectrophotometer (Thermo Scientific, Waltham, MA, USA). MSRE-qPCR was performed to detect the methylation status of SOCS3 as previously described [29]. The methylation primers of SOCS3 were as follows: Primer 1, forward: AGCTCGAGGGACGCGCGCGCGAA, reverse: CTGAGCCCCCTCGGGTC-CCCAAG; Primer 2, forward: GGTGCCCCAGTCGCTCGGCGAAG, reverse: GGAAGGCG-CGAGCGCGTTGAGTGC. The cut-off value was set at 10%, as previously report [21].

3.4. RNA Extraction and Real-Time RT-qPCR

Total RNA was prepared using total RNA isolation (TRIZOL) reagents (Invitrogen, Carlsbad, CA, USA) in accordance with the manufacturer’s instructions. The expression level of SOCS3 was measured through the real-time RT-qPCR assay using the Roche lightcycler 480 (Roche, Mannheim, Germany) according to the manufacturer’s instructions. The house-keeping gene HMBS was included in the assay as control reference to normalize the expression levels, and primers of HMBS have been described previously [30]. The SOCS3 qPCR primers were as follows: forward: GGAGACTTCGATTCGGGACC; reverse: GGTACTCGCTCTTGGAGCTG. Each experiment was conducted in duplicate or triplicate, and the comparative Ct method (2−∆Ct) was adopted to determine the relative expression levels of SOCS3.

3.5. Statistical Analyses

The differences between groups were analyzed by two-tailed paired or unpaired t-test. The χ2 test or Fisher’s exact test were adopted to determine the association between the SOCS3 methylation status and the clinicopathological features. The Kaplan–Meier analysis with log-rank test was used to analyze the primary liver cancer (PLC) prognosis and survival time. All of the statistical analyses were performed by GRAPHPAD PRISM software (GraphPad Software, Inc., San Diego, CA, USA). In all cases, a p-value of less than 0.05 was considered significant.

4. Conclusions

Our findings suggested that SOCS3 hypermethylation has already happened in non-tumor tissues, while its frequency and intensity were increased in tumors. The methylation of SOCS3 predicted a poor prognosis in HBV infection-related HCC patients.

Acknowledgments

This work was supported by the Doctoral Fund of Ministry of Education of China (20110001120017), the National S & T Major Project for Infectious Diseases (2012ZX10004-904) and the National Natural Science Foundation of China (Grant Nos. 81101539 and 81372603).

Author Contributions

Xin Zhang performed the whole experiment, analyzed the data and wrote the manuscript; Xiaolei Zhang conceived and designed the study, and also prepared the entire manuscript; Xiangmei Chen helped the analysis with constructive discussions and revised the article critically for important intellectual content; Qingshan You generally supervised the research, reviewed and amended the manuscript. All authors read and approved the manuscript.

Conflicts of Interest

The authors declare no conflict of interest.

References

  1. Portolani, N.; Coniglio, A.; Ghidoni, S.; Giovanelli, M.; Benetti, A.; Tiberio, G.A.; Giulini, S.M. Early and late recurrence after liver resection for hepatocellular carcinoma: Prognostic and therapeutic implications. Ann. Surg. 2006, 243, 229–235. [Google Scholar] [PubMed]
  2. Wang, H.Q.; Yang, J.; Yan, L.N.; Zhang, X.W.; Yang, J.Y. Liver resection in hepatitis B related-hepatocellular carcinoma: Clinical outcomes and safety in elderly patients. World J. Gastroenterol. 2014, 20, 6620–6625. [Google Scholar] [CrossRef]
  3. Yeo, W.; Mo, F.K.; Chan, S.L.; Leung, N.W.; Hui, P.; Lam, W.Y.; Mok, T.S.; Lam, K.C.; Ho, W.M.; Koh, J.; et al. Hepatitis B viral load predicts survival of HCC patients undergoing systemic chemotherapy. Hepatology 2007, 45, 1382–1389. [Google Scholar] [CrossRef] [PubMed]
  4. Mikeska, T.; Bock, C.; Do, H.; Dobrovic, A. DNA methylation biomarkers in cancer: Progress towards clinical implementation. Expert Rev. Mol. Diagn. 2012, 12, 473–487. [Google Scholar] [CrossRef] [PubMed]
  5. Pogribny, I.P.; Rusyn, I. Role of epigenetic aberrations in the development and progression of human hepatocellular carcinoma. Cancer Lett. 2014, 342, 223–230. [Google Scholar] [CrossRef] [PubMed]
  6. Sproul, D.; Meehan, R.R. Genomic insights into cancer-associated aberrant CpG island hypermethylation. Brief. Funct. Genom. 2013, 12, 174–190. [Google Scholar] [CrossRef] [PubMed]
  7. Paziewska, A.; Dabrowska, M.; Goryca, K.; Antoniewicz, A.; Dobruch, J.; Mikula, M.; Jarosz, D.; Zapala, L.; Borowka, A.; Ostrowski, J. DNA methylation status is more reliable than gene expression at detecting cancer in prostate biopsy. Br. J. Cancer 2014, 111, 781–789. [Google Scholar] [CrossRef] [PubMed]
  8. Calvisi, D.F.; Ladu, S.; Gorden, A.; Farina, M.; Lee, J.S.; Conner, E.A.; Schroeder, I.; Factor, V.M.; Thorgeirsson, S.S. Mechanistic and prognostic significance of aberrant methylation in the molecular pathogenesis of human hepatocellular carcinoma. J. Clin. Investig. 2007, 117, 2713–2722. [Google Scholar] [CrossRef] [PubMed]
  9. Dhar, K.; Rakesh, K.; Pankajakshan, D.; Agrawal, D.K. SOCS3 promotor hypermethylation and STAT3-NF-κB interaction downregulate SOCS3 expression in human coronary artery smooth muscle cells. Am. J. Physiol. Heart Circ. Physiol. 2013, 304, H776–H785. [Google Scholar] [CrossRef] [PubMed]
  10. Iwahori, K.; Serada, S.; Fujimoto, M.; Nomura, S.; Osaki, T.; Lee, C.M.; Mizuguchi, H.; Takahashi, T.; Ripley, B.; Okumura, M.; et al. Overexpression of SOCS3 exhibits preclinical antitumor activity against malignant pleural mesothelioma. Int. J. Cancer 2011, 129, 1005–1017. [Google Scholar] [CrossRef] [PubMed]
  11. Ogata, H.; Chinen, T.; Yoshida, T.; Kinjyo, I.; Takaesu, G.; Shiraishi, H.; Iida, M.; Kobayashi, T.; Yoshimura, A. Loss of SOCS3 in the liver promotes fibrosis by enhancing STAT3-mediated TGF-β1 production. Oncogene 2006, 25, 2520–2530. [Google Scholar] [CrossRef] [PubMed]
  12. Zhang, L.; Badgwell, D.B.; Bevers, J.J., 3rd.; Schlessinger, K.; Murray, P.J.; Levy, D.E.; Watowich, S.S. IL-6 signaling via the STAT3/SOCS3 pathway: Functional analysis of the conserved STAT3 N-domain. Mol. Cell. Biochem. 2006, 288, 179–189. [Google Scholar] [CrossRef] [PubMed]
  13. He, B.; You, L.; Uematsu, K.; Zang, K.; Xu, Z.; Lee, A.Y.; Costello, J.F.; McCormick, F.; Jablons, D.M. SOCS-3 is frequently silenced by hypermethylation and suppresses cell growth in human lung cancer. Proc. Natl. Acad. Sci. USA 2003, 100, 14133–14138. [Google Scholar] [CrossRef] [PubMed]
  14. Inagaki-Ohara, K.; Kondo, T.; Ito, M.; Yoshimura, A. SOCS, inflammation, and cancer. JAKSTAT 2013, 2, e24053. [Google Scholar] [CrossRef] [PubMed]
  15. Li, Y.; de Haar, C.; Chen, M.; Deuring, J.; Gerrits, M.M.; Smits, R.; Xia, B.; Kuipers, E.J.; van der Woude, C.J. Disease-related expression of the IL6/STAT3/SOCS3 signalling pathway in ulcerative colitis and ulcerative colitis-related carcinogenesis. Gut 2010, 59, 227–235. [Google Scholar] [CrossRef] [PubMed]
  16. Liu, W.B.; Ao, L.; Zhou, Z.Y.; Cui, Z.H.; Zhou, Y.H.; Yuan, X.Y.; Xiang, Y.L.; Cao, J.; Liu, J.Y. CpG island hypermethylation of multiple tumor suppressor genes associated with loss of their protein expression during rat lung carcinogenesis induced by 3-methylcholanthrene and diethylnitrosamine. Biochem. Biophys. Res. Commun. 2010, 402, 507–514. [Google Scholar] [CrossRef] [PubMed]
  17. Pierconti, F.; Martini, M.; Pinto, F.; Cenci, T.; Capodimonti, S.; Calarco, A.; Bassi, P.F.; Larocca, L.M. Epigenetic silencing of SOCS3 identifies a subset of prostate cancer with an aggressive behavior. Prostate 2011, 71, 318–325. [Google Scholar] [CrossRef] [PubMed]
  18. Tischoff, I.; Hengge, U.R.; Vieth, M.; Ell, C.; Stolte, M.; Weber, A.; Schmidt, W.E.; Tannapfel, A. Methylation of SOCS-3 and SOCS-1 in the carcinogenesis of Barrett’s adenocarcinoma. Gut 2007, 56, 1047–1053. [Google Scholar] [CrossRef] [PubMed]
  19. Weber, A.; Hengge, U.R.; Bardenheuer, W.; Tischoff, I.; Sommerer, F.; Markwarth, A.; Dietz, A.; Wittekind, C.; Tannapfel, A. SOCS-3 is frequently methylated in head and neck squamous cell carcinoma and its precursor lesions and causes growth inhibition. Oncogene 2005, 24, 6699–6708. [Google Scholar] [CrossRef] [PubMed]
  20. Niwa, Y.; Kanda, H.; Shikauchi, Y.; Saiura, A.; Matsubara, K.; Kitagawa, T.; Yamamoto, J.; Kubo, T.; Yoshikawa, H. Methylation silencing of SOCS-3 promotes cell growth and migration by enhancing JAK/STAT and FAK signalings in human hepatocellular carcinoma. Oncogene 2005, 24, 6406–6417. [Google Scholar] [CrossRef] [PubMed]
  21. Zhang, X.; Wang, J.; Cheng, J.; Ding, S.; Li, M.; Sun, S.; Zhang, L.; Liu, S.; Chen, X.; Zhuang, H.; et al. An integrated analysis of SOCS1 down-regulation in HBV infection-related hepatocellular carcinoma. J. Viral Hepat. 2013. [Google Scholar] [CrossRef] [PubMed]
  22. Shire, A.; Lomberk, G.; Lai, J.P.; Zou, H.; Tsuchiya, N.; Aderca, I.; Moser, C.D.; Gulaid, K.H.; Oseini, A.; Hu, C.; et al. Restoration of epigenetically silenced SULF1 expression by 5-aza-2-deoxycytidine sensitizes hepatocellular carcinoma cells to chemotherapy-induced apoptosis. Med. Epigenet. 2015, 3, 1–18. [Google Scholar] [CrossRef] [PubMed]
  23. Wu, W.Y.; Li, J.; Wu, Z.S.; Zhang, C.L.; Meng, X.L.; Lobie, P.E. Prognostic significance of phosphorylated signal transducer and activator of transcription 3 and suppressor of cytokine signaling 3 expression in hepatocellular carcinoma. Exp. Ther. Med. 2011, 2, 647–653. [Google Scholar] [PubMed]
  24. Deng, J.; Jiao, X.; Liu, H.; Wu, L.; Zhang, R.; Wang, B.; Pan, Y.; Hao, X.; Liang, H. Lymph node metastasis is mediated by suppressor of cytokine signaling-3 in gastric cancer. Tumour Biol. 2013, 34, 3627–3636. [Google Scholar] [CrossRef] [PubMed]
  25. Stofas, A.; Levidou, G.; Piperi, C.; Adamopoulos, C.; Dalagiorgou, G.; Bamias, A.; Karadimou, A.; Lainakis, G.A.; Papadoukakis, S.; Stravodimos, K.; et al. The role of CXC-chemokine receptor CXCR2 and suppressor of cytokine signaling-3 (SOCS-3) in renal cell carcinoma. BMC Cancer 2014, 14, 149. [Google Scholar] [CrossRef] [PubMed]
  26. Baltayiannis, G.; Baltayiannis, N.; Tsianos, E.V. Suppressors of cytokine signaling as tumor repressors. Silencing of SOCS3 facilitates tumor formation and growth in lung and liver. J. BUON 2008, 13, 263–265. [Google Scholar] [PubMed]
  27. Wu, W.Y.; Kim, H.; Zhang, C.L.; Meng, X.L.; Wu, Z.S. Loss of suppressors of cytokine signaling 3 promotes aggressiveness in hepatocellular carcinoma. J. Investig. Surg. 2014, 27, 197–204. [Google Scholar] [CrossRef] [PubMed]
  28. Xie, X.; Yao, M.; Chen, X.; Lu, W.; Lv, Q.; Wang, K.; Zhang, L.; Lu, F. Reduced red blood cell count predicts poor survival after surgery in patients with primary liver cancer. Medicine 2015, 94, e577. [Google Scholar] [CrossRef] [PubMed]
  29. Wang, Y.; Cheng, J.; Xu, C.; Liu, S.; Jiang, S.; Xu, Q.; Chen, X.; Zhuang, H.; Lu, F. Quantitative methylation analysis reveals gender and age differences in p16INK4a hypermethylation in hepatitis B virus-related hepatocellular carcinoma. Liver Int. 2012, 32, 420–428. [Google Scholar] [CrossRef] [PubMed]
  30. Liu, S.; Zhu, P.; Zhang, L.; Ding, S.; Zheng, S.; Wang, Y.; Lu, F. Selection of reference genes for RT-qPCR analysis in tumor tissues from male hepatocellular carcinoma patients with hepatitis B infection and cirrhosis. Cancer Biomark. 2013, 13, 345–349. [Google Scholar] [PubMed]

