Article

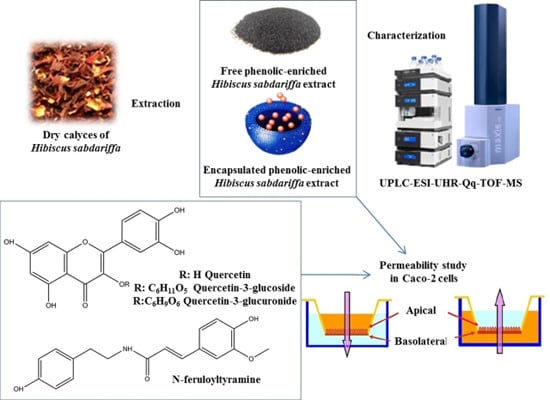
Permeability Study of Polyphenols Derived from a Phenolic-Enriched Hibiscus sabdariffa Extract by UHPLC-ESI-UHR-Qq-TOF-MS

by
Isabel Borrás-Linares
1,2,†,
María Herranz-López
3,†,
Enrique Barrajón-Catalán
3,
David Arráez-Román
1,2,*,
Isabel Gonzálezlvarez
4,
Marival Bermejo
4,
Alberto Fernández Gutiérrez
1,2,
Vicente Micol
3,‡,§ and
Antonio Segura-Carretero
1,2,‡
1
Department of Analytical Chemistry, Faculty of Sciences, University of Granada, Avda Fuentenueva s/n, 18071 Granada, Spain
2
Research and Development Functional Food Centre, Health Science Technological Park, Avda Conocimiento s/n, 18016 Granada, Spain
3
Instituto de Biología Molecular y Celular (IBMC), Miguel Hernández University, Elche, 03202 Alicante, Spain
4
Pharmacokinetics and Pharmaceutical Technology Area, Engineering Department, Universidad Miguel Hernández, San Juan de Alicante, 03550 Alicante, Spain
*
Author to whom correspondence should be addressed.
These authors contributed equally to this work.
These authors share co-senior authorship.
§
CIBER (CB12/03/30038, Fisiopatología de la Obesidad y la Nutrición, CIBERobn, Instituto de Salud Carlos III).
Int. J. Mol. Sci. 2015, 16(8), 18396-18411; https://doi.org/10.3390/ijms160818396
Submission received: 6 July 2015 / Revised: 30 July 2015 / Accepted: 30 July 2015 / Published: 7 August 2015
(This article belongs to the Special Issue Phenolics and Polyphenolics 2015)

Abstract

:
Previous findings on the capacity of Hibiscus sabdariffa (HS) polyphenols to ameliorate metabolic disturbances justify the necessity of studies oriented to find the potential metabolites responsible for such an effect. The present study examined the intestinal epithelial membrane permeability of polyphenols present in a phenolic-enriched Hibiscus sabdariffa extract (PEHS), free and encapsulated, using the Caco-2 cell line. Additionally, selected polyphenols (quercetin, quercetin-3-glucoside, quercetin-3-glucuronide, and N-feruloyltyramine) were also studied in the same absorption model. The powerful analytical platform used ultra-high-performance liquid chromatography coupled with ultra-high-resolution quadrupole time-of-flight mass spectrometry (UHPLC-ESI-UHR-Qq-TOF-MS), and enabled the characterization of seven new compounds in PEHS. In the permeation study, only a few compounds were able to cross the cell monolayer and the permeability was lower when the extract was in an encapsulated form. Pure compounds showed a moderate absorption in all cases. Nevertheless, these preliminary results may need further research to understand the complete absorption mechanism of Hibiscus polyphenols.

Graphical Abstract

1. Introduction

Hibiscus sabdariffa L. (HS) (family Malvaceae), commonly named bissap, roselle, red sorrel, or karkade, is a tropical plant commonly used as a beverage in folk medicine for the treatment of diverse disorders such as constipation, heart ailments, high blood pressure, urinary tract infections, cancer, diabetes, or hepatic disorders [1,2,3,4]. Recent studies have focused on its antioxidant [5,6], antimicrobial [7,8], anti-inflammatory [9,10], anti-adipogenic [11], immunomodulatory [10], hepatoprotective [12,13], anticancer [14,15], cardioprotective [16,17,18], or diuretic activities [19]. Proteins, lipids, carbohydrates, minerals, and vitamins, as well as less polar compounds such as sterols, are present in its composition [20]. HS possesses organic and phenolic acids such as citric, hibiscus, or protocatechuic acids; flavonoids such as quercetin, luteolin, and their glycosides; and anthocyanins such as cyanidin-3-O-sambubioside, cyanidin-3-O-glucoside, or delphinidin-3-O-sambubioside, which are responsible for the bright red color of their calyces [11,21,22].
We have previously reported the capability of HS polyphenols to modulate triglyceride accumulation, oxidative stress, and inflammation in insulin-resistant adipocytes at relatively low doses, i.e., 10–40 μg/mL (phenolic-enriched Hibiscus sabdariffa (PEHS) extract) and with large doses in human volunteers (10 g of an aqueous extract) [11,23], and to prevent fatty liver disease in a hyperlipidemic mouse model through miRNA-mediated glucose and lipid homeostasis regulation. We have accumulated enough evidence to propose that some flavonols may be the major contributors to the observed effects [17,24]. Nevertheless, a synergistic interaction among several components in the extract and a multi-targeted mechanism has been proposed [11,25]. Recent human studies in patients suffering metabolic syndrome support the potential therapeutic use of the extract derived from HS calyces against hypertension when administered at a dose of 125 mg/kg/day for four weeks [26]. In this scenario, the study of the absorption and bioavailability of the major compounds and the identification of the putative metabolites is needed to elucidate their molecular targets and for the complete understanding of their mechanism.
In the present study, the permeability of major polyphenols present in a PEHS, both free and encapsulated, has been studied for the first time using the Caco-2 human colon cell line as a model of human intestinal absorption. Additionally, the absorption of selected glycosylated and non-glycosylated polyphenols or metabolites related to the extract was also studied in the same model.

2. Results and Discussion

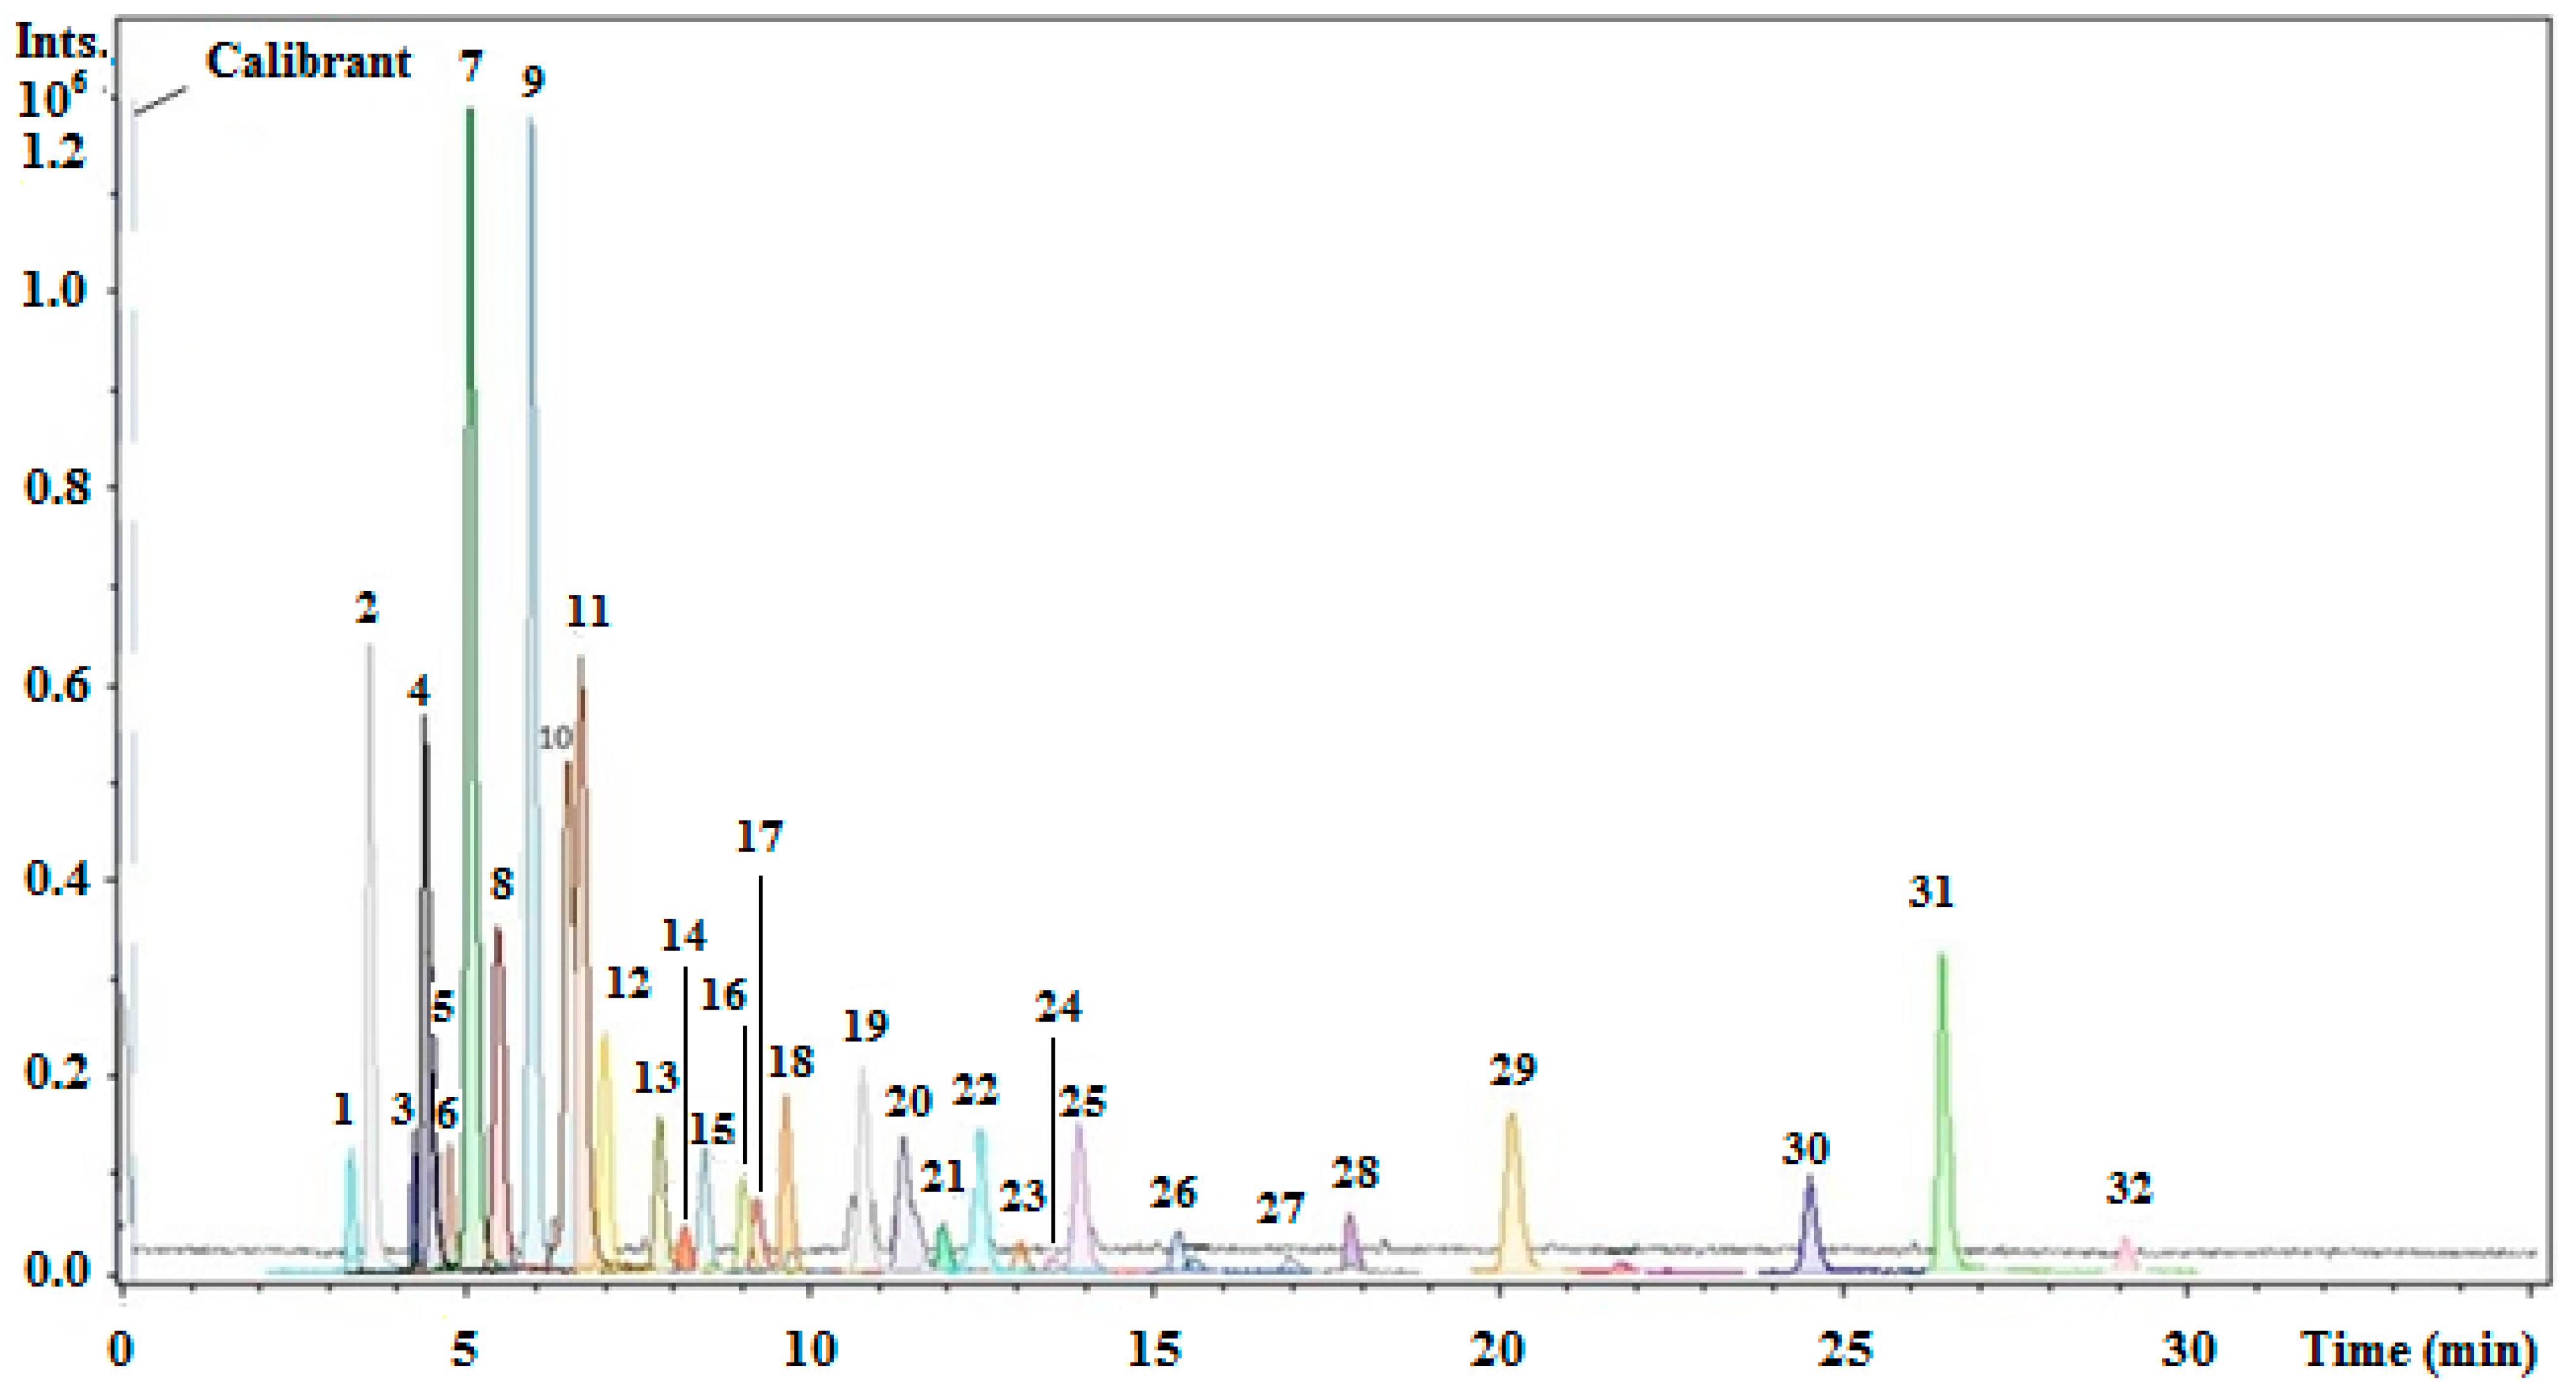
2.1. Characterization of the Phenolic-Enriched Hibiscus sabdariffa (PEHS) Extract

The first step in the present study was to perform a complete characterization of the PEHS extract using an optimized analytical methodology. Thus, UHPLC-ESI-UHR-Qq-TOF-MS was used for the detection and characterization of phenolic and other polar compounds present in the extract. The base peak chromatogram obtained for this extract showed the presence of 32 compounds (Figure 1). These compounds were tentatively identified using the information provided by the UHR-Qq-TOF-MS, comparing their mass spectra and elution order with standards when available, and after a thorough survey of the literature. Data concerning the information of the detected compounds are summarized in Table 1, which lists the peak number, retention time, experimental m/z, calculated m/z, error (ppm) and sigma values, generated molecular formula, and proposed compound. Intraday and interday precisions were developed in order to assess the robustness of the method. A sample of the PEHS extract was injected three times in the same day (intraday precision, n = 3) and three times for three consecutive days (interday precision, n = 9). The intraday repeatability of peak area, expressed as the relative standard deviation (RSD) (%), was between the interval of 0.13%–2.87%, whereas the interday repeatability was between 0.37%–3.29%.
Figure 1. Base peak chromatogram of PEHS extract; peaks are identified with numbers according to the elution order.
Ijms 16 18396 g001
Table 1. List of the compounds detected in phenolic-enriched Hibiscus sabdariffa (PEHS) extract with the main details about mass-spectra analysis.
Peak NumberRetention Time (min)m/z Experimentalm/z CalculatedError (ppm)Molecular FormulaProposed Compound
13.4207.0146207.0146−0.0C6H8O8Hydroxycitric acid
23.6189.0041189.0041−0.1C6H6O7Hibiscus acid
34.3235.0458235.04590.4C8H12O8Hibiscus acid hydroxyethylesther
44.5595.1303595.13050.3C26H28O16Delphinidin-3-sambubioside
54.8315.0720315.07220.4C13H16O9Chlorogenic acid quinone
65.3353.0874353.08781.0C16H18O9Neochlorogenic acid
75.5579.1350579.13550.9C26H28O15Cyanidin-3-sambubioside
86.0217.0352217.03541.0C8H10O7Hibiscus acid dimethylesther
96.3353.0877353.08780.3C16H18O9Chlorogenic acid
106.7353.0877353.08780.3C16H18O9Cryptochlorogenic acid
117.1335.0408335.04090.1C15H12O9Methyl digallate
127.9369.0460369.04630.8C15H14O112-O-trans-caffeoyl-hydroxicitric acid
138.2353.0874353.08781.0C16H18O91-O-caffeoylquinic acid
148.5611.1246611.12541.3C26H28O17Myricetin-3-arabinogalactoside
159.0337.0925337.09291.3C16H18O8Coumaroylquinic acid
169.2236.0563236.05640.6C11H11NO5UK
179.7263.0772263.07720.0C10H16O8Hibiscus acid hydroxyethyldimethylesther
1810.7595.1305595.1305−0.0C26H28O16Quercetin-3-sambubioside
1911.3335.0771335.07720.4C16H16O85-O-caffeoylshikimic acid
2012.0263.0773263.0772−0.3C10H16O82-O-trans-feruloyl-hydroxicitric acid
2112.3609.1458609.14610.5C27H30O16Quercetin-3-rutinoside
2213.1385.1139385.11400.3C17H22O10UK
2313.6579.1356579.1355−0.2C26H28O15Kaempferol-3-O-sambubioside
2414.0463.0882463.08820.0C21H20O12Quercetin-3-glucoside
2515.3593.1512593.1512−0.0C27H30O15Kaempferol-3-O-rutinoside
2615.5381.1190381.11910.1C18H22O9Ethylchlorogenate
2717.1319.0826319.0823−0.8C16H16O7Methylepigallocatechin
2817.7457.1716457.1715−0.1C21H30O11UK
2920.3317.0309317.0303−1.8C15H10O8Myricetin
3024.5312.1245312.1241−1.2C18H19NO4N-feruloyltyramine
3126.4301.0358301.0354−1.4C15H10O7Quercetin
3229.1285.0415285.0404−3.6C15H10O6Kaempferol
Most of the identified compounds have been previously described in PEHS extract [11,22]. Nevertheless, seven new compounds were identified due to the use of UHR-Qq-TOF-MS, a detector with a high resolution and extreme sensitivity. Thus, peaks 3 and 26, proposed as hibiscus acid hydroxyethylesther and ethylchlorogenate, respectively, were detected in the previous analysis of the PEHS extract but it was impossible to confirm their identity with the available information. Furthermore, chlorogenic acid quinone, 1-O-caffeoylquinic acid, hibiscus acid hydroxyethyldimethylesther, 2-O-transferuloylhydroxicitric acid, and kaempferol, corresponding to peaks 5, 13, 17, 20 and 32, respectively, have been detected for the first time in the PEHS extract.
Moreover, other phenolic and polar compounds were identified in the extract, corresponding to different families. It should be pointed out that there was a presence of a wide variety of organic acids and derivatives, such as hydroxycitric and hibiscus acids, 2-O-trans-caffeoylhydroxycitric acid, hibiscus acid dimethylesther, hibiscus acid hydroxyethylesther, hibiscus acid hydroxyethyldimethylesther, 5-O-caffeoylshikimic acid, and coumaroylquinic acid. Several phenolic acids and derivatives were detected in the extract, such as chlorogenic acid, its isomers neo and cryptochlorogenic acids and derivatives such as chlorogenic acid quinone or ethylchlorogenate, as well as methyldigallate.
Furthermore, other flavonoids and their glycosidic derivatives were characterized in the extract. The presence of the following should be highlighted: quercetin and its glucoside, rutinoside, and sambubioside conjugates; kaempferol and its rutinoside and sambubioside forms; myricetin, myricetin-3-arabinogalactoside, and methylepigallocatechin. Additionally, anthocyanins responsible for the bright red color calyces of HS, specifically delphinidin-3-sambubioside and cyanidin-3-sambubioside, were also detected, as well as the compound N-feruloyltyramine.
Despite the efforts made in order to characterize the extract, Table 1 shows three compounds named as unknown (UK in Table 1) for which it was impossible to elucidate a structure due to lack of sufficient evidence. The table includes retention time, experimental m/z, molecular formulas, errors, and σ values.
The use of a powerful analytical technique such as UHPLC-ESI-UHR-Qq-TOF-MS has been a valuable tool, allowing the characterization of seven new compounds for the first time in this plant matrix. These new compounds were in their majority organic and phenolic acid derivatives, such as hibiscus acid hydroxyethylesther, ethyl chlorogenate, chlorogenic acid quinone, 1-O-caffeoylquinic acid, hibiscus acid hydroxyethyldimethylesther, and 2-O-trans-feruloyl-hydroxycitric acid. Furthermore, kaempferol was also detected in this extract for the first time. The compound ethyl chlorogenate has been found in various extracts of different plants with hepatoprotective and antiviral activities [27,28]. On the other hand, chlorogenic acid quinone is an oxidative product of chlorogenic acid by polyphenol oxidase, one of the major polyphenols present in plants [29,30]. The compound 1-O-caffeoylquinic acid has been found in different plants and foods, such as potato, tomato, or artichoke, among others [31,32,33]; also, the compound 2-O-trans-feruloyl-hydroxycitric acid is found in corn [34]. Moreover, kaempferol has been previously found in the petals of this plant matrix as well as in rat plasma after the oral administration of the PEHS extract [17,35].

2.2. Permeability of Free and Encapsulated PEHS Extracts

One of the aims of this study was to compare the intestinal absorption of HS compounds when the PEHS extract was in a free form or in an encapsulated formulation, using the Caco-2 model system. This model is a well-established in vitro model for the investigation of the intestinal permeability of different compounds or drugs [36,37]. Prior to the transport studies, the Caco-2 cell monolayer was established and validated. Monolayer integrity and reliability were ensured by measuring the transepithelial electrical resistance (TEER) values, which remained stable during the assay with the experimental conditions assayed. Afterwards, samples from apical and basolateral compartments obtained at different time points and cytoplasmic and membrane fractions of the cell monolayer collected at the end of the assay (see Section 3.3 and Section 3.4) were analyzed by UHPLC-ESI-UHR-Qq-TOF-MS in order to identify which compounds crossed the Caco-2 cell monolayer. The results are summarized in the Table 2.
Table 2. Compounds detected in the transport medium, cytoplasm, and membrane obtained in apical to basolateral (Ap-Bas) and basolateral to apical (Bas-Ap) transport directions in the Caco-2 assay with the free and encapsulated PEHS. The symbol + indicated that the compound was detected.
ExtractFree PEHSEncapsulated PEHS
CompoundTransport MediumCytoplasmMembraneTransport MediumCytoplasmMembrane
Ap-Bas
Ijms 16 18396 i001
Bas-Ap
Ijms 16 18396 i002
Ap-Bas
Ijms 16 18396 i003
Bas-Ap
Ijms 16 18396 i004
Ap-Bas
Ijms 16 18396 i005
Bas-Ap
Ijms 16 18396 i006
Ap-Bas
Ijms 16 18396 i007
Bas-Ap
Ijms 16 18396 i008
Ap-Bas
Ijms 16 18396 i009
Bas-Ap
Ijms 16 18396 i010
Ap-Bas
Ijms 16 18396 i011
Bas-Ap
Ijms 16 18396 i012
Hibiscus acid +
Neochlorogenic acid++ +++
Hibiscus acid dimethylesther + ++
Chlorogenic acid++ ++
Cryptochlorogenic acid++ ++++
Methyldigallate + ++
Coumaroylquinic acid + +
5-O-caffeoylshikimic acid++ +
Methylepigallocatechin +
N-feruloyltyramine++ ++
Quercetin+++ + +
Ap-Bas: Apical-Basolateral flux; Bas-Ap: Basolateral-Apical flux; +: Presence of the compound in the sample.
Thus, for the free PEHS extract, the analysis of the transport medium revealed the presence of chlorogenic acid, cryptochlorogenic acid, neochlorogenic acid, 5-O-caffeoylshikimic acid, N-feruloyltyramine, and quercetin in the receiver chamber in both flux directions. Additionally, the compounds methyldigallate, coumaroylquinic acid, and methylepigallocatechin were also detected only in the basolateral-apical flux.
Although the high polarity of the main compounds in PEHS suggested that encapsulation in liposomes would increase the permeability of these compounds, a lower permeability was observed when encapsulated PEHS was used. The number and amount of compounds transported across the membrane decreased compared to free PEHS extract. Thus, in the apical-basolateral flux study, the compounds detected in the transport medium of the receiver chamber were neochlorogenic and cryptochlorogenic acids and N-feruloyltyramine. On the contrary, more compounds were detected in the acceptor compartment for the basolateral-apical flow, such as chlorogenic acid and its isomers, methyldigallate, 5-O-caffeoylshikimic acid, and N-feruloyltyramine (Table 2).
These results showed the potential of the very sensible analytical instrumentation used, which allowed the detection of several compounds in the acceptor chambers in both flux directions and with the two PEHS assayed formulations.
The uptake of the compounds present in both formulations of PEHS by the Caco-2 cells was also monitored by analyzing the cytoplasmic content of the cell monolayer collected at the end of the assay. Quercetin was found in the cytoplasm of the Caco-2 cells when the permeation of the free extract was monitored in the apical-basolateral direction. On the other hand, in the case of the encapsulated form, cryptochlorogenic acid was the only compound detected in the cytoplasm of the cells in the basolateral-apical flux, while in the opposite direction, seven compounds were detected: hibiscus acid, hibiscus acid dimethylesther, chlorogenic acid and its isomers, methyldigallate, and quercetin.
Phenolic compounds have shown a significant capacity to bind phospholipid membranes [38,39,40] and this fact may account for most of their membrane-related effects [41]; therefore, the possible presence of the phenolic compounds from PEHS in the cell membrane fraction was also explored. Caco-2 cell membranes were collected at the end of the assay, treated as explained in the Section 3.3 and Section 3.4, and subsequently analyzed by UHPLC-ESI-UHR-Qq-TOF-MS. The results showed that only quercetin was detected to be associated with membranes in the apical-basolateral flow study for the free PEHS extract. On the other hand, for the encapsulated PEHS extract, hibiscus acid dimethylesther and coumaroylquinic acid were detected in the membrane fraction, although the last compound was only found in the basolateral-apical direction.
The fact that only a few compounds were able to pass across the gut barrier model in both permeation studies could be partly due to the complex composition of the extract. The presence of high concentrations of several polyphenols in the extract could lead to a saturation of the specific transport mechanisms of the phenolic compounds through the cell monolayer or to the loss of sink conditions. The results obtained here reveal valuable information in order to identify the putative metabolites that would reach the target tissues and would account for the effects of HS extract.

2.3. Permeation of Pure Compounds Related to PEHS Composition

Although the study of the absorption of a complex extract resembles the in vivo processes better, the interference among the different compounds and the saturation of membrane transporters makes it difficult to quantitate the absorption of the different compounds. To avoid this situation, we studied the absorption process of a selection of pure polyphenols related to PEHS, previously identified as metabolites in an animal model (quercetin, quercetin-3-glucoside, quercetin-3-glucuronide, and N-feruloyltyramine). Three different forms of the flavonol quercetin, i.e., its aglycone, the glycosylated and the glucuronidated forms, were used in the absorption cell model, since the amount of quercetin derivatives found in PEHS was fairly abundant [11] and quercetin metabolites were detected in several mouse tissues [24] and plasma samples of rats [17] after the oral consumption of PEHS. N-feruloyltyramine was also studied since this compound was fairly abundant in PEHS extract and appeared as a metabolite in animal studies [17,24]. Neither phenolic acids nor anthocyanins were selected for absorption studies since phenolic acids have been thoroughly studied in the bibliography and anthocyanins are poorly absorbed [42,43,44,45,46].
Quercetin and N-feruloyltyramine showed significant absorption in the experiments performed with the whole extract, so their individual permeation study was of interest to understand their absorption in model conditions. There is a certain controversy in respect to the permeability of quercetin and its derivatives. Whereas the permeability of quercetin-glucoside conjugates was higher than that observed for the aglycone [47,48], the opposite conclusion was made in other assays [49]. Therefore, the glycosylated and aglycone forms were compared in the absorption cell model. On the other hand, quercetin-glucuronide conjugates have been postulated as major metabolites derived from the phase II metabolism of quercetin aglycone or different glycoside derivatives [50]. On some occasions, the metabolites generated inside the enterocytes could be transported again to the intestinal lumen by the ABC transporters.
Standard calibration curves of the compounds under study were prepared using apigenin at a concentration of 10 μg/mL as an internal standard. All calibration curves showed good linearity within different concentration ranges depending on the analytes studied. The limits of detection (LODs) and limits of quantification (LOQs) for individual compounds in standard solutions were also calculated as S/N = 3 and S/N = 10, respectively, where S/N is the signal to noise ratio (Table 3). The compound concentrations were subsequently determined using the corrected area of each individual compound (three replicates) and by interpolation in the corresponding calibration curve. Repeatability of the proposed method was measured as the relative standard deviation (RSD, %) in terms of concentration. A mixed solution containing the analytes was injected several times (n = 3) on the same day (intraday precision) and three times on three consecutive days (interday precision, n = 9). Intraday repeatability of the method developed for all the analytes was from 0.11% to 1.93%, whereas the interday repeatability ranged from 0.17% to 2.06%. The contents of the monitored compounds in the receiver chambers at different times are shown in Table 4.
In some cases, the analysis of the samples by UHPLC-ESI-UHR-Qq-TOF-MS collected at different times in the receptor compartment revealed that the compounds of interest were not detected. This happened in the samples collected after 30, 60 and 90 min for quercetin-3-glucuronide in the apical-basolateral flux. In other cases, the presence of these compounds was detected but could not be quantified since the contents were below the LOQs. Moreover, the presence of these compounds was not found in the analysis of the cytoplasm and membrane fractions collected at the end of the assay.
Table 3. Calibration data, where LOD is the limit of detection and LOQ is the limit of quantification.
AnalyteLOD (μg/mL)LOQ (μg/mL)Calibration Range (μg/mL)Calibration Equationsr2
Quercetin0.050.170.17–20y = 13.372 x − 0.00380.998
Quercetin-3-glucoside0.070.230.23–55y = 2.5235 x + 0.01130.988
Quercetin-3-glucuronide0.030.110.2–45y = 11.545 x + 0.00870.992
N-feruloyltyramine0.0140.0480.2–40y = 14.995 x + 0.10880.990
Table 4. Concentration (μg/mL) of compounds from the receptor chamber in the individual permeability assays. Value = X ± SD. ND: non-detected, <LOQ: below the LOQ.
Apical-Basolateral Flux
Time (min)306090120
Quercetin0.28 ± 0.020.49 ± 0.031.33 ± 0.021.32 ± 0.01
Quercetin-3-glucoside<LOQ<LOQ<LOQ0.47 ± 0.03
Quercetin-3-glucuronideNDNDND<LOQ
N-feruloyltyramine0.69 ± 0.022.3 ± 0.24.2 ± 0.56.6 ± 0.8
Basolateral-Apical Flux
Time (min)30303030
Quercetin1.1 ± 0.41.1 ± 0.41.1 ± 0.41.1 ± 0.4
Quercetin-3-glucoside<LOQ<LOQ<LOQ<LOQ
Quercetin-3-glucuronide<LOQ<LOQ<LOQ<LOQ
N-feruloyltyramine1.35 ± 0.041.35 ± 0.041.35 ± 0.041.35 ± 0.04
It is important to remark that the concentration found for all the compounds in the basolateral-apical direction was higher than that found in the flux of the other direction. Furthermore, the permeation of quercetin-3-glucoside and quercetin-3-glucuronide in the apical-basolateral direction occurred to such a lesser extent that these compounds could not be quantified for several time-points.
The maximum permeation of quercetin was reached after 90 min of the assay for both flux directions, but the final concentration in the basolateral-apical flux was around five-fold higher than the opposite flux (see Table 4). For the other assayed compounds, the maximum concentration was found in the samples collected at the end of the assay (120 min). These findings revealed a faster and more effective absorption of quercetin compared to their derivatives, which may justify the fact that the aglycone reaches its molecular targets in a more effective way [49].
In conclusion, our results suggest the existence of significant absorption across the intestinal barrier of some of HS polyphenols, most probably by passive diffusion, especially for quercetin and N-feruloyltyramine (compounds detected when the free and encapsulated PEHS extracts were assayed). With respect to N-feruloyltyramine, as far as we are concerned, this study represents the first report for the permeation study of this compound in the in vitro Caco-2 cell model. On the contrary, the results showed that the absorption of the glycosylated flavonols, i.e., quercetin-3-glucoside and quercetin-3-glucuronide, occurred in to a lesser extent. Moreover, the higher permeability in the basolateral-apical direction found for all the assayed compounds suggests a secretion transport mechanism to the intestinal lumen, which produces a decrease in the net absorption of these compounds. Our results are also in agreement with those reporting a higher absorption of quercetin compared to its different glycosylated forms [49], and compared to those showing a higher permeability in the basolateral-apical direction [49,51].

3. Experimental Section

3.1. Chemicals and Reagents

All chemicals were of analytical HPLC grade and used as received. Ethanol, acetonitrile, soy phosphatidylcholine, formic acid, and trifluoroacetic acid were purchased from Sigma-Aldrich (St. Louis, MO, USA). The resin used for the preparative chromatography was AmberliteTM FPX66 (Rohm and Haas, Philadelphia, PA, USA). Standard compounds quercetin (purity ≥ 98%), quercetin-3-glucoside (purity ≥ 98%), and quercetin-3-glucuronide (purity ≥ 95%) were supplied by Sigma-Aldrich and N-feruloyltyramine (purity ≥ 95%) by Chem–Faces (Wuhan, China). Lastly, Hank’s Balance culture medium (HBSS) was obtained from Gibco (Life Technologies, Gaithersburg, MD, USA) and methanol and DMSO, used for the preparation of the stock solutions, were purchased from Fisher Scientific (Pittsburgh, PA, USA).

3.2. Preparation of PEHS

Primary aqueous extract was obtained from sun-dried calyces from plants harvested in Senegal, with an approximate plant-to-extract ratio of 5:1 as previously described [23]. The purified PEHS extract was kindly provided by Monteloeder, Inc. (Elche, Alicante, Spain) and was essentially prepared as previously described [11]. The retained phenolic fraction was finally eluted with 95% ethanol and 0.01% trifluoroacetic acid (TFA), rotatory evaporated and freeze-dried. The PEHS encapsulated formulation was performed using empty liposomes, whose final concentration was 2 mM, adding soy phosphatidylcholine to the blend. To permeabilize the liposome membrane ethanol 10% was used. The extract was dissolved in HBSS at the desired concentration (2500 μg/mL), stirred for 10 min, and finally filtered through 0.45 μm three times (PVD filter).

3.3. Cell Culture and Permeability Studies

To assess the potential intestinal absorption of PEHS and pure compounds, experiments were conducted using Caco-2 cells derived from human colorectal adenocarcinoma cells (obtained from the American Type Culture Collection). Cells were cultured in Dulbecco’s Modified Eagle Medium (DMEM) containing 10% (v/v) fetal bovine serum (FBS) and incubated at 37 °C in a humidified 5% CO2 air atmosphere. Cell monolayers were prepared by seeding 5 × 10⁵ Caco-2cells/well on a six-well Transwell insert filter. Monolayers were used 19–22 days after seeding. The integrity of each cell monolayer was checked by measuring its transepithelial electrical resistance (TEER) with an epithelial voltohmmeter (EVOM, World Precision Instrument, Sarasota, FL, USA) before and after the experiments. The culture medium was replaced with fresh medium 24 h before the transport experiments. Compounds were added after washing the Caco-2 cell monolayer twice with pre-warmed HBSS medium (pH 7.4), in the apical or in the basolateral side, to evaluate the transport characteristics of the cells. Permeability studies were done by adding the PEHS solution at a concentration of 2500 μg/mL, quercetin at 18.1 μg/mL, quercetin-3-glucoside at 46.4 μg/mL, quercetin-3-glucuronide at 47.8 μg/mL, and N-feruloyltyramine at 31.3 μg/mL, while the receiving chamber contained the corresponding volume of transport medium. Samples were taken at different times (30, 60, 90, 120 min) and stored at −80 °C until their treatment.
After the permeation study, the Caco-2 cell monolayer was collected and the cells were lysed with three subsequent freezing-thawing cycles followed by bath sonication, of 10 min each step. Then, the samples were centrifuged during 15 min at 14,000 rpm and 4 °C, and the supernatants (cytoplasmic fraction) and the pellets (membranes) were stored at −80 °C.

3.4. Sample Treatments

For the UHPLC-ESI-UHR-Qq-TOF-MS analysis of the free PEHS, the extract was dissolved in ultrapure water up to a concentration of 2500 ppm, stirring in a vortex and filtered with single-use filter units of cellulose acetate (0.45 μm) prior to the injection into the HPLC system.
The samples collected in the receiving chamber during the permeability assays were centrifuged for 15 min at 12,000 rpm and 4 °C. The supernatant was spiked with apigenin stock solution, used as an internal standard at a concentration of 10 μg/mL, in order to avoid irreproducibility of results between analyses. Finally, the samples were stored at −80 °C until the analysis, avoiding possible degradations.
The cytoplasms and cell membranes collected at the end of the permeability assays were subjected to protein precipitation using methanol, vortex-mixed, kept at −20 °C for 2 h and centrifuged at 12,000 rpm for 15 min at 4 °C. Finally, the supernatants were evaporated in a vacuum concentrator, dissolved in 100 μL of methanol, and then spiked with 10 μg/mL of apigenin, used as an internal standard for their analysis.

3.5. Analytical Methodology

For the analysis of the samples, a Dionex Ultimate 3000 UHPLC (Thermo Scientific, Sunnyvale, CA, USA) was used coupled with an ultra-high resolution quadrupole time-of-flight mass spectrometer maXis (UHR-Qq-TOF-MS) from Bruker Daltonik (Bremen, Germany). The chromatographic separation was performed in a Zorbax Eclipse Plus C-18 column (4.6 × 150 mm, 1.8 μm) at a flow rate of 0.3 mL/min using an injection volume of 5 μL. The mobile phases consisted in water-acetonitrile (90:10, v/v) with 0.5% of formic acid as eluent A and acetonitrile as eluent B. The following multi-step linear gradient was applied: 0 min, 5% B; 10 min, 35% B; 32 min 75% B; 37 min, 5% B; finally, the initial conditions were held for three minutes to equilibrate the system before the subsequent injection.
The UHPLC system was directly coupled to a UHR-Qq-TOF mass spectrometer via an electrospray ionization interface (ESI) operating in negative ionization mode using a capillary voltage of +4.5 kV. The optimum parameters for the ionization source were: drying gas flow, 8 L/min; drying gas temperature, 200 °C; nebulizer gas pressure, 2 bar. The other optimum values for UHR-Qq-TOF-MS parameters were: funnel RF, 300.0 Vpp; collision RF, 400 Vpp; transfer time, 65 μs; pre-pulse storage, 6 μs; ion cooler, 40 Vpp.
For all the experiments the detection was carried out considering a mass range of 50–1100 m/z, and using nitrogen as nebulizing and drying gas. The instrument was calibrated externally with a 74900-00-05 Cole Palmer syringe pump (Vernon Hills, IL, USA) directly connected to the interface and containing a 10 mM sodium formate cluster solution. The calibration solution was prepared as follows: 10 μL of 1 M sodium hydroxide was mixed with 990 μL of 0.1% formic acid in water:isopropanol (1:1, v/v). The mixture was injected at the beginning of each run (Figure 1 calibration segment) and all the spectra were calibrated prior to compound characterization. Due to the compensation of temperature drifts in the instrument, this external calibration provided accurate mass values of better than 5 ppm. The accurate mass data of the molecular ions were processed using Data Analysis 4.0 software (Bruker Daltonik), which provides a list of possible elemental formulas via the Generate Molecular Formula Editor.

4. Conclusions

The use of a powerful analytical technique such as UHPLC-ESI-UHR-Qq-TOF-MS has been a valuable tool to carry out the absorption study of the phenolic compounds from a PEHS extract in an in vitro model for intestinal absorption. The proposed method allowed the characterization of seven new compounds for the first time in this plant matrix. These new compounds were in their majority organic and phenolic acid derivatives. In the permeability study of PEHS, only a few compounds were able to cross the cell monolayer in both flux directions. In addition, the results highlighted a lower permeation of the compounds from the encapsulated formulation of PEHS compared to the free formulation. Furthermore, four individual compounds related to PEHS extract were studied in the same absorption model (quercetin, quercetin-3-glucoside, quercetin-3-glucuronide, and N-feruloyltyramine), and the results indicated a significant absorption in the gut barrier model for all the compounds. On the other hand, all the assays showed a higher basolateral-apical permeability, suggesting the existence of a transport efflux mechanism of these compounds.

Acknowledgments

This work was supported by projects AGL2011-29857-C03-02 and AGL2011-29857-C03-03 (Spanish Ministry of Science and Innovation), in addition to P10-FQM-6563 and P11-CTS-7625 (Andalusian Regional Government Council of Innovation and Science), PROMETEO/2012/007 and ACOMP/2013/093 (Generalitat Valenciana), and CIBER (CB12/03/30038, Fisiopatología de la Obesidad y la Nutrición, CIBERobn, Instituto de Salud Carlos III). The authors are grateful to the Spanish Ministry of Science and Innovation for the grant FPI (BES-2009-028128), and the Spanish Ministry of Economy and Competitiveness (MINECO) in association with the European Social Fund (FSE) for the contract PTQ-13-06429. MH is a recipient of a VALi + D fellowship from GV (ACIF/2010/162). The authors are especially grateful to Bruker Daltonik GmbH (Bremen, Germany) for their help and support during this research.

Author Contributions

María Herránz-López prepared the PEHS extract and carried out the cell culture and permeability assays. Isabel González-Álvarez and Marival Bermejo supervised the permeability assays; Isabel Borrás-Linares did the sample treatments, realized their analysis, performed the data treatment, and wrote the manuscript in collaboration with the other authors; David Arráez-Román supervised the analytical research; Enrique Barrajón-Catalán supervised the data derived from the assays. Alberto Fernández-Gutiérrez, Antonio Segura-Carretero, and Vicente Micol designed and supervised the study. All authors contributed to the active revision of the manuscript.

Conflicts of Interest

The authors declare no conflict of interest.

References

  1. Ali, B.H.; Al Wabel, N.; Blunden, G. Phytochemical, pharmacological and toxicological aspects of Hibiscus sabdariffa L.: A review. Phytother. Res. 2005, 19, 369–375. [Google Scholar]
  2. McKay, D.L.; Chen, C.O.; Saltzman, E.; Blumberg, J.B. Hibiscus sabdariffa L. tea (tisane) lowers blood pressure in prehypertensive and mildly hypertensive adults. J. Nutr. 2010, 140, 298–303. [Google Scholar] [PubMed]
  3. Ajay, M.; Chai, H.J.; Mustafa, A.M.; Gilani, A.H.; Mustafa, M.R. Mechanisms of the anti-hypertensive effect of Hibiscus sabdariffa L. calyces. J. Ethnopharmacol. 2007, 109, 388–393. [Google Scholar] [CrossRef]
  4. Mozaffari-Khosravi, H.; Jalali-Khanabadi, B.; Afkhami-Ardekani, M.; Fatehi, F. Effects of sour tea (Hibiscus sabdariffa) on lipid profile and lipoproteins in patients with type II diabetes. J. Altern. Complement. Med. 2009, 15, 899–903. [Google Scholar] [CrossRef] [PubMed]
  5. Oboh, G.; Rocha, J.B.T. Antioxidant and neuroprotective properties of sour tea (Hibiscus sabdariffa, calyx) and green tea (Camellia sinensis) on some pro-oxidant-induced lipid peroxidation in brain in vitro. Food Biophys. 2008, 3, 382–389. [Google Scholar] [CrossRef]
  6. Farombi, E.O.; Fakoya, A. Free radical scavenging and antigenotoxic activities of natural phenolic compounds in dried flowers of Hibiscus sabdariffa L. Mol. Nutr. Food Res. 2005, 49, 1120–1128. [Google Scholar] [CrossRef] [PubMed]
  7. Jaroni, D.; Ravishankar, S. Bactericidal effects of roselle (Hibiscus sabdariffa) against foodborne pathogens in vitro and on romaine lettuce and alfalfa sprouts. Qual. Assur. Saf. Crops Foods 2012, 4, 33–40. [Google Scholar] [CrossRef]
  8. Kang, P.; Seok, J.; Kim, Y.; Eun, J.; Oh, S. Antimicrobial and antioxidative effects of roselle (Hibiscus sabdariffa L.) flower extract and its fractions on skin microorganisms and oxidation. Food Sci. Biotechnol. 2007, 16, 409–414. [Google Scholar]
  9. Mounnissamy, V.M.; Gopal, V.; Gunasegaran, R.; Saraswathy, A. Antiinflammatory activity of gossypetin isolated from Hibiscus sabdariffa. Indian J. Heterocycl. Chem. 2002, 12, 85–86. [Google Scholar]
  10. Fakeye, T.O.; Pal, A.; Bawankule, D.U.; Khanuja, S.P.S. Immunomodulatory effect of extracts of Hibiscus sabdariffa L. (Family Malvaceae) in a mouse model. Phytother. Res. 2008, 22, 664–668. [Google Scholar] [CrossRef] [PubMed]
  11. Herranz-López, M.; Fernández-Arroyo, S.; Pérez-Sanchez, A.; Barrajón-Catalán, E.; Beltrán-Debón, R.; Menéndez, J.A.; Alonso-Villaverde, C.; Segura-Carretero, A.; Joven, J.; Micol, V. Synergism of plant-derived polyphenols in adipogenesis: Perspectives and implications. Phytomedicine 2012, 19, 253–261. [Google Scholar] [CrossRef] [PubMed]
  12. Liu, J.; Chen, C.; Wang, W.; Hsu, J.; Yang, M.; Wang, C. The protective effects of Hibiscus sabdariffa extract on CCl 4-induced liver fibrosis in rats. Food Chem. Toxicol. 2006, 44, 336–343. [Google Scholar] [CrossRef] [PubMed]
  13. Yin, G.; Cao, L.; Xu, P.; Jeney, G.; Nakao, M. Hepatoprotective and antioxidant effects of Hibiscus sabdariffa extract against carbon tetrachloride-induced hepatocyte damage in Cyprinus carpio. In Vitro Cell. Dev. Biol. Anim. 2011, 47, 10–15. [Google Scholar] [CrossRef] [PubMed]
  14. Lin, H.; Huang, H.; Huang, C.; Chen, J.; Wang, C. Hibiscus polyphenol-rich extract induces apoptosis in human gastric carcinoma cells via p53 phosphorylation and p38 MAPK/FasL cascade pathway. Mol. Carcinog. 2005, 43, 86–99. [Google Scholar] [CrossRef] [PubMed]
  15. Lin, H.; Chen, J.; Kuo, W.; Wang, C. Chemopreventive properties of Hibiscus sabdariffa L. on human gastric carcinoma cells through apoptosis induction and JNK/p38 MAPK signaling activation. Chem. Biol. Interact. 2007, 165, 59–75. [Google Scholar] [CrossRef] [PubMed]
  16. Carvajal-Zarrabal, O.; Hayward-Jones, P.M.; Orta-Flores, Z.; Nolasco-Hipólito, C.; Barradas-Dermitz, D.M.; Aguilar-Uscanga, M.G.; Pedroza-Hernández, M.F. Effect of Hibiscus sabdariffa L. dried calyx ethanol extract on fat absorption-excretion, and body weight implication in rats. J. Biomed. Biotechnol. 2009, 2009, 394592. [Google Scholar] [CrossRef] [PubMed]
  17. Fernández-Arroyo, S.; Herranz-López, M.; Beltrán-Debón, R.; Borrás-Linares, I.; Barrajón-Catalán, E.; Joven, J.; Fernández-Gutiérrez, A.; Segura-Carretero, A.; Micol, V. Bioavailability study of a polyphenol-enriched extract from Hibiscus Sabdariffa in rats and associated antioxidant status. Mol. Nutr. Food Res. 2012, 56, 1590–1595. [Google Scholar] [CrossRef] [PubMed]
  18. Hopkins, A.L.; Lamm, M.G.; Funk, J.L.; Ritenbaugh, C. Hibiscus sabdariffa L. in the treatment of hypertension and hyperlipidemia: A comprehensive review of animal and human studies. Fitoterapia 2013, 85, 84–94. [Google Scholar] [CrossRef] [PubMed]
  19. Alarcón-Alonso, J.; Zamilpa, A.; Aguilar, F.A.; Herrera-Ruiz, M.; Tortoriello, J.; Jimenez-Ferrer, E. Pharmacological characterization of the diuretic effect of Hibiscus sabdariffa Linn (Malvaceae) extract. J. Ethnopharmacol. 2012, 139, 751–756. [Google Scholar] [CrossRef] [PubMed]
  20. Wang, M.L.; Morris, B.; Tonnis, B.; Davis, J.; Pederson, G.A. Assessment of oil content and fatty acid composition variability in two economically important hibiscus species. J. Agric. Food Chem. 2012, 60, 6620–6626. [Google Scholar] [CrossRef] [PubMed]
  21. Rodríguez-Medina, I.C.; Beltrán-Debón, R.; Molina, V.M.; Alonso-Villaverde, C.; Joven, J.; Menéndez, J.A.; Segura-Carretero, A.; Fernández-Gutiérrez, A. Direct characterization of aqueous extract of Hibiscus sabdariffa using HPLC with diode array detection coupled to ESI and ion trap MS. J. Sep. Sci. 2009, 32, 3441–3448. [Google Scholar] [CrossRef] [PubMed]
  22. Fernández-Arroyo, S.; Rodríguez-Medina, I.C.; Beltrán-Debón, R.; Pasini, F.; Joven, J.; Micol, V.; Segura-Carretero, A.; Fernández-Gutiérrez, A. Quantification of the polyphenolic fraction and in vitro antioxidant and in vivo anti-hyperlipemic activities of Hibiscus sabdariffa aqueous extract. Food Res. Int. 2011, 44, 1490–1495. [Google Scholar] [CrossRef]
  23. Beltrán-Debón, R.; Alonso-Villaverde, C.; Aragonès, G.; Rodríguez-Medina, I.; Rull, A.; Micol, V.; Segura-Carretero, A.; Fernández-Gutiérrez, A.; Camps, J.; Joven, J. The aqueous extract of Hibiscus sabdariffa calices modulates the production of monocyte chemoattractant protein-1 in humans. Phytomedicine 2010, 17, 186–191. [Google Scholar] [CrossRef] [PubMed]
  24. Joven, J.; Espinel, E.; Rull, A.; Aragonès, G.; Rodríguez-Gallego, E.; Camps, J.; Micol, V.; Herranz-López, M.; Menéndez, J.A.; Borrás, I.; et al. Plant-derived polyphenols regulate expression of miRNA paralogs miR-103/107 and miR-122 and prevent diet-induced fatty liver disease in hyperlipidemic mice. Biochim. Biophys. Acta Gen. Subj. 2012, 1820, 894–899. [Google Scholar] [CrossRef]
  25. Joven, J.; Rull, A.; Rodriguez-Gallego, E.; Camps, J.; Riera-Borrull, M.; Hernández-Aguilera, A.; Martin-Paredero, V.; Segura-Carretero, A.; Micol, V.; Alonso-Villaverde, C.; et al. Multifunctional targets of dietary polyphenols in disease: A case for the chemokine network and energy metabolism. Food Chem. Toxicol. 2013, 51, 267–279. [Google Scholar] [CrossRef]
  26. Joven, J.; March, I.; Espinel, E.; Fernández-Arroyo, S.; Rodríguez-Gallego, E.; Aragonès, G.; Beltrán-Debón, R.; Alonso-Villaverde, C.; Rios, L.; Martin-Paredero, V.; et al. Hibiscus sabdariffa extract lowers blood pressure and improves endothelial function. Mol. Nutr. Food Res. 2014, 58, 1374–1378. [Google Scholar] [CrossRef]
  27. Song, S.; Li, Y.; Feng, Z.; Jiang, J.; Zhang, P. Hepatoprotective constituents from the roots and stems of Erycibe hainanesis. J. Nat. Prod. 2010, 73, 177–184. [Google Scholar] [CrossRef]
  28. Ma, S.C.; Bi, P.X.; Huang, R.C.; Lee, S.S.; Lee, S.F. Determination of the antiviral caffeoyl quinic acids isolated from L. japonica thunb. Chin. J. Pharm. Anal. 2005, 25, 751–755. [Google Scholar]
  29. Amaki, K.; Saito, E.; Taniguchi, K.; Joshita, K.; Murata, M. Role of chlorogenic acid quinone and interaction of chlorogenic acid quinone and catechins in the enzymatic browning of apple. Biosci. Biotechnol. Biochem. 2011, 75, 829–832. [Google Scholar] [CrossRef]
  30. Murata, M.; Sugiura, M.; Sonokawa, Y.; Shimamura, T.; Homma, S. Properties of chlorogenic acid quinone: Relationship between browning and the formation of hydrogen peroxide from a quinone solution. Biosci. Biotechnol. Biochem. 2002, 66, 2525–2530. [Google Scholar] [CrossRef] [PubMed]
  31. Wang, M.; Simon, J.E.; Aviles, I.F.; He, K.; Zheng, Q.; Tadmor, Y. Analysis of antioxidative phenolic compounds in artichoke (Cynara scolymus L.). J. Agric. Food Chem. 2003, 51, 601–608. [Google Scholar] [CrossRef] [PubMed]
  32. Shakya, R.; Navarre, D.A. Rapid screening of ascorbic acid, glycoalkaloids, and phenolics in potato using high-performance liquid chromatography. J. Agric. Food Chem. 2006, 54, 5253–5260. [Google Scholar] [CrossRef] [PubMed]
  33. Gómez-Romero, M.; Segura-Carretero, A.; Fernández-Gutiérrez, A. Metabolite profiling and quantification of phenolic compounds in methanol extracts of tomato fruit. Phytochemistry 2010, 71, 1848–1864. [Google Scholar] [CrossRef]
  34. Ozawa, T.; Nishikiori, T.; Takino, Y. Three new substituted cinnamoyl hydroxycitric acids from corn plant. Agric. Biol. Chem. 1977, 41, 359–367. [Google Scholar] [CrossRef]
  35. Obouayeba, A.P.; Djyh, N.B.; Diabate, S.; Djaman, A.J.; N’Guessan, J.D.; Kone, M.; Kouakou, T.H. Phytochemical and antioxidant activity of roselle (Hibiscus sabdariffa L.) petal extracts. Res. J. Pharm. Biol. Chem. Sci. 2014, 5, 1453–1465. [Google Scholar]
  36. Artursson, P.; Karlsson, J. Correlation between oral drug absorption in humans and apparent drug permeability coefficients in human intestinal epithelial (Caco-2) cells. Biochem. Biophys. Res. Commun. 1991, 175, 880–885. [Google Scholar] [CrossRef]
  37. Artursson, P.; Palm, K.; Luthman, K. Caco-2 monolayers in experimental and theoretical predictions of drug transport. Adv. Drug Deliv. Rev. 2001, 46, 27–43. [Google Scholar] [CrossRef]
  38. Funes, L.; Laporta, O.; Cerdán-Calero, M.; Micol, V. Effects of verbascoside, a phenylpropanoid glycoside from Lemon verbena, on phospholipid model membranes. Chem. Phys. Lipids 2010, 163, 190–199. [Google Scholar] [CrossRef]
  39. Caturla, N.; Vera-Samper, E.; Villalaín, J.; Mateo, C.R.; Micol, V. The relationship between the antioxidant and the antibacterial properties of galloylated catechins and the structure of phospholipid model membranes. Free Radic. Biol. Med. 2003, 34, 648–662. [Google Scholar] [CrossRef]
  40. Laporta, O.; Pérez-Fons, L.; Mallavia, R.; Caturla, N.; Micol, V. Isolation, characterization and antioxidant capacity assessment of the bioactive compounds derived from Hypoxis rooperi corm extract (African potato). Food Chem. 2007, 101, 1425–1437. [Google Scholar] [CrossRef]
  41. Joven, J.; Micol, V.; Segura-Carretero, A.; Alonso-Villaverde, C.; Menéndez, J.A.; Aragonès, G.; Barrajón-Catalán, E.; Beltrán-Debón, R.; Camps, J.; Cufí, S.; et al. Polyphenols and the modulation of gene expression pathways: Can we eat our way out of the danger of chronic disease? Crit. Rev. Food Sci. Nutr. 2014, 54, 985–1001. [Google Scholar] [CrossRef] [PubMed]
  42. Farrell, T.L.; Gomez-Juaristi, M.; Poquet, L.; Redeuil, K.; Nagy, K.; Renouf, M.; Williamson, G. Absorption of dimethoxycinnamic acid derivatives in vitro and pharmacokinetic profile in human plasma following coffee consumption. Mol. Nutr. Food Res. 2012, 56, 1413–1423. [Google Scholar] [CrossRef] [PubMed]
  43. Fernandes, I.; Nave, F.; Gonçalves, R.; de Freitas, V.; Mateus, N. On the Bioavailability of flavanols and anthocyanins: Flavanol-anthocyanin dimers. Food Chem. 2012, 135, 812–818. [Google Scholar] [CrossRef]
  44. Konishi, Y.; Shimizu, M. Transepithelial transport of ferulic acid by monocarboxylic acid transporter in Caco-2 cell monolayers. Biosci. Biotechnol. Biochem. 2003, 67, 856–862. [Google Scholar] [CrossRef]
  45. Konishi, Y.; Kobayashi, S.; Shimizu, M. Transepithelial transport of p-coumaric acid and gallic acid in Caco-2 cell monolayers. Biosci. Biotechnol. Biochem. 2003, 67, 2317–2324. [Google Scholar] [CrossRef] [PubMed]
  46. Konishi, Y.; Kobayashi, S. Transepithelial transport of chlorogenic acid, caffeic acid, and their colonic metabolites in intestinal Caco-2 cell monolayers. J. Agric. Food Chem. 2004, 52, 2518–2526. [Google Scholar] [CrossRef] [PubMed]
  47. Morand, C.; Manach, C.; Crespy, V.; Remesy, C. Quercetin 3-O-β-glucoside is better absorbed than other quercetin forms and is not present in rat plasma. Free Radic. Res. 2000, 33, 667–676. [Google Scholar] [CrossRef] [PubMed]
  48. Morand, C.; Manach, C.; Crespy, V.; Remesy, C. Respective bioavailability of quercetin aglycone and its glycosides in a rat model. Biofactors 2000, 12, 169–174. [Google Scholar] [CrossRef] [PubMed]
  49. Walgren, R.A.; Walle, U.K.; Walle, T. Transport of quercetin and its glucosides across human intestinal epithelial Caco-2 cells. Biochem. Pharmacol. 1998, 55, 1721–1727. [Google Scholar] [CrossRef] [PubMed]
  50. Manach, C.; Morand, C.; Crespy, V.; Demigné, C.; Texier, O.; Régérat, F.; Rémésy, C. Quercetin is recovered in human plasma as conjugated derivatives which retain antioxidant properties. FEBS Lett. 1998, 426, 331–336. [Google Scholar] [CrossRef] [PubMed]
  51. Chabane, M.N.; Al Ahmad, A.; Peluso, J.; Muller, C.D.; Ubeaud, G. Quercetin and naringenin transport across human intestinal Caco-2 cells. J. Pharm. Pharmacol. 2009, 61, 1473–1483. [Google Scholar] [CrossRef]

