1. Introduction
It is well known that interactions of any solute, ranging from small organic compounds to macromolecules, with an aqueous environment are fundamentally important for their functions
in vivo [
1,
2,
3]. However, our current understanding of the mechanisms underlying interactions between the aqueous solvent and solute is very limited. The solute–solvent interactions for any given solute are governed by the properties of solvent, though the contributions of different solvent properties would depend on the solute structure and physicochemical features. According to Cabot and Hunter [
4], most quantitative approaches to the study of solvation phenomena have focused on the use of specially designed spectroscopic probes sensitive to changes in their environment [
5,
6,
7]. The most widely used term for solvent classification is polarity. This is a very poorly defined term, which, according to the current definition, is the sum of all possible specific and non-specific interactions between the solvent and any potential solute, excluding interactions leading to chemical transformations of the solute [
5,
8]. The solute–solvent interactions include multiple types of interactions, such as electrostatic, dipole–dipole, dipole-induced dipole, hydrogen bonding and electron pair donor–acceptor interactions. It is especially important that polarity describes the potential behavior of the solvent in a relationship with the solute, which is not an absolute property of the pure solvent [
8]. There is a large number of different polarity scales based on different probes and spectroscopic techniques (NMR, IR, UV/Visible absorption and emission spectroscopy,
etc.) [
4]. According to Ab Rani
et al. [
8], there is no single measure of polarity; all the polarity scales are estimates and different scales provide different estimates for the same solvent. There is no useful concept of “right” or “wrong” when comparing these scales. The test of an empirical polarity scale is its usefulness in explaining and/or predicting other solvent dependent phenomena [
8].
Any single-parameter polarity scale cannot represent the multitude of possible solute–solvent interactions. Therefore Kamlet and Taft developed multi-parameter polarity scales based on Linear Solvation Energy Relationship (LSER) including three scales, such as hydrogen bond donor acidity (α) [
9], hydrogen bond acceptor basicity (β) [
10], and dipolarity/polarizability (π
*) [
11]. Combination of these three scales describes the ability of a given solvent to participate in solute–solvent interactions,
i.e., solvent polarity, much better than any single-parameter polarity scale. The LSER model used by Kamlet, Taft, and their co-workers may be described as:
where (XYZ) is the solute property (solubility, reaction rate, equilibrium constant, the logarithm of a gas/solvent or solvent/solvent partition coefficient,
etc.) in a given solvent; (XYZ)
o is the same solute property in a reference state;
s,
a, and
b are the solute-dependent coefficients characterizing the respective influence of the π
*, α, and β terms on the (XYZ) property under study. Although there are multiple examples of the successful use of Kamlet–Taft approach, the discussion of these examples is beyond the scope of this study.
It has been recently shown that typical crowding agents are capable of changing the solvent properties of aqueous media in their solutions [
12]. The solvent properties of aqueous media were studied by the solvatochromic comparison approach developed by Taft, Kamlet, and others [
9,
10,
11]. This approach is based on using a set of solvatochromic dyes with the wavelength positions of their UV/Vis absorption maxima shifting in accordance with the different solvent properties. This approach was used to quantify the solvent’s dipolarity/polarizability, hydrogen-bond donor (HBD) acidity, and hydrogen-bond acceptor (HBA) basicity in aqueous solutions of polyethylene glycols (PEGs) of different molecular mass [
13], dextran, Ficoll, and other crowding agents [
12]. It has been shown that the influence of crowding agents on stability, refolding, and aggregation of proteins can be described in terms of changes in particular solvent properties of aqueous media in their solutions, in addition to the size exclusion effect [
12].
Crowding effects in polymer solutions are studied generally in order to simulate intracellular conditions existing
in vivo [
14,
15,
16,
17]. These highly crowded conditions are achieved
in vivo due to the overall concentration of a large variety of different proteins, nucleic acids, carbohydrates, and other solutes that may be as high as 400 g/L [
14,
15,
16,
17], while no individual macromolecular species are present there at such very high concentrations. As a result, biological macromolecules may occupy up to 40% of the cellular volume [
14,
15,
16,
17]. Although solvent properties of aqueous media under these conditions may be expected to be altered significantly, they have not been explored as of yet.
A solvatochromic analysis of solvent properties of aqueous media in protein solutions is hindered by the propensity of typical proteins to bind aromatic compounds, such as solvatochromic dyes. Therefore, as an attempt to examine the protein influence on solvent properties of aqueous media in their solutions, we have chosen an elastin-like polypeptide (ELP) composed of 40 pentapeptide (GVGVP) repeating units. The advantages of using this polypeptide in our study are: (a) it does not bind the solvatochromic dyes employed; and (b) ELPs are known to respond to changes in the composition of their environment in aqueous solutions by quantifiable changes in the readily measurable temperature of a phase transition,
Tt, also called the lower critical solution temperature (LCST) [
18].
The purpose of this study was twofold—to quantify the solvent properties of aqueous ELP solutions in the presence of different salt additives known to affect the ELP phase transition temperature and in the presence of different osmolytes, and to explore if the phase transition temperature in these solutions might be described in terms of the solvent properties of the ELP solution. Additionally, it was necessary to verify that ELP does not bind the solvatochromic dyes used as probes of solvent properties in ELP solutions.
2. Results and Discussion
In order to explore if the solvatochromic dyes bind to elastin-like polypeptide (ELP), we used the method of partitioning in aqueous two-phase system (ATPS). Partitioning of ELP in the Ficoll-70-PEG-8000-0.01 M sodium phosphate buffer, pH 7.4 was examined in the absence and in the presence of the two solvatochromic dyes (
p-nitrophenol and
p-nitroanisole) using
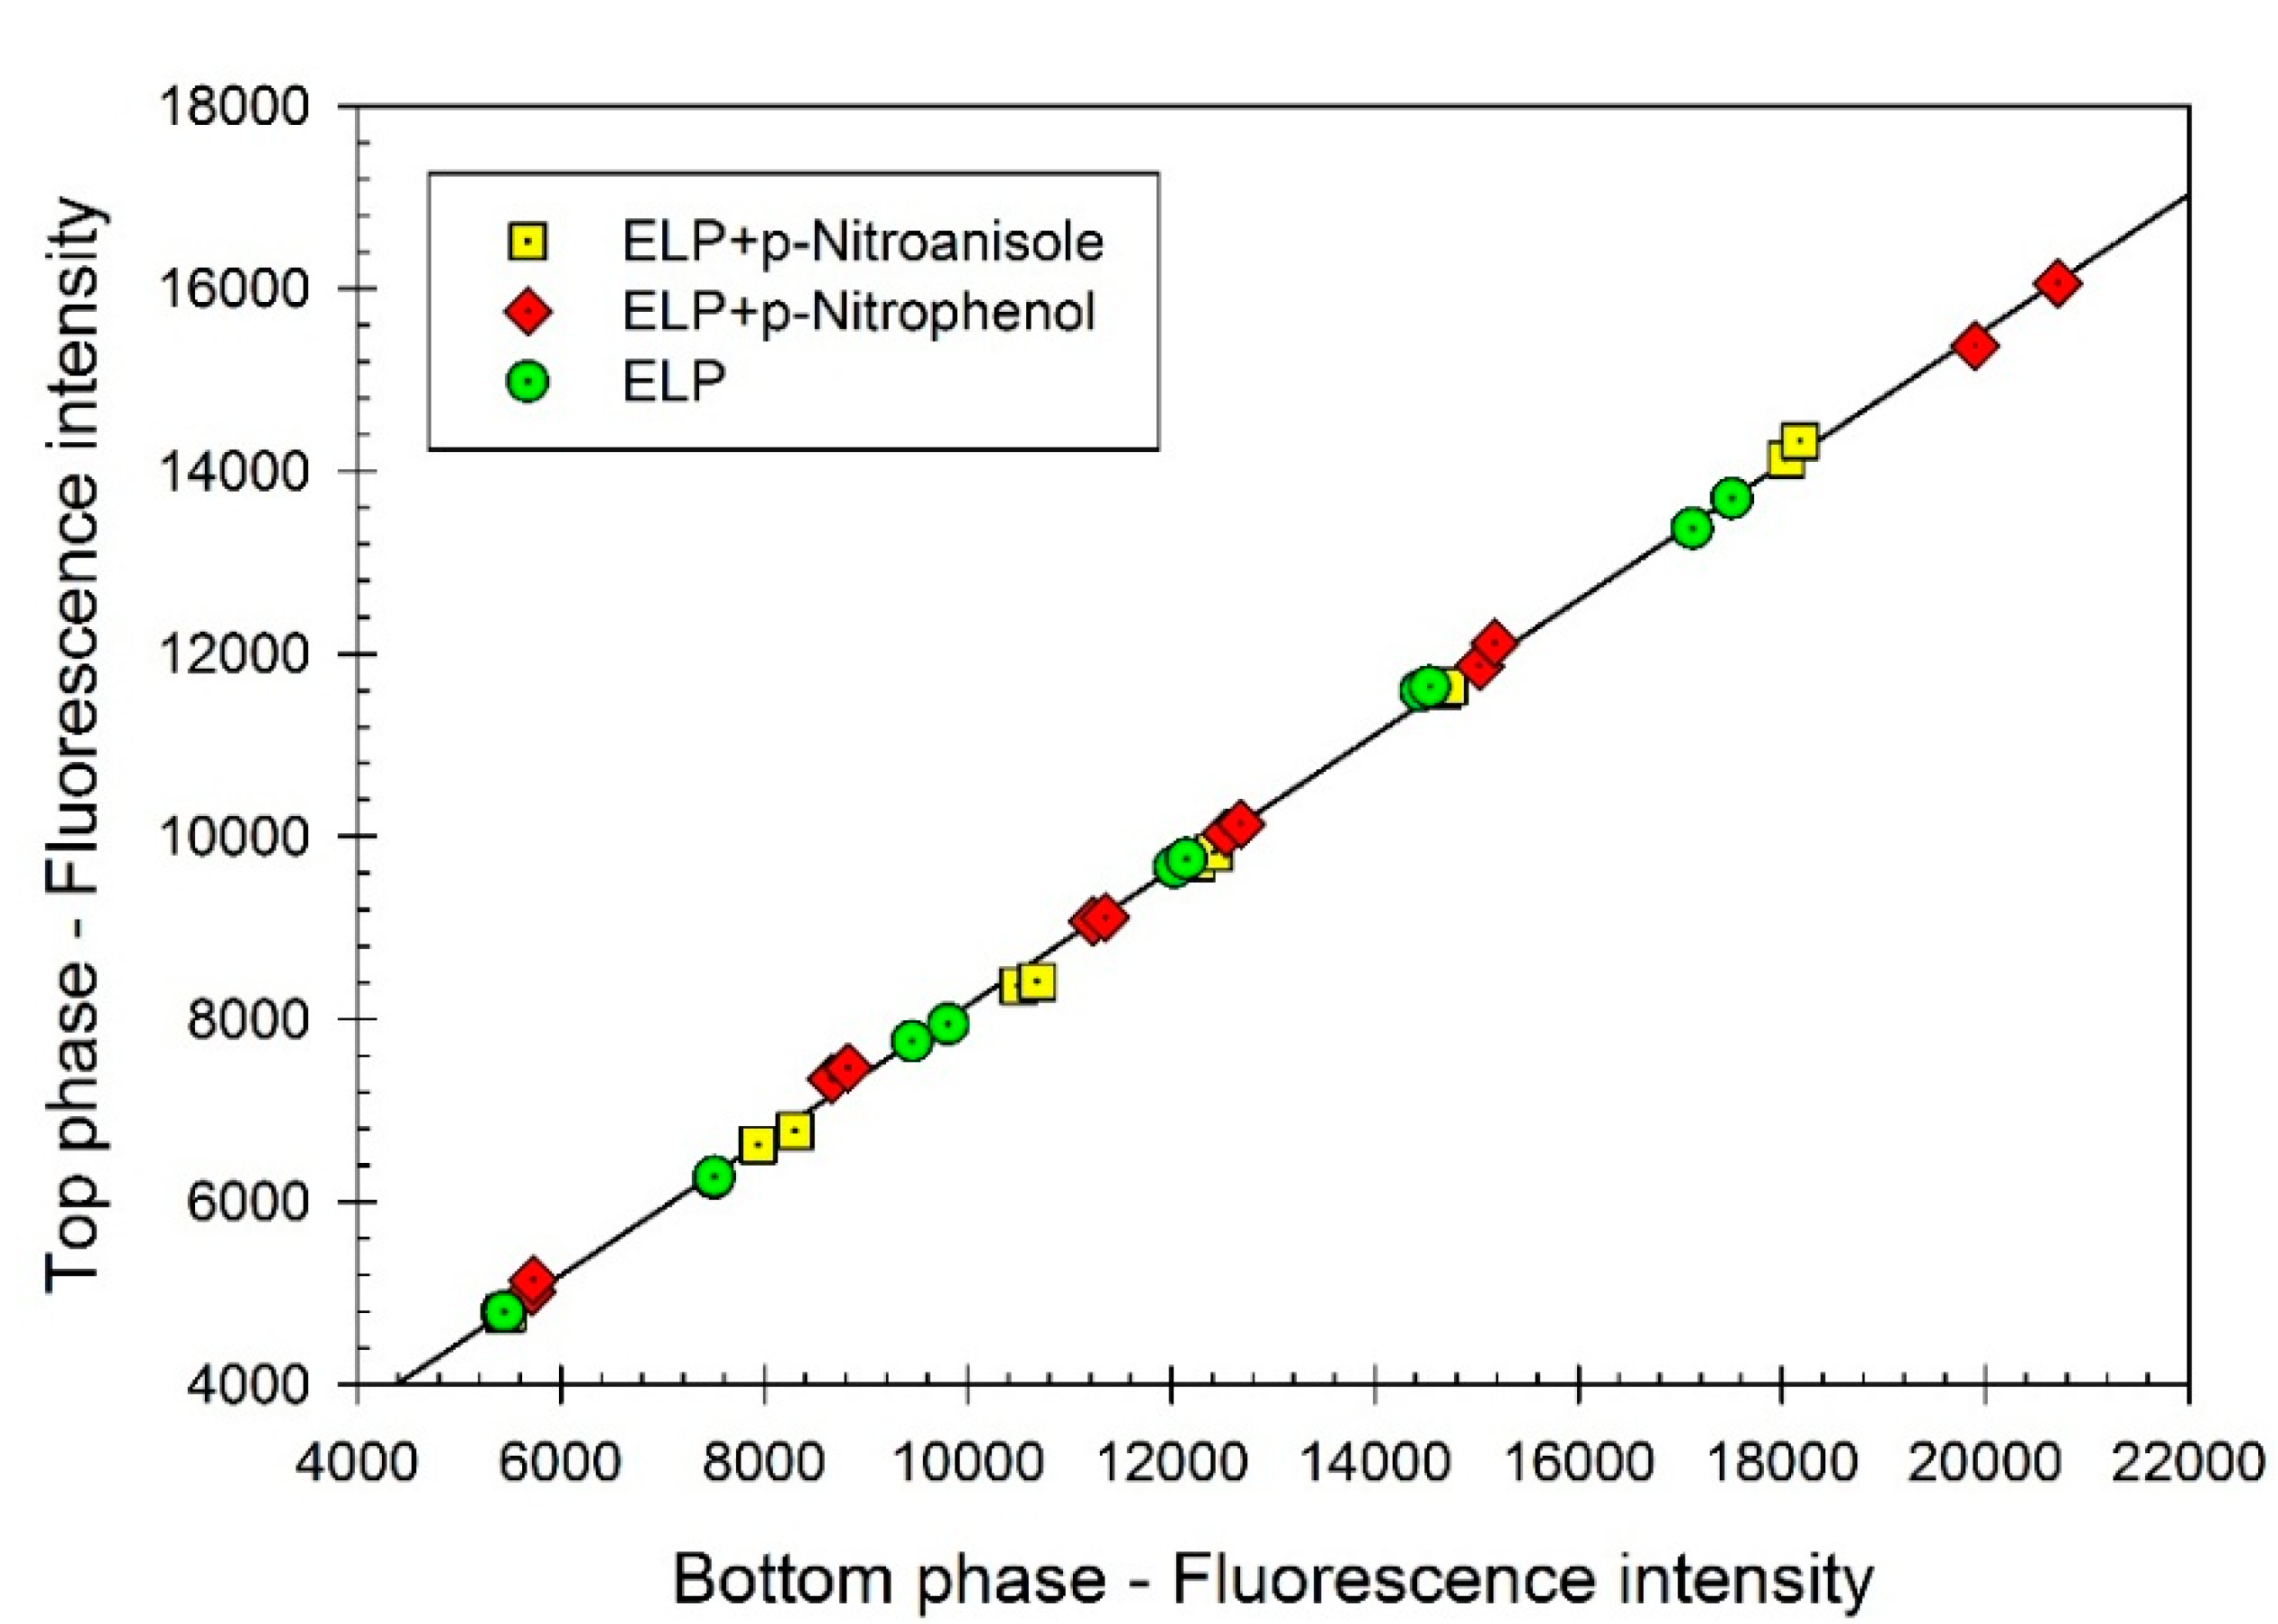
o-phthaldialdehyde (OPA) fluorescence assay. The data presented graphically in
Figure 1 show that the partition coefficient of ELP,
K, remains the same (
K = 0.740 ± 0.004) in the absence and in the presence of the dyes. It is well established that the partition coefficient of a given solute (an organic compound or a protein) in an aqueous two-phase system is extremely sensitive to binding of another compound [
19,
20,
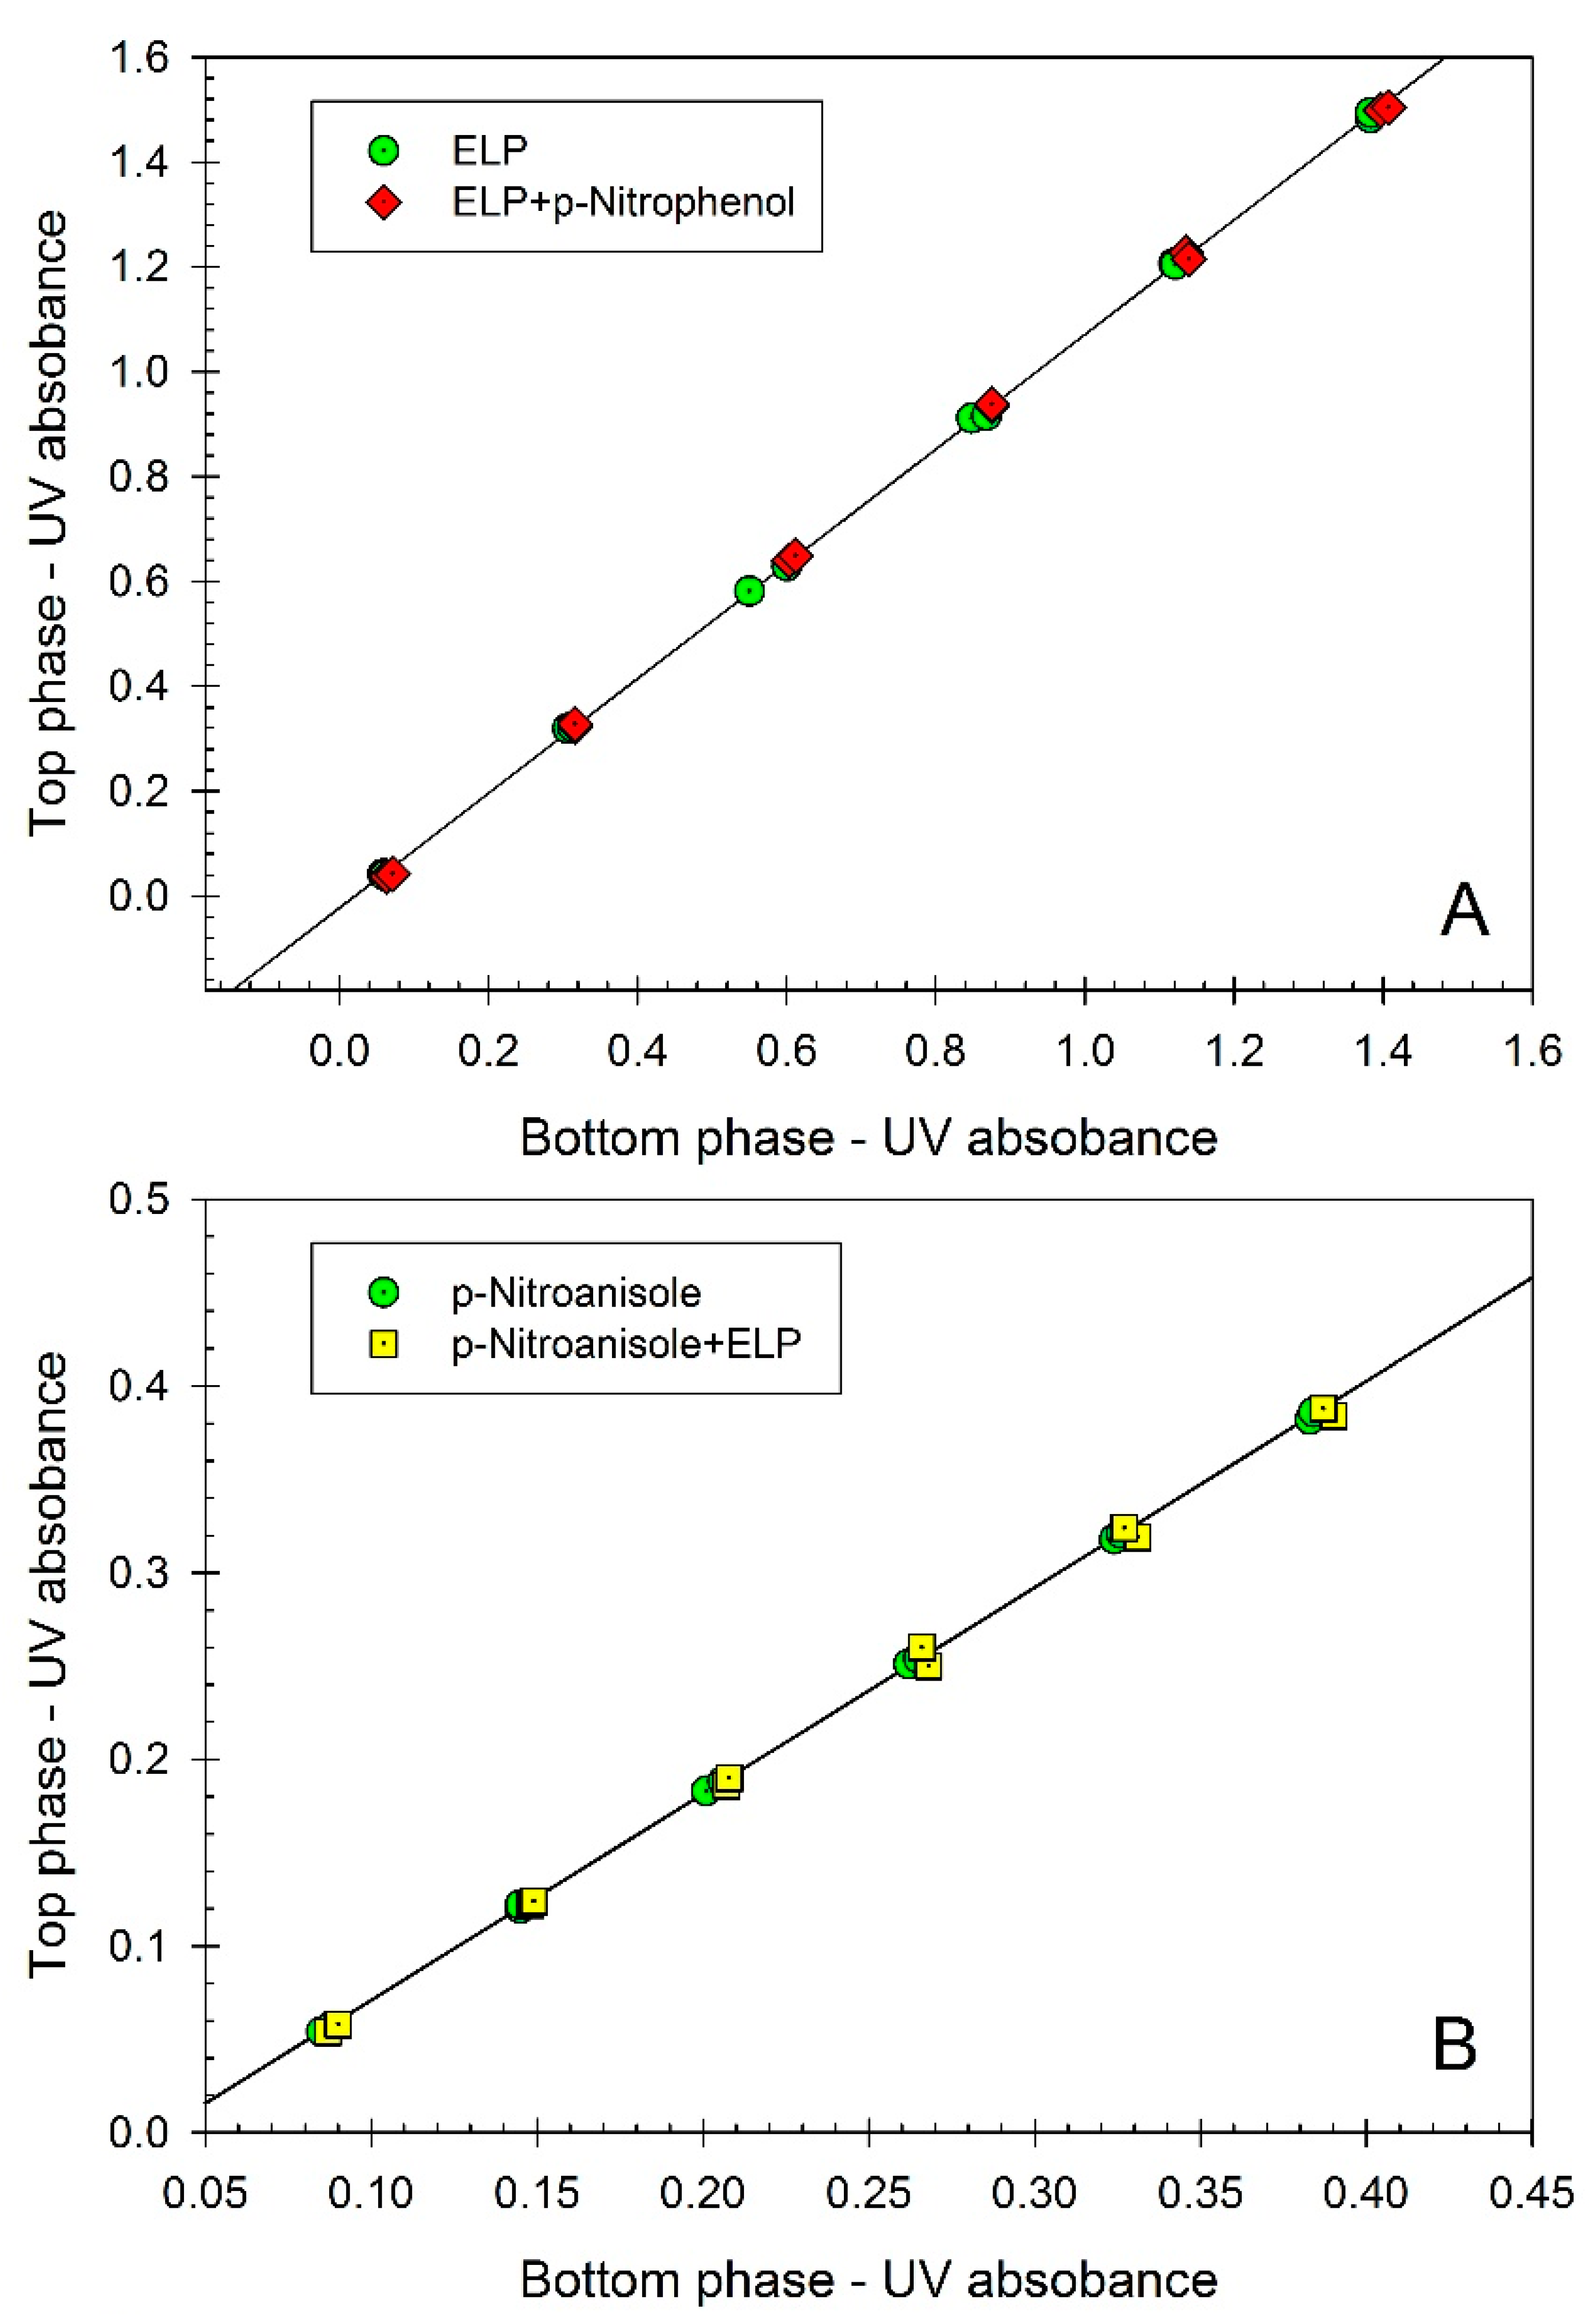
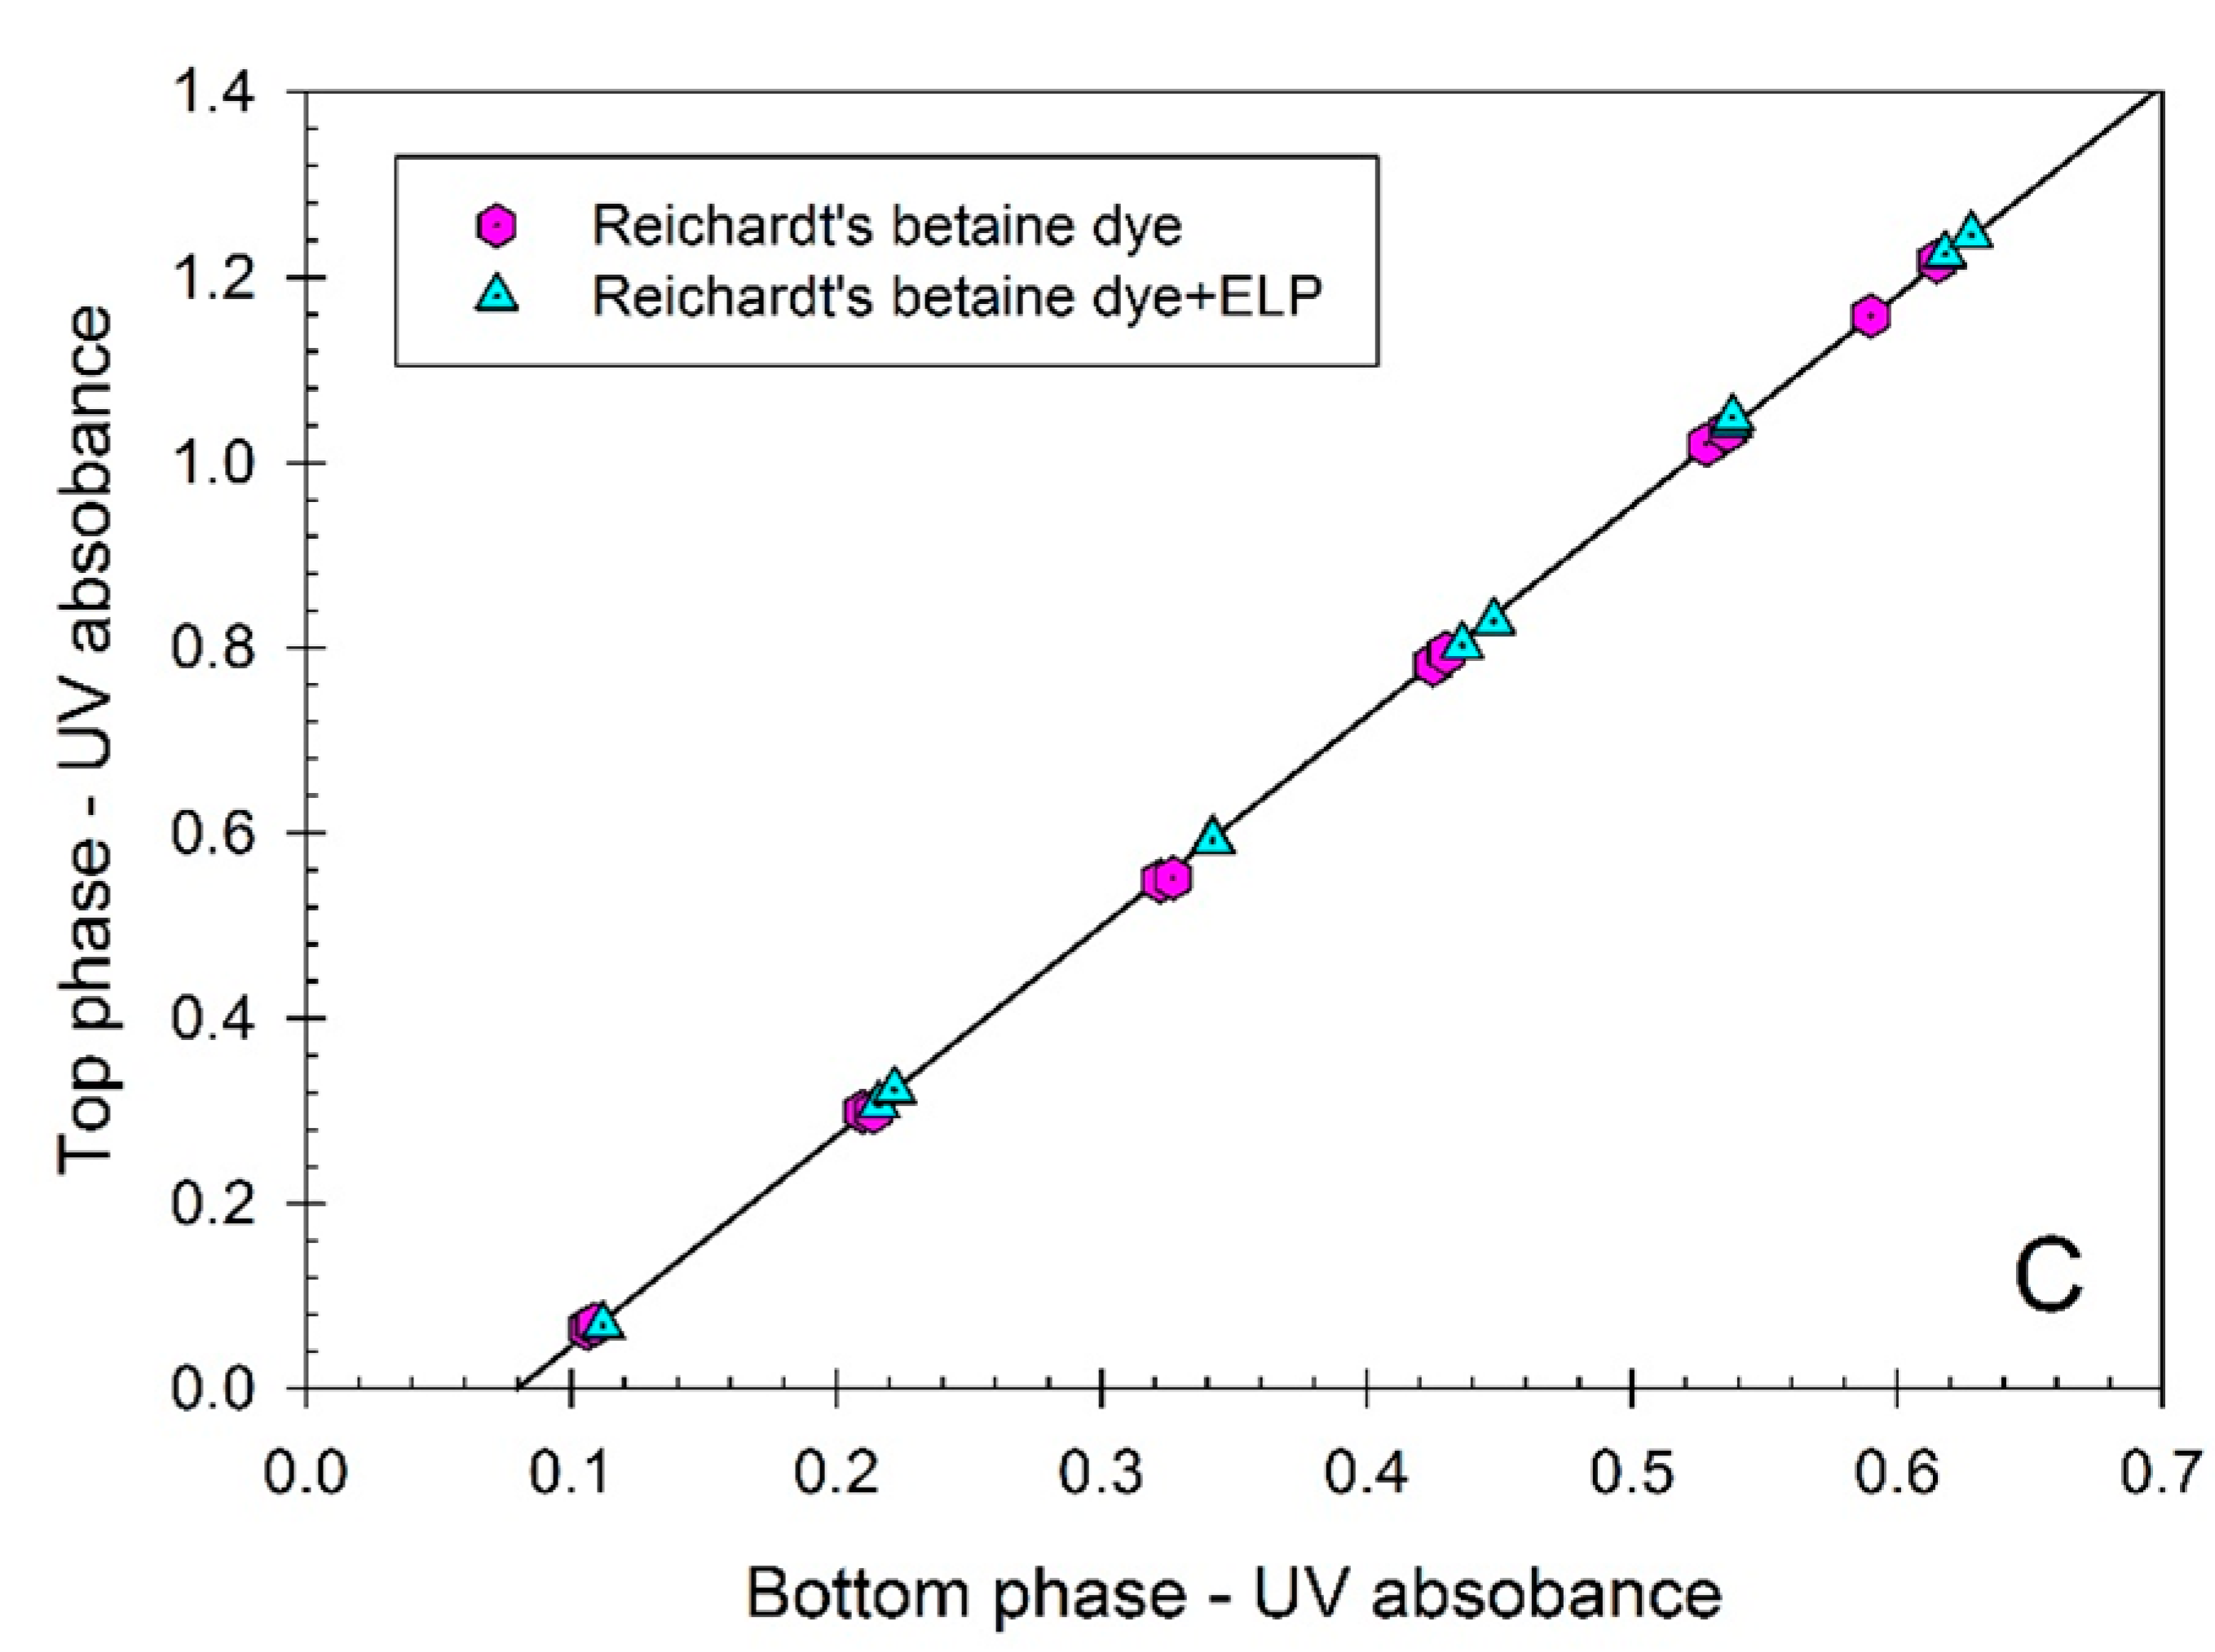
21]. Therefore, the data obtained by this approach may be viewed as confirming assumption that the ELP examined does not bind the dyes under study. In addition, we examined partitioning of all three dyes in the same ATPS in the absence and in the presence of ELP using UV/VIS absorbance assay. The results of these studies are shown in
Figure 2. The partition coefficients of all three dyes:
p-nitrophenol (
K = 1.094 ± 0.003),
p-nitroanisole (
K = 1.103 ± 0.006), and Reichardt’s carboxylated betaine dye (
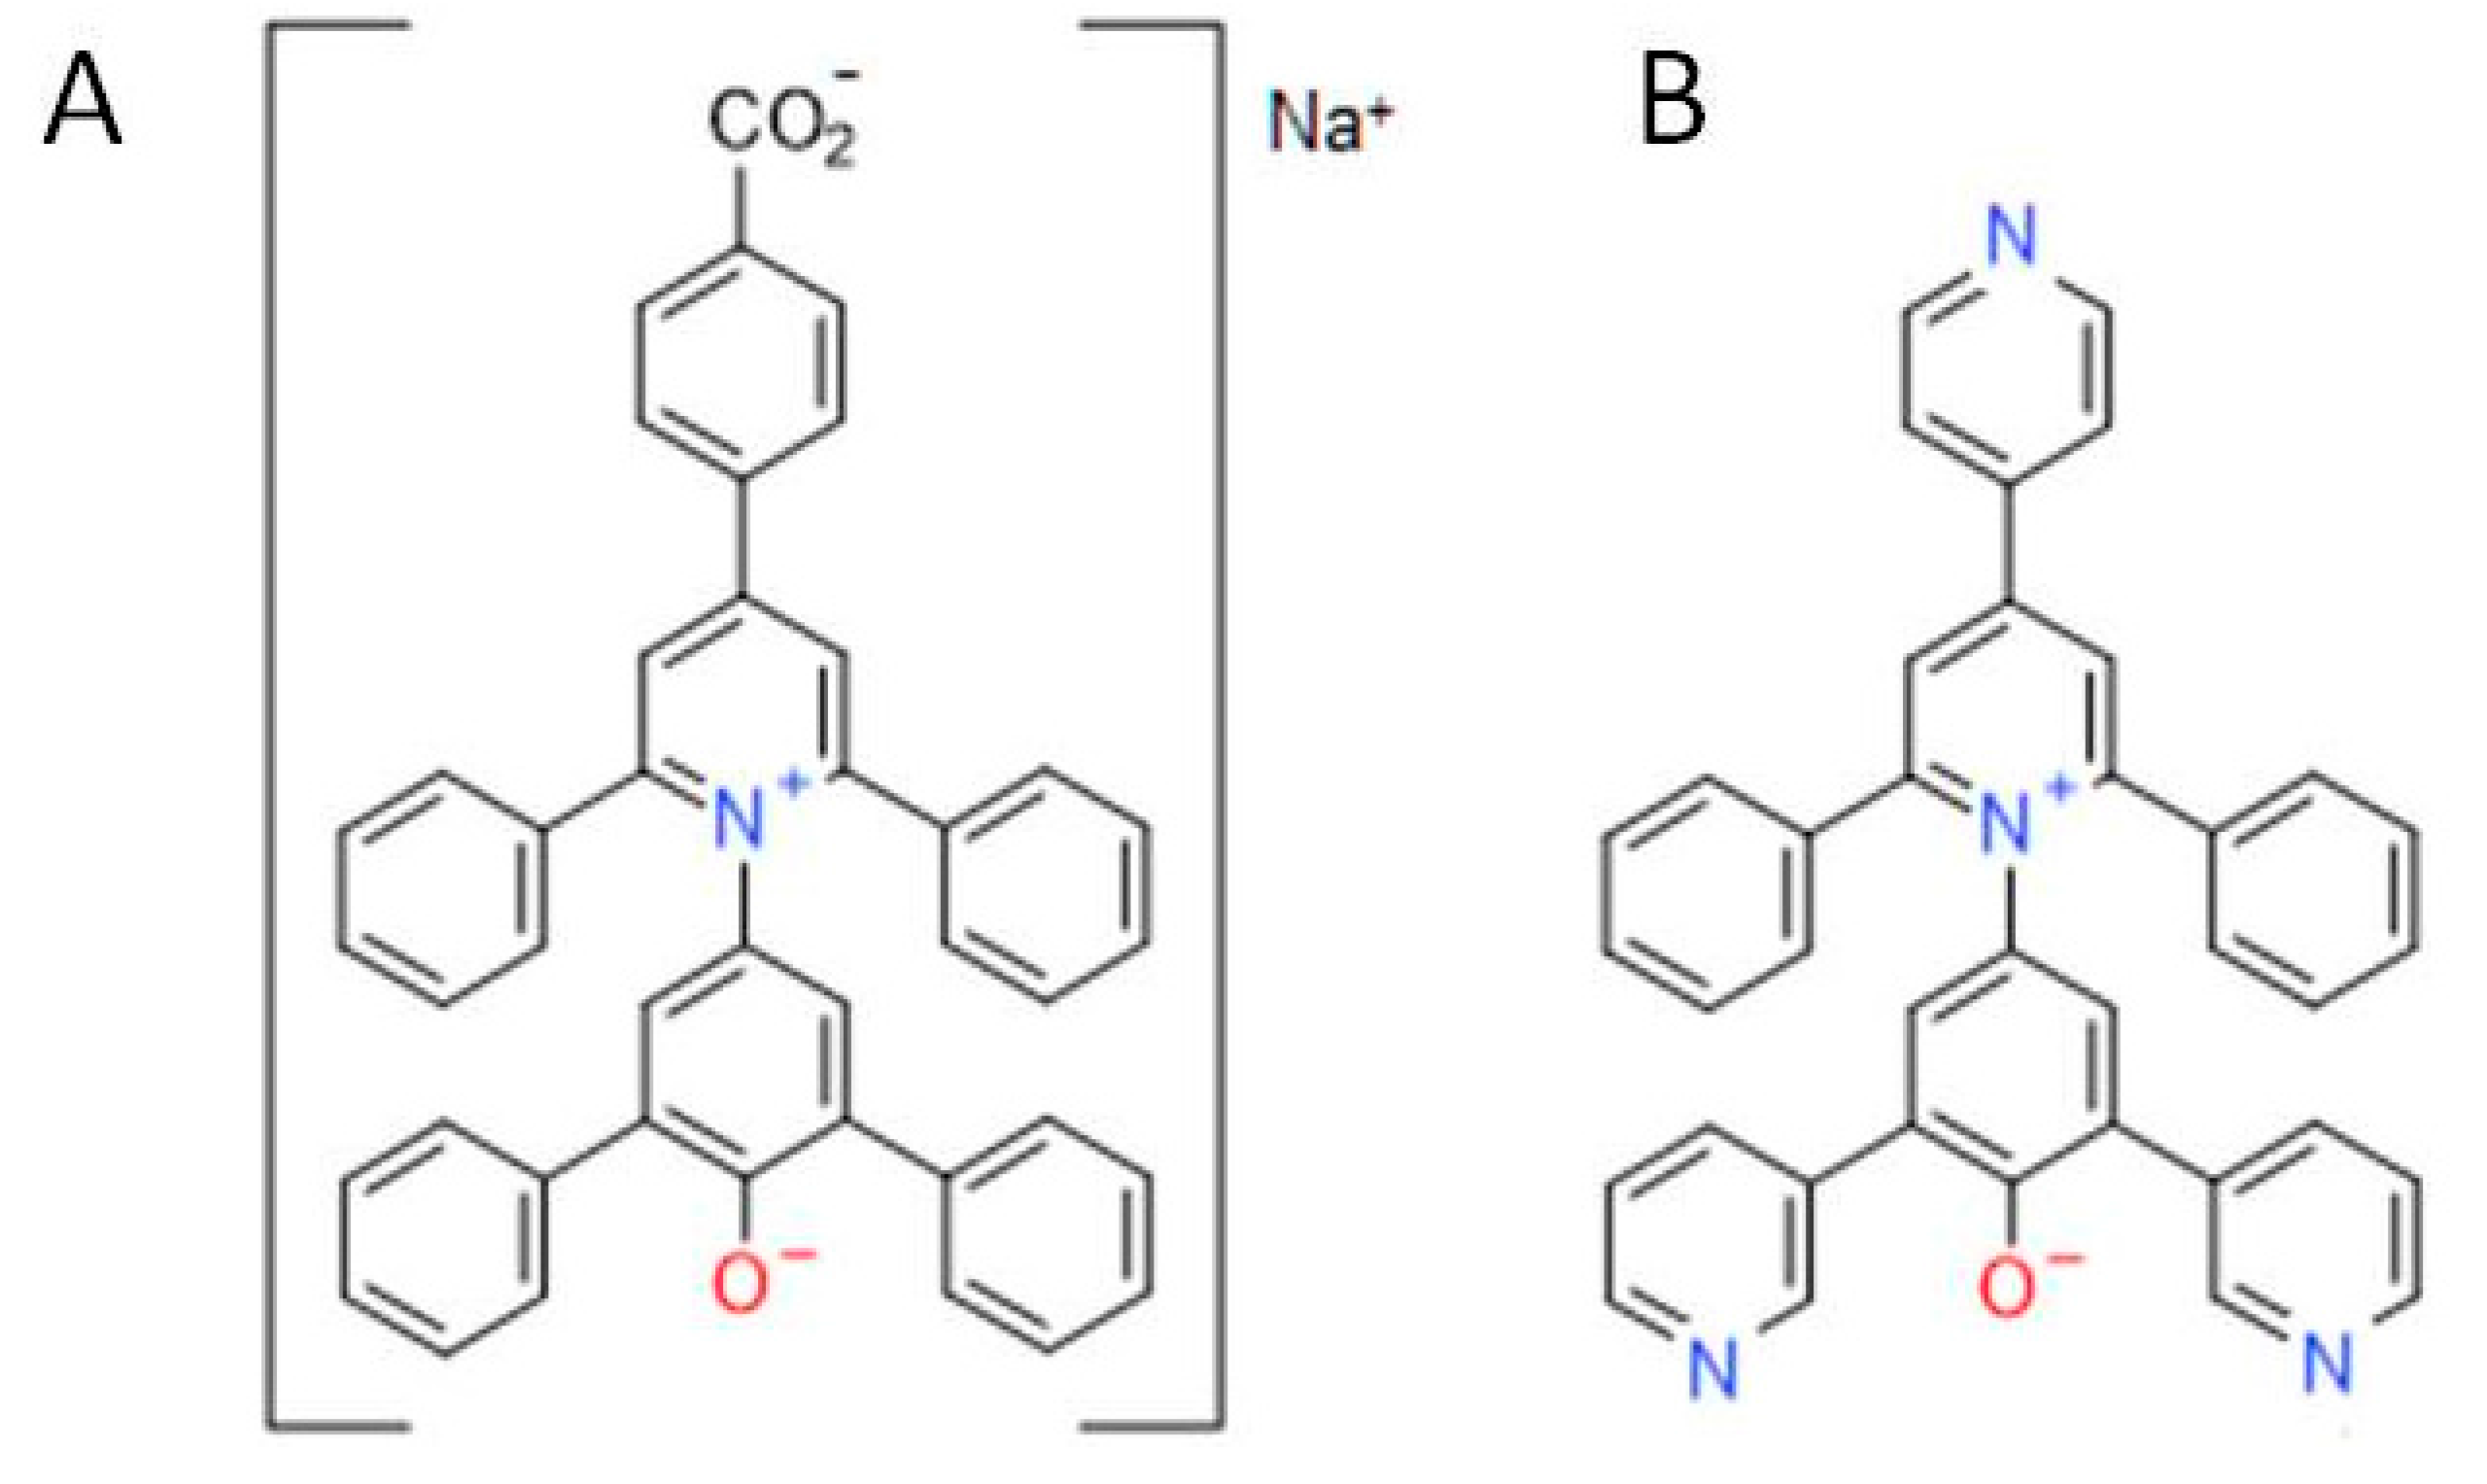
K = 2.276 ± 0.005), do not change in the presence of ELP. These data confirm the notion that the dyes examined here do not interact with ELP and hence may be used as solvatochromic probes of the solvent properties of aqueous media in ELP solutions. Note that the partitioning of ELP in the presence of the Reichardt’s dye in the ATPS could not be examined because of the interference of the dye fluorescence with the OPA assay.
Figure 1.
Concentration of elastin-like polypeptide (ELP) (represented by fluorescence intensity) in the top phase vs. concentration of ELP (represented by fluorescence intensity) in the bottom phase of aqueous Ficoll-PEG-0.01 M sodium phosphate buffer, pH 7.4 two-phase system. ELP, (GVGVP)40, was partitioned in the absence of additives (green circles), and in the presence of p-nitrophenol (red diamonds) or p-nitroanisole (yellow squares). Concentrations of ELP are measured in each phase with the o-phthaldialdehyde (OPA) assay. Slope of the linear curve represents the partition coefficient of ELP.
Figure 2.
(A) Concentration of p-nitrophenol (represented by UV absorbance at 404 nm) in the top phase vs. concentration of p-nitrophenol (represented by UV absorbance at 404 nm) in the bottom phase of aqueous Ficoll-PEG-0.01 M sodium phosphate buffer, pH 7.4 two-phase system. p-Nitrophenol was partitioned in the absence of additives, and in the presence of ELP, (GVGVP)40. Concentrations of p-nitrophenol are measured in each phase following dilution with universal buffer, pH 12.4. Slope of the linear curve represents the partition coefficient of p-nitrophenol; (B) Concentration of p-nitroanisole (represented by UV absorbance at 318 nm) in the top phase vs. concentration of p-nitroanisole (represented by UV absorbance at 318 nm) in the bottom phase of aqueous Ficoll-PEG-0.01 M sodium phosphate buffer, pH 7.4 two-phase system. p-Nitroanisole was partitioned in the absence of additives, and in the presence of ELP, (GVGVP)40. Concentrations of p-nitroanisole are measured in each phase following dilution with water. Slope of the linear curve represents the partition coefficient of p-nitroanisole; (C) Concentration of the carboxylated Reichardt’s betaine dye (represented by UV absorbance at 308 nm) in the top phase vs. concentration of the carboxylated Reichardt’s betaine dye (represented by UV absorbance at 308 nm) in the bottom phase of aqueous Ficoll-PEG-0.01 M sodium phosphate buffer, pH 7.4 two-phase system. Carboxylated Reichardt’s betaine dye was partitioned in the absence of additives, and in the presence of ELP, (GVGVP)40. Concentrations of the carboxylated Reichardt’s betaine dye are measured in each phase following dilution with water. Slope of the linear curve represents the partition coefficient of the carboxylated Reichardt’s betaine dye.
![Ijms 16 13528 g002a]()
![Ijms 16 13528 g002b]()
In order to estimate the highest ELP concentration that could be used for solvatochromic measurements, we first explored the UV/Vis spectra of one of the solvatochromic dyes—4-nitroanisole—in solutions of ELP in an aqueous 0.01 M sodium phosphate buffer (NaPB) at pH 7.4 over the ELP concentration range of 5 to 25 mg/mL. ELP solutions display a rather high intensity absorption maximum at λ ≈ 280 nm due to the presence of a tryptophan residue close to the N-terminus of the polypeptide chain.
The tail of the absorption peak at 280 nm was found to mask the UV absorption maximum of 4-nitroanisole at ≈317 nm at high ELP concentrations. The highest ELP concentration at which the solvatochromic shift of the dye absorption maximum could be determined reliably was found to be 15 mg/mL (0.90 mM) ELP.
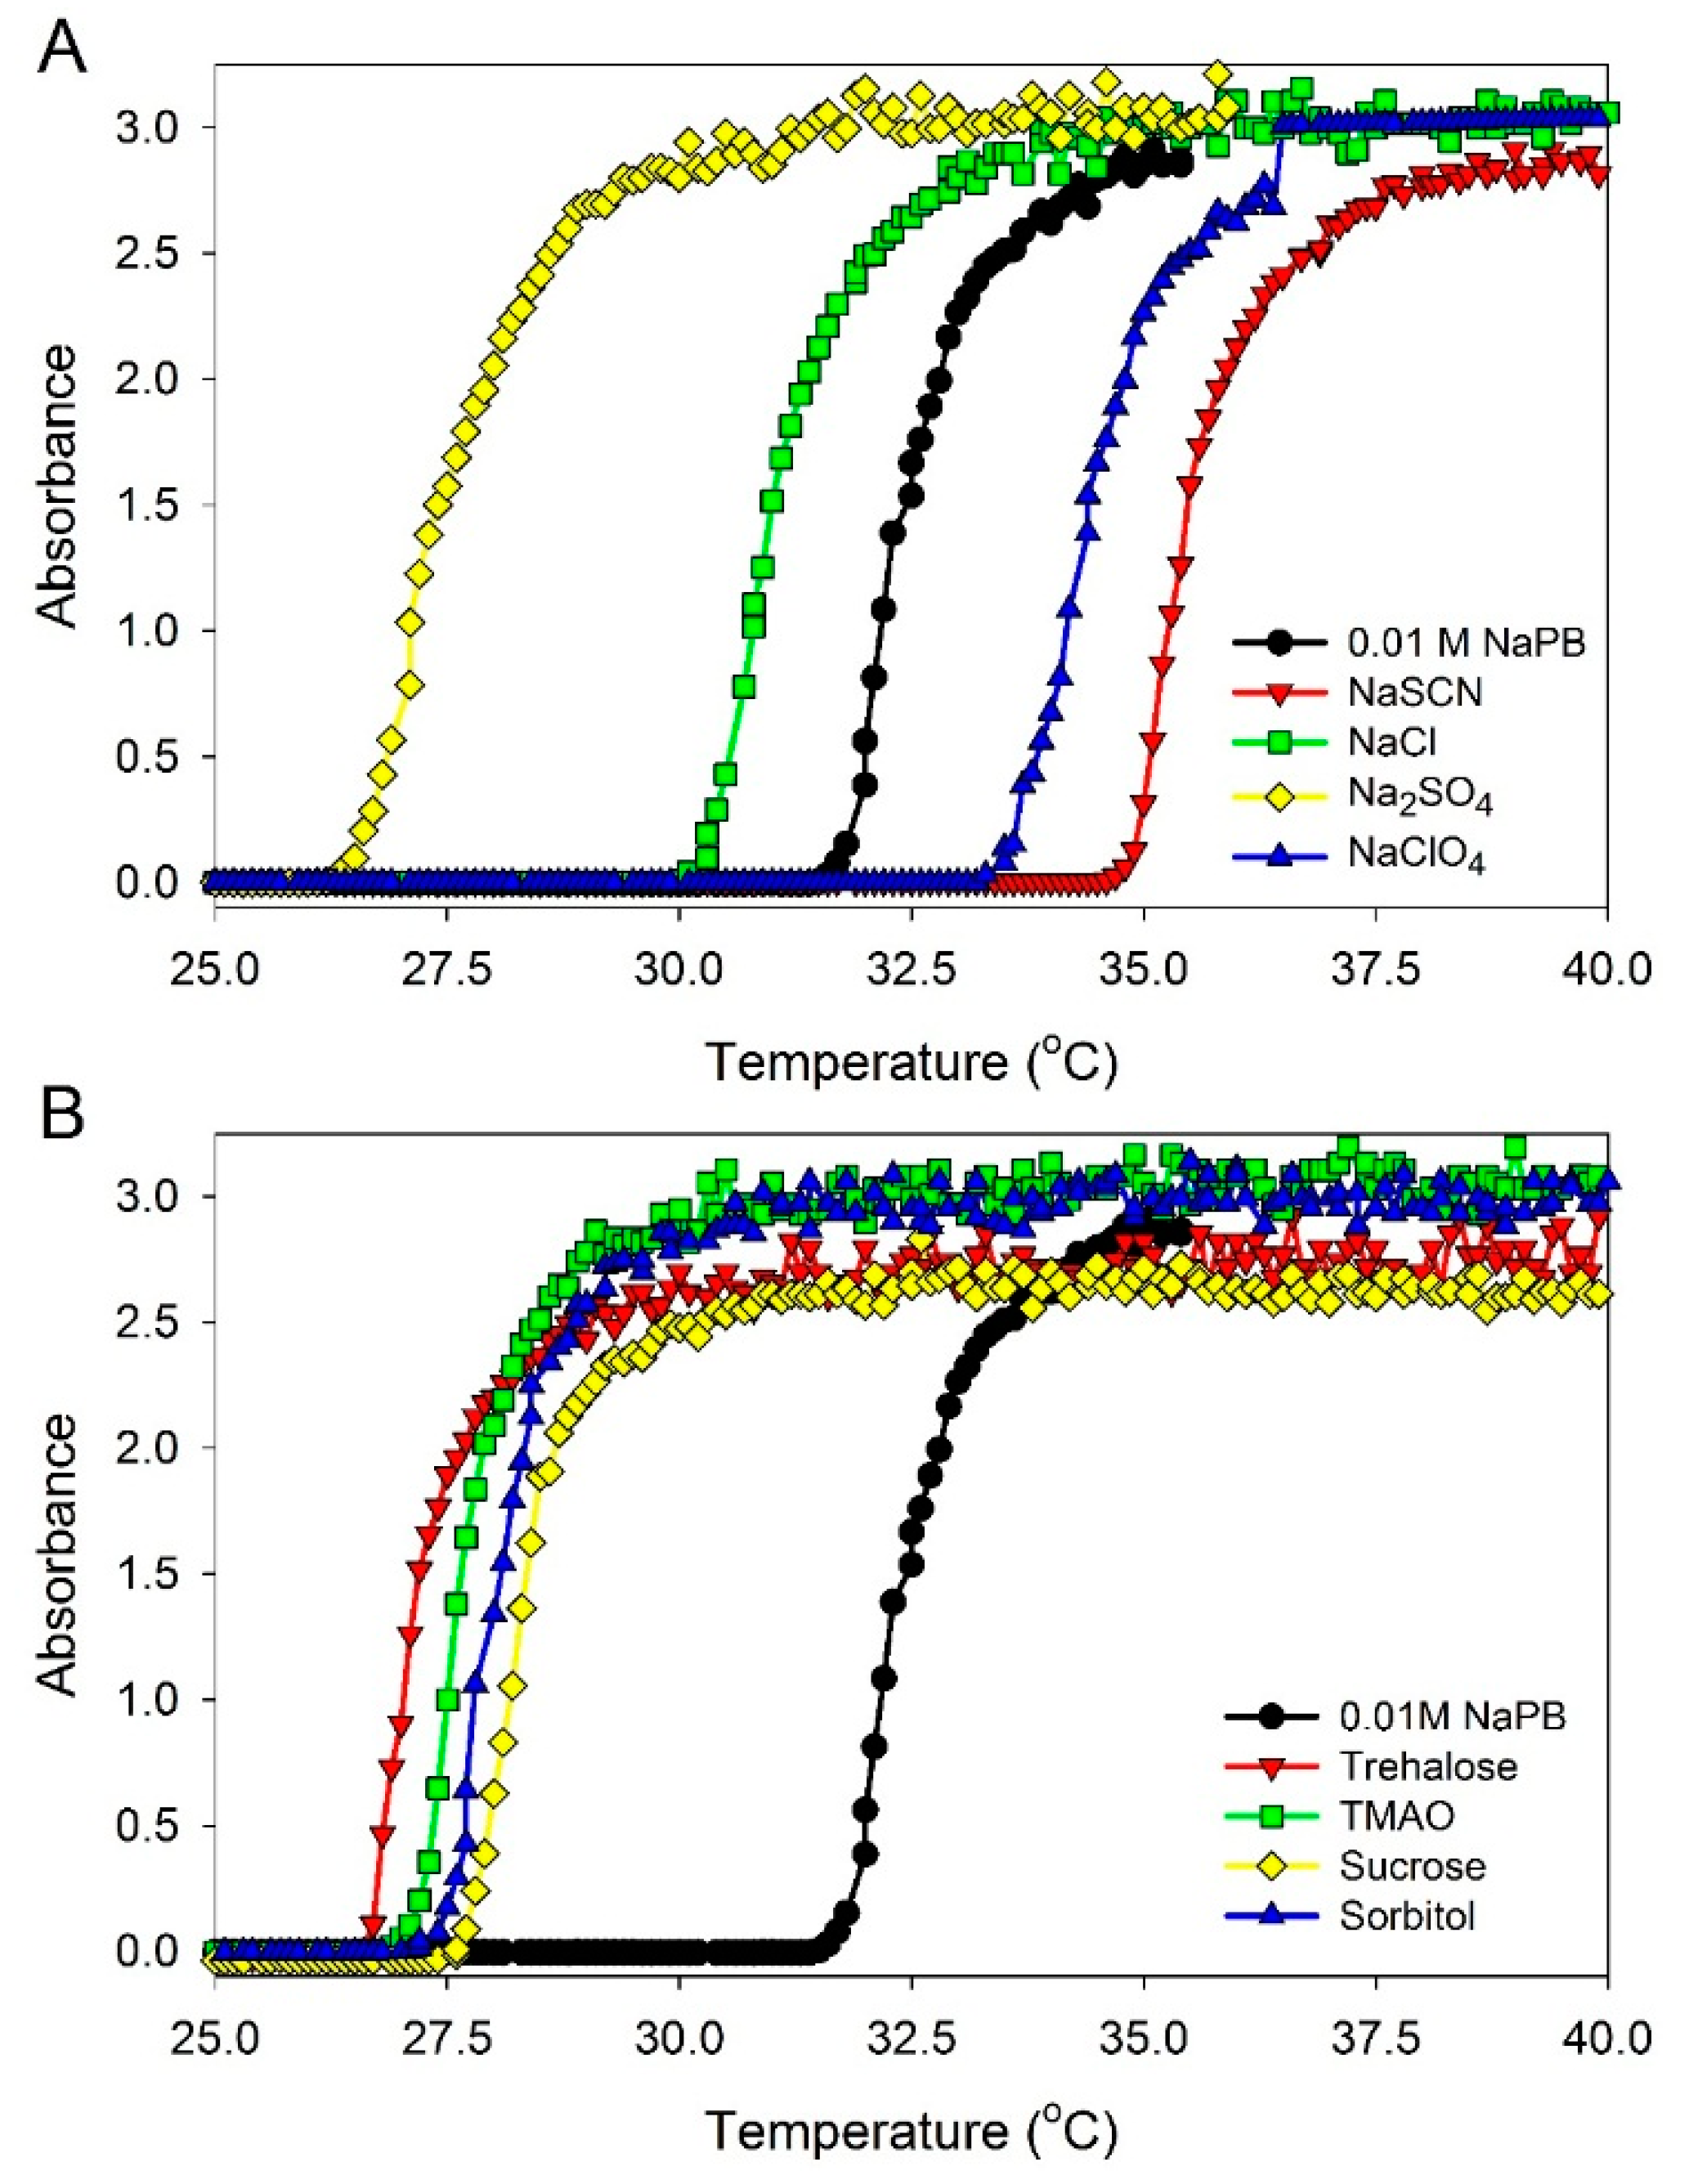
The phase-transition temperatures in ELP solutions at a 0.90 mM concentration in the presence of different additives were measured as described in Materials and Methods (see below). The data obtained are illustrated in
Figure 3 and are listed in
Table 1. It should be mentioned that all solvatochromic measurements were performed at 23 °C, and the concentrations of the additives were adjusted for this temperature to be below the phase transition temperature,
Tt, in ELP solutions at the ELP concentration of 0.90 mM. It should also be noted that the addition of osmolytes known to stabilize the protein structure in solution [
22,
23,
24] were found to decrease the phase transition temperature of ELP.
Table 1 also shows that the addition of ELP moderately affected hydrogen bond donor acidity (α) and dipolarity/polarizability (π*) of solutions containing different salts and osmolytes, whereas hydrogen bond acceptor basicity (β) of the same solutions of small additives (except to trimethylamine
N-oxide (TMAO)) was affected to a much lesser degree.
Figure 3.
UV absorbance at 350 nm of (GVGVP)40 at 0.90 mM concentration in 0.01 M sodium phosphate buffer (NaPB), pH 7.4 in the presence of different additives as a function of temperature. Additives: (A) salts—0.1 M NaCl, 0.05 M Na2SO4, 0.1 M·NaClO4, and 0.1 M NaSCN; and (B) osmolytes—0.5 M sucrose, 0.4 M sorbitol, 0.4 M trehalose, and 0.4 M trimethylamine N-oxide (TMAO). In order to determine the transition temperature for ELP solutions, the samples were heated at a rate of 1 °C/min and the UV absorbance at 350 nm was recorded.
Table 1.
Solvent properties π*, α, and β of aqueous media in 10 mM sodium phosphate buffer at pH 7.4 in the presence of different additives and phase-transition temperature, Tt, as well as solvent properties in solutions of 0.90 mM ELP in the presence of additives *.
Table 1.
Solvent properties π*, α, and β of aqueous media in 10 mM sodium phosphate buffer at pH 7.4 in the presence of different additives and phase-transition temperature, Tt, as well as solvent properties in solutions of 0.90 mM ELP in the presence of additives *.
| Additive | Tt/°C | Solvent Properties of Aqueous Media |
|---|
| Dipolarity/Polarizability, π* | H-Bond Acidity, α | H-Bond Basicity, β |
|---|
| 0.01 M NaPB | 31.6 ± 0.1 | 1.118 ± 0.001 | 1.186 ± 0.001 | 0.594 ± 0.003 |
| 0.01 M NaPB | | 1.104 ± 0.002 | 1.248 ± 0.002 | 0.596 ± 0.002 |
| 0.1 M NaCl | 30.2 ± 0.1 | 1.115 ± 0.003 | 1.198 ± 0.003 | 0.602 ± 0.006 |
| 0.1 M NaCl | | 1.111 ± 0.001 | 1.248 ± 0.001 | 0.597 ± 0.001 |
| 0.05 M Na2SO4 | 26.5 ± 0.1 | 1.114 ± 0.002 | 1.183 ± 0.002 | 0.611 ± 0.007 |
| 0.05 M Na2SO4 | | 1.107 ± 0.002 | 1.248 ± 0.002 | 0.603 ± 0.001 |
| 0.1 M NaClO4 | 33.3 ± 0.1 | 1.120 ± 0.003 | 1.192 ± 0.002 | 0.605 ± 0.005 |
| 0.1 M NaClO4 | | 1.114 ± 0.001 | 1.257 ± 0.001 | 0.597 ± 0.001 |
| 0.1 M NaSCN | 34.9 ± 0.1 | 1.124 ± 0.004 | 1.180 ± 0.003 | 0.604 ± 0.005 |
| 0.1 M NaSCN | | 1.118 ± 0.001 | 1.238 ± 0.002 | 0.597 ± 0.001 |
| 0.5 M sucrose | 27.6 ± 0.1 | 1.140 ± 0.003 | 1.143 ± 0.003 | 0.603 ± 0.002 |
| 0.5 M sucrose | | 1.136 ± 0.002 | 1.192 ± 0.003 | 0.606 ± 0.003 |
| 0.4 M sorbitol | 27.4 ± 0.1 | 1.129 ± 0.007 | 1.174 ± 0.005 | 0.591 ± 0.006 |
| 0.4 M sorbitol | | 1.120 ± 0.002 | 1.241 ± 0.007 | 0.601 ± 0.003 |
| 0.4 M trehalose | 26.2 ± 0.1 | 1.141 ± 0.003 | 1.154 ± 0.003 | 0.608 ± 0.005 |
| 0.4 M trehalose | | 1.127 ± 0.002 | 1.204 ± 0.002 | 0.606 ± 0.003 |
| 0.4 M TMAO | 27.2 ± 0.1 | 1.115 ± 0.004 | 1.187 ± 0.003 | 0.623 ± 0.003 |
| 0.4 M TMAO | | 1.099 ± 0.001 | 1.233 ± 0.003 | 0.638 ± 0.002 |
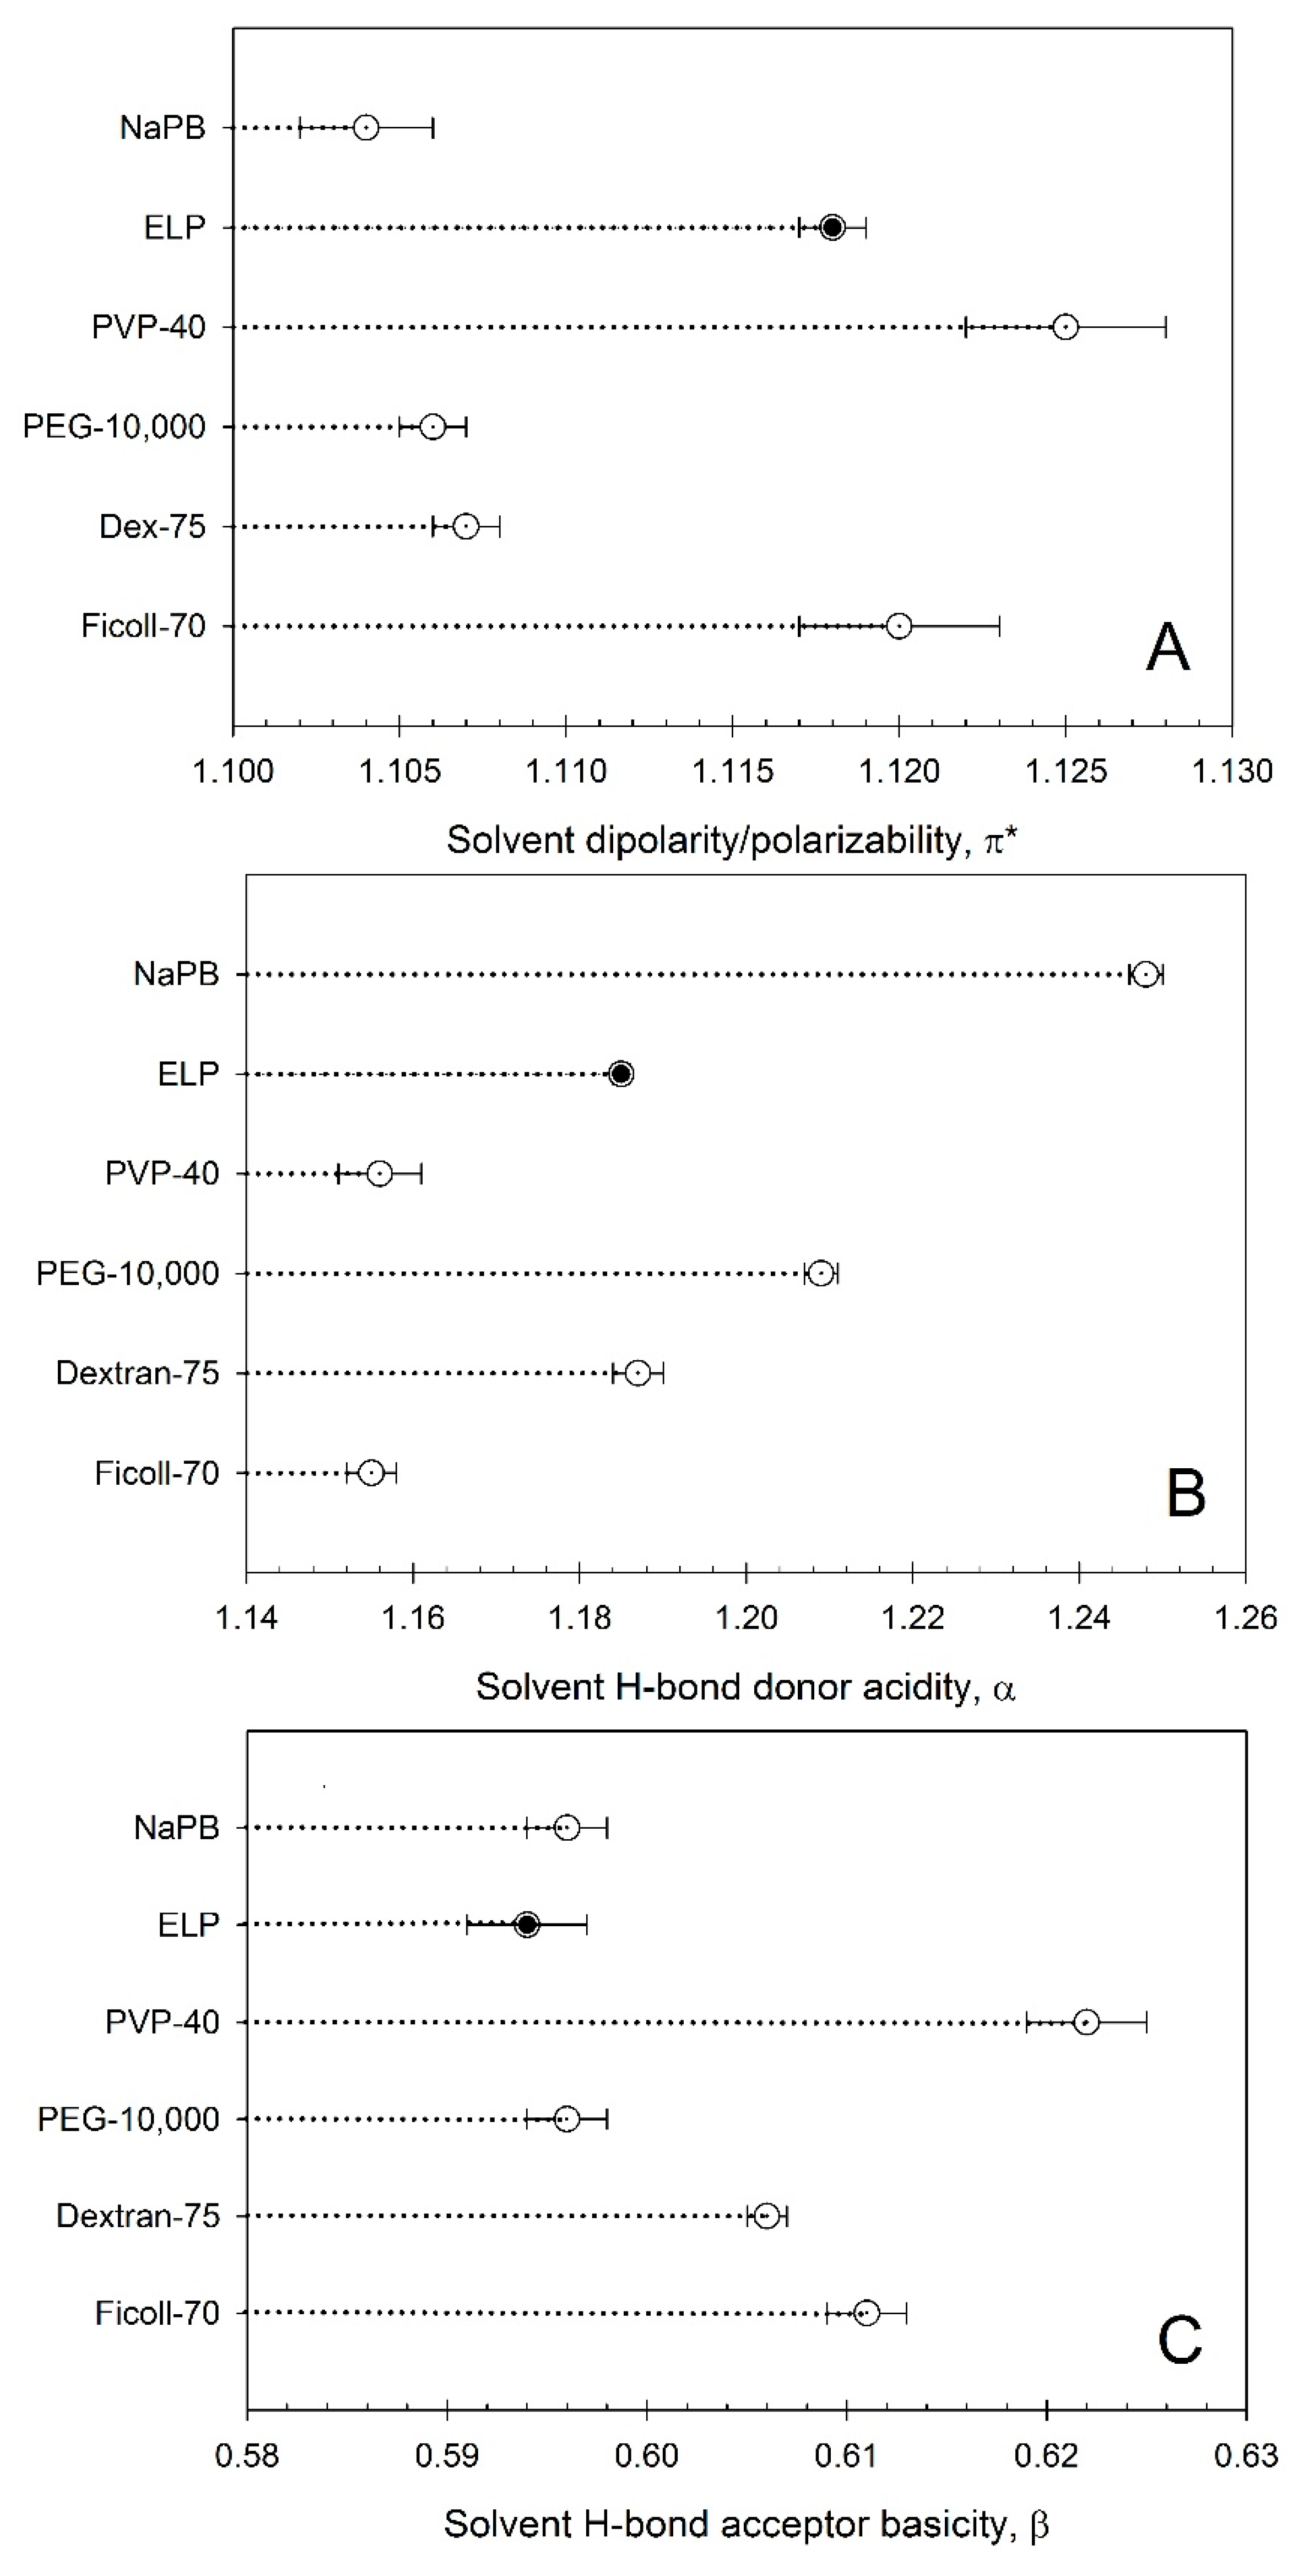
The solvent features of aqueous media for 0.90 mM ELP in 0.01 M NaPB are plotted in
Figure 4A–C. This data is compared to previously reported data [
12] for different non-ionic polymers commonly used as crowding agents at the same concentration.
It can be seen that the solvent’s dipolarity/polarizability values π* (
Figure 4A), characterizing the solvent’s ability to be involved in dipole and dipole/induced dipole interactions with a solute is within the range observed for non-ionic polymers—between those observed for Ficoll-70 and Dextran-75 at the same concentration. The solvent’s HBD acidity values, α, characterizing the solvent’s ability to participate as donor in hydrogen bonding with a solute, is also within the range observed for nonionic polymers—between those observed for Ficoll-70 and Dextran-75 (
Figure 4B). The solvent’s HBA basicity values, β, of aqueous media in the ELP solution, characterizing the solvent’s ability to participate as acceptor in hydrogen bonding with a solute, is very small—close to that observed for PEG-10,000 (
Figure 4C) [
12].
An intricate feature of ELPs (which are repeats of the GVGXaaP pentapeptide), is the ability of these polypeptides to undergo a reversible phase transition from the intrinsically disordered, highly solvated conformation below the inverse transition temperature (
Tt) to a new phase comprised of a dehydrated aggregated polypeptide (referred to as a coacervate) when the temperature is raised above
Tt [
25,
26,
27,
28]. It is well known that the
Tt value of an ELP is a concentration-dependent parameter that is inversely related to its concentration, the number of monomer repeats, and the hydrophobicity of the variable Xaa residue of the pentapeptide repeat [
26,
29,
30,
31].
Figure 4.
Solvent properties of aqueous media in solutions of ELP (GVGVP)40 and nonionic polymers at a 0.90 mM concentration in an aqueous 0.01 M sodium phosphate buffer (NaPB) pH 7.4: (A) dipolarity/polarizability π*; (B) H-bond donor acidity α; and (C) H-bond acceptor basicity β. Ficoll-70—Ficoll with a weight-averaged molecular mass of MW ~ 70,000; dextran-75—dextran with MW ~ 75,000; PEG-10,000—polyethylene glycol with MW ~ 10,000; PVP-40—polyvinylpyrrolidone with MW ~ 40,000; and NaPB—0.01 M sodium phosphate buffer, pH 7.4.
The data obtained here may explain the results reported by Ge
at al. [
32], according to which, the expression of ELP or ELP-GFP fusion protein in
E. coli resulted in the formation of an aqueous two-phase system (ATPS) in the cytoplasm of the cell.
One of the phases appeared to serve as depot for newly formed protein and excluded the cellular proteases [
32]. The formation of such intracellular ATPS may be due to the effects of ELP on the solvent properties of cytoplasmic aqueous media. It should be mentioned, however, that the ELP described in [
32] consisted of 90 repeats of the VPGXaaG pentapeptide, where Xaa was V, A, and G in the ratio 5:2:3. Therefore, the effects of this ELP on the solvent properties of water may differ from those determined in our study.
Besides the aforementioned polypeptide structure related parameters, the
Tt of an ELP can be modulated by changes in the solvent composition. It varies in the presence of different co-solutes in accordance with their stabilizing/destabilizing effects on the temperature-induced coacervate phase of an ELP [
18]. Therefore, the aforementioned co-solute-induced decrease/increase in the
Tt is a reflection of the increased/decreased conformational stability of the coacervate in the presence of a given additive.
In line with these considerations, the phase-transition temperature
Tt for the ELP solution (the ELP used in our study is MGH-(GVGVP)
40-GWP in the presence of different additives (see
Table 1)) changes in the following sequence: 0.4 M trehalose < 0.05 M Na
2SO
4 < 0.4 M TMAO ≤ 0.4 M sorbitol ≤ 0.5 M sucrose < 0.1 M NaCl < 0.01 M NaPB < 0.1 M NaClO
4 < 0.1 M NaSCN;
i.e., it decreases relative to the
Tt for the buffer without additives in the presence of osmolytes, known to stabilize the polypeptide structure, and in the presence of sulfate and chloride; it increases in the presence of perchlorate and thiocyanate known to destabilize the polypeptide structure, in agreement with the data reported by Cremer
et al. [
18,
33]. It should be reemphasized here that the different concentrations of salts and osmolytes additives were used in our study because all the solvatochromic measurements of the solvent properties of aqueous media in ELP solutions were performed at 23 °C, and each additive concentration had to be adjusted for the ELP solution to be below the phase-transition temperature
Tt.
It has been found previously that the yield of protein refolding in the presence of crowding polymers may be described in terms of the dipolarity/polarizability, π
*, and HBD acidity, α, of aqueous media [
12]. Therefore, we explored similar relationships for phase-transition temperature of ELP in the presence of different additives. The HBA basicity, β, is very lightly affected in polymer solutions as well as in ELP solutions, and hence appears not to be an important factor [
12].
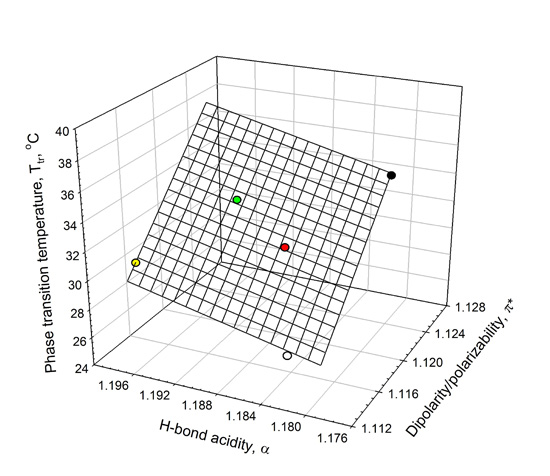
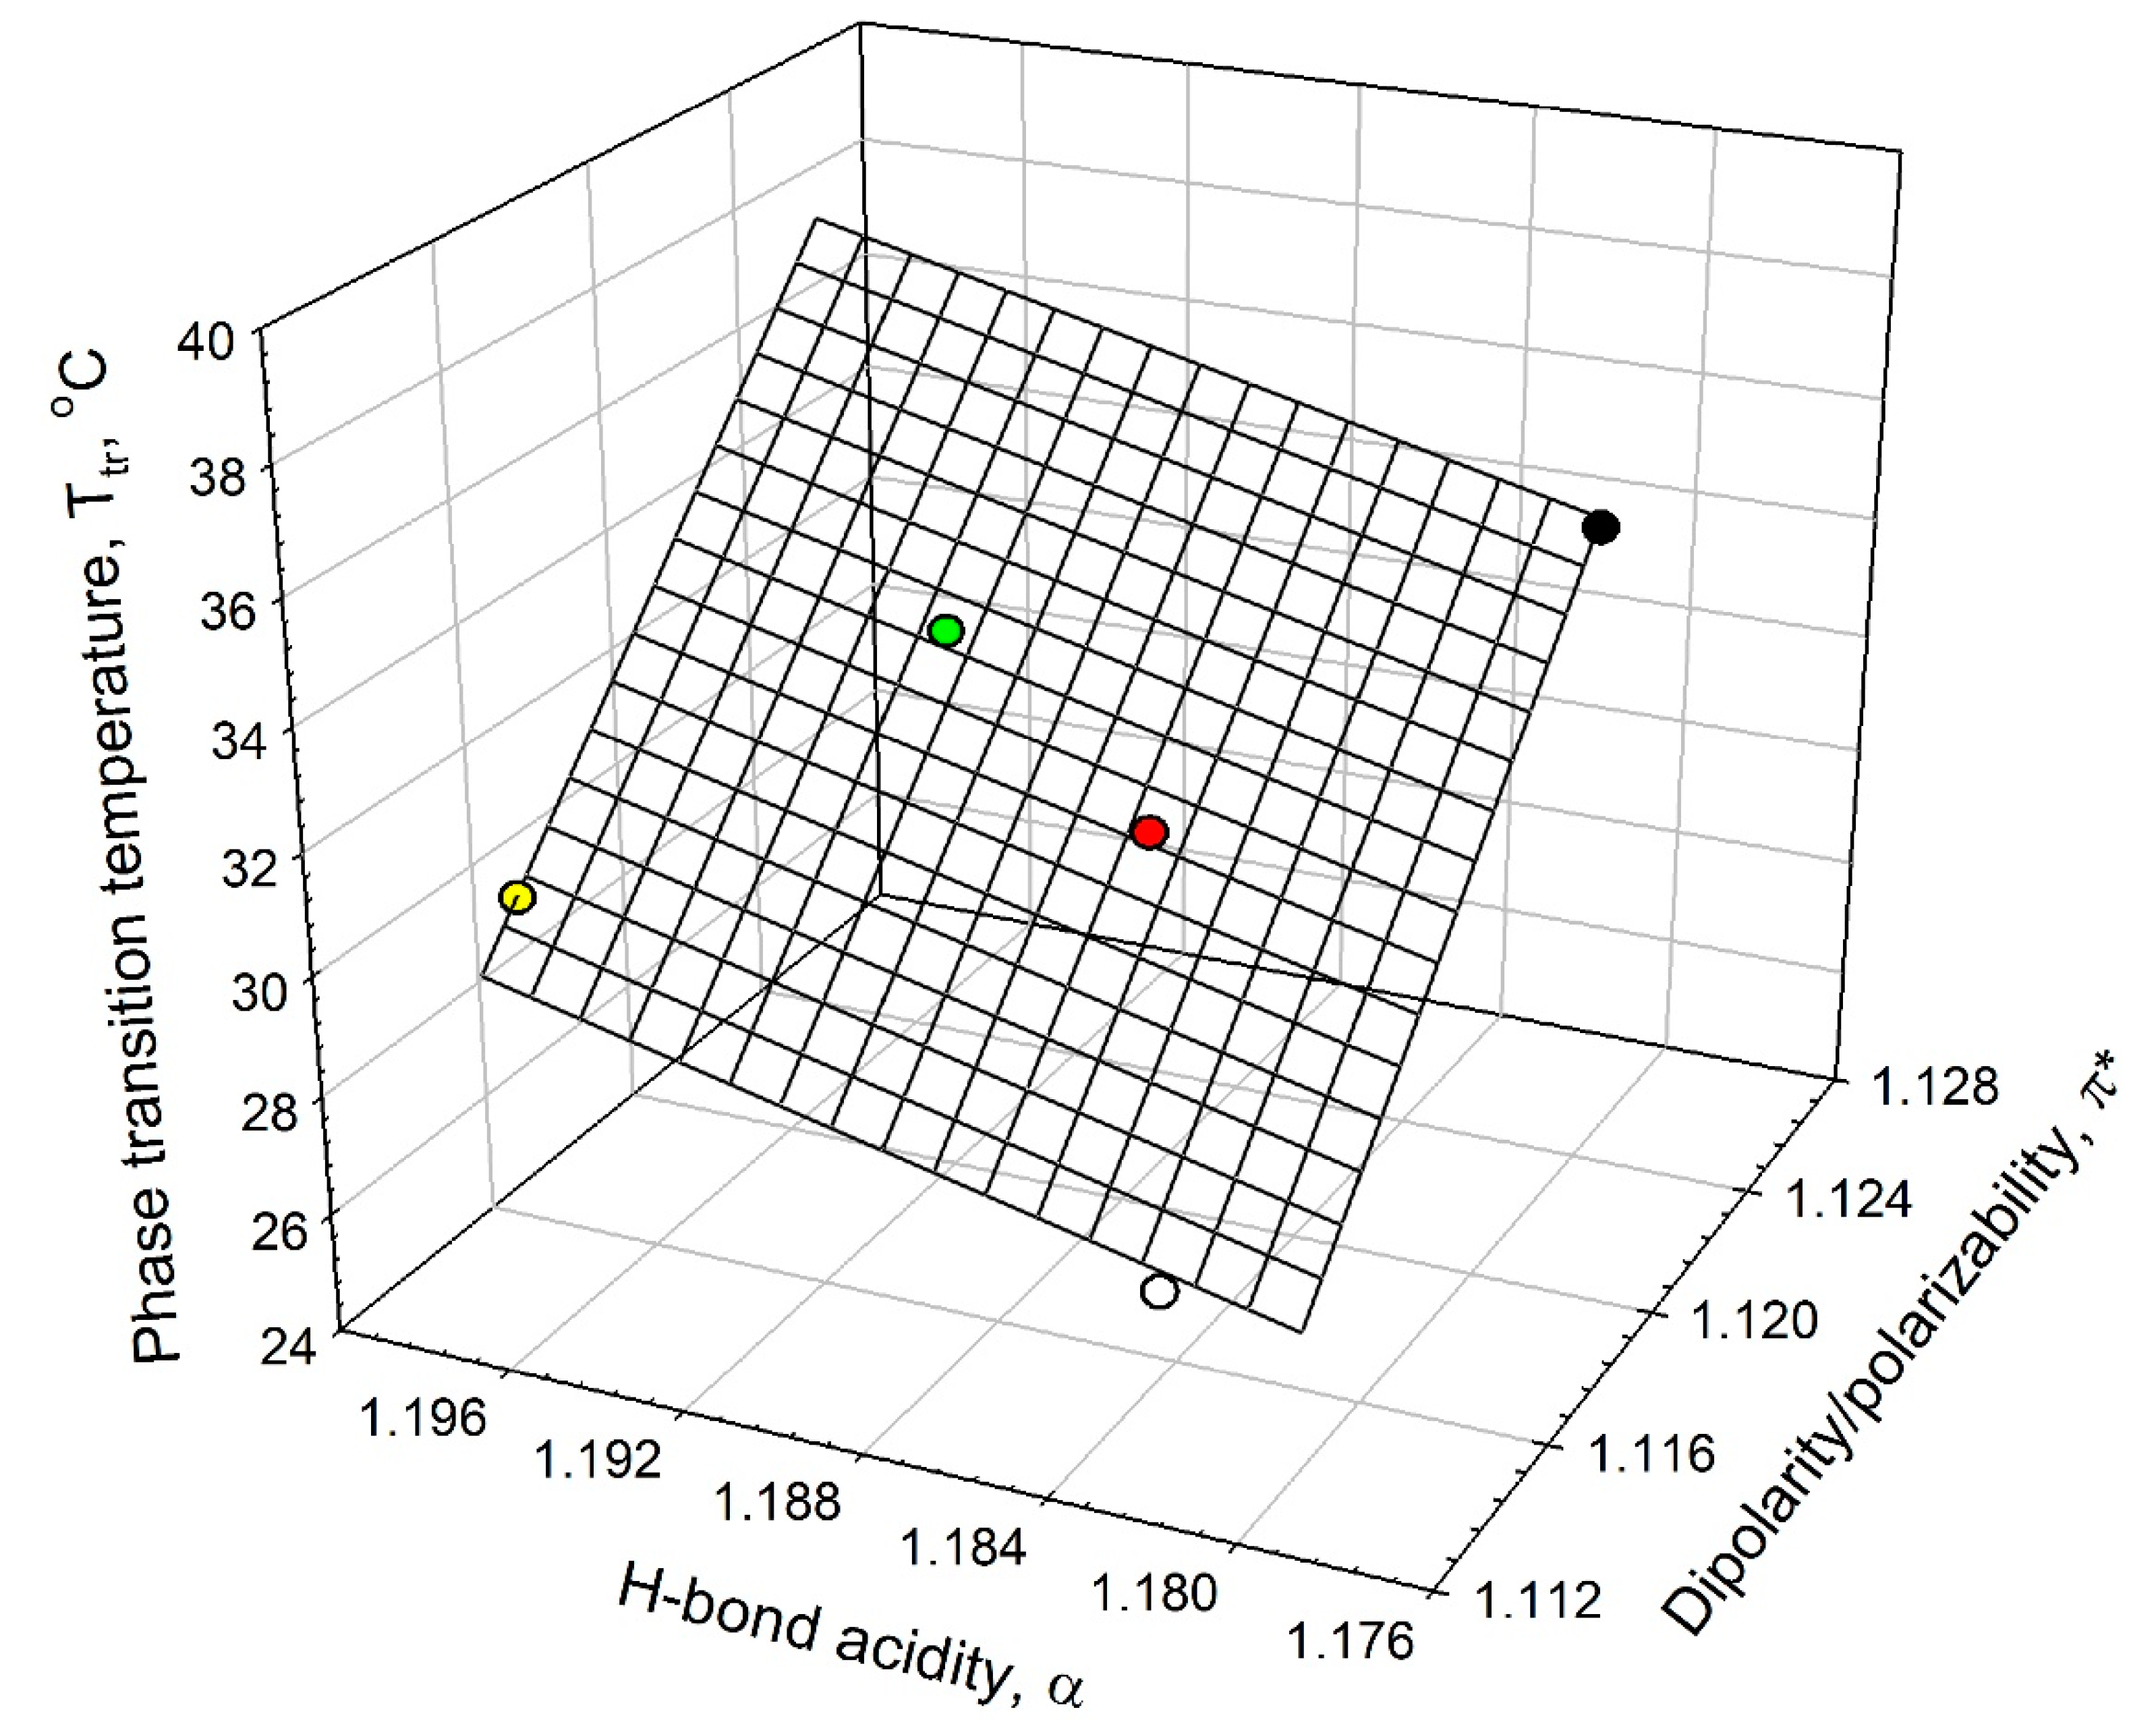
Analysis of the data listed in
Table 1 shows that the ELP phase-transition temperature,
Tt, in salt solutions is linearly related to the solvent’s dipolarity/polarizability, π
*, and HBD acidity, α, as shown graphically in
Figure 5. This linear relationship can be described as in Equation (2):
where π* and α parameters are the solvent’s dipolarity/polarizability and HBD acidity in the aqueous solutions of 0.90 mM ELP in the presence of the additives;
N is the number of additives (NaPB, Na
2SO
4, NaCl, NaClO
4, and NaSCN),
r is the correlation coefficient; SD is the standard deviation; and
F is the ratio of variance. It should be emphasized that the number of the experimental data used in relationship described by Equation (2) is extremely small (
N = 5), and hence the aforementioned relationship cannot be viewed as sufficiently solid and should be considered as a trend and not as a reliable correlation.
Figure 5.
Interrelationship between the phase-transition temperature, Tt, in ELP solutions and the solvent dipolarity/polarizability, π*, and H-bond donor acidity, α, in ELP solutions at 0.90 mM concentration in an aqueous 0.01 M sodium phosphate buffer (NaPB) of pH 7.4 (black circle) in the presence of 0.1 M·NaCl (white circle), 0.05 M Na2SO4 (red circle), 0.1 M NaClO4 (green circle), and 0.1 M·NaSCN (yellow circle) (see Equation (2)).
Further analysis shows that the ELP phase-transition temperature in the presence of non-ionic osmolytes additives can also be described in terms of the same solvent properties as:
where
N is the number of additives (sucrose, sorbitol, TMAO, or trehalose), and all the other parameters are as defined before. It should be stressed that given the small number of experimental data and very limited range of the
Tt values, the relationship described by Equation (3) should be viewed as a trend and not as a reliable correlation. At the moment, it remains unclear why the data for ELP phase transition temperature in 0.01 M phosphate buffer do not fit Equation (3). We are planning to perform additional experiments to better understand mechanisms defining correlations between the ELP phase transition temperatures and solvent properties of ELP solutions in the presence of different additives and to find the factors affecting the reliability and applicability of linear equations for real situations.
It follows from comparison of the relationships described by Equations (2) and (3) that the solvent’s dipolarity/polarizability is the primary solvent property affecting the phase-transition temperature in 0.90 mM ELP solutions in the presence of both salts and nonionic osmolytes additives.
The quantitative differences between the two Equations (2) and (3) are likely due to the different mechanisms of the influence of salts and osmolytes on the ELP phase-transition temperature. According to Zhang and Cremer [
34], these mechanisms may be divided into two categories: direct and indirect effects.
The direct mechanisms are defined by Zhang and Cremer [
34] as those involving hydrogen bonding between co-solute molecules/ions and polypeptide backbone and/or polar and charged side-chains.
Indirect effects are defined as influences of co-solute molecules/ions on the solvation of polypeptide or changes to bulk water properties [
34]. The influence of salt additives are generally viewed as direct [
34], whereas the effects of osmolytes, on the other hand, may be indirect [
34] and are likely realized as changes in the polypeptide solvation via the influence of osmolytes on the interfacial or bulk water properties.
The main conclusion from both Relationships (1) and (2) is that the temperature of phase transitions in the ELP solutions in the presence of different additives is interrelated with the solvent properties of aqueous media in the ELP solutions.
The results obtained in this study clearly raise multiple questions that cannot be answered yet. The most important questions are—is the change in the ELP phase-transition temperature caused by changes in the solvent properties of aqueous media, and what are the molecular mechanisms of the ELP-induced changes in the solvent properties of aqueous media? The important conclusion is that the solvatochromic approach used here is applicable to studying polypeptides and may be feasible for studying some proteins as well. Further studies are clearly needed to answer these questions and they are currently in progress in our laboratories.


 and
and 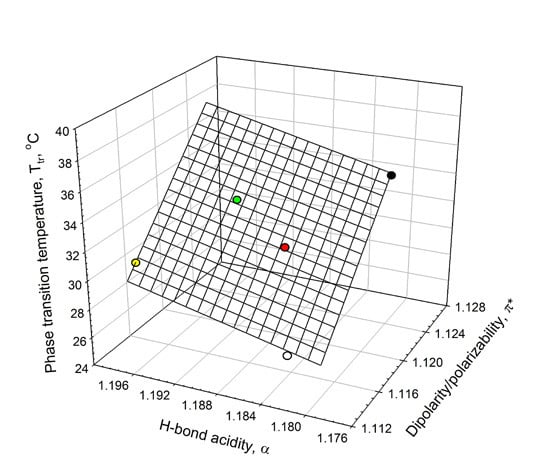


