1. Introduction
Ribosomes of living organisms are essential for protein synthesis, cellular growth, and organismal development. About 50% of all cellular transcription is modulated by ribosomal RNA (rRNA), which accounts for almost 80% of the total RNA in growing cells [
1,
2]. The presence of multiple copies of ribosomal DNA (rDNA) in eukaryotes in tandem units within the nuclear organizer region (NOR) of one or more chromosomes ensures the required level of ribosome supply [
1,
3]. Each rDNA repeat unit consists of coding regions for 18S, 5.8S, and 25S rRNAs, and three spacer sequences including an intergenic spacer (IGS) and two internal transcribed spacers, ITS1 and ITS2 [
4,
5]. The IGS contains the non-transcribed spacer (NTS) and external transcribed spacer (ETS) sequences [
4,
5,
6] and the entire IGS region separates the 25S and 18S rRNA genes in each repeat unit (
Figure 1) [
5].
Together, the IGS represents a complex regulatory unit that includes repeating elements, repetitive enhancer elements, promoters and terminators of transcription, and a conserved secondary structure [
4,
5,
6,
7]. Whereas the coding regions of rDNA are highly conserved, the IGS regions display inter- and intra-specific polymorphism in both sequence and length [
8,
9,
10,
11,
12,
13]. In plants, the length of the IGS region in rDNA varies from 1 kb to more than 12 kb across different species from different genera [
8,
14]. Variability in the IGS region arises primarily from diversity in the numbers of internal sub-repeats arranged in the IGS. These internal sub-repeats, from 30 to 300 bp in length, contain duplicated core promoter in some eukaryotes [
1,
15,
16,
17,
18,
19]. Imbalanced or unequal crossing over within the repetitive sequences is probably responsible for the variation in copy number of the sub-repeats [
17].
The variability in rDNA-IGS creates an opportunity to study interspecific and intraspecific evolutionary divergence [
18]. Experimental evidence has suggested that the repeated elements of IGS might play a role in enhancing transcription in plants [
20,
21,
22] and likely contain the signals for processing of pre-rRNAs [
22,
23,
24]. These repeated elements may be involved in RNA polymerase I-mediated transcription [
22,
25]. The experimental results on the structure and sequence of the IGS also help explain the control of expression of rRNA genes.
The Brassicaceae family is characterized by the diverse nature of its member species and wide variation, even within species, in morphological and phytochemical characteristics. Cabbage (
Brassica oleracea var.
capitata), a subspecies within the Brassicaceae, is an agriculturally and economically important vegetable that is an integral component of the human diet in many countries of the world. Cabbage has a CC-type genome of approximately 648 Mbp in size, with
2n = 18 [
26,
27,
28]. Genetic variation in functional anti-carcinogenic and anti-oxidant components as well as phenotypic variation among the genotypes within the cabbage subspecies are well established in the literature [
29]. The structure of rDNA in
B. oleracea along with the intergenic spacer (IGS) is important for achieving high level signals of transcription and processing of rRNAs. In
B. oleracea, there are two types of IGS, namely 5S IGS and 45S IGS (
Figure 1). The 45S IGS is located in chromosomes C7 and C8 (
Figure 1). The structure of IGS regions has been studied in species and subspecies of the Brassicaceae family [
18,
23,
30,
31,
32,
33,
34]
. The variability in IGS region has not been widely exploited, although it has been used for some analyses. For example, characterization of
Eruca-
Brassica hybrids using DNA probes was possible using rDNA of
E. sativa, which is a wild relative of
Brassica species that exhibits resistance to white rust and drought [
17,
35]. Studies related to IGS length variation have used both DNA gel blot hybridization and PCR. Each of the methods has both advantages and disadvantages; for example, DNA gel blot hybridization uses restriction enzymes and requires a larger amount of DNA initially, whereas PCR primer-based methods cannot amplify a DNA fragments larger than 4 kb but often selectively amplify smaller DNA fragments [
19]. The existing IGS sequence of the
alboglabra subspecies of
B. oleracea in literature is based on DNA gel blot hybridization [
30,
31].
This study aimed to clone and sequence IGSs of cabbage lines by exploiting PCR-based techniques. We examined IGS length variation across a number of cabbage inbred lines and their hybrids to determine the amount of variation in this trait. This study also characterized the functional elements present in the IGSs, as well as their organization and secondary structure, and finally compared them with those of B. oleracea var. alboglabra and other crop plants. To fulfill these objectives, whole-genome sequencing of rDNA was conducted, and 5S and 45S IGS regions were cloned, sequenced and compared with reference gene annotations (45s IGS sequence of B. oleracea var. alboglabra). The variability observed in the 45S IGS was analyzed and the patterns of inheritance were studied in comparatively larger parent-hybrid populations.
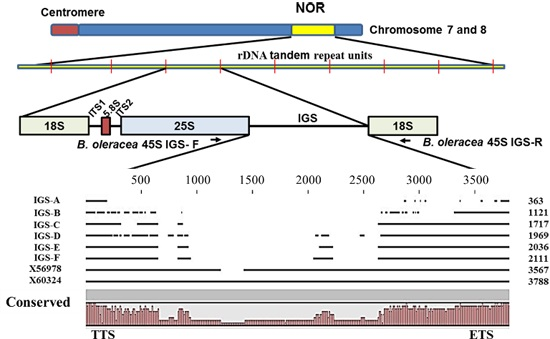
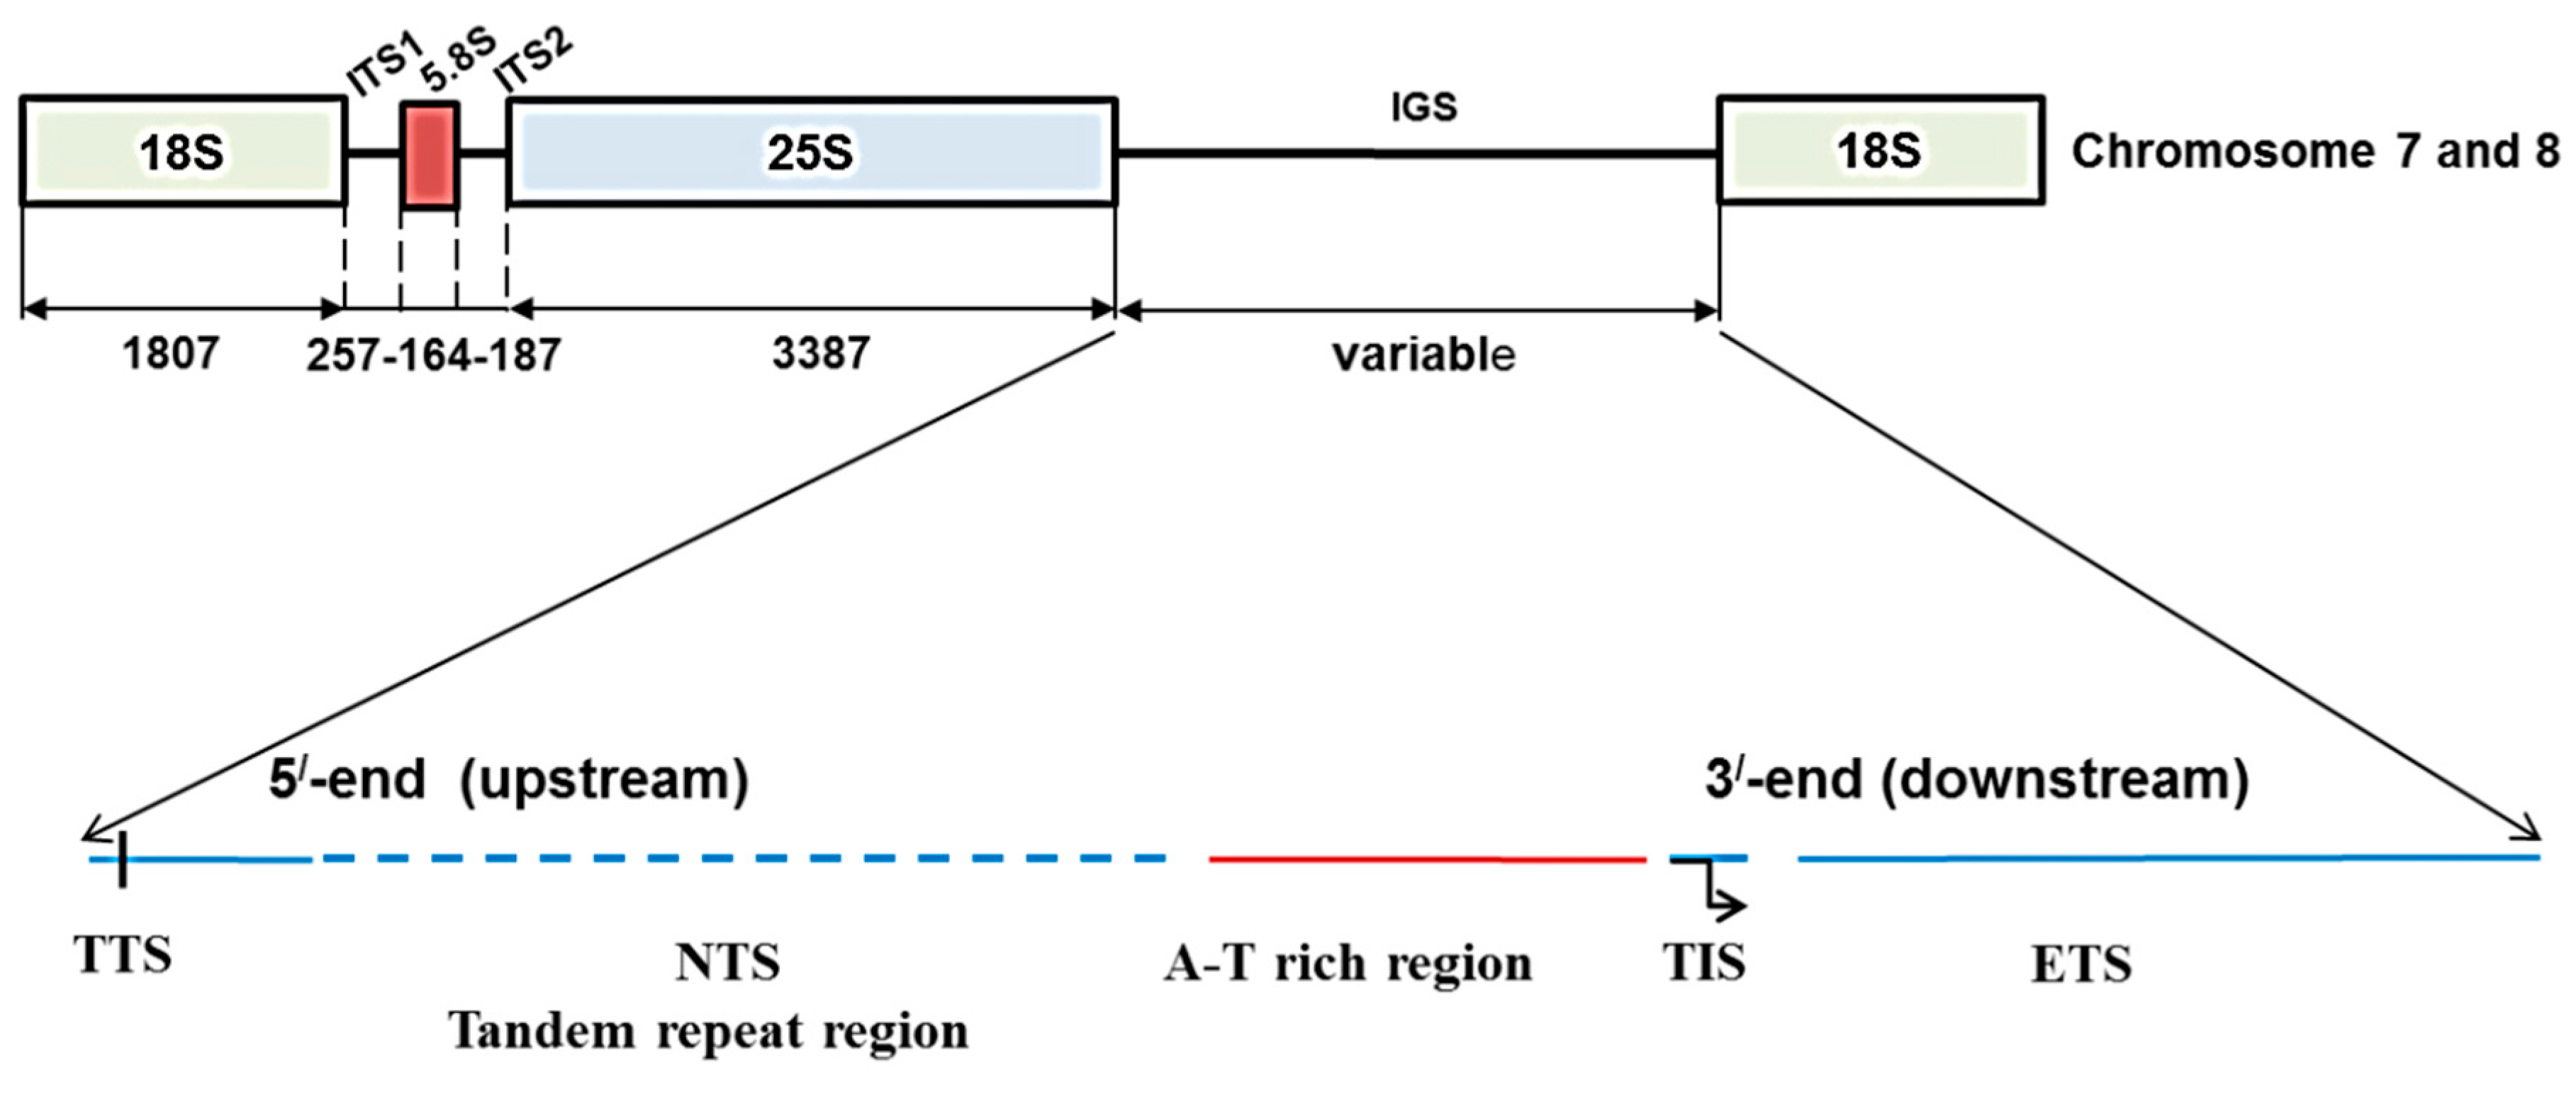
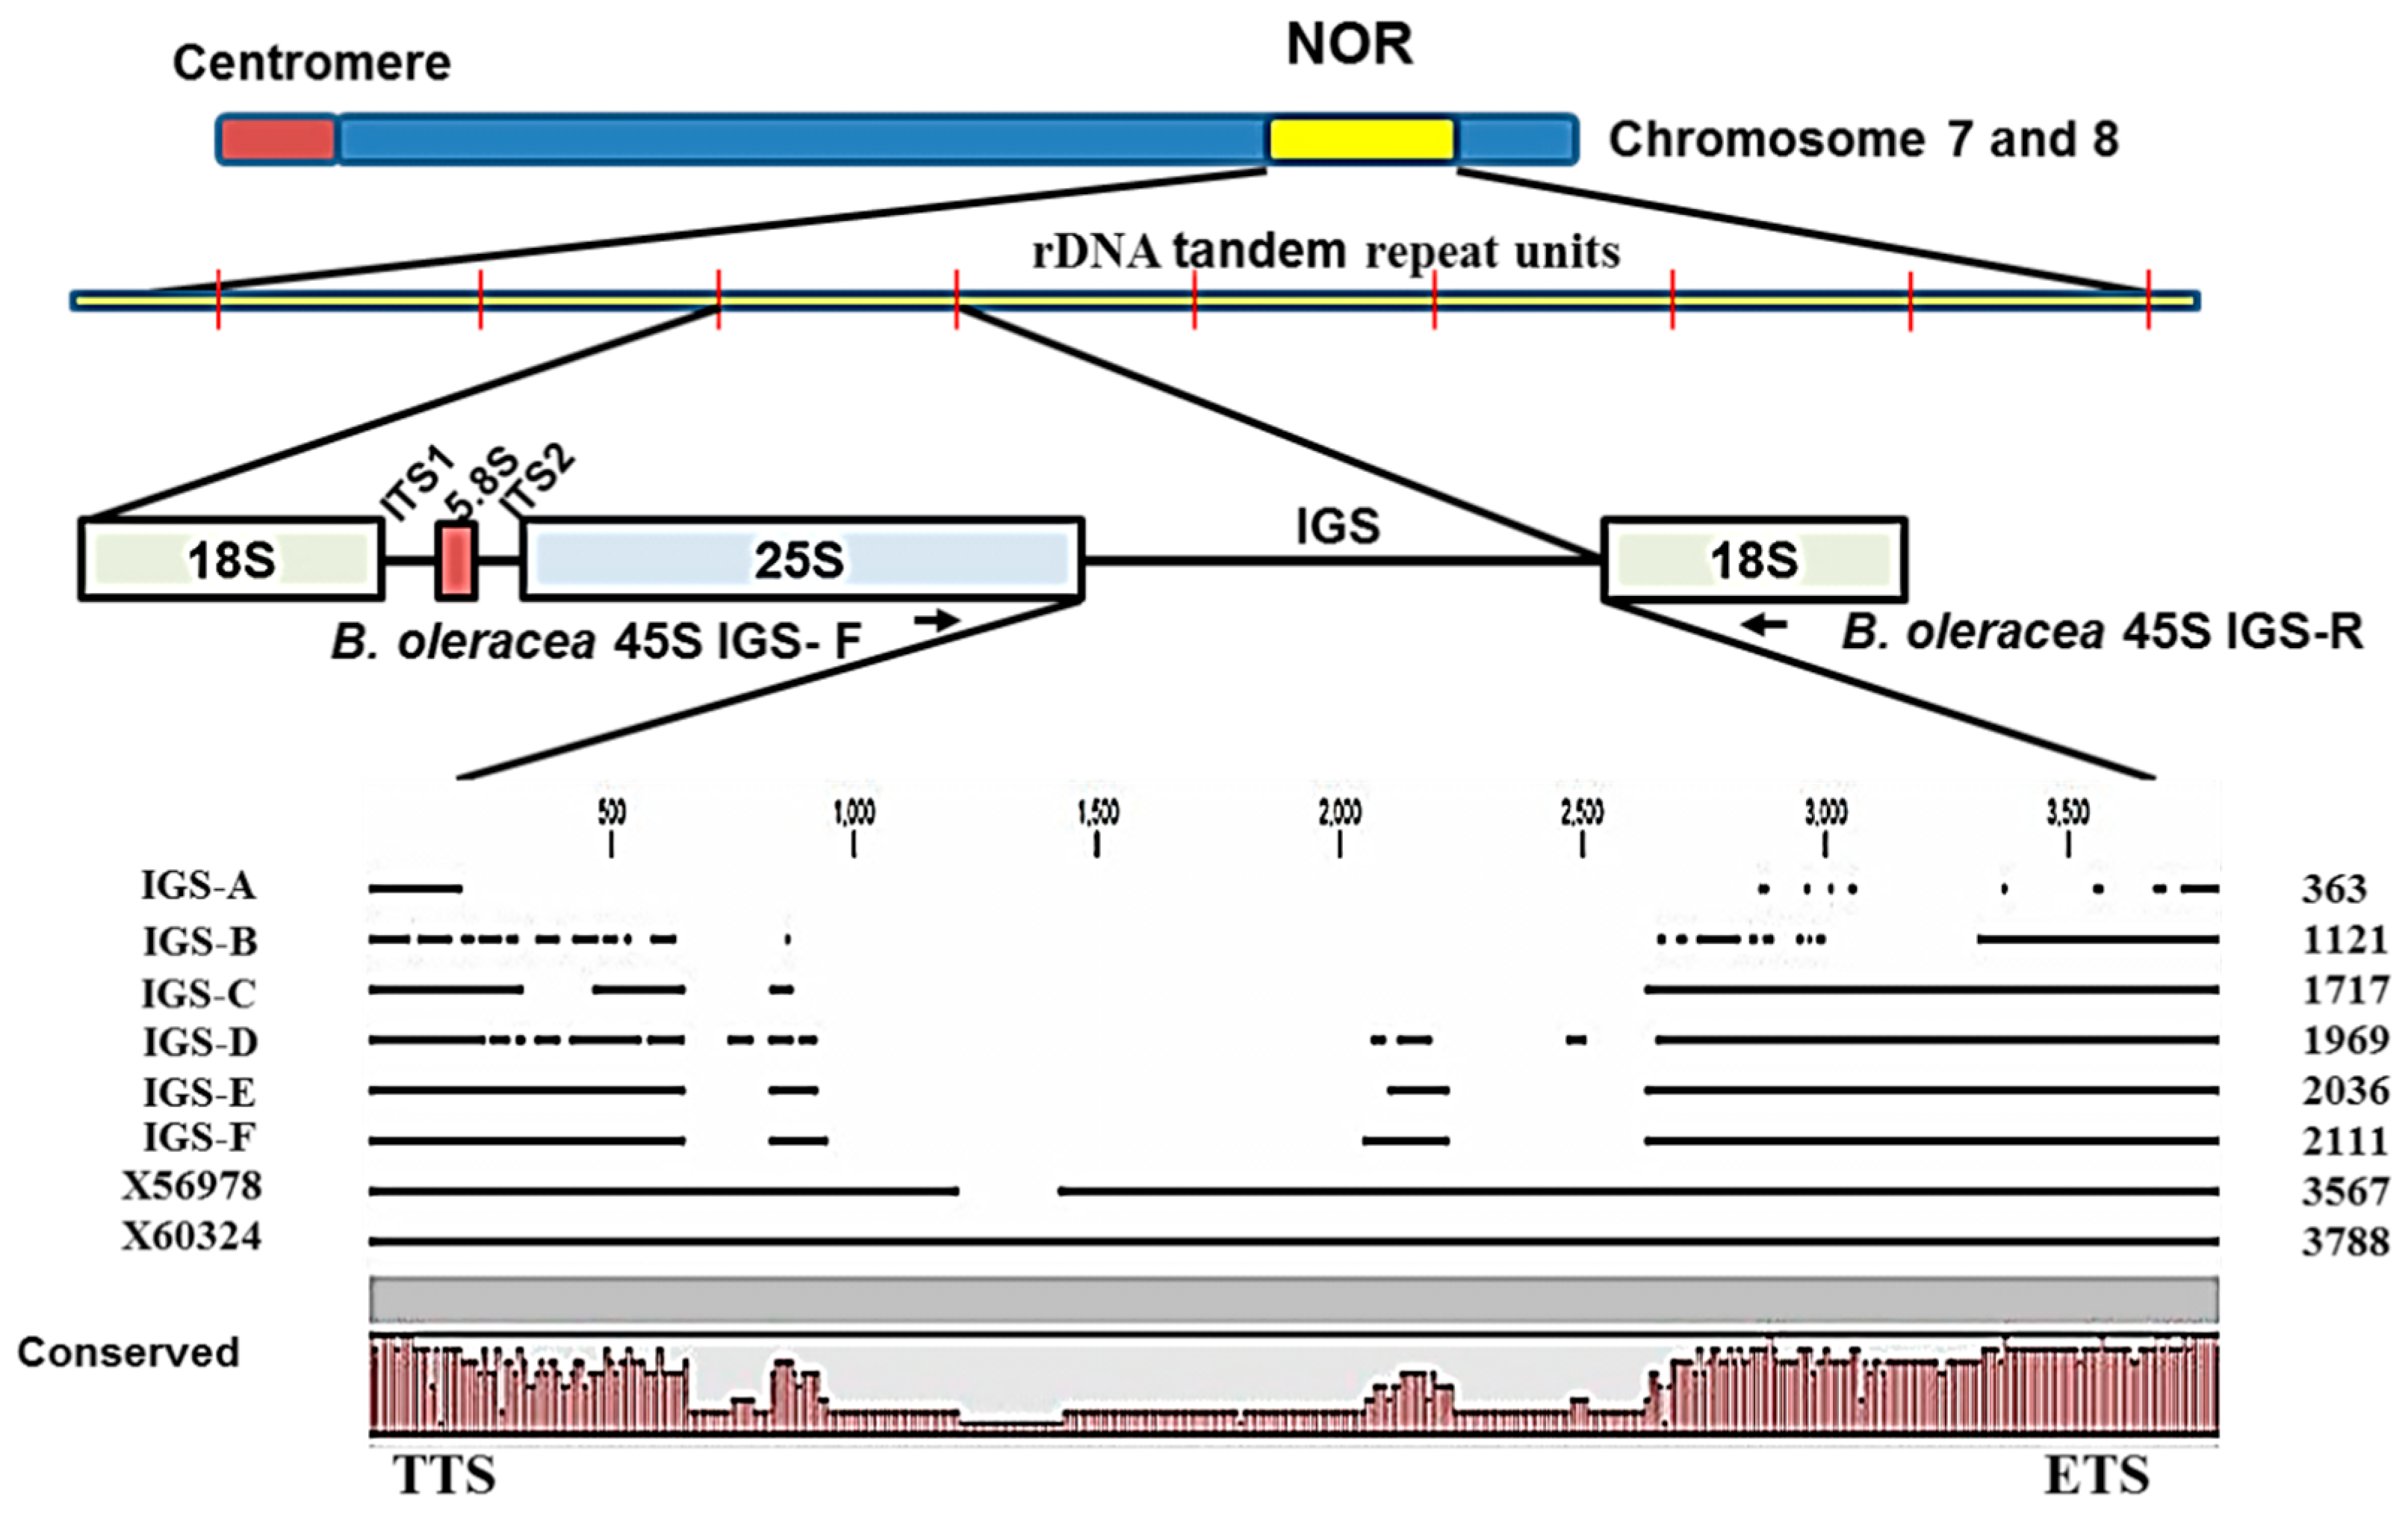
Figure 1.
Ribosomal DNA array and organization of intergenic spacer (IGS) in
Brassica oleracea based on Tremousaygue
et al. [
31] and the present study. Diagram shows position of 45S IGS region in between 25S and 18S rDNA subunits. TTS, transcription termination site; NTS, non-transcribed spacer; TIS, transcription initiation site and ETS, external transcribed spacer.
3. Discussion
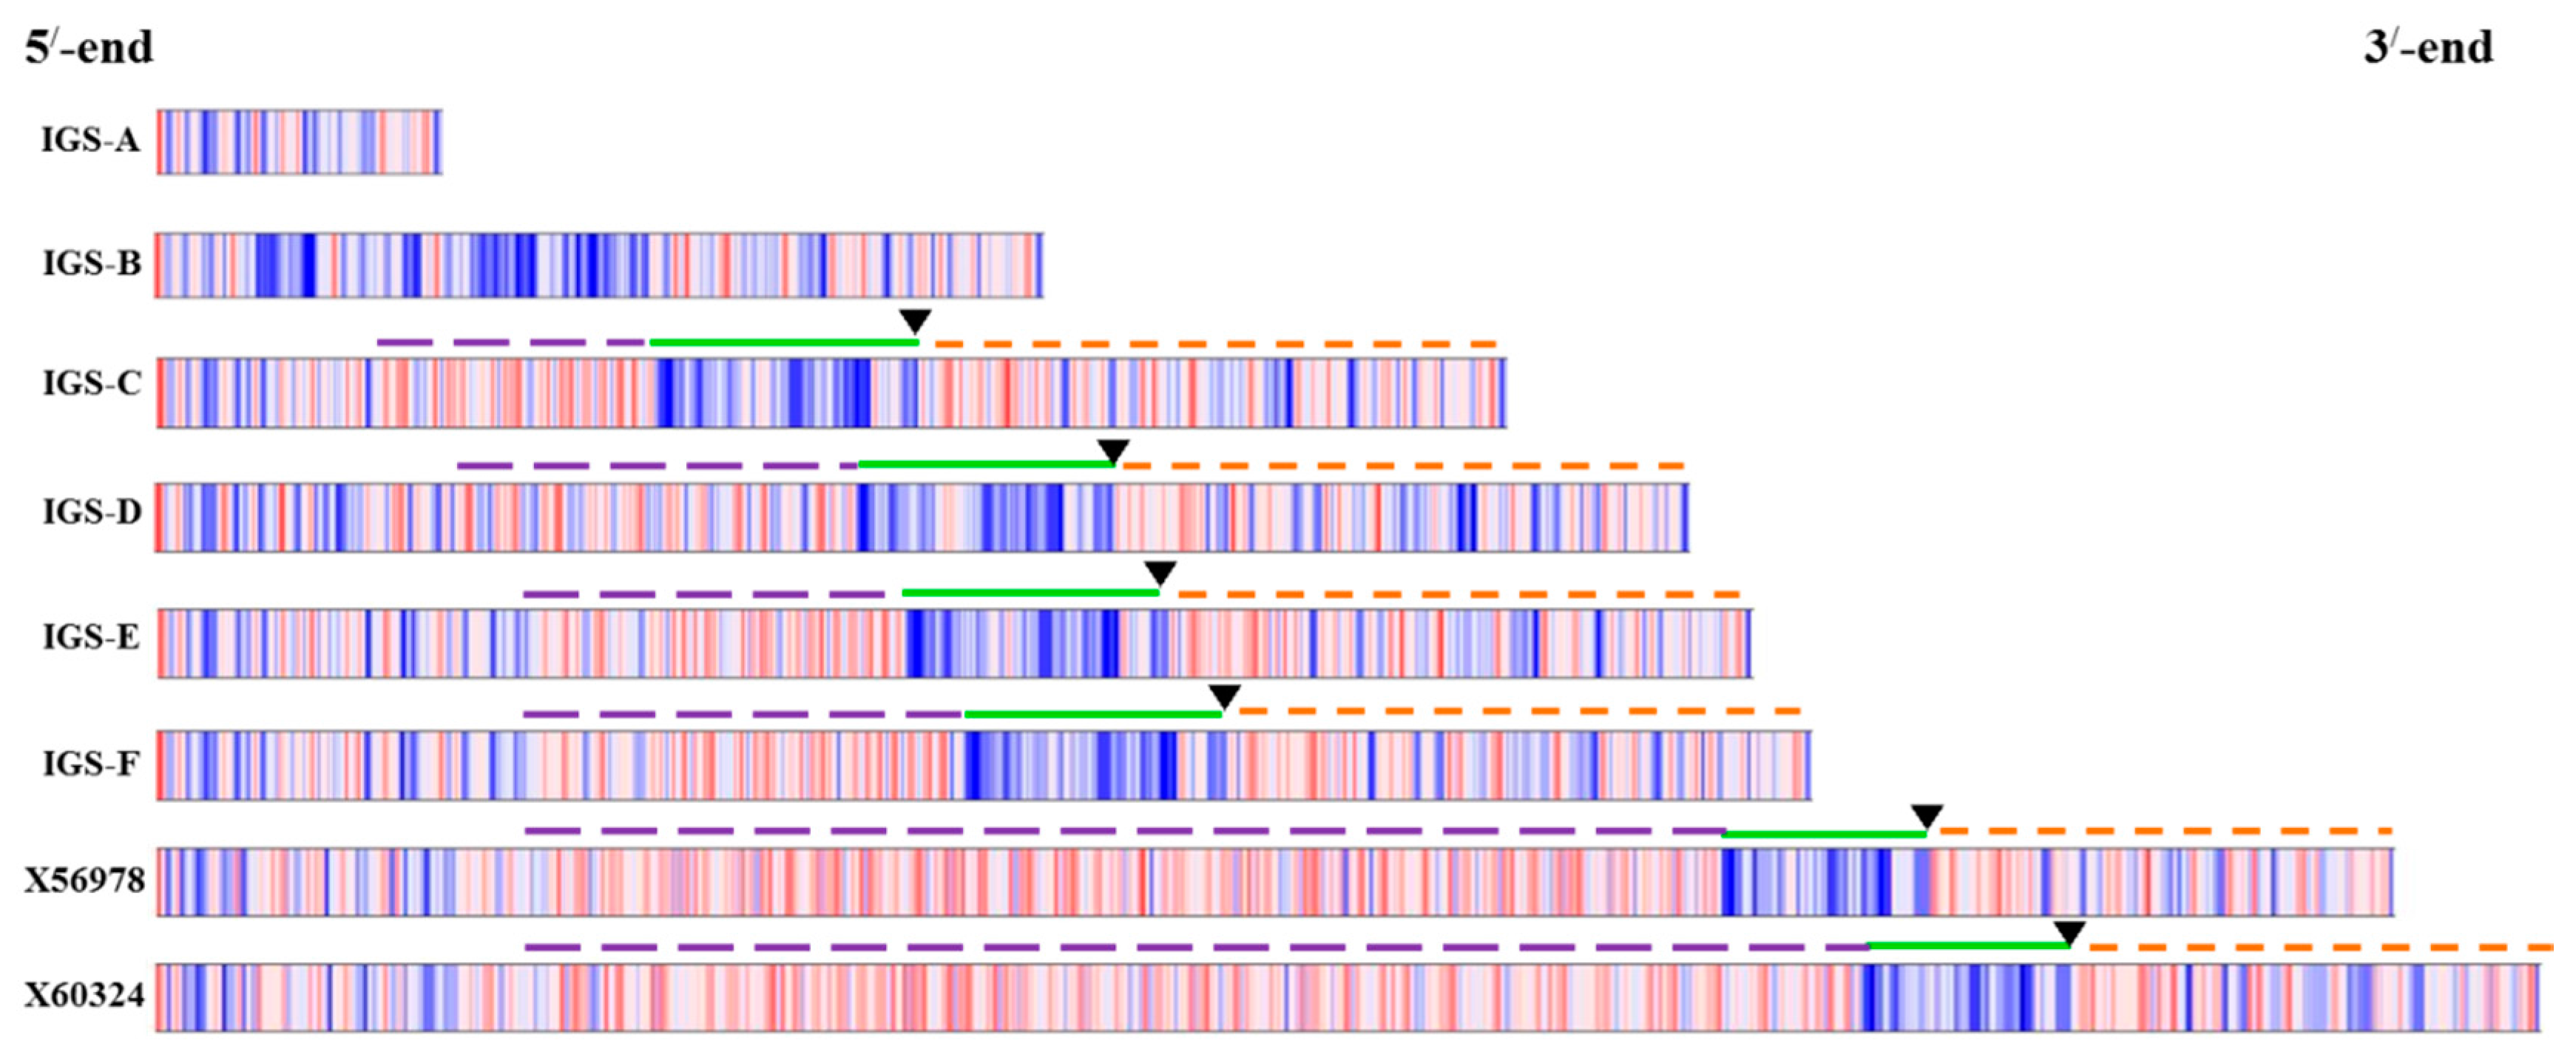
Sequencing of ribosomal spacers involves some difficulties. Firstly, the IGS is a highly folded non- protein-coding region and so is not comparable to commonly used protein or cDNA sequences. Secondly, rDNA units are highly repeated (
Figure 4). Thirdly, the IGS sequence is unusually GC-rich. Moreover, next-generation sequencing can sequence 45S rDNA only by excluding its IGS region. For these reasons, we chose PCR-based cloning and sequencing in this study to determine IGS sequences. Interestingly the lengths of all six types of 45S IGS we identified (
Figure 2 and
Figure 3) were much shorter than the reference sequences GenBank: X56978 [
30] and GenBank: X60324 [
31]. In addition, one or a few more additional IGS other than the six identified are possible those are larger than 3000 bp (
Figure 5). The longest, F-type IGS identified in this study was 1456 bp and 1677 bp shorter than X56978 and X60324, respectively. Both Tremousaygue
et al. [
30] and Bennett and Smith [
31] conducted restriction enzyme-based cloning in
B. oleracea var.
alboglabra, which is dependent on the recognition site whereas our study was based on specifically-designed PCR primers. Therefore, the differences in IGS sequences are probably partly explained by methodical differences and partly by subspecies differences. It is important to note that the restriction enzymes used in those two studies, EcoR1 and BamH1, also digest some portion of 25S and 18S sequence along with 25S-18S IGS. By contrast, one of the disadvantages of PCR primer-based cloning is selective amplification of small DNA fragments. Therefore, further confirmation is required for the existence of the two smallest types we identified, the A and B types, as these two IGS were devoid of any repeated elements, the ETS and the TIS (
Figure 4) even though they had TTS sequence (
Table 2). However, nucleotide comparison through BLAST search with NCBI reference sequence confirmed 98% identity for both A and B types compared with reference X60324 of
B. oleracea var.
alboglabra [
31]. It is possible that these two IGSs were subject to large deletions at their downstream end during evolution.
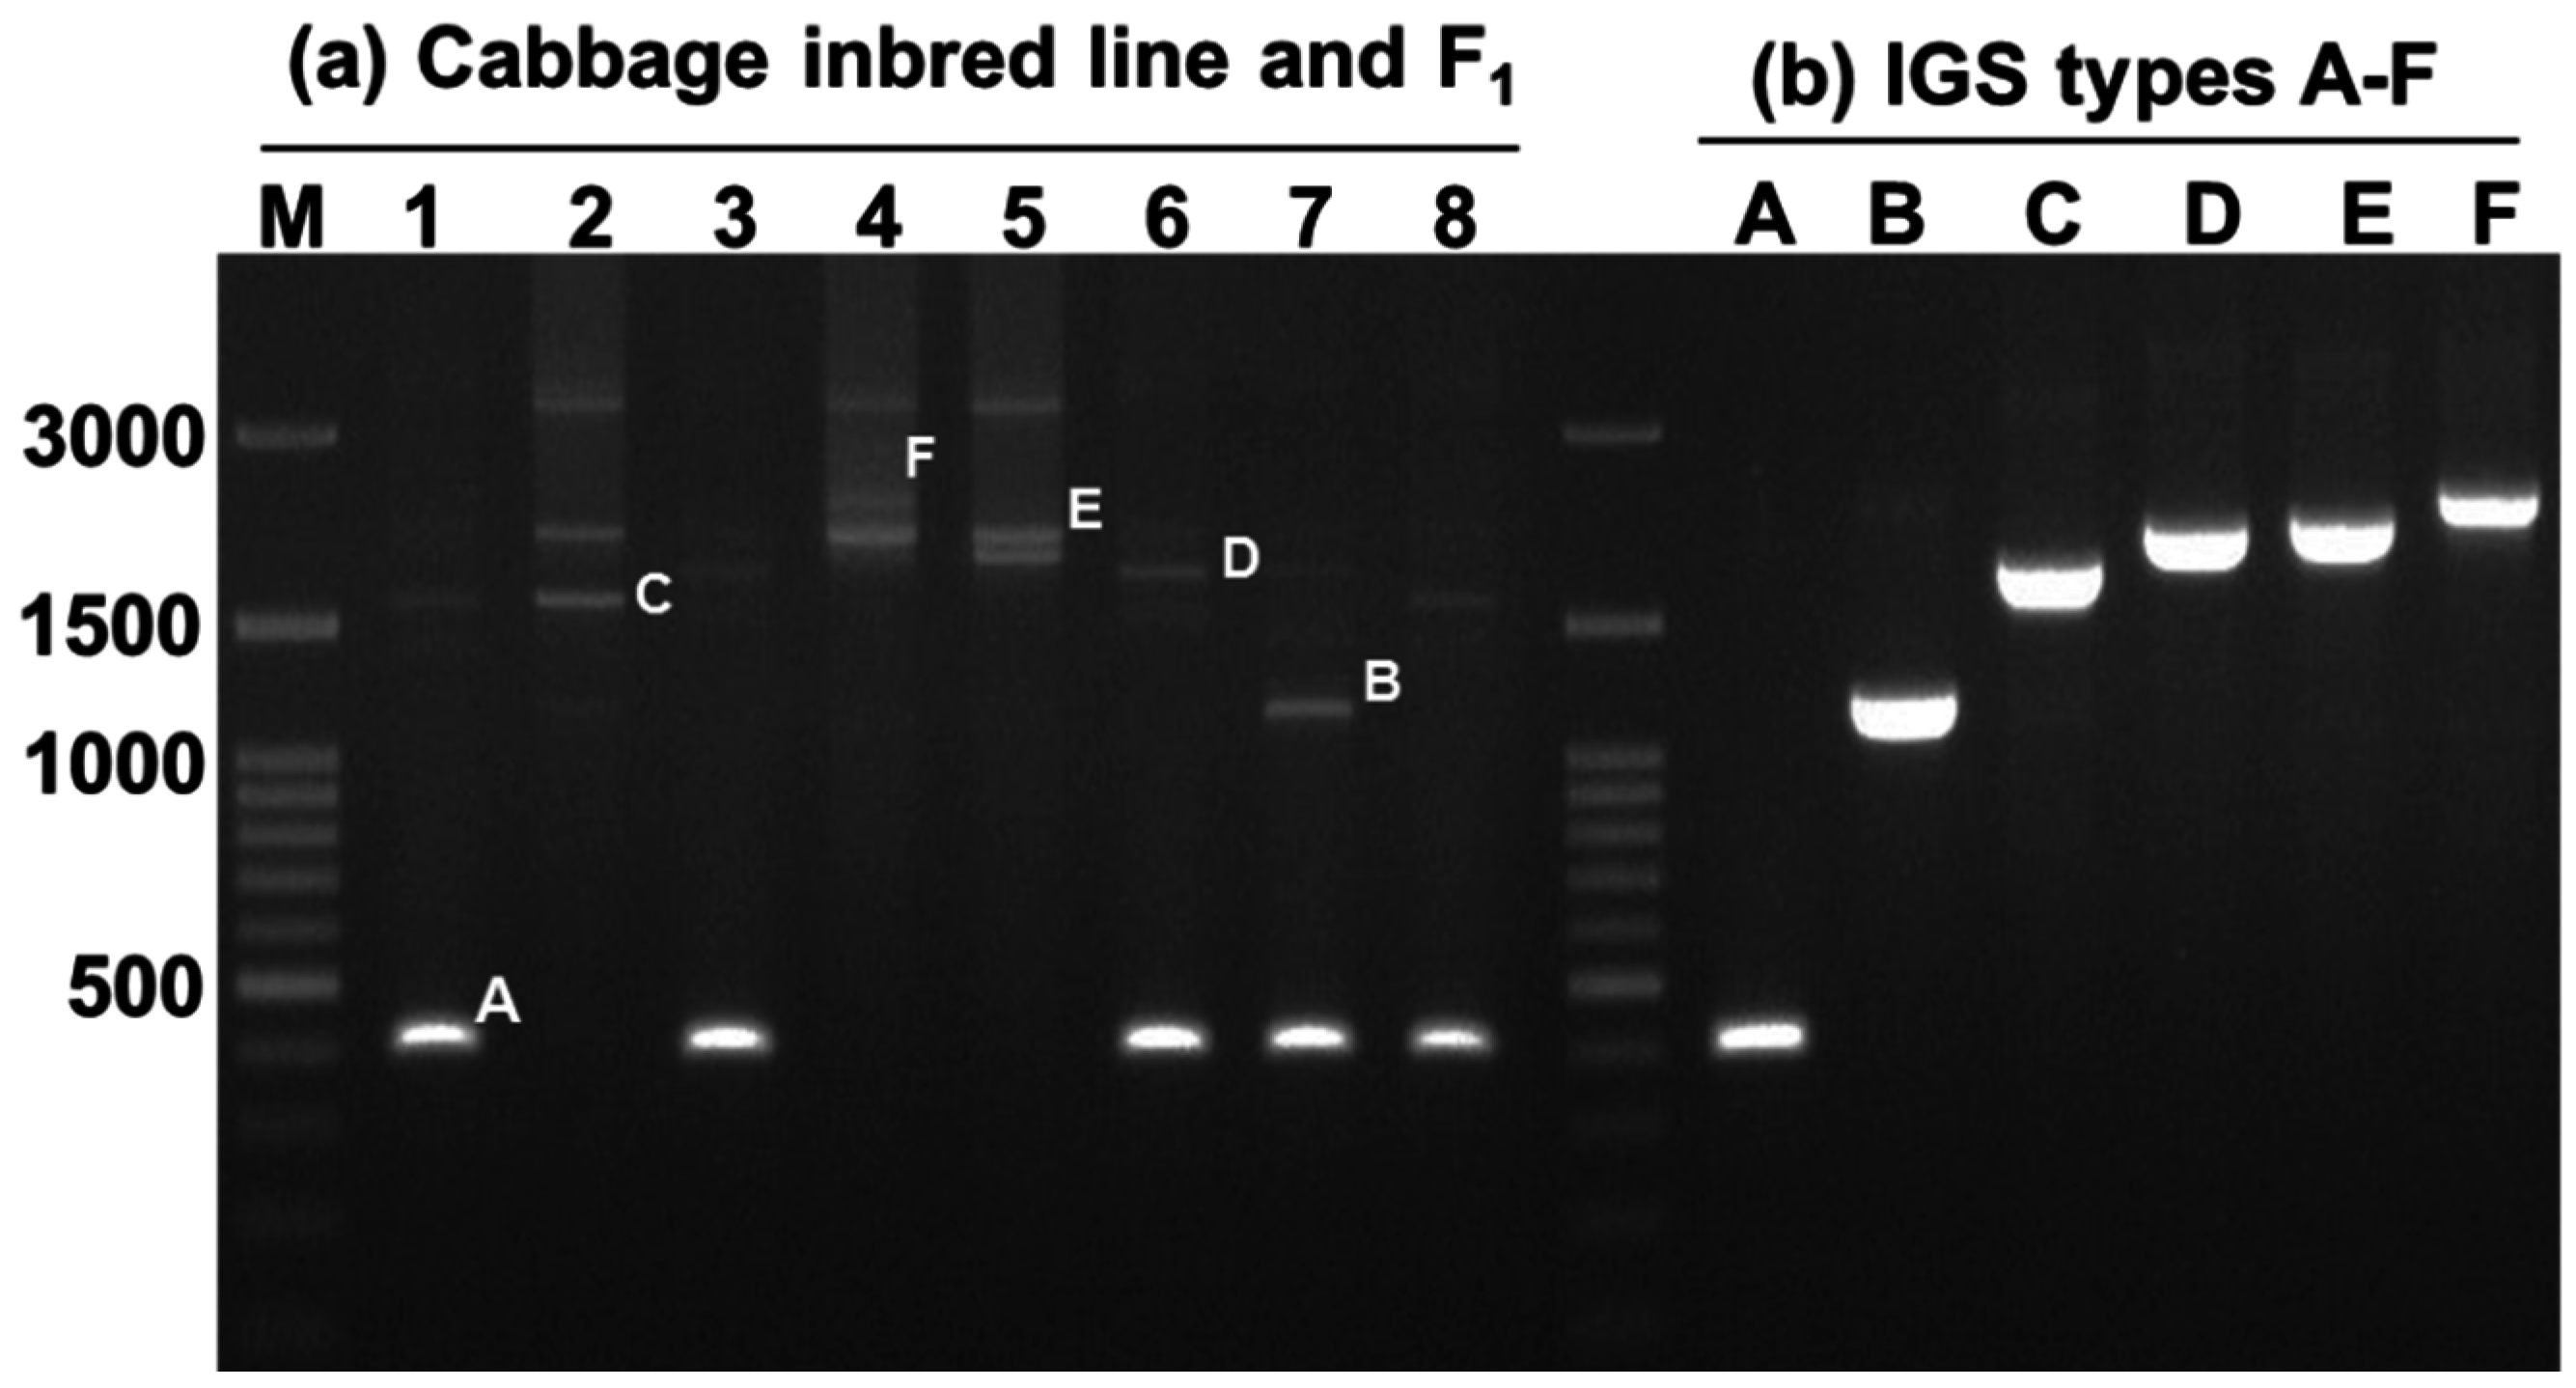
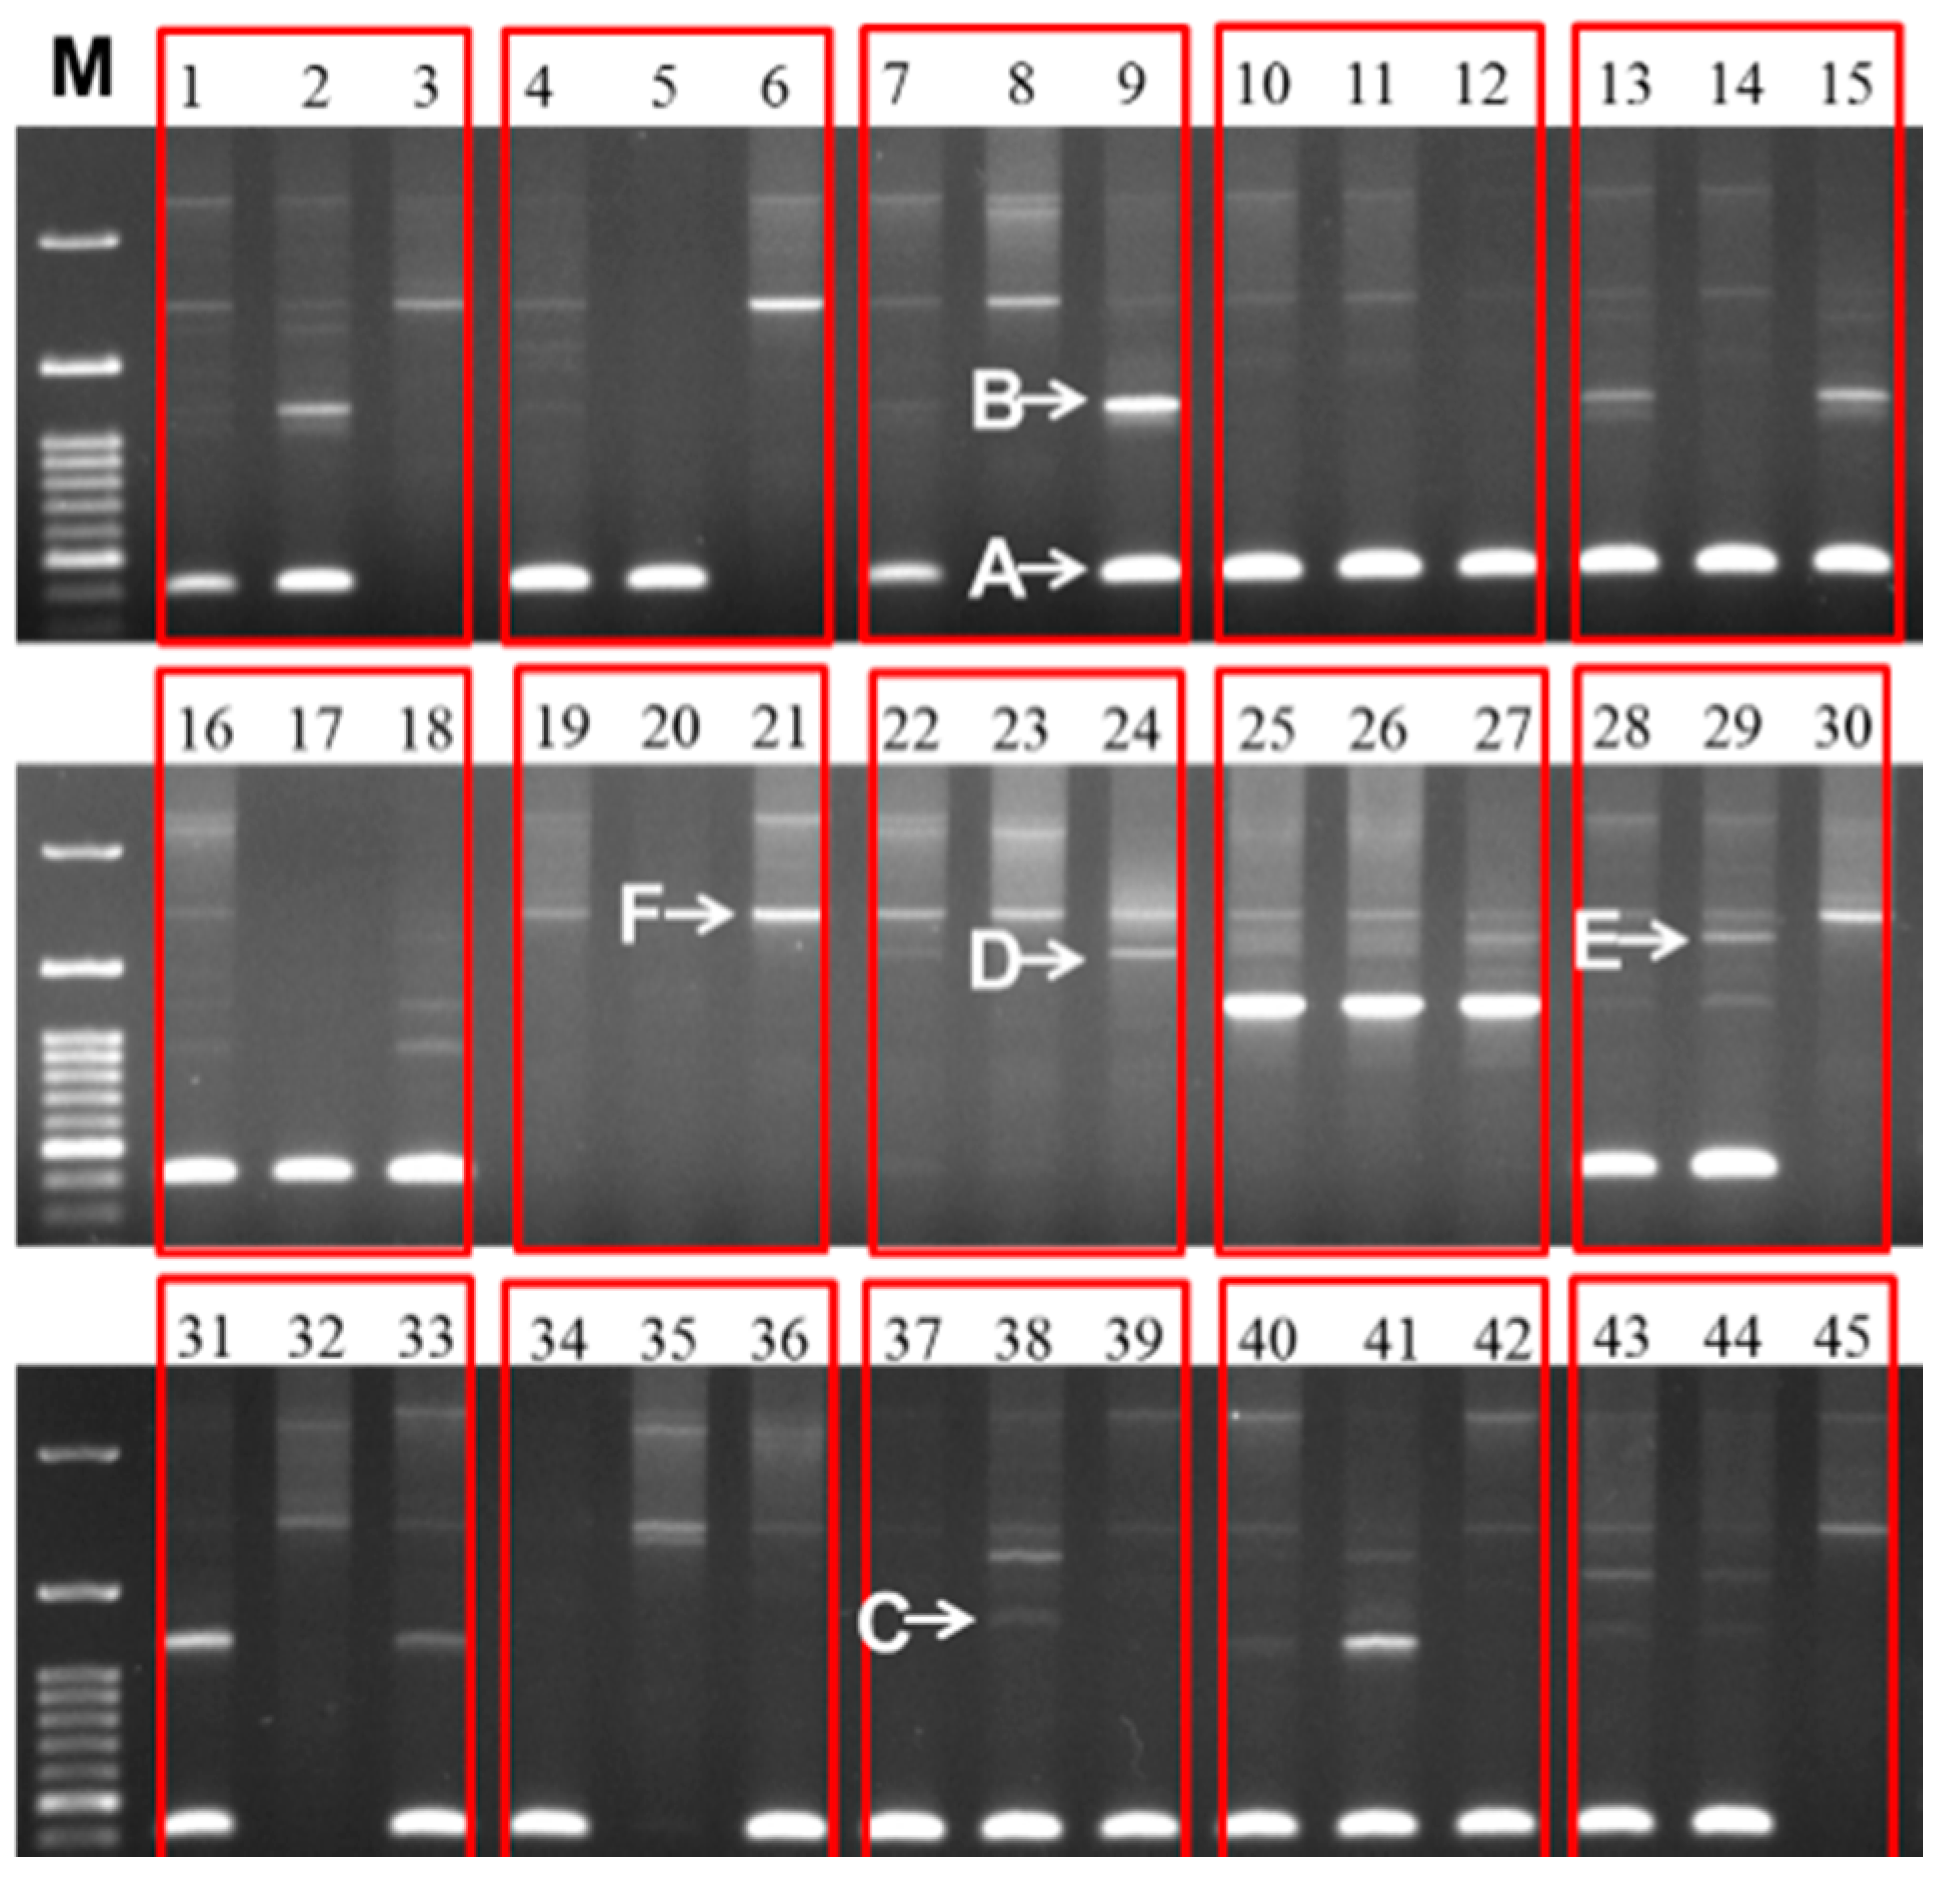
Figure 5.
Different sizes of 45S (25S-18S) IGS sequences observed in 30 inbred lines of cabbage and their 15 F
1 progeny. The line numbers correspond to those in
Table 3C. Within each red box the first, second, and third lanes represent F
1, female parent, and male parent, respectively. M, 100 bp ladder.
Sequences of IGS regions are also difficult to elucidate because as one individual cell may retain more than one type of IGS (
Figure 2 and
Figure 5). Tremousaygue
et al. [
31] published an updated sequence of the IGS region of
B. oleracea var.
alboglabra after Bennett and Smith [
30] which is 206 bp longer. That variation is explained by the different digestion sites of EcoR1 used by [
31] and BamH1 used by [
30]. However, Tremousaygue
et al. [
31] marked internal sequence variation in sequence with that of Bennett and Smith [
30] as errors associated with reading errors. In our study, several PCR conditions have been tested and obtained similar bands. The other way to confirm the size of the IGS is to digest total DNA with a restriction enzyme which does not cut within the IGS and to hybridize with the appropriate probe. Such an experiment would further validate the size of the IGS and would confirm its variability.
Intra-specific length and sequence heterogeneity among different types of IGS, sometimes even within an individual plant, as observed in our study (
Figure 2 and
Figure 3) is a common feature of IGSs in almost all plant species studied. Heterogeneity of IGS in Brassicaceae family was first reported in
Arabidopsis [
36,
37]. During evolutionary development of species, any insertion or deletion of AT-rich or GC-rich sequences in the tandem repeat region may also accelerate the length heterogeneity. Other probable causes are deletions, possibly reflected in the A- and B-type IGSs of our study, or duplications of the sub-repeat regions [
38,
39,
40] or of the ETS [
41,
42], and duplications of the promoter region [
32,
39]. The 5
’ETS length observed in this study was consistent with those reported for
B. oleracea alboglabra and
Raphanus sativa [
43], while widely variable ETS lengths were recorded in other plant species, for example, 5.8 kb in
Medicago [
44], 1227 to 1735 bp in
Oryza [
45], 1155 to 2226 bp in
Vigna [
25] and 529 to 823 bp in
Zea [
46].
The length and occurrence of sub-repeats is another source of variation in IGS sequences (
Table S3,
Figure S3). The length of the repeat elements in our study ranged between 12 to 74 bp in C- to F-type IGSs (
Table 2). In some other plant species, the repeat region is much longer, for instance, 130 bp in wheat [
47], 200 bp in maize [
16], 325 bp in
Vicia faba [
15], and 460 bp in carrot [
48]. In potato, the length of sub-repeats ranged between 20 and 56 bp [
49]. Similar to
E. sativa [
17],
Arabidopsis [
32], and
Sisymbrium irio [
50], we found repeat families downstream of the putative TTS in cabbage (
Figure 4).
The presence of a TATA box in the core promoter of TIS was the characteristic feature of
B. oleracea var.
capitata 45S IGS (
Table 2), similar to those of
B. oleracea var.
alboglabra [
30,
31] and
Medicago [
43,
51]. In the C–F types of IGS, the presence of motifs and domains putatively associated with initiation and termination of rRNA transcription and the presence of rDNA promoters, promoter/enhancer elements and TATA box involved in the transcription by RNA polymerase I, indicated that the structural variants of IGS possess the necessary regulatory elements to be functional [
1,
20,
25,
32,
39,
45,
52,
53,
54]. In addition, the identical sequence of TIS for most of the identified IGS indicated that this sequence is generally conserved (
Table 2).
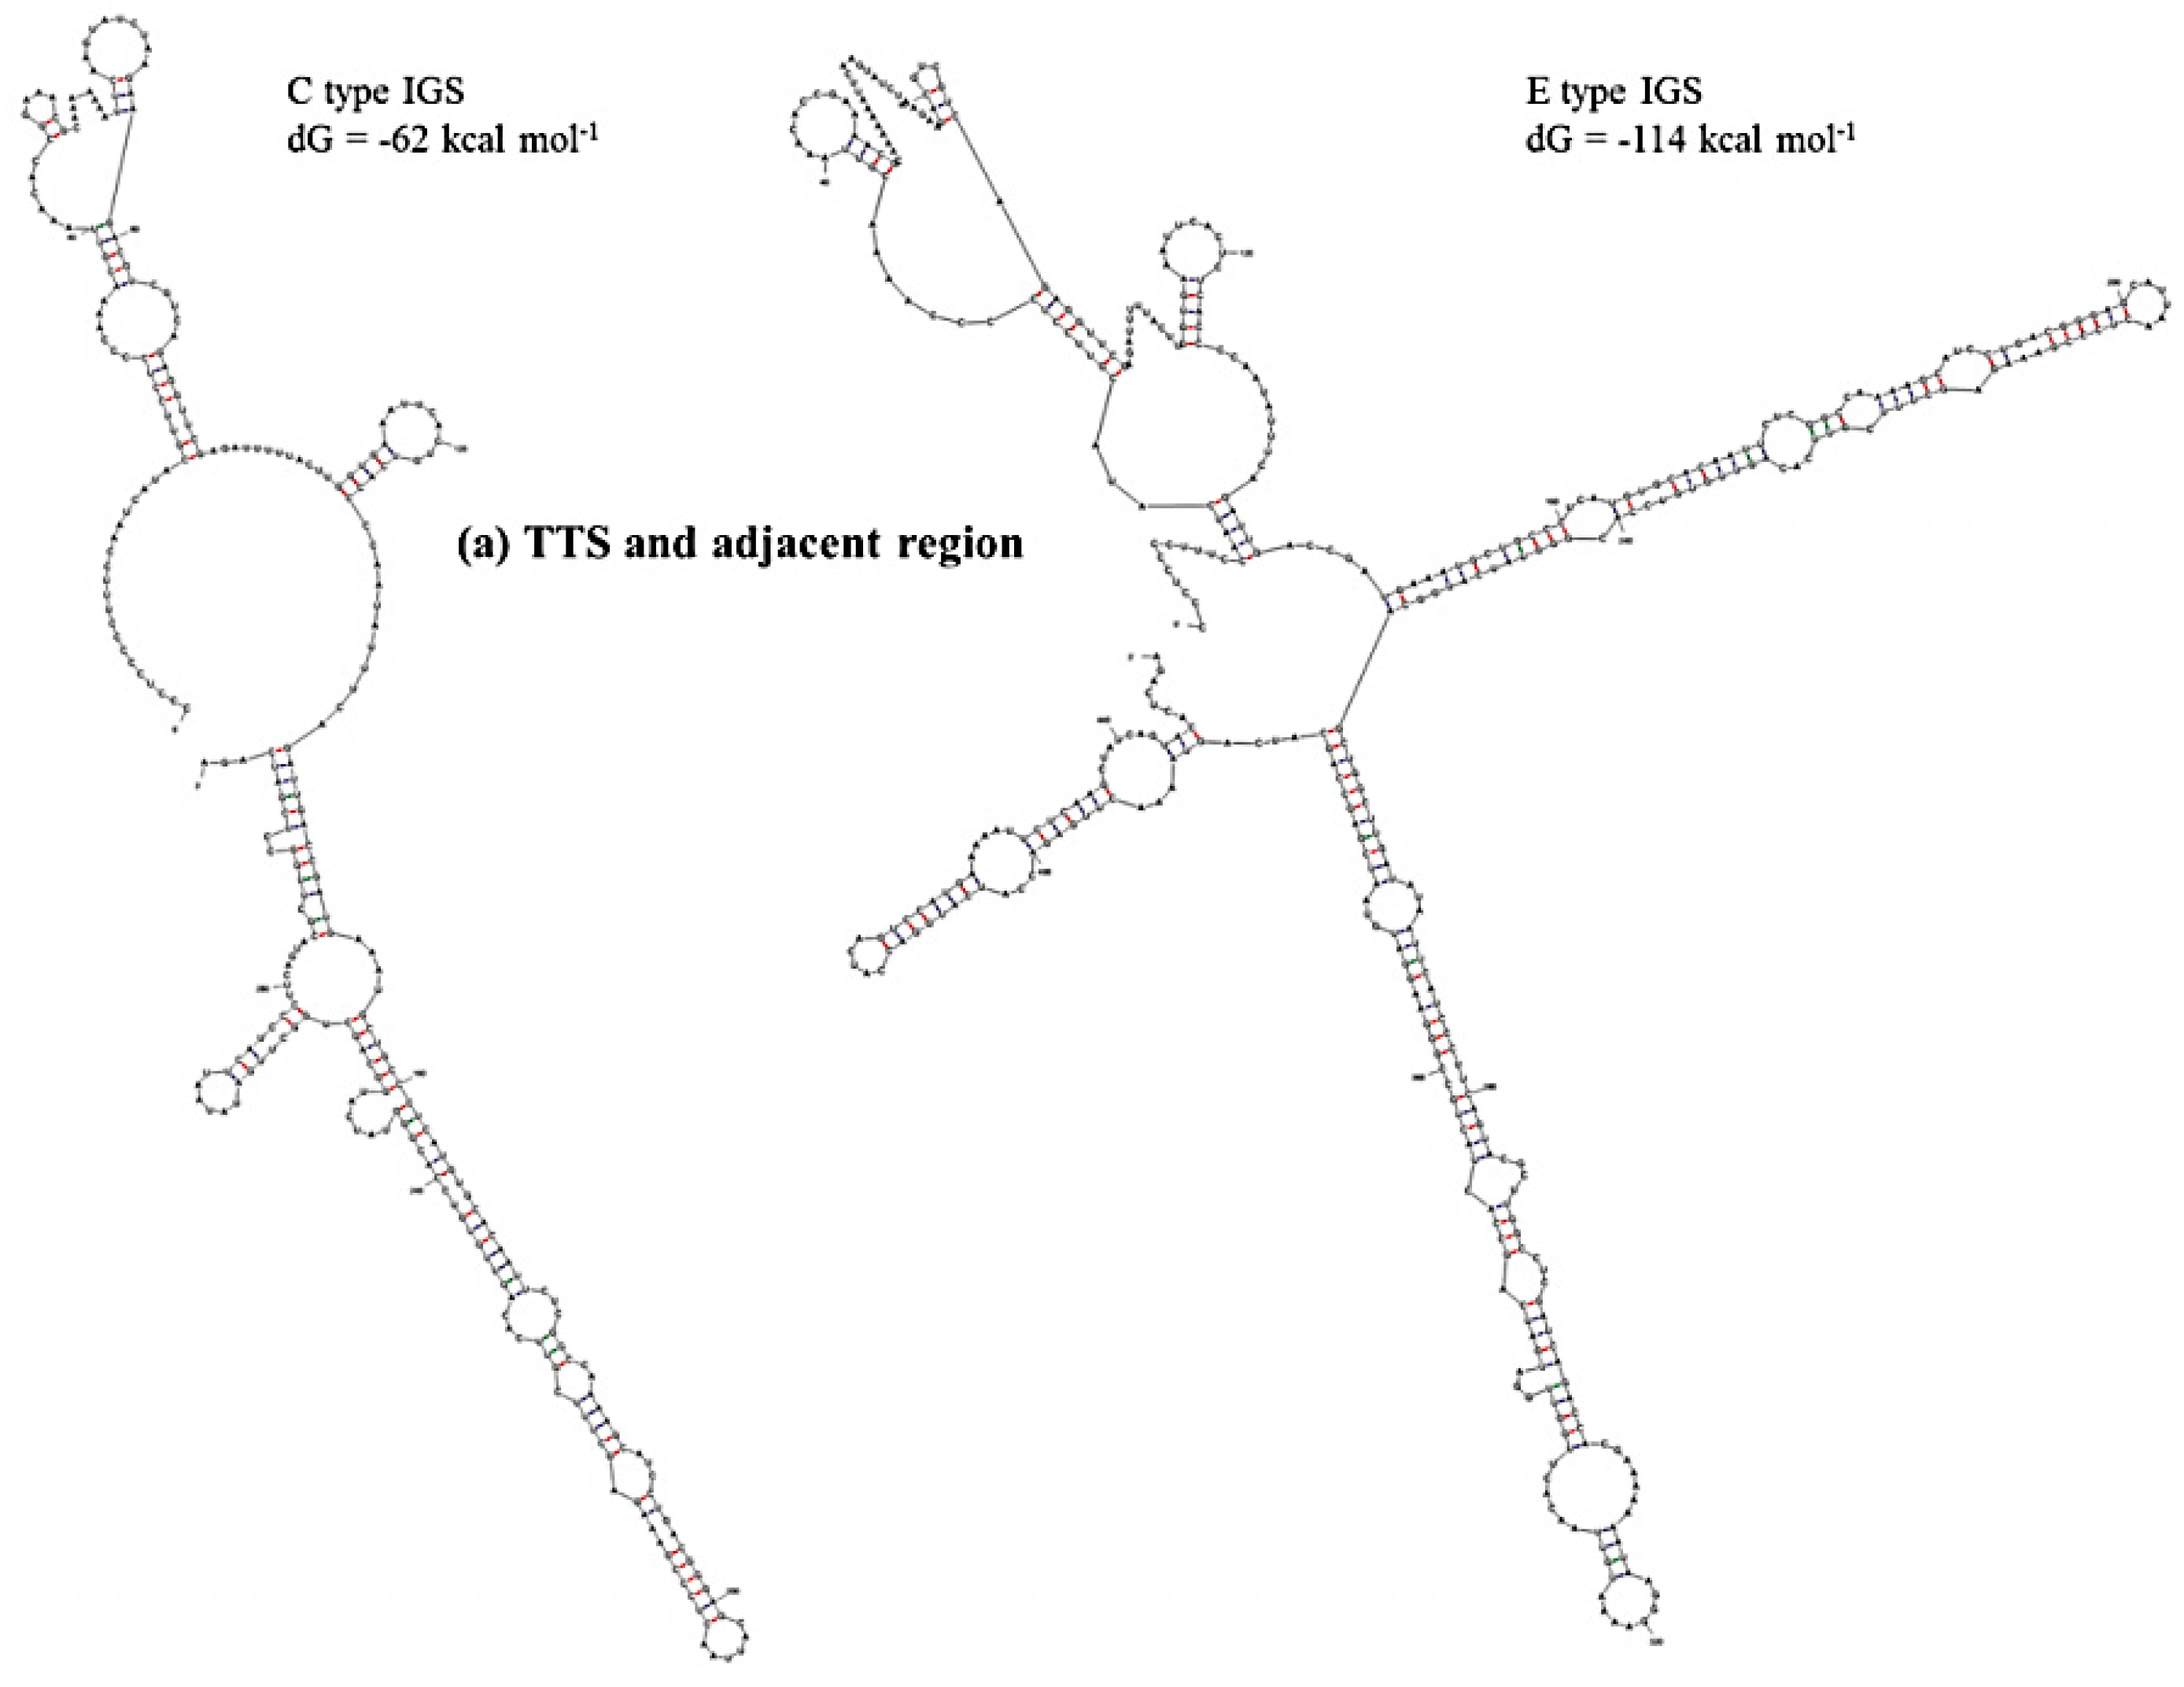
Prediction of secondary structure and associated
dG values can indicate at what level IGS sequences are active in producing ribosomes for the biosynthesis of proteins. In secondary structure prediction, mfold estimates free-energy as
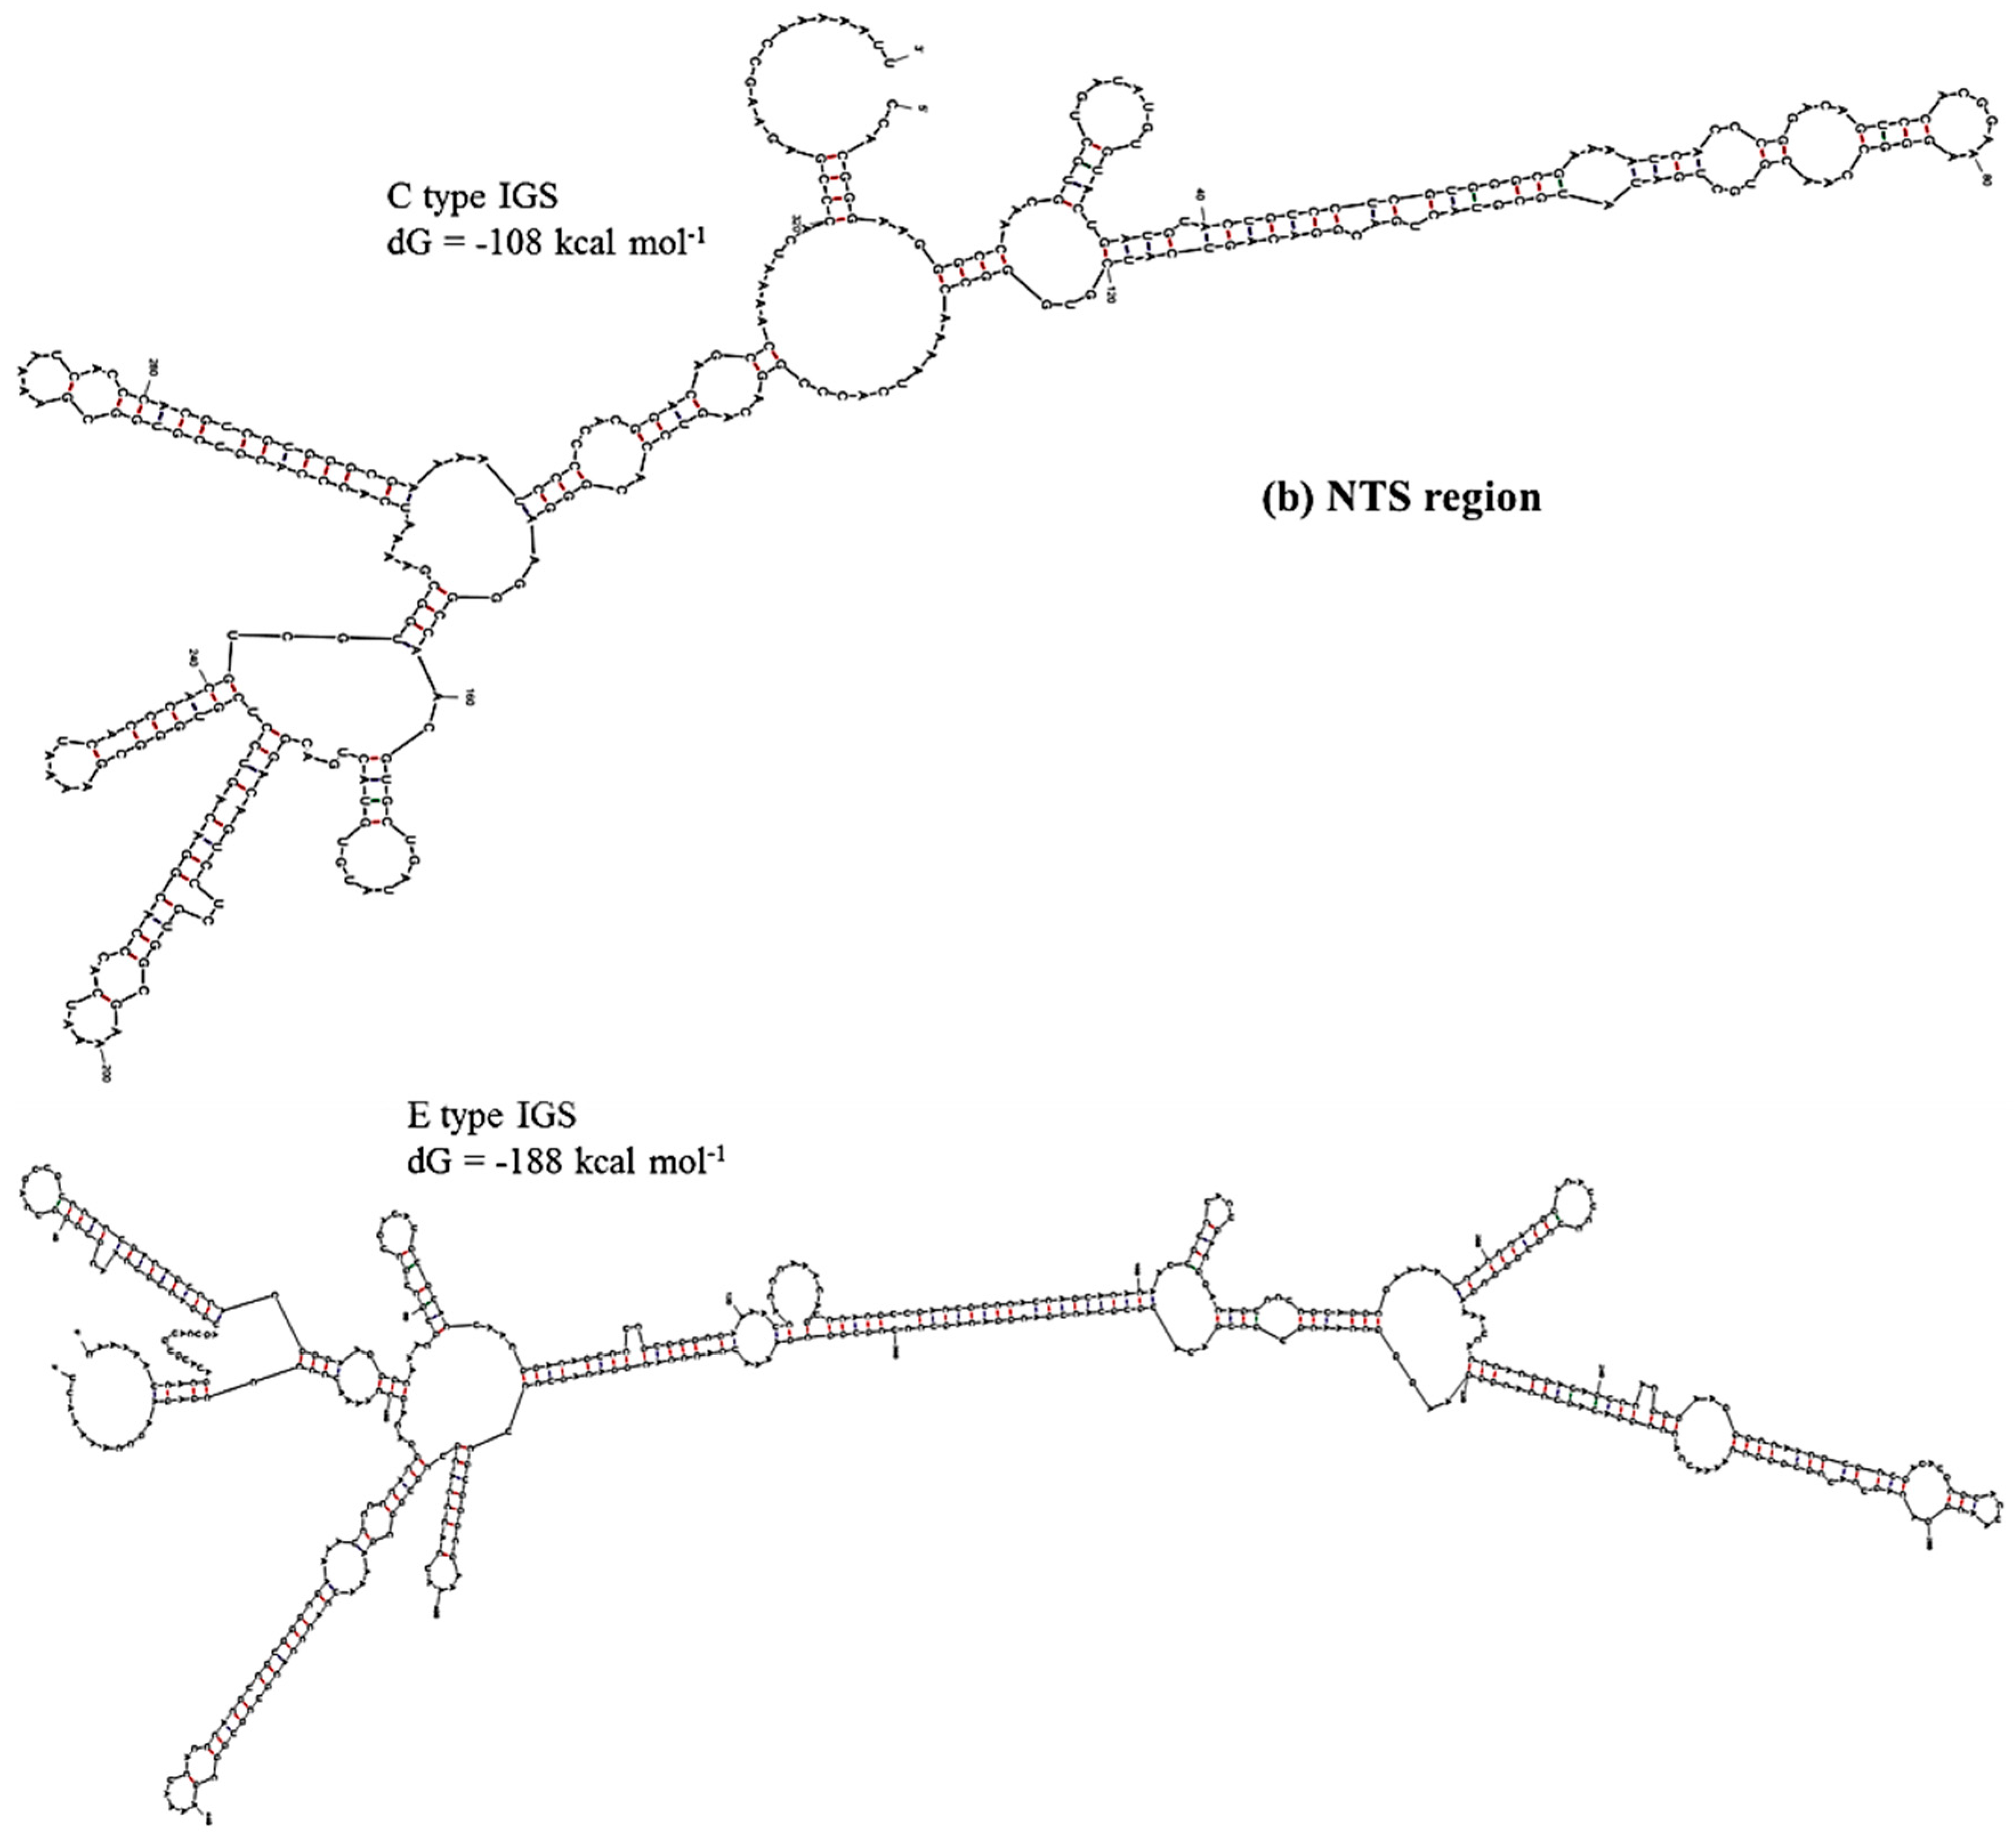
dG value. The predicted secondary structures and their free energies, as calculated using our results, indicated that the IGS regions form extensive and strong secondary structures with negative free-energy to start spontaneous production of protein. Free energy is available for transcriptional regulation by the non-coding RNA transcripts, initiation of replication at the AT-rich region and production of pre-rRNA transcript at the 5’ETS region. We divided the IGS sequences of the C and D types into four regions: Region 1, TTS and adjacent region; Region 2, NTS region; Region 3, AT-rich region and Region 4, TIS and 5’ETS region (
Table 4). Free energies predicted as
dG at Region 3 (−46 to −54 kcal·mol
−1) and Region 4 (−273 kcal·mol
−1 except D-type IGS) were quite similar for the four IGS types and the reference sequences X56978 and X60324 (
Table 4). Region 1 was predicted to have much lower
dG for E- and F-type IGSs compared to C- and D-type IGSs. The E-type IGS was predicted to form four additional loops in its secondary structure at Region 1 compared to the C-type IGS (
Figure 6). The predicted
dG value greatly differed at Region 2, the sub-repeat region, among the four IGS types (
Table 4). The C-type IGS had an 80 kcal·mol
−1 higher
dG value that predicted three fewer loops compared to the E type (
Figure 6). Low-energy secondary structure models suggest that with their low free-energy levels, the highly conserved structures, for example 5’ETS, possibly act as evolutionary constraints [
55].
Figure 6.
Predicted secondary structures of (a) TTS and adjacent region (Region 1) and (b) NTS region (Region 2) of C and E type 45S IGS of B. oleracea var. capitata and their minimum free energies.
Figure 6.
Predicted secondary structures of (a) TTS and adjacent region (Region 1) and (b) NTS region (Region 2) of C and E type 45S IGS of B. oleracea var. capitata and their minimum free energies.
Out of 15 F
1 lines, none produced any intermediate or off-parental type offspring. These results are suggestive of complete dominance of the variable IGS (
Figure 5). However the issue should be further examined in subsequent segregating generations for confirmation. Our preliminary results suggest that IGS sequence could potentially be used as molecular markers in breeding programs, especially in selection of desired hybrids from a large number of crosses.


 ,
, 


