2.1. AS and HSA Cell Lines Over-Secreted miR-214 and miR-126 via MVs
miRNAs in MVs secreted by cancer cells are promising blood-based biomarkers for various tumors [
5]; however, despite their clinical utility, diagnostic miRNAs up- or down-regulated in AS and HSA and thus of diagnostic importance is still unknown. AS and HSA represent the uncontrolled proliferation of neoplastic endothelial cells (ECs), and both miR-214 and miR-126 play important roles in regulating angiogenesis both intracellularly [
8,
9] and extracellularly [
6,
7]; therefore, we hypothesized that the levels of these angiogenic miRNAs are altered in the bloodstream of AS and HSA. We firstly examined whether AS (ISO-HAS [
10] and HAMON [
11]), HSA cell lines (JuB2, Re12, and Ud6 [
12]) and control cell lines (HMEC-1 [
13] and CnAOEC [
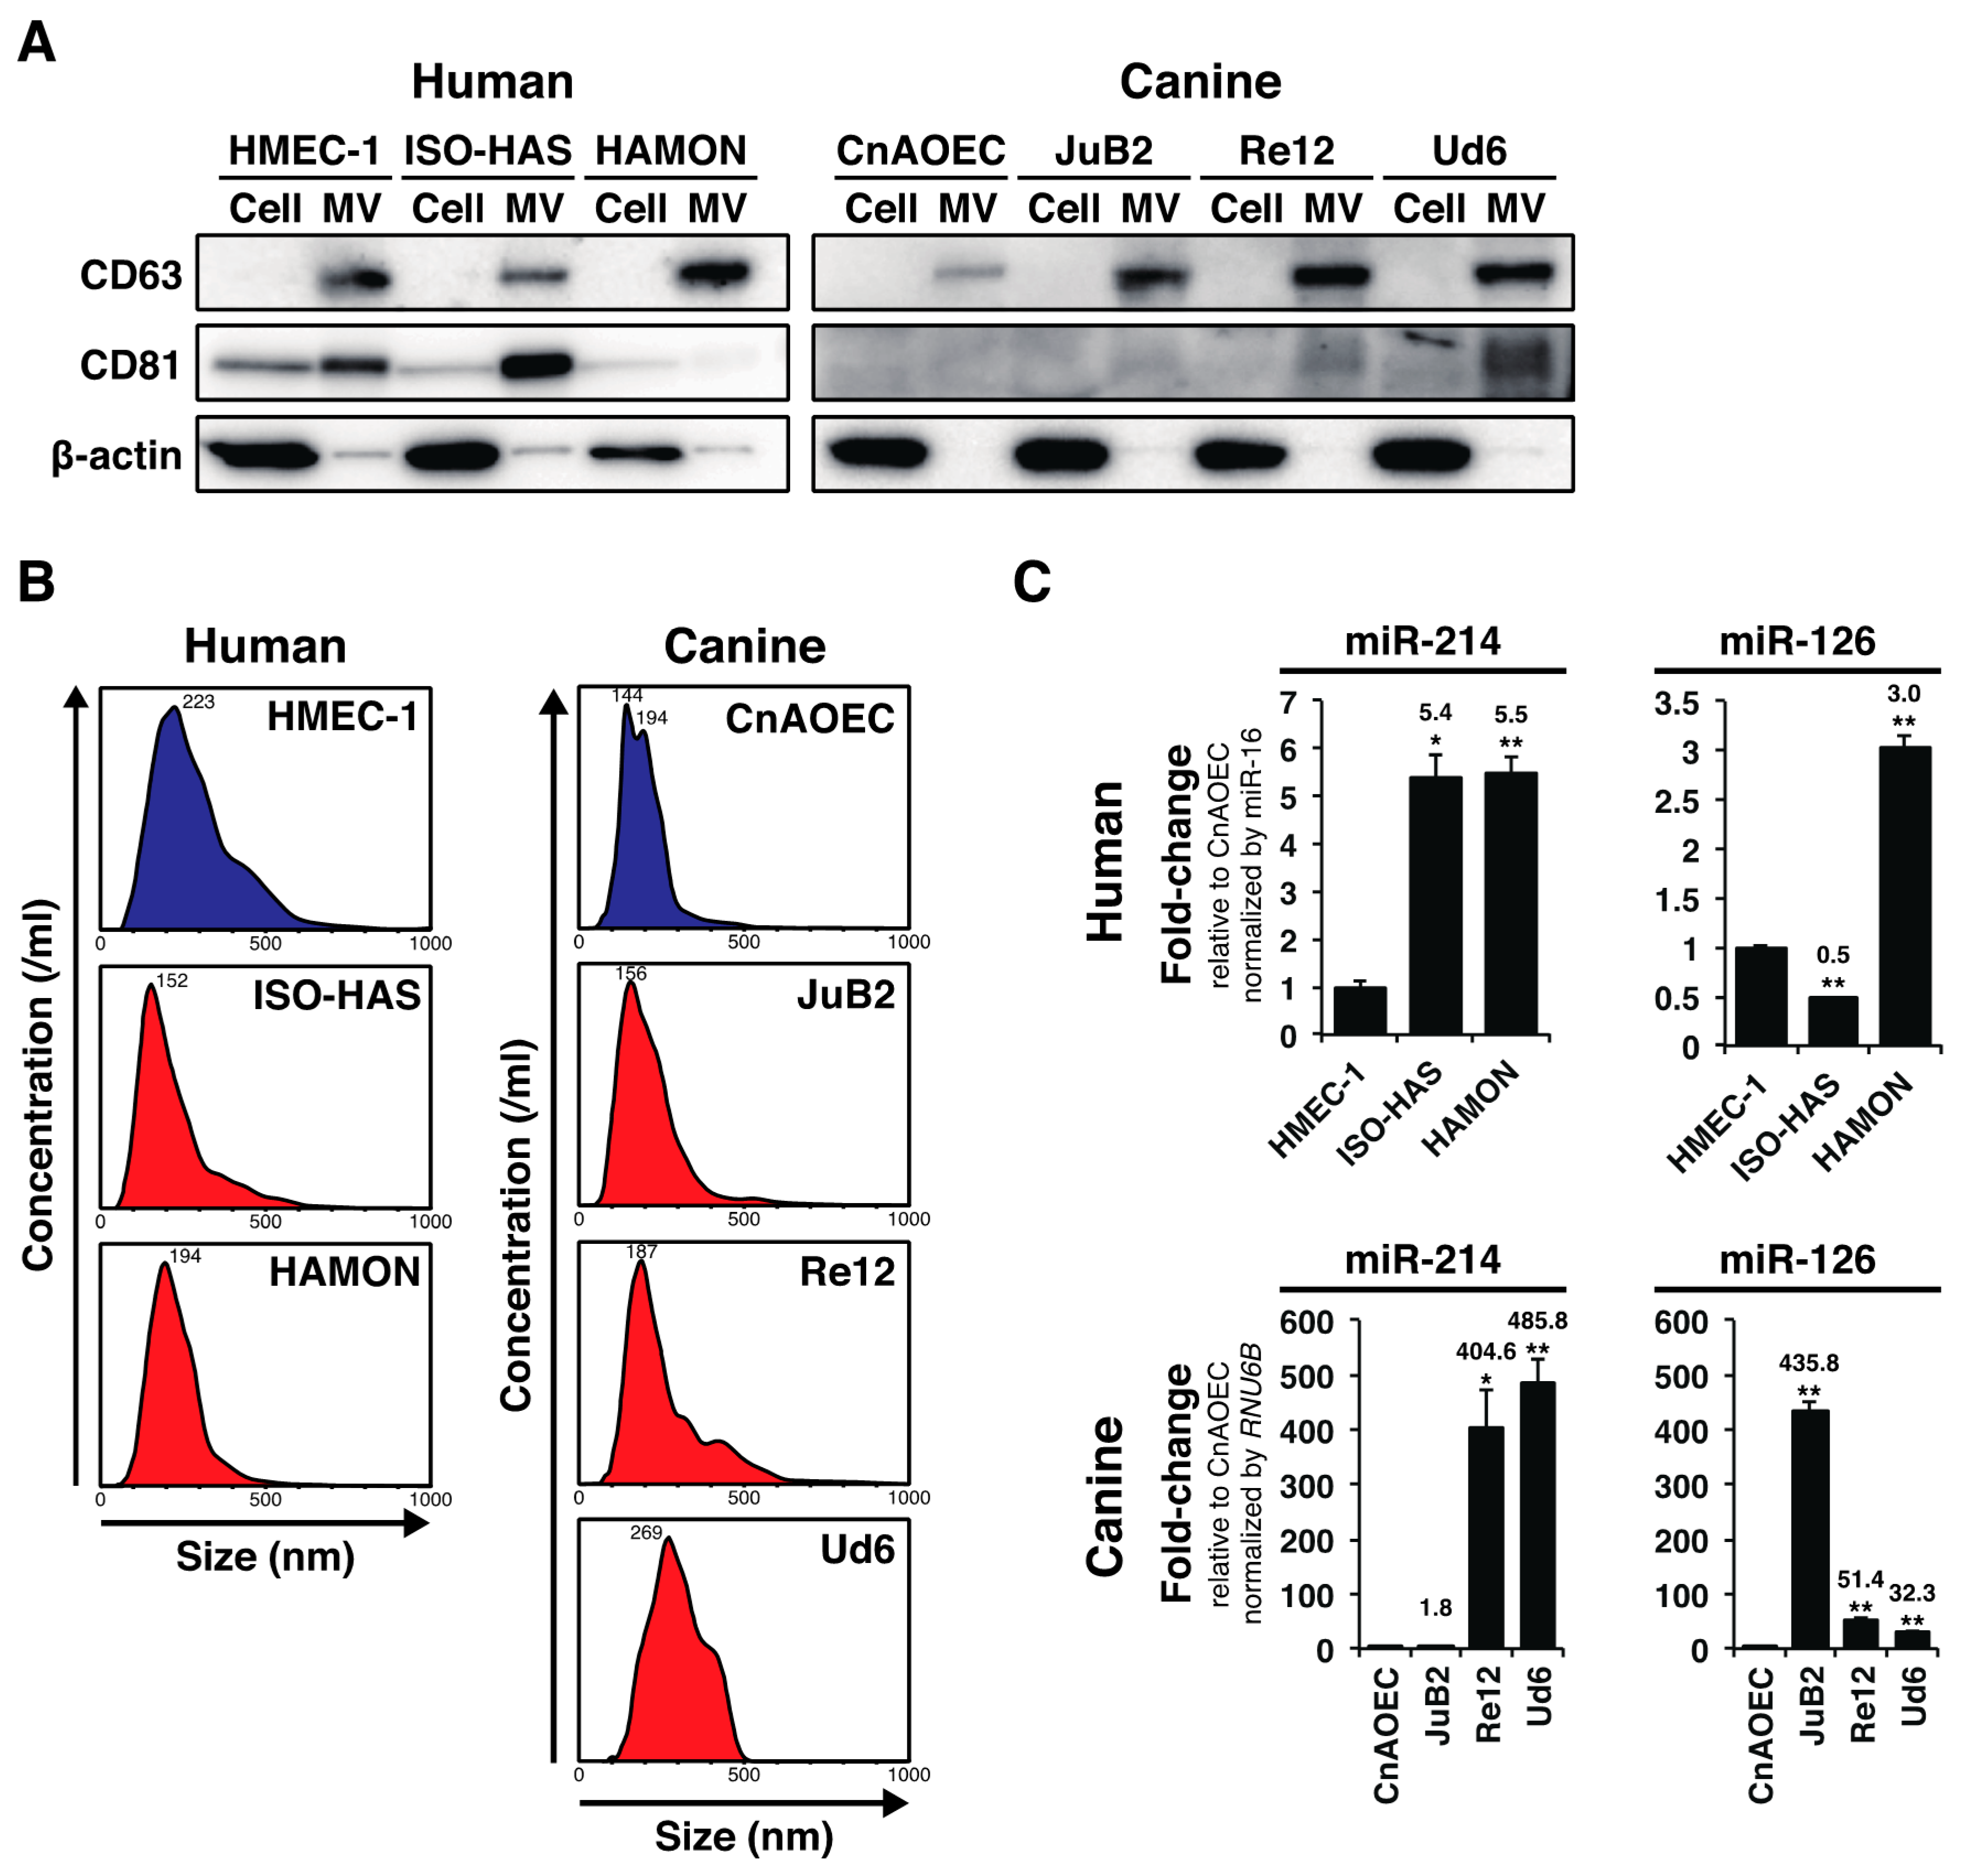
12]) secreted MVs into their surrounding environment by assessing their conditioned media. We collected nanoparticles with a diameter of less than 0.45 nm from the conditioned media by filteration and ultracentrifugation and examined the levels of MV-markers including CD63 and CD81 in them by immunoblotting. As we expected, the nanoparticles from the conditioned media of all cell lines expressed CD63 or CD81 although CD81 was absent or weakly detected in MVs derived from HAMON, CnAOEC, JuB2, and Re12 (
Figure 1A). The results indicate that these cell lines secrete MVs into their surrounding environment. Next, we examined the detailed characteristics of MVs by nanoparticle tracking analysis. As a result, we found that the diameter of MVs secreted from AS, HSA, and control cell lines had peaks of 144–269 nm, suggesting that these endothelial-derived cell lines mostly secreted MVs having a diameter of over 100 nm (
Figure 1B). Next, by performing miRNA qRT-PCR, we assessed whether the levels of miR-214 and miR-126 in MVs were elevated in AS and HSA cell lines. As we expected, the levels of miR-214 and miR-126 were significantly increased in the media conditioned by AS and HSA cell lines compared with their levels in the control cell lines although the degree of increase in canine cell lines was dramatically higher than that in human cell lines (
Figure 1C). These results suggest that both AS and HSA cells over-secreted miR-214 and miR-126 into their surrounding environment via MVs.
Figure 1.
AS and HSA cell lines over-secreted miR-214 and miR-126 via MVs. (A) Immunoblotting for MV-markers: CD63 and CD81. The nanoparticles from all cell lines expressed CD63 or CD81 although CD81 was absent or weakly detected in MVs derived from HAMON, CnAOEC, JuB2, and Re12. β-actin was used as a negative control for excluding contamination by cellular contents; (B) Nanoparticle tracking analysis for AS and HSA cell lines and control ECs. The peaks of MV diameters showed a range of 144–269 nm, indicating that AS, HSA cell lines and control ECs mostly secreted MVs having a diameter of over 100 nm; (C) Quantitative measurement of miR-214 and miR-126 in the MVs from the conditioned media from AS, HSA cell lines and control ECs. The levels of miR-214 were significantly increased in the conditioned media of AS and HSA cell lines compared with those for the control cell lines. The levels of miR-126 were also increased likewise, except in the case of ISO-HAS. The degree of increase in canine cell lines was dramatically higher than that in human cell lines. All data are presented as the mean of triplicate experiments with error bars indicating the s.e.m. (Unpaired two-tailed t-test; * p < 0.05, ** p < 0.01 for comparisons with the levels of control cell lines).
![Ijms 16 25377 g001]()
2.2. Plasma miR-16 Was a Suitable Internal Control in this Study
We next addressed the levels of miR-214 and miR-126 in clinical plasma samples. The levels of miR-214 and miR-126 in both AS and HSA should have been examined; however, because AS is extremely rare human sarcoma, we couldn’t collect sufficient number of AS samples. Therefore, we concentrated to assess the levels of miR-214 and miR-126 in HSA, which is a spontaneous model for AS. To extract miRNAs in plasma, we used NucleoSpin
® miRNA Plasma (MACHEREY-NAGEL, Düren, Deutschland), which can collect both MV-miRNAs and soluble miRNAs. For assessing precise miRNA expression in the plasma, we firstly determined a suitable internal control for canine plasma miRNA.
RNU6B is used for normalizing the level of extracellular miRNA
in vitro; however, it is possibly unsuitable for normalizing miRNA expression in clinical cases. Therefore, we assessed the levels of candidate miRNAs for the internal control such as
RNU6B,
RNU19,
RNU48, miR-16, and miR-1228 based on previous human studies [
14] by using a small number of clinical samples (HSA,
n = 2; Benign,
n = 2; Control,
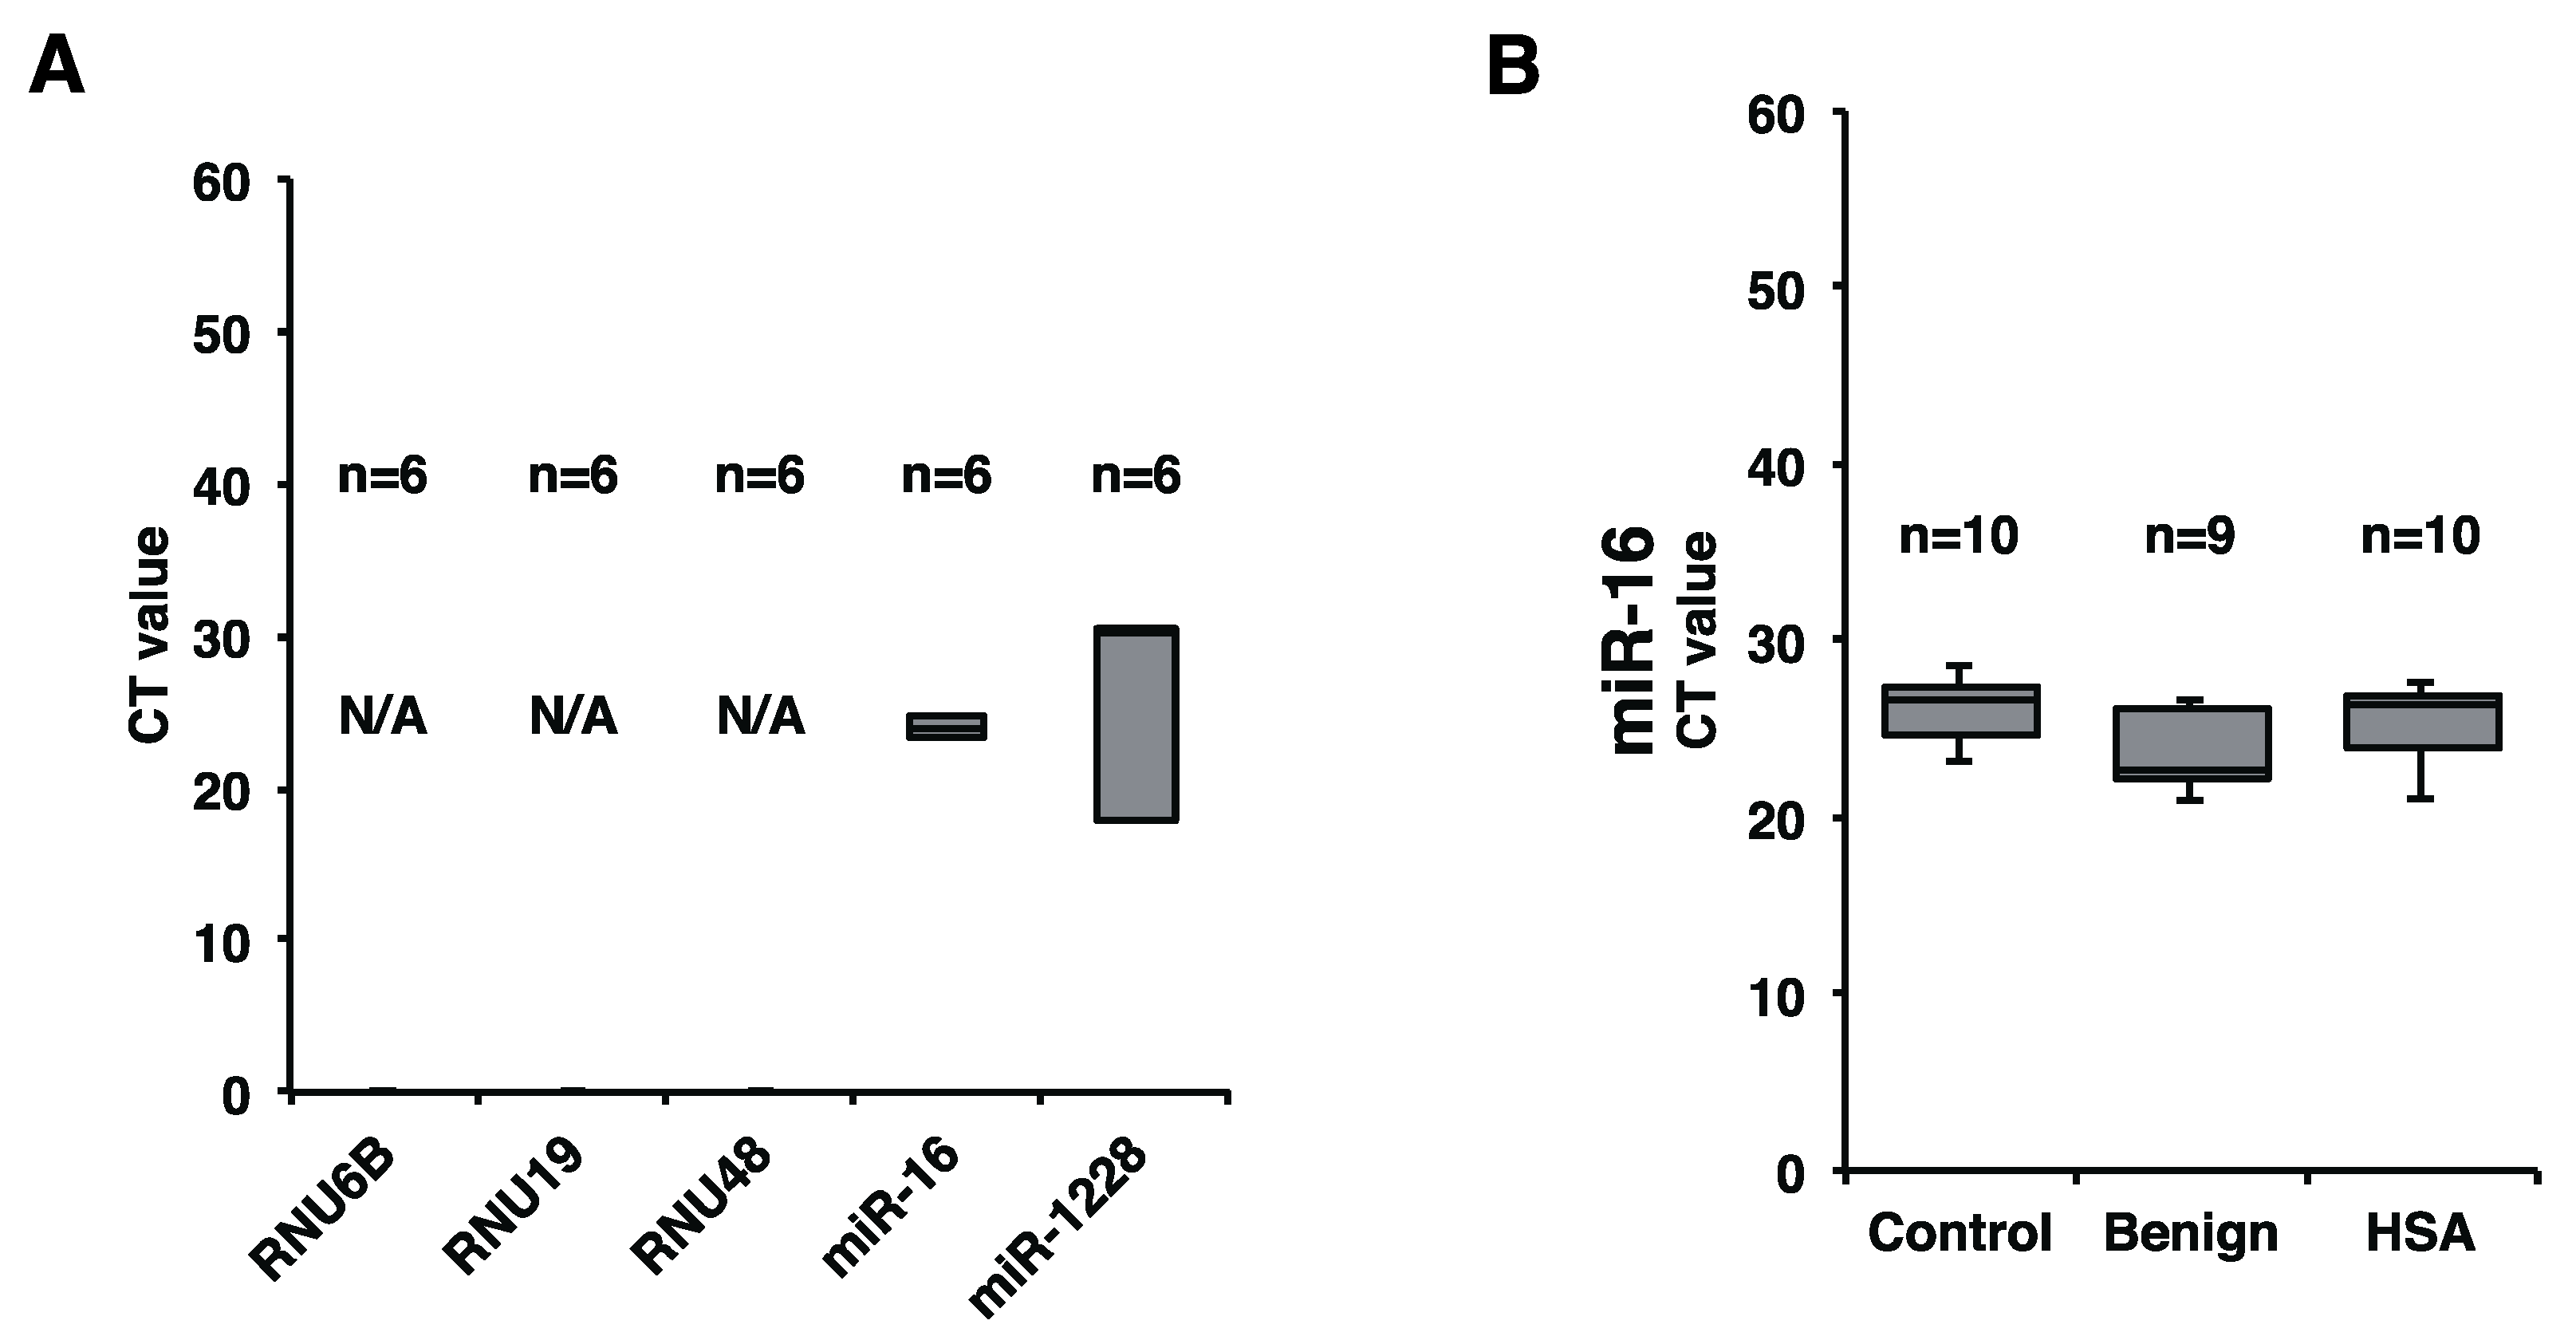
n = 2). As a result, we judged that miR-16 was the most stable and suitable internal control miRNA among these candidates (
Figure 2A). Subsequently, we assessed whether miR-16 was stably expressed in all cases used in this study. The result showed that miR-16 was also stably expressed in all samples with only a small deviation in this study (
Figure 2B). Taken together, miR-16 was identified as a suitable internal control for canine plasma miRNA in this study although we have to evaluate more cases to determine that plasma miR-16 serves as a definitive internal control for canine study.
Figure 2.
miR-16 was a suitable internal control for canine plasma miRNA analysis in this study. (A) Levels of RNU6B, RNU19, RNU48, miR-16, and miR-1228 in 6 cases (HSA, n = 2; Benign, n = 2; Control, n = 2), as determined by miRNA qRT-PCR. miR-16 was the most stable miRNA; (B) miR-16 expression in all samples used. miR-16 was stably detected in all samples. There were no significant differences among HSA, benign, and control groups (Steel-Dwass test).
2.3. Plasma miR-214 and miR-126 Levels Were Significantly Increased in the Plasma of Canines with HSA
To clarify whether the levels of miR-214 and miR-126 were increased in the plasma of canines with HSA, we examined the levels of miR-214, miR-126, and miR-16 in the plasma of canines with HSA (HSA group,
n = 10), benign splenomegaly (benign group,
n = 9), and in that of control canines with no specific disease (control group,
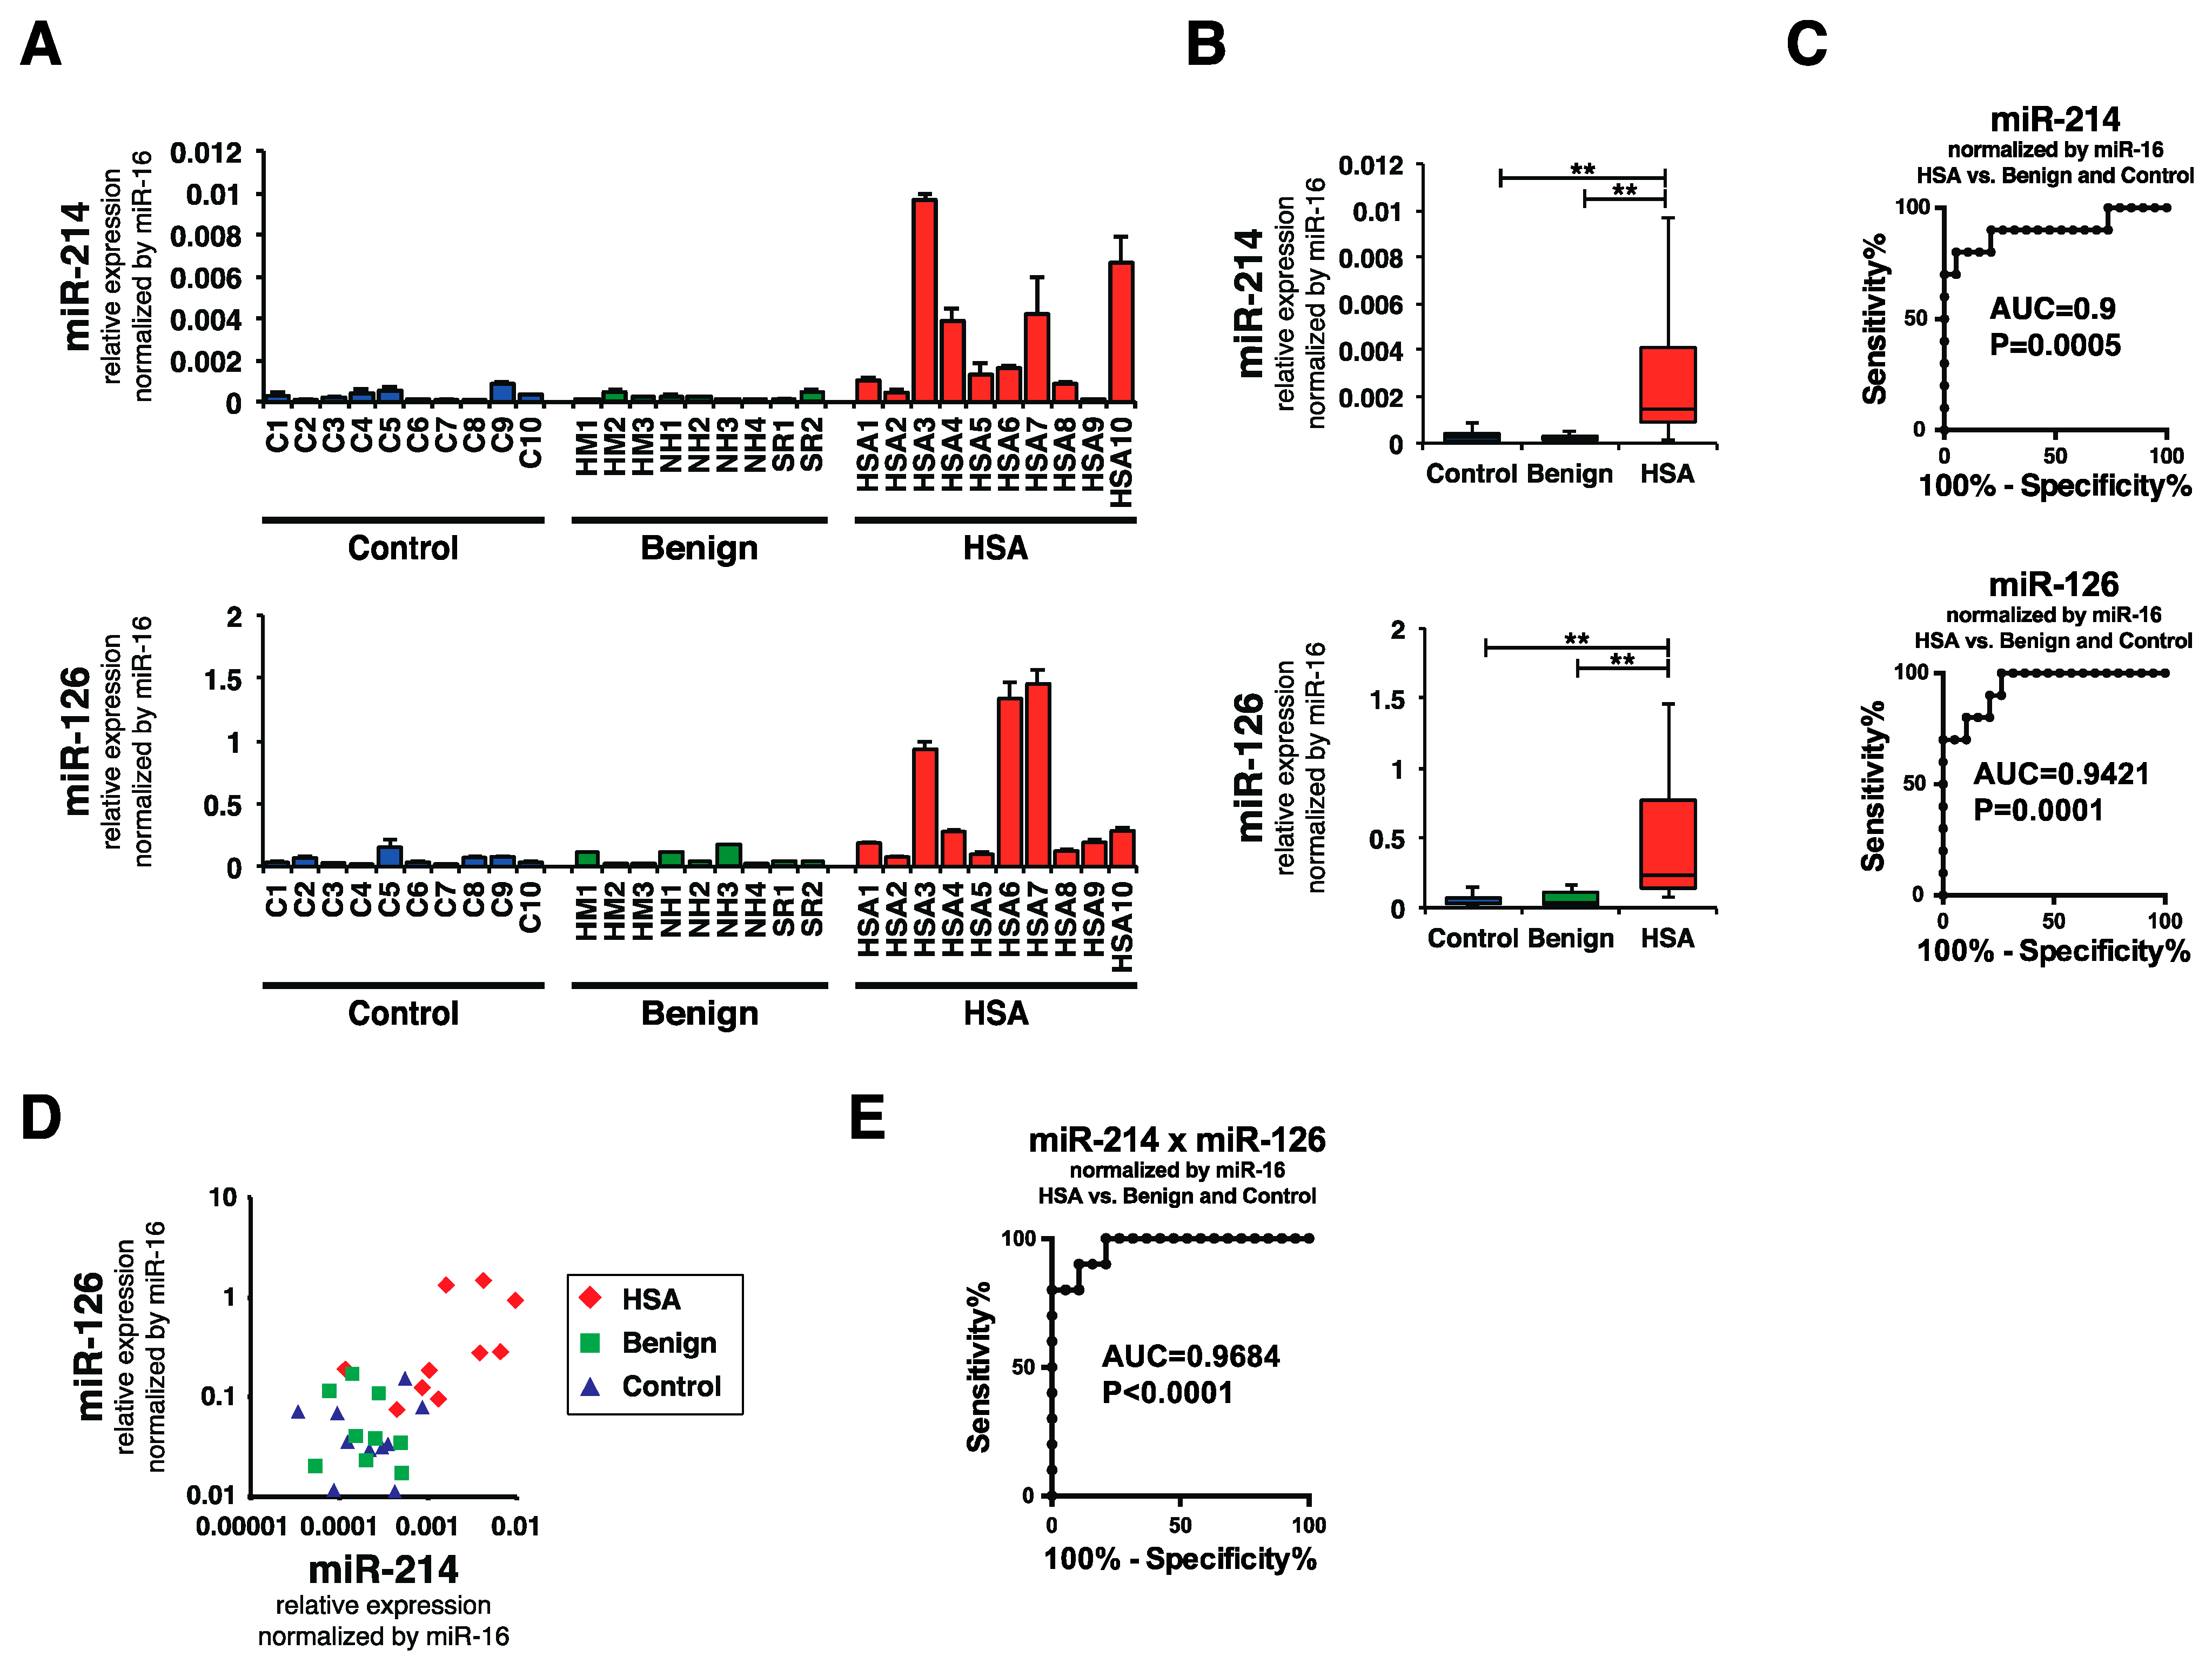
n = 10) by performing miRNA qRT-PCR. Consistent with our hypothesis, the levels of miR-214 and miR-126 were significantly higher in the plasma of the canines with HSA than in that of the benign or control groups (
Figure 3A,B). Receiver operatorating characteristic (ROC) curve analysis revealed that the area under the curve (AUC) values of miR-214 and miR-126 for discriminating HSA from benign and control groups were 0.9 and 0.9421, respectively, indicating that the sensitivities and specificities were significantly high (
Figure 3C). Furthermore, since the miR-214 and miR-126 levels showed similar profile patterns (
Figure 3D), the combination of miR-214 and miR126 was more effective than the single use of each miR-214 or miR-126: the AUC value was 0.9684 (
Figure 3E). Next, we assessed whether the state of dogs presenting various clinical conditions affects the levels of miR-214 and/or miR-126. We firstly confirmed that there was no significant difference in their distributions of ages and weights between HSA, benign, and control group (
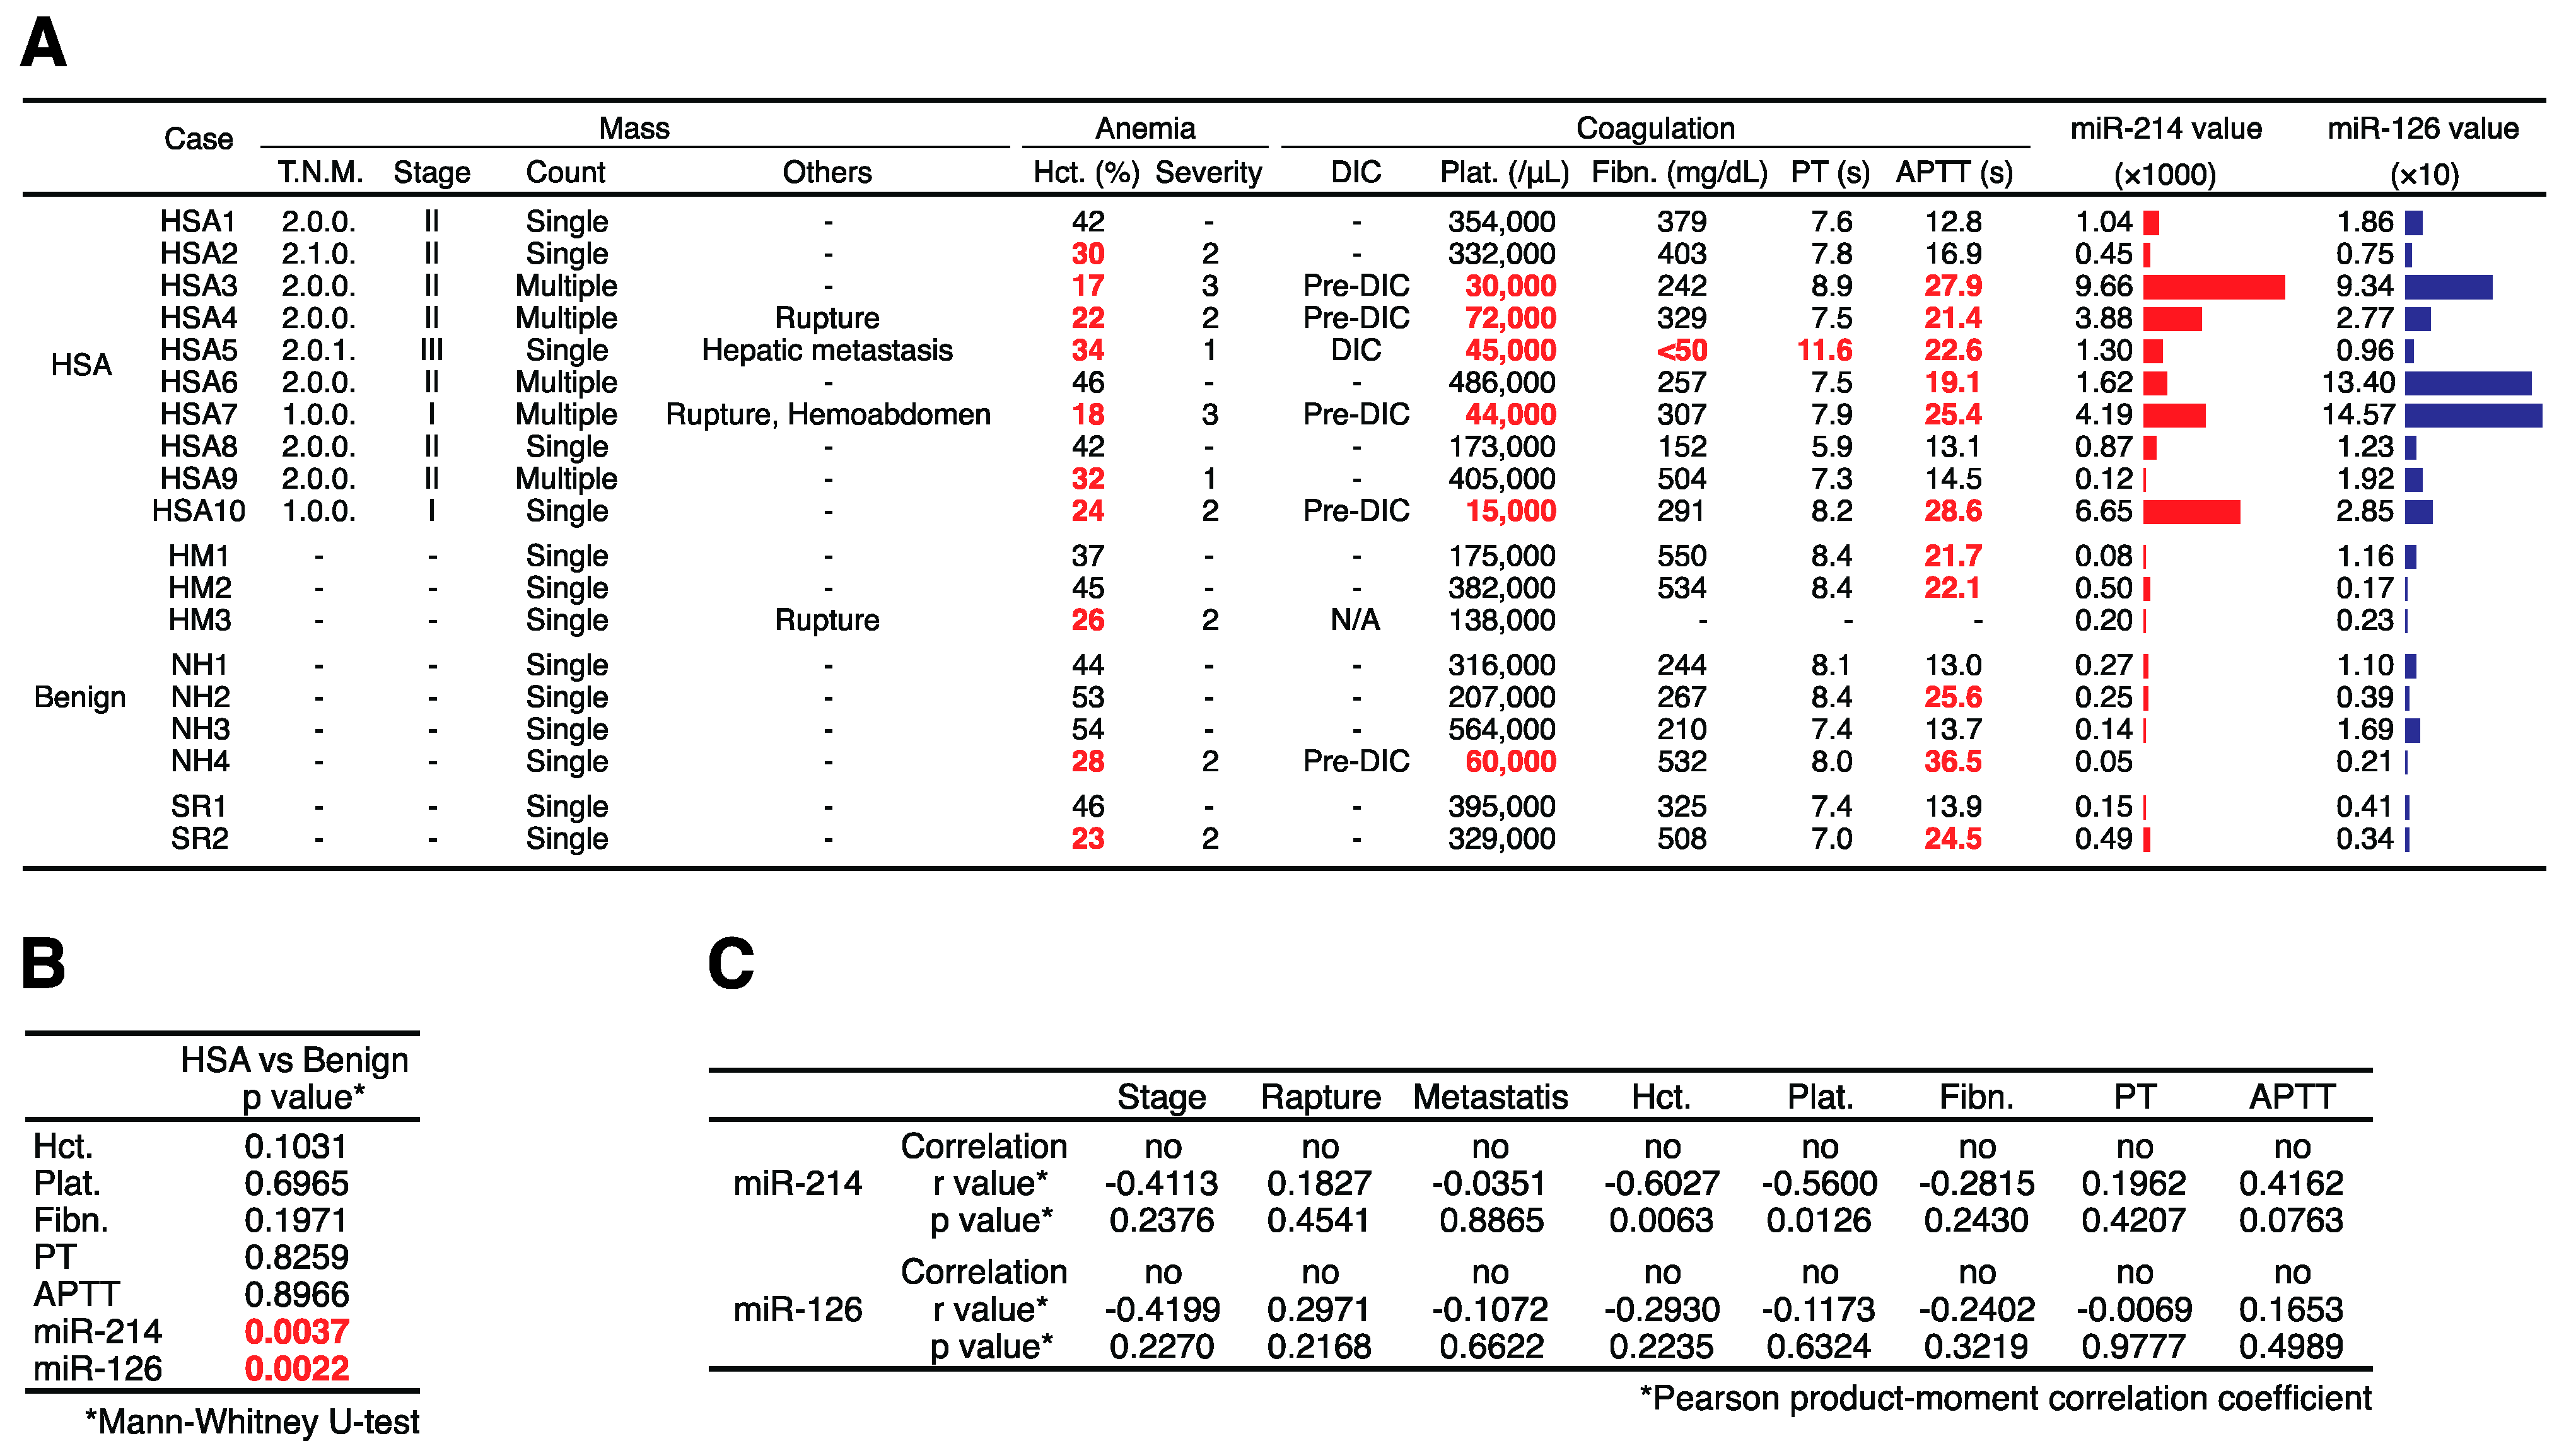
Table 1). Subsequently, we evaluated whether there was significant difference in these values between HSA and benign groups by collecting the clinical information including hematocrit (Hct.), platelet (Plat.), fibrinogen (Fibn.), prothrombin time (PT), and activated partial thromboplastin time (APTT) in HSA and benign group from their medical records. As a result, we found that there was no significant difference between HSA and benign group in the clinical conditions but in the levels of miR-214 and miR-126 (
Figure 4A,B); furthermore, the result of Pearson product-moment correlation coefficient showed that there was not any correlation between the levels of miRNAs and these clinical conditions (
Table 1), suggesting that the levels of these miRNAs does not correlate with the state of anemia and coagulopathy. Taken together, these results suggest that both miR-214 and miR-126 have potential to be biomarkers for discriminating HSA from benign or healthy cases.
Table 1.
Case information of age and weight. The case information of age and weight used in this study. There was no significant difference in their ages and weights between HSA, benign, and control groups (Steel-Dwass test).
Table 1.
Case information of age and weight. The case information of age and weight used in this study. There was no significant difference in their ages and weights between HSA, benign, and control groups (Steel-Dwass test).
| | Age (y.m.) | | Weight (kg) | | | p Value * |
|---|
| | Mean | Median | s.d. | | Mean | Median | s.d. | | | Age | Weight |
| HSA | 10.6. | 10.9. | 2.8. | | 11.1 | 6.6 | 9.6 | | HSA vs. Benign | >0.05 | >0.05 |
| Benign | 10.1. | 11.1. | 2.6. | | 10.2 | 6.8 | 9.6 | | Benign vs. Control | >0.05 | >0.05 |
| Control | 10.3. | 10.3. | 2.8. | | 6.9 | 5.4 | 3.3 | | HSA vs. Control | >0.05 | >0.05 |
Figure 3.
miR-214 and miR-126 was significantly increased in the plasma of HSA group. (A) Levels of miR-214 and miR-126 in the plasma of HSA, benign, and control groups. The levels of both miR-214 and miR-126 were significantly increased in the plasma from the HSA group compared with those for the benign and control groups; (B) Boxplots of the miR-214 and miR-126 levels in the plasma of HSA, benign, and control groups. The HSA group showed significantly increased levels of miR-214 and miR-126 (Steel-Dwass test; ** p < 0.01 for each comparison); (C) ROC curve analysis for the single use of miR-214 and miR-126. The AUC values of miR-214 and miR-126 were 0.9 and 0.9421, indicating the sensitivities and specificities were significantly high; (D) miR-214 and miR-126 showed similar profile patterns in the HSA group, which showed increased levels of both miR-214 and miR-126; (E) ROC curve analysis for the combination of miR-214 and miR-126. The AUC value was 0.9684, suggesting that the combination of miR-214 and miR-126 showed better accuracy than the single use of each miRNA.
![Ijms 16 25377 g003]()
Figure 4.
Clinical information about mass, anemia, and coagulopathy. (A) The clinical information of each case including the TNM classification (T.N.M.), stage, the count of mass, rupture, metastasis, hematocrit (Hct.), the severity of anemia, the state of disseminated intravascular coagulation (DIC), platelet (Plat.), fibrinogen (Fibn.), prothrombin time (PT), and activated partial thromboplastin time (APTT). The values of Hct. lower than 35% were considered as anemia and marked as red. The severity of anemia was determined based on the following criteria (Severity 1 = 30% to 35% of Hct., Severity 2 = 18% to 29% of Hct., Severity 3 = lower than 18% of Hct.). The values of Plat. lower than 100,000/μL were considered as thrombocytopenia and marked as red. The values of Fibn. lower than 150 mg/dL were considered as hypofibrinogenemia and marked as red. The values of PT longer than 10 s. and the values of APTT longer than 19 s. were considered as prolongation and marked as red. The cases were diagnosed as DIC (Pre-DIC) on the presence of together with three (two) of the following anomalies: thrombocytopenia, PT and/or APTT prolongation, and hypofibrinogenemia—considered as pre-DIC when two criteria; (B) The p-values regarding the differences of Hct., Plat., Fibn., PT, APTT, miR-214, and miR-126 between HSA and benign groups. There was no significant difference between HSA and benign group in the clinical conditions but in the levels of miR-214 and miR-126 (Mann-Whitney U-test); (C) The result of Pearson product-moment correlation coefficient. There was not any correlation between the levels of miRNAs and these clinical conditions.
![Ijms 16 25377 g004]()
2.4. Plasma miR-214 and miR-126 Levels Were Decreased after the Surgical Resection of Primary Splenic HSA
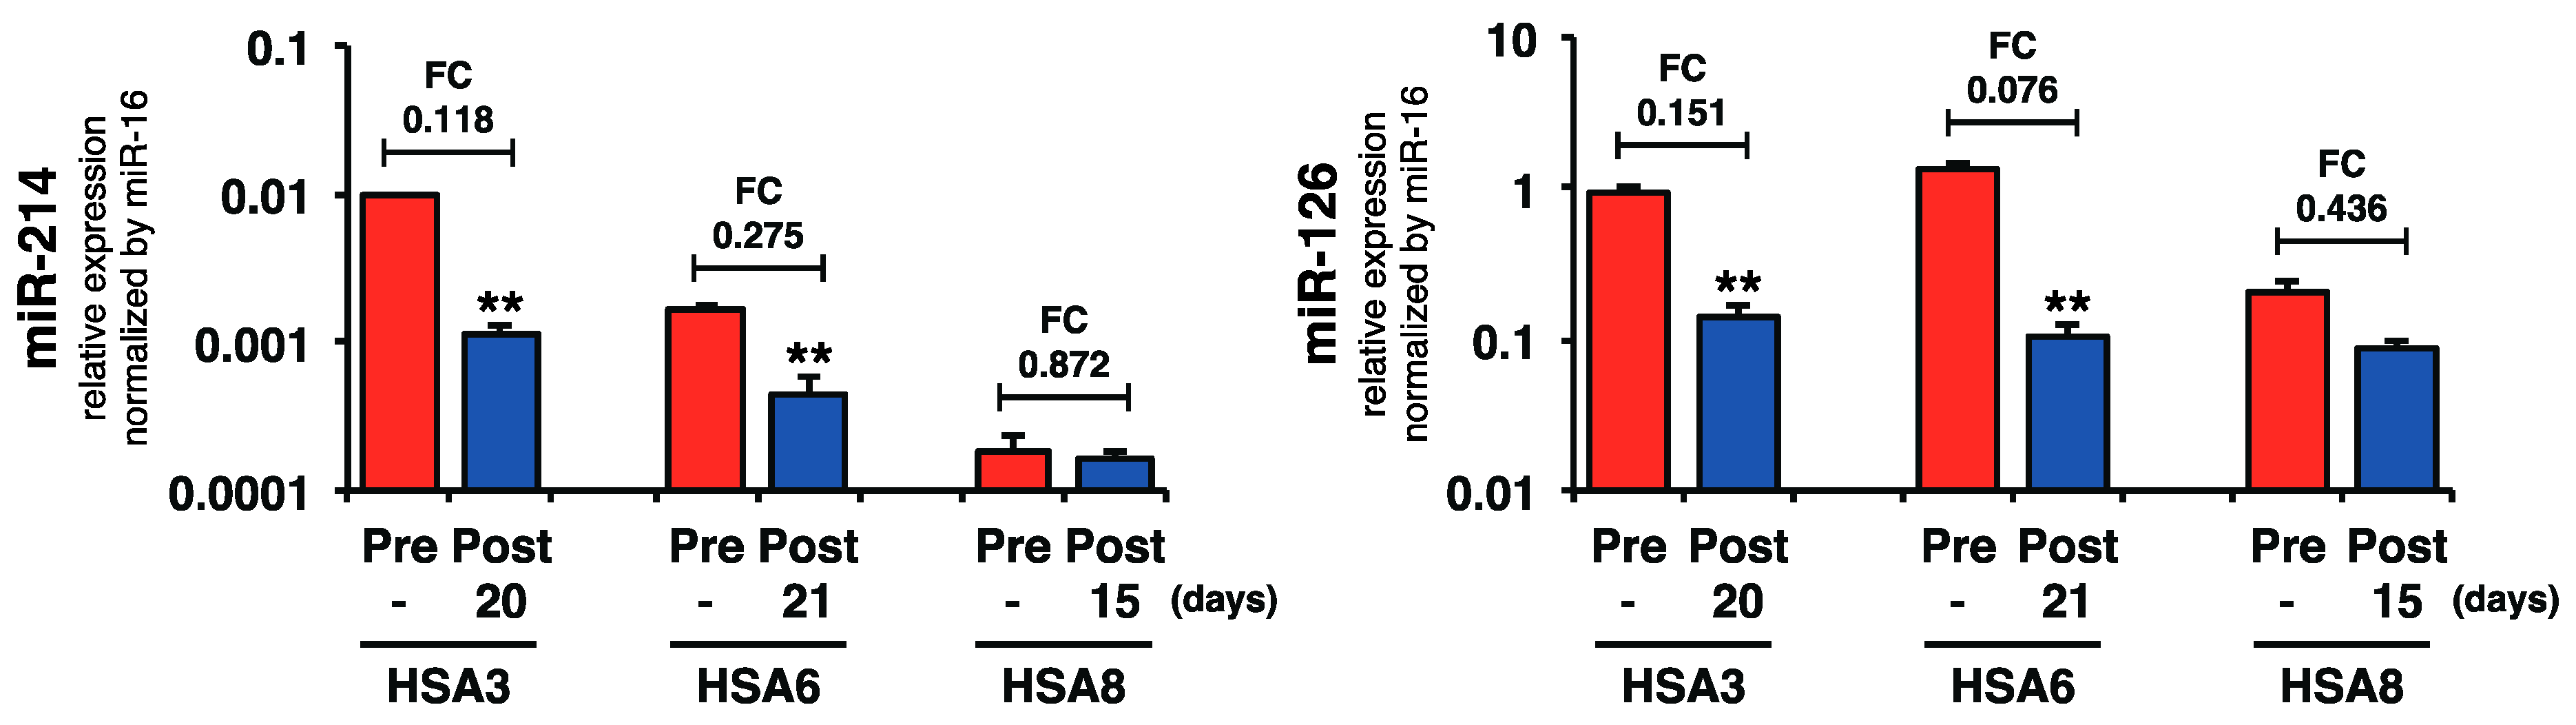
Because the plasma miR-214 and miR-126 levels were increased in canines with HSA, we assessed whether the surgical resection of primary splenic HSA would affect these levels. We examined the levels of miR-214 and miR-126 in paired (pre- and post-operation) plasma samples from three cases (HSA3, HSA6, and HSA8). The results showed that the surgical resection of the primary tumor significantly decreased the levels of both miR-214 and miR-126 in two out of three cases (
Figure 5), supporting our hypothesis that HSA cells secreted the miR-214 and miR-126 into the bloodstream.
Taken together, we demonstrated that AS and HSA cell lines over-secreted miR-214 and miR-126 via MVs. We identified miR-214 and miR-126 as over-secreted miRNAs in the plasma of canines with HSA, which is a spontaneous model of AS. These results suggest that both miR-214 and miR-126 have potential to be biomarkers for the diagnosis of HSA and possibly be applicable for diagnosing AS.
Figure 5.
Surgical resection of the primary tumor decreased the levels of plasma miR-214 and miR-126. Surgical resection of primary tumor significantly decreased the levels of both miR-214 and miR-126 in two out of three cases shown. (Paired two-tailed t-test; ** p < 0.01 for comparisons with the levels of pre-operation samples).


 ,
, 
