
Studies on [5,6]-Fused Bicyclic Scaffolds Derivatives as Potent Dual B-RafV600E/KDR Inhibitors Using Docking and 3D-QSAR Approaches

Abstract
:
1. Introduction

2. Results and Discussion
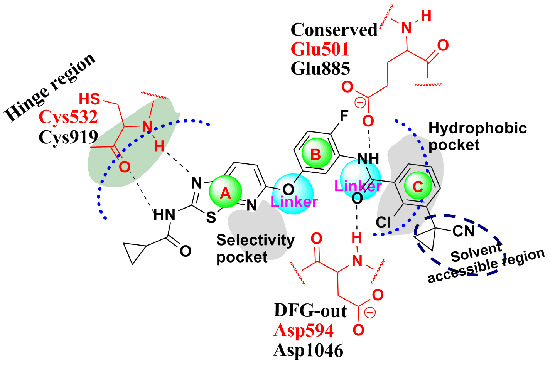
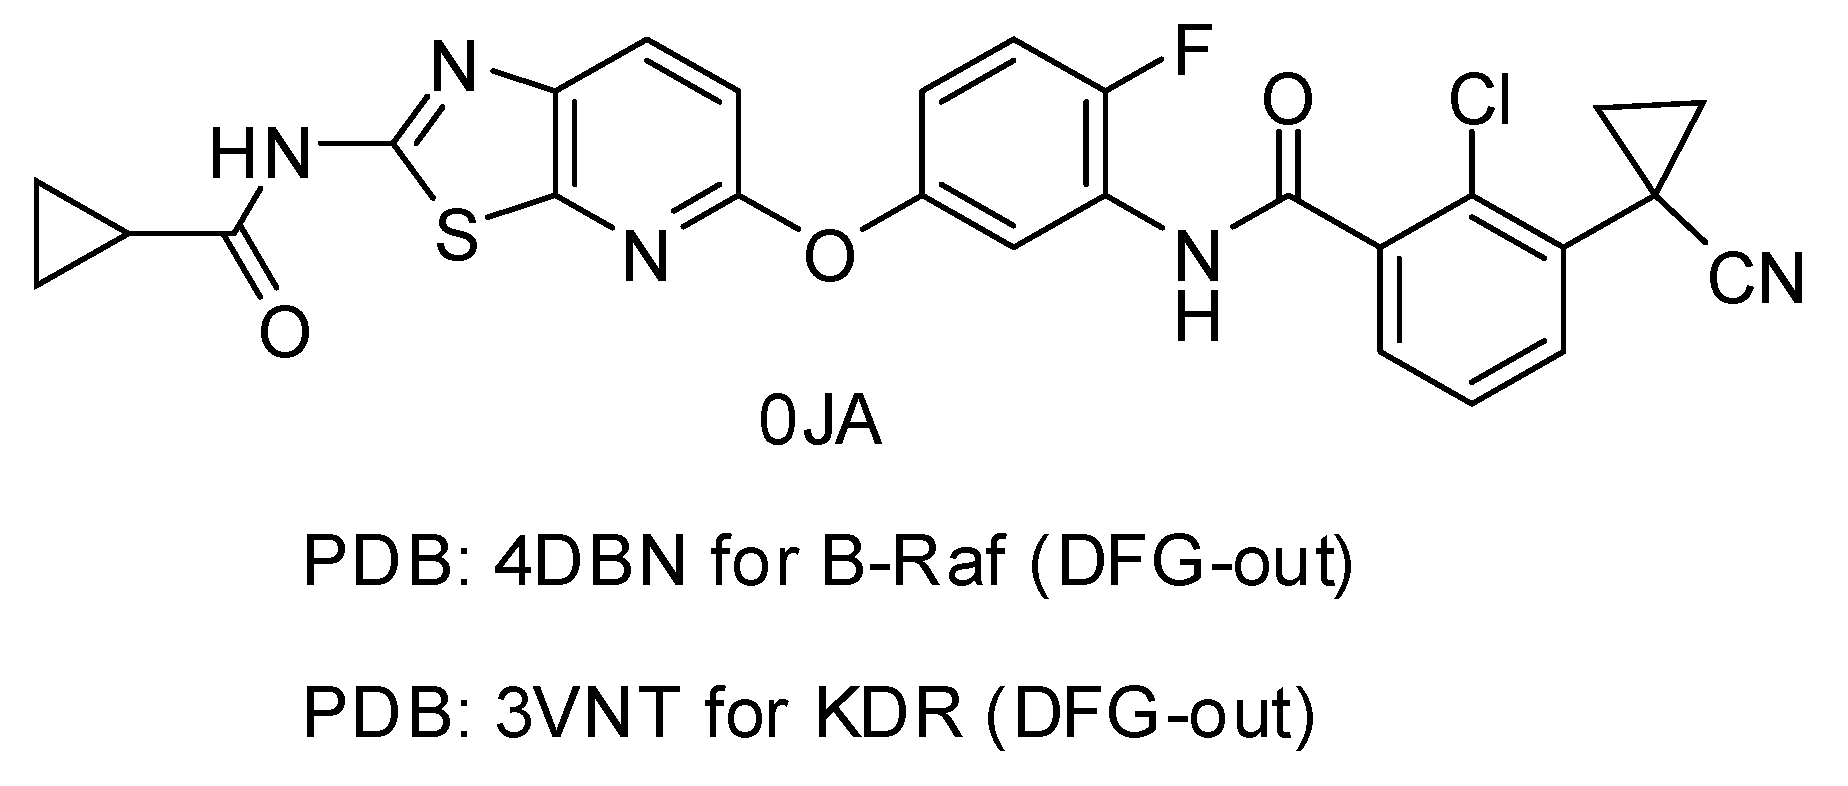
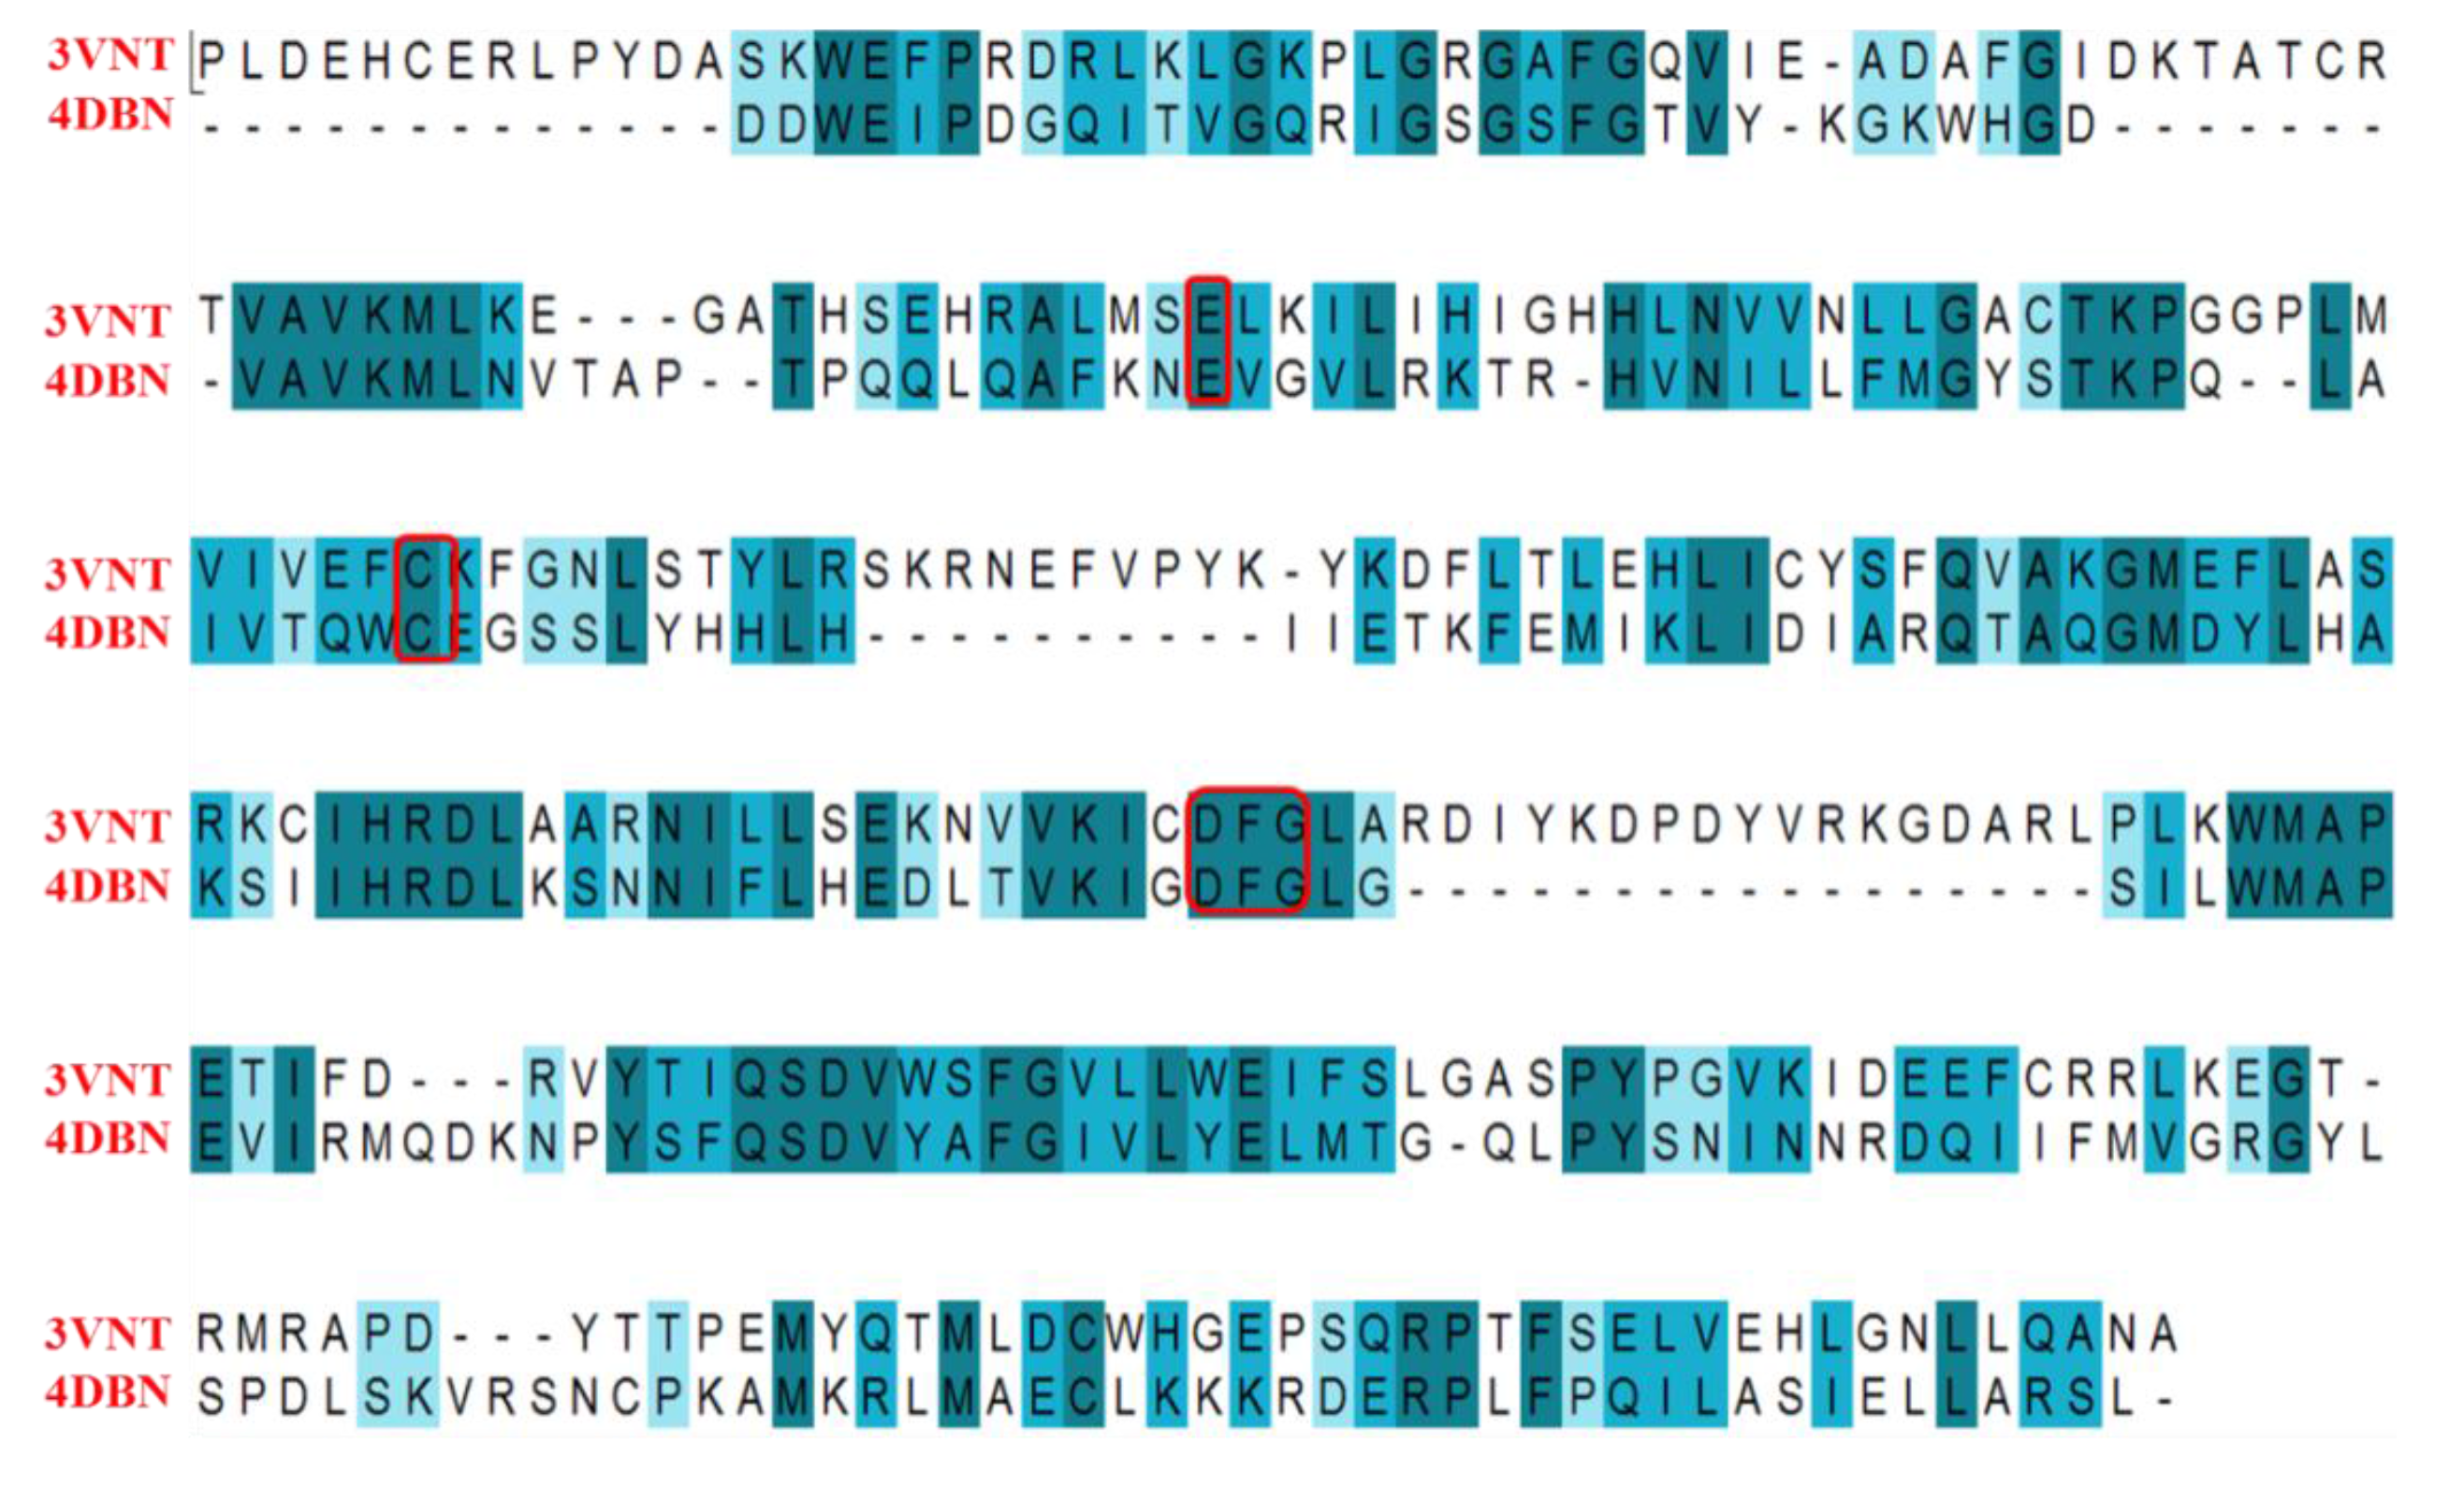
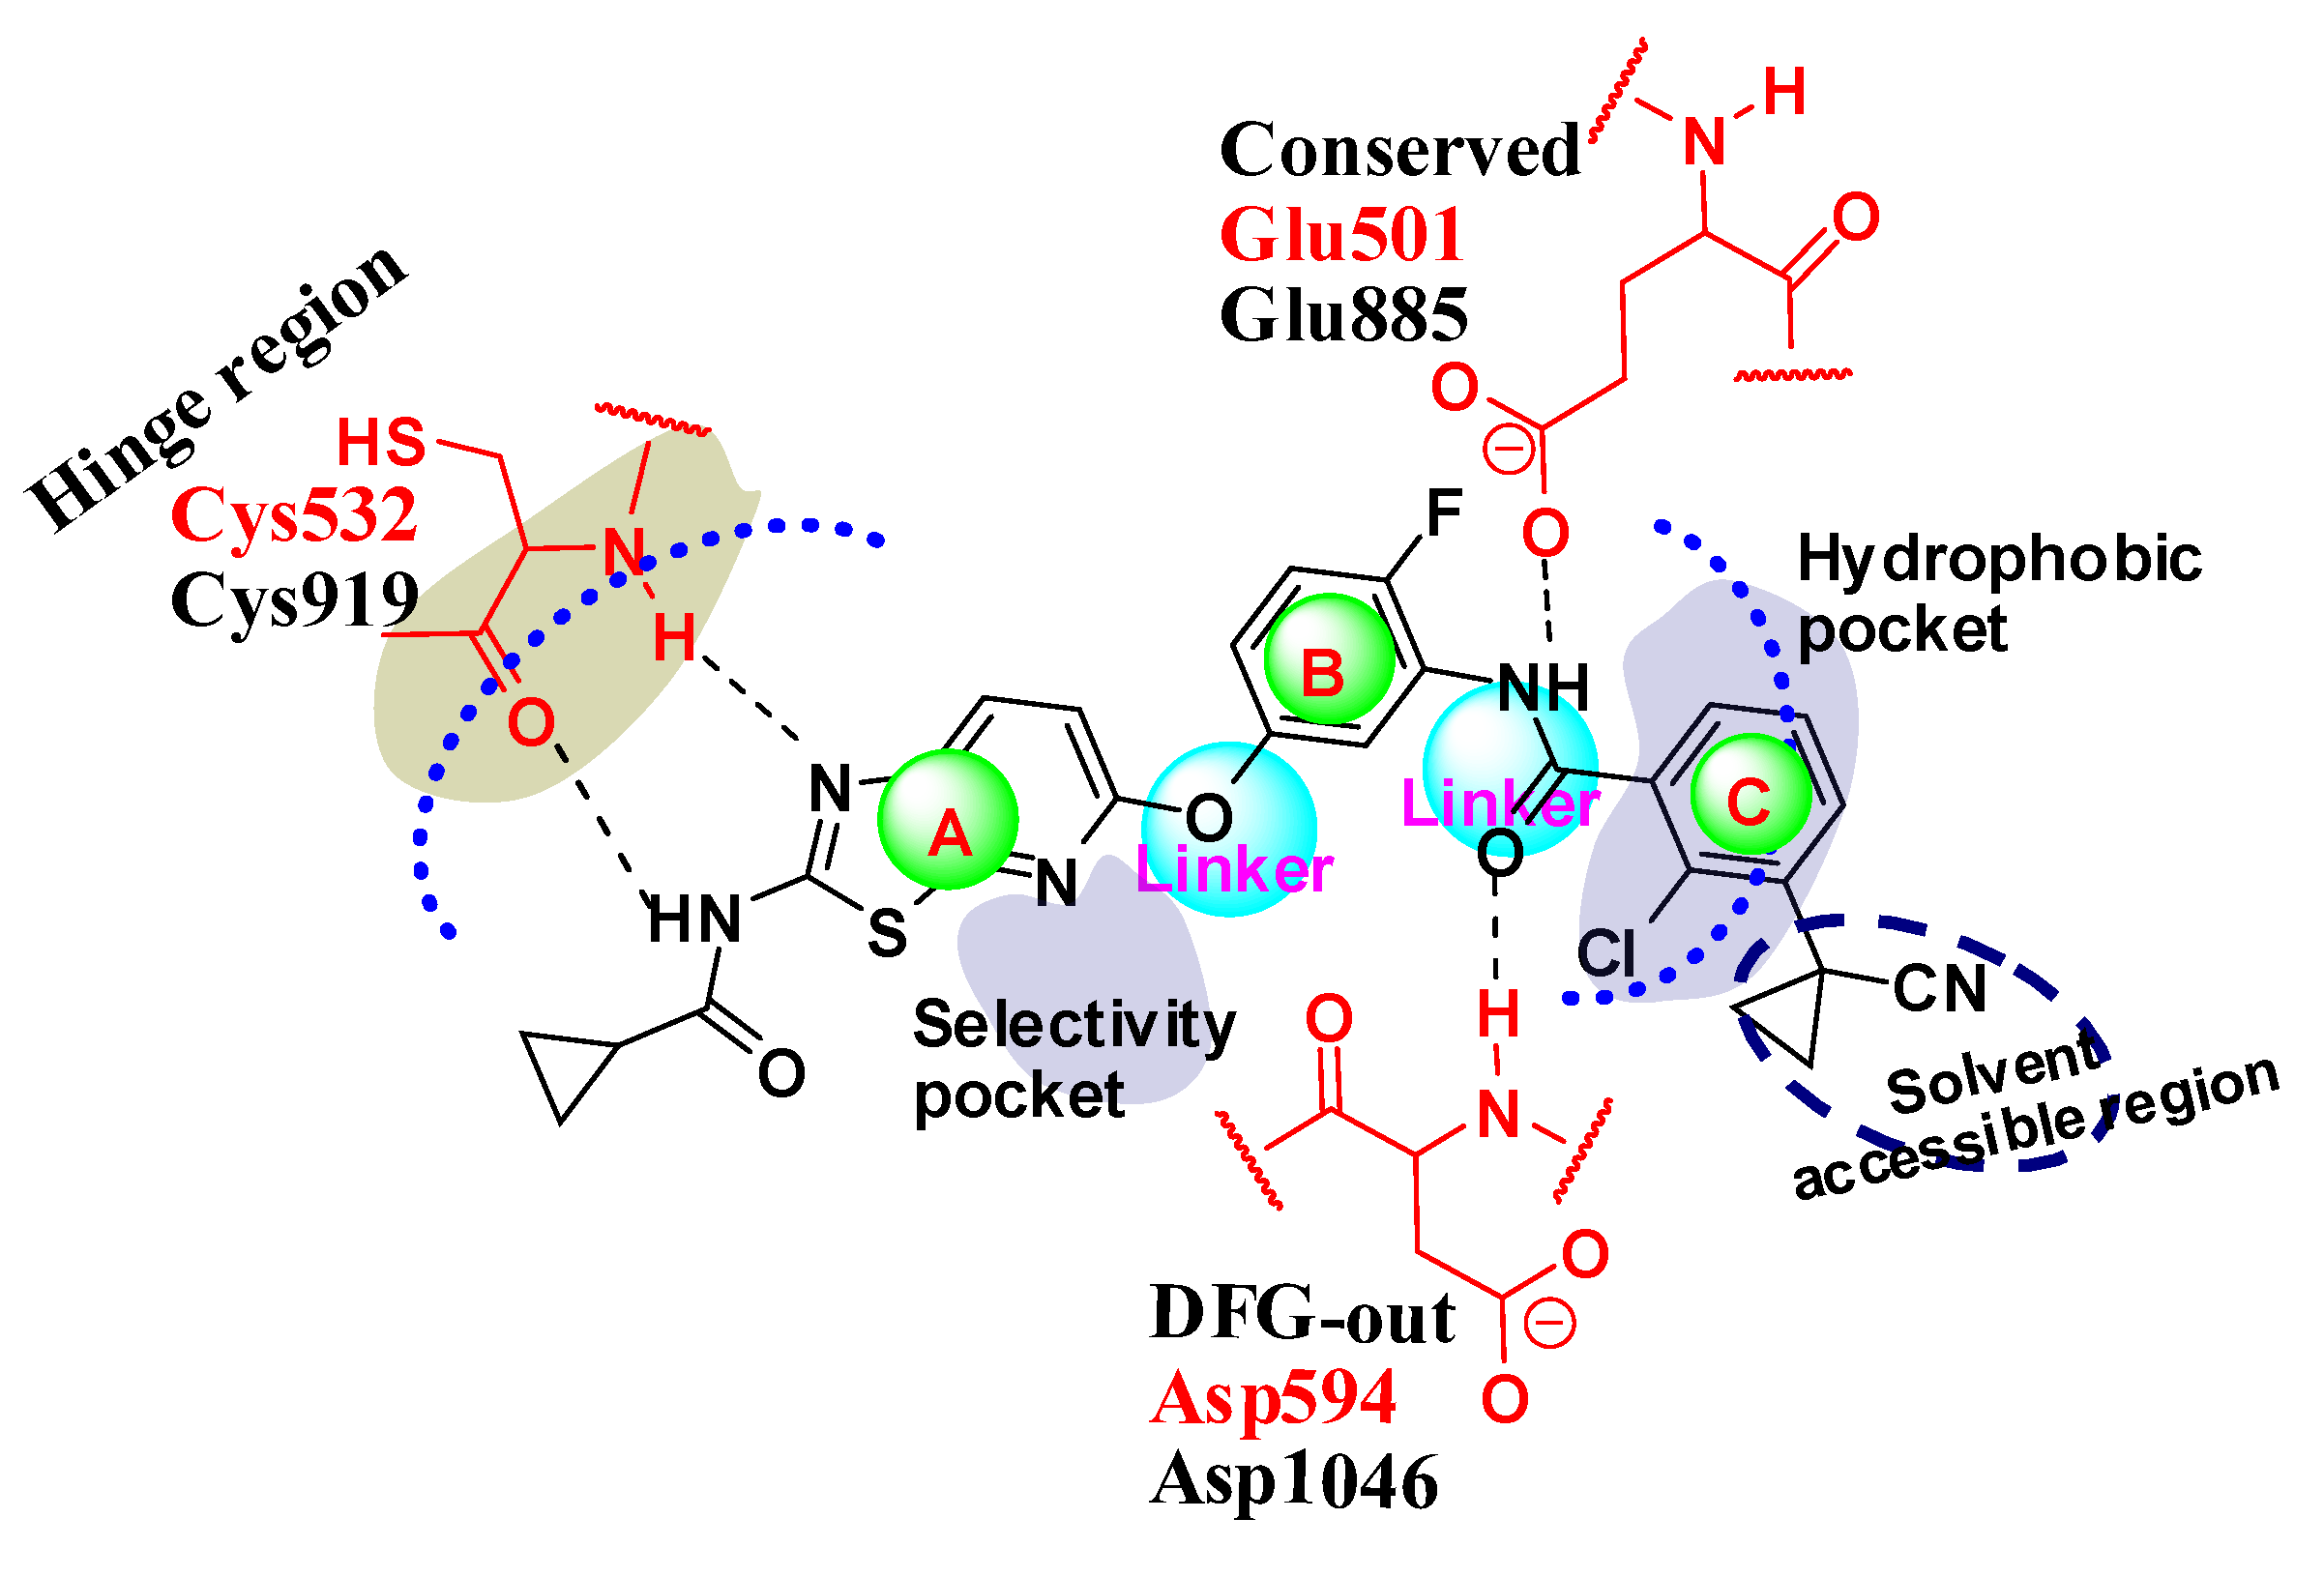
2.1. Structure Alignment Analyses

| PDB Code | Resolution (Å) | Ligand Code | IC50 (nM) | G_Score | RMSD (Å) |
|---|---|---|---|---|---|
| 4DBN | 3.15 | 0JA | 7 | −13.04 | 0.4967 |
| 3VNT | 1.64 | 0JA | 2.2 | −14.69 | 0.2836 |
 | ||||||||
|---|---|---|---|---|---|---|---|---|
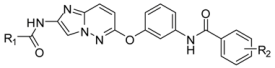
| Compound | R1 | R2 | Kinase IC50 (nM) | |||||
| B-RafV600E | VEGFR2 | |||||||
| 1-1 * |  |  | 43 | 3.1 | ||||
| 1-2 |  | | 4.1 | 1.1 | ||||
| 1-3 |  | | 6.9 | 1.7 | ||||
| 1-4 |  | | 7.6 | 1.9 | ||||
| 1-5 |  | | 28 | 4.8 | ||||
| 1-6 |  | | 44 | 9.3 | ||||
| 1-7 | |  | 81 | 1.9 | ||||
| 1-8 | |  | 3700 | 1.4 | ||||
| 1-9 | |  | 18 | 0.31 | ||||
| 1-10 | |  | 15 | 1.8 | ||||
| 1-11 | |  | 10 | 0.82 | ||||
| 1-12 | |  | 14 | 1.5 | ||||
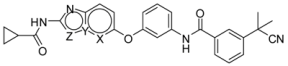 | ||||||||
| Compound | Ring | Kinase IC50 (nM) | ||||||
| B-RafV600E | VEGFR2 | |||||||
| 2-1 |  | 49 | 1.8 | |||||
| 2-2 |  | 41 | 8.1 | |||||
| 2-3 |  | 17 | 3.1 | |||||
| 2-4 |  | 200 | 2.4 | |||||
| 2-5 * |  | 25 | 14 | |||||
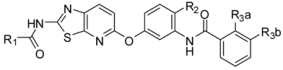 | ||||||||
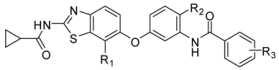
| Compound | R1 | R2 |  | Kinase IC50 (nM) | ||||
| B-RafV6°°E | VEGFR2 | |||||||
| 3-1 | | H |  | 3.0 | 2.2 | |||
| 3-2 | | H |  | 9.0 | 4.0 | |||
| 3-3 * | | F | | 7.0 | 2.2 | |||
| 3-4 | | Cl | | 43 | 7.5 | |||
| 3-5 | | F | | 6.3 | 3.4 | |||
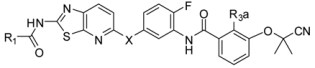 | ||||||||
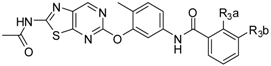
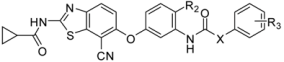
| Compound | R1 | X | R3a | Kinase IC50 (nM) | ||||
| B-RafV600E | VEGFR2 | |||||||
| 3-6 | | N-Me | H | 23 | 10 | |||
| 3-7 | | N-Me | Cl | 45 | 14 | |||
| 3-8 * | | N-Me | Cl | 38 | 7.5 | |||
 | ||||||||
| Compound | | Kinase IC50 (nM) | ||||||
| B-RafV600E | VEGFR2 | |||||||
| 4-1 |  | 51 | 410 | |||||
| 4-2 |  | 100 | 300 | |||||
| 4-3 |  | 73 | 510 | |||||
 | ||||||||
| Compound | R1 | R2 | R3 | Kinase IC50 (nM) | ||||
| B-RafV600E | VEGFR2 | |||||||
| 5-1 | NO2 | H | m-C(CH3)2CN | 25 | 70 | |||
| 5-2 | CN | H | m-C(CH3)2CN | 13 | 76 | |||
| 5-3 * | CO2Me | H | m-C(CH3)2CN | 12 | 33 | |||
| 5-4 | CH2OH | H | m-C(CH3)2CN | 24 | 7.4 | |||
 | ||||||||
| Compound | X | R2 | R3 | Kinase IC50 (nM) | ||||
| B-RafV600E | VEGFR2 | |||||||
| 6-1 * | NH | H | o-CF3 | 19 | 120 | |||
| 6-2 * | NH | H | p-CF3 | 18 | 330 | |||
| 6-3 | NH | F | m-CF3 | 49 | 730 | |||
| 6-4 | >NH | >F | >p-CF3 | >26 | >660 | |||
| | ||||||||
| Compound | X | R2 | R3 | Kinase IC50 (nM) | ||||
| B-RafV600E | VEGFR2 | |||||||
| 6-5 | CH2 | H | o-CF3 | 14 | 100 | |||
| 6-6 | CH2 | H | m-CF3 | 1.3 | 150 | |||
| 6-7 | CH2 | H | p-CF3 | 9.5 | 190 | |||
| 6-8 | CH2 | F | m-CF3 | 2.4 | 160 | |||
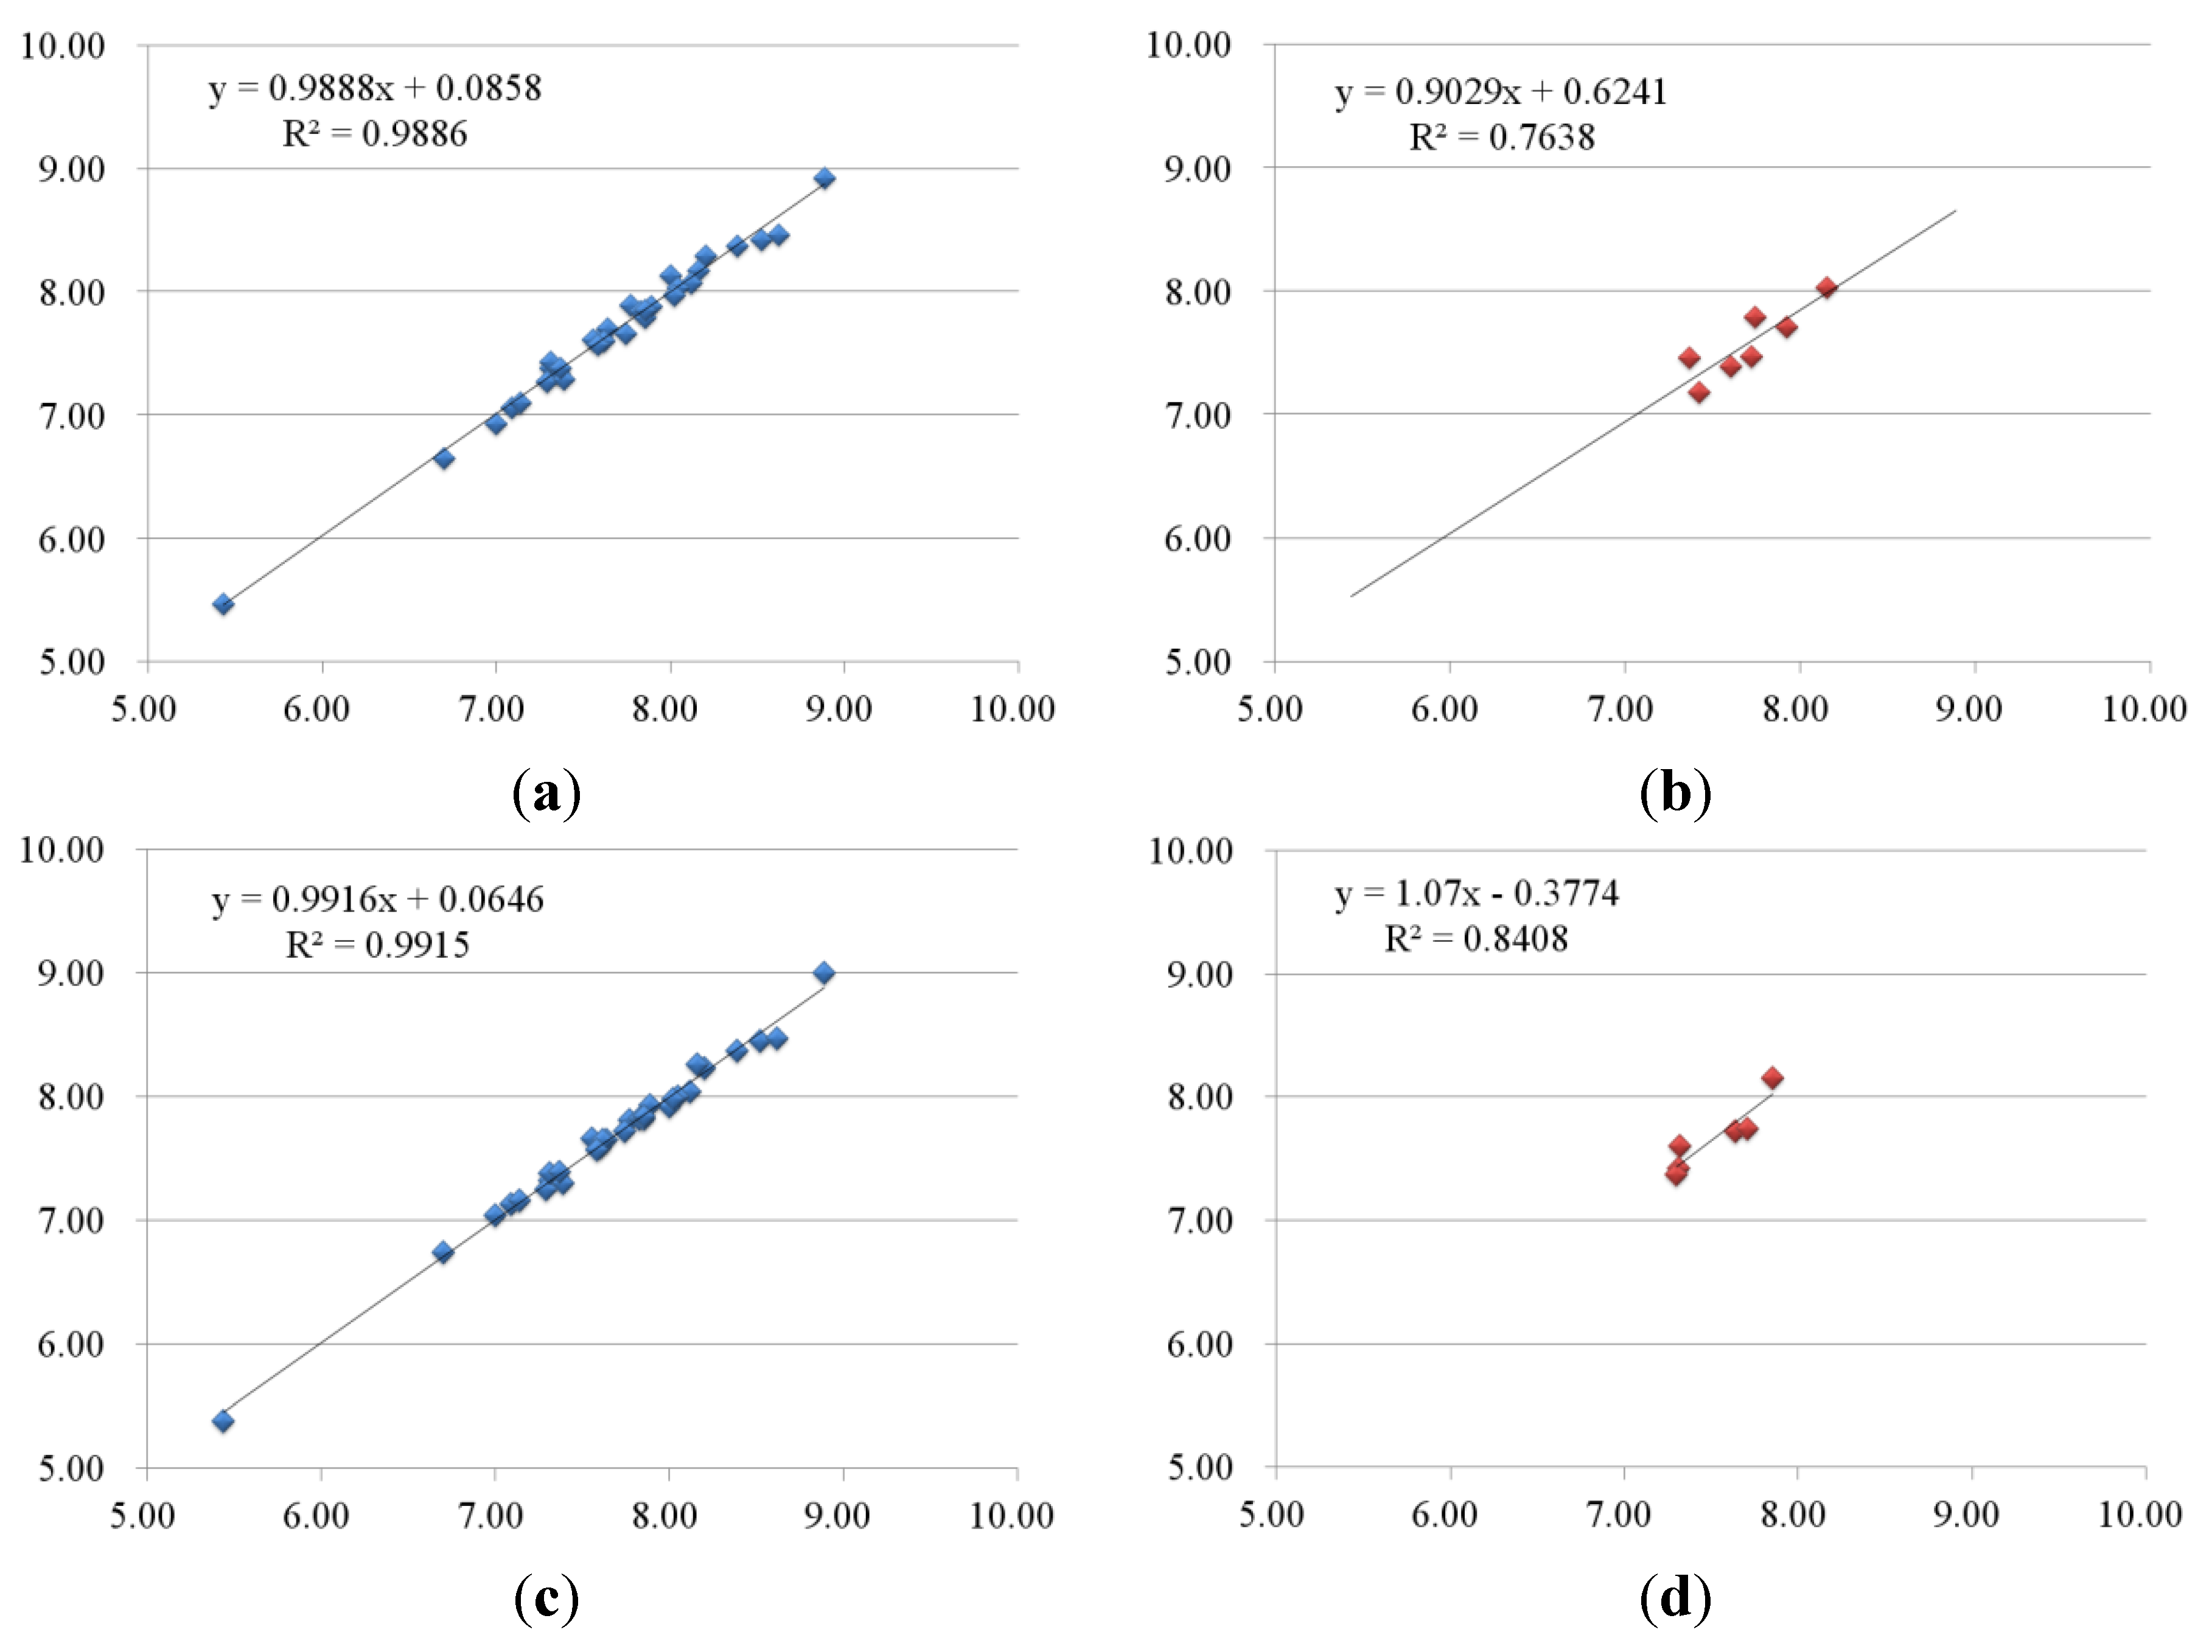
2.2. 3D-QSAR Analyses
| Statistical Parameters | B-Raf | KDR | ||
|---|---|---|---|---|
| CoMFA | CoMSIA | CoMFA | CoMSIA | |
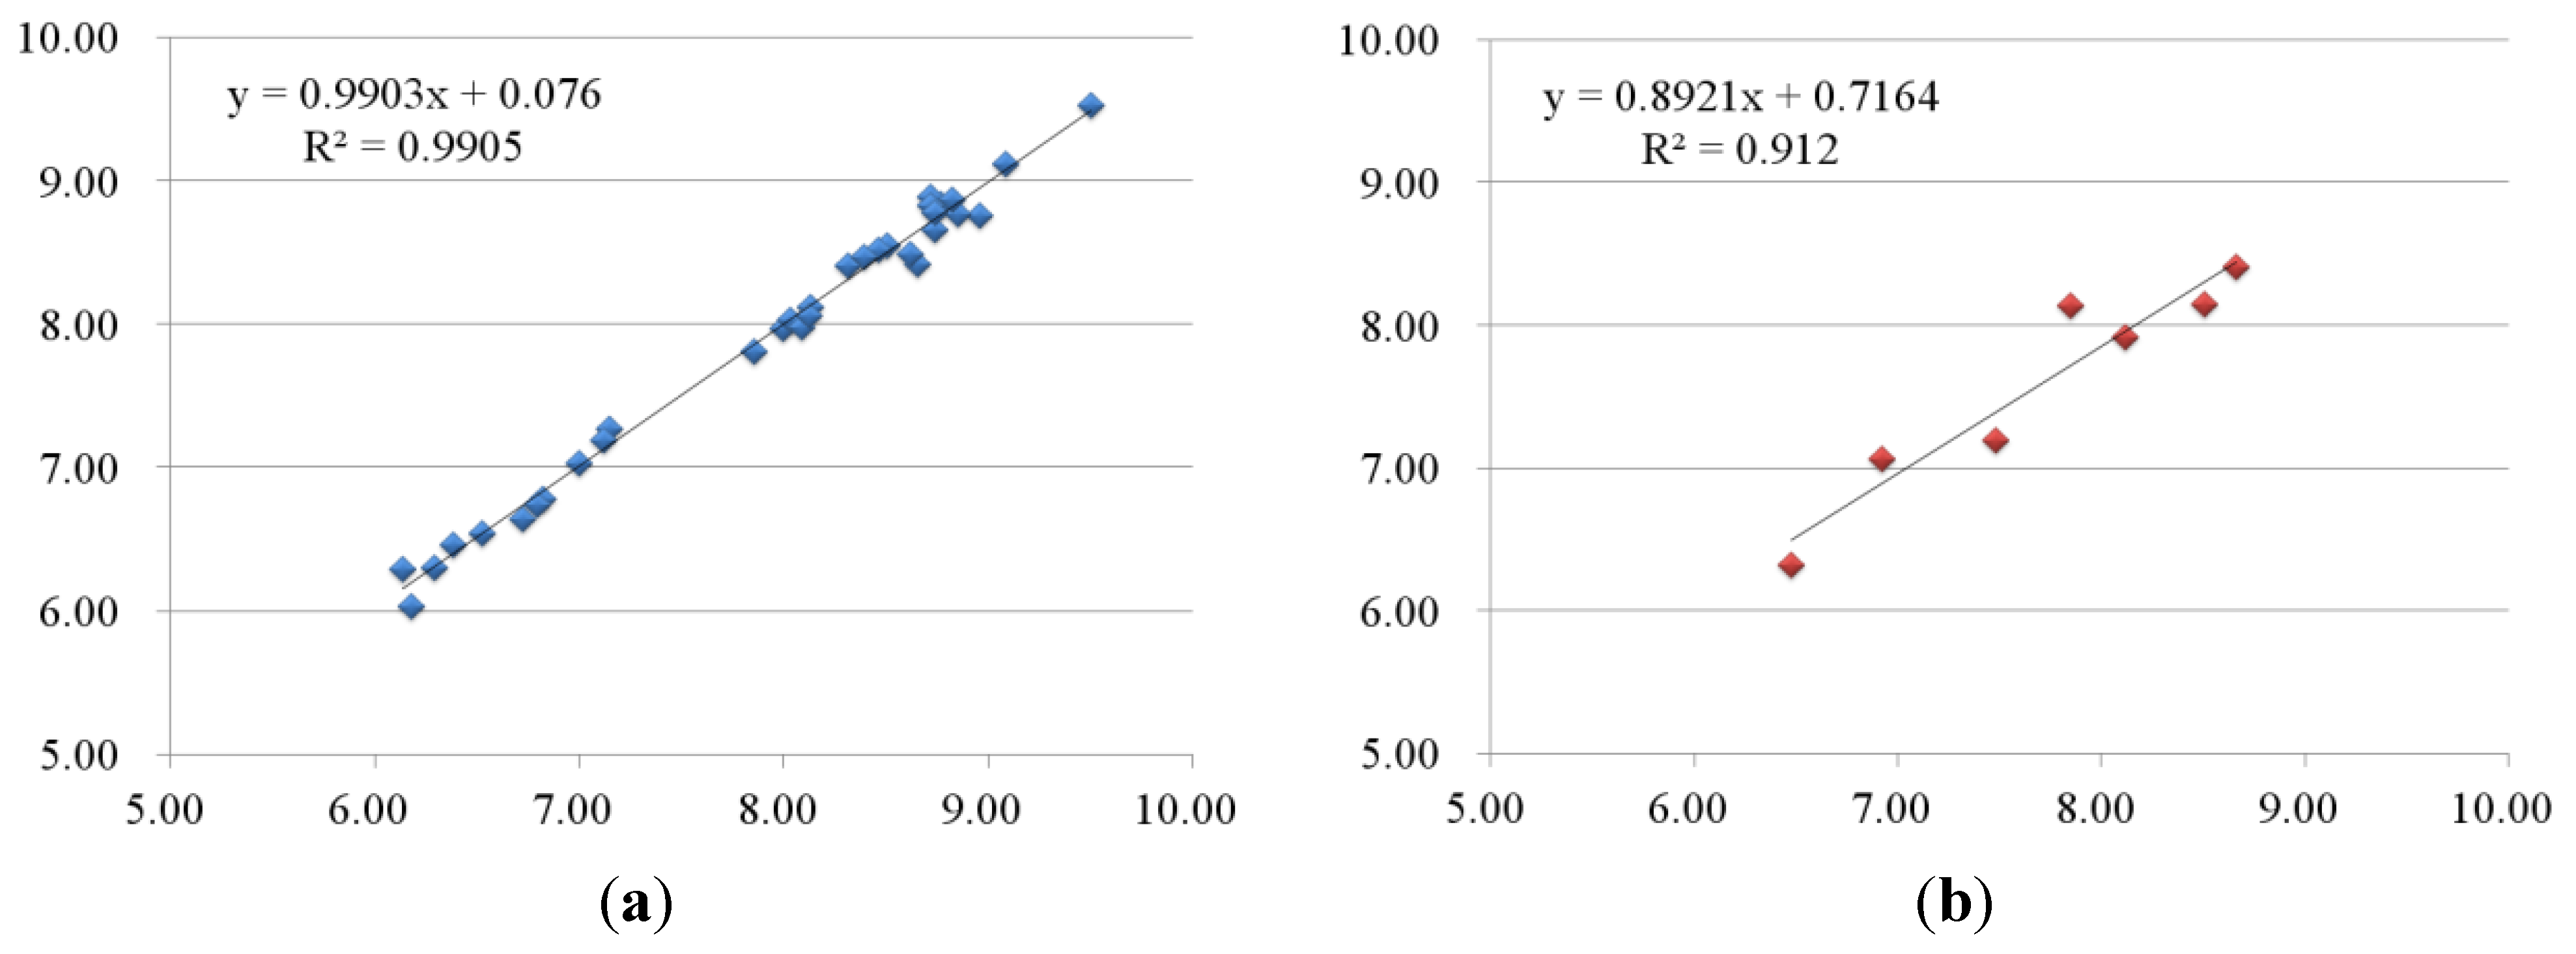
| q2 | 0.542 | 0.519 | 0.768 | 0.849 |
| N | 6 | 9 | 6 | 6 |
| r2 | 0.989 | 0.992 | 0.991 | 0.993 |
| SEE | 0.075 | 0.068 | 0.107 | 0.089 |
| F-value | 376.623 | 299.397 | 453.385 | 649.012 |
| r2pred | 0.764 | 0.841 | 0.912 | 0.846 |
| Field contributions | ||||
| Steric | 0.457 | 0.179 | 0.486 | 0.107 |
| Electrostatic | 0.543 | 0.356 | 0.514 | 0.334 |
| Hydrophobic | 0.256 | 0.271 | ||
| Hydrogen Bond Donor | ||||
| Hydrogen Bond Acceptor | 0.210 | 0.288 | ||
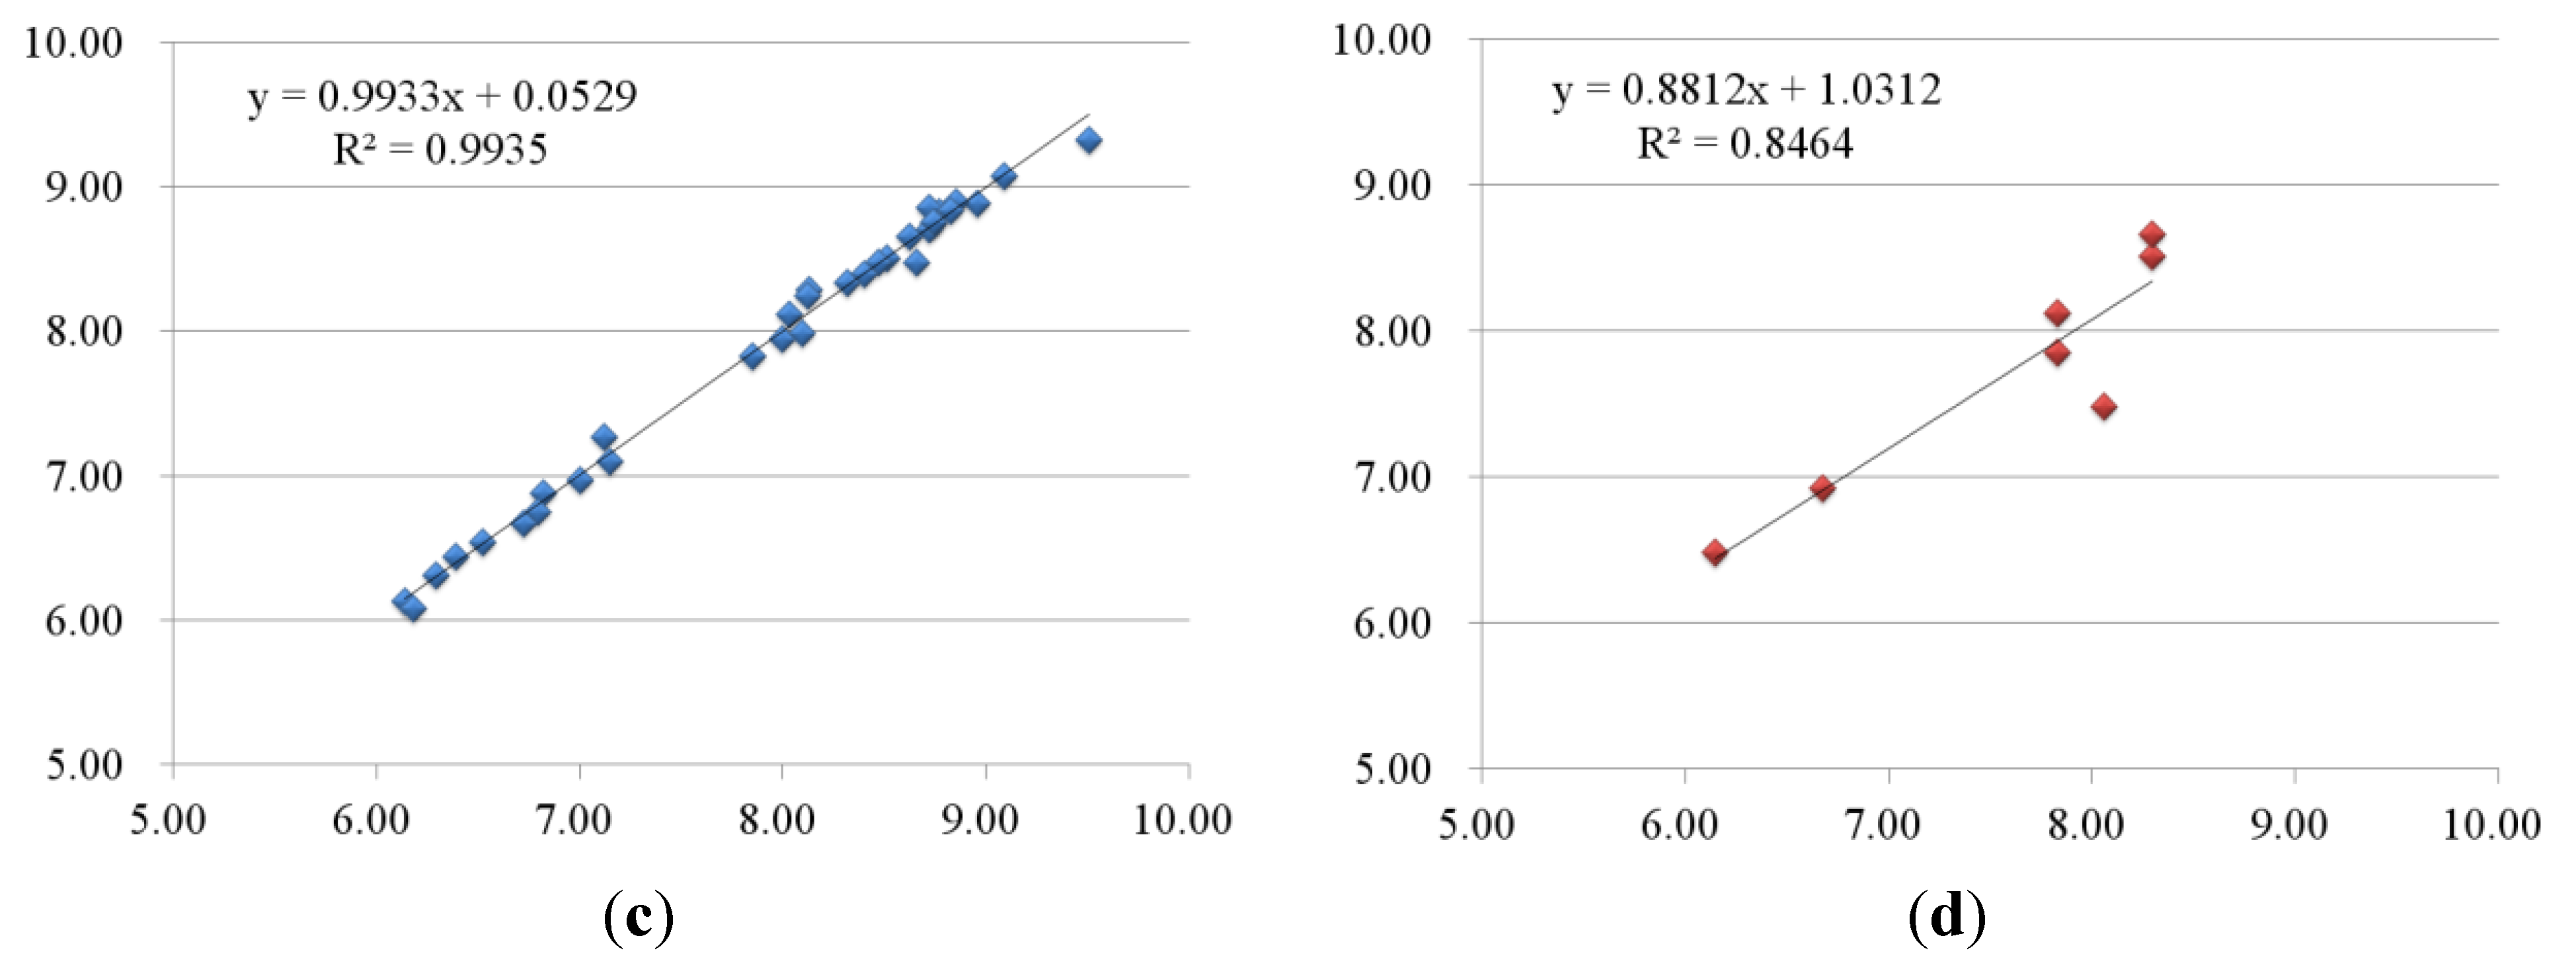
2.2.1. 3D-QSAR Results for B-Raf Kinase
| No. | B-Raf | KDR | ||||||||
|---|---|---|---|---|---|---|---|---|---|---|
| Actual pIC50 | CoMFA | CoMSIA | Actual pIC50 | CoMFA | CoMSIA | |||||
| pIC50 | Res. | pIC50 | Res. | pIC50 | Res. | pIC50 | Res. | |||
| Training set | ||||||||||
| 1-2 | 8.39 | 8.38 | 0.01 | 8.37 | 0.02 | 8.96 | 8.76 | 0.2 | 8.89 | 0.07 |
| 1-3 | 8.16 | 8.18 | −0.02 | 8.27 | −0.11 | 8.77 | 8.84 | −0.07 | 8.82 | −0.05 |
| 1-4 | 8.12 | 8.07 | 0.05 | 8.04 | 0.08 | 8.72 | 8.90 | −0.18 | 8.70 | 0.02 |
| 1-5 | 7.55 | 7.61 | −0.06 | 7.66 | −0.11 | 8.32 | 8.41 | −0.09 | 8.33 | −0.01 |
| 1-6 | 7.36 | 7.35 | 0.01 | 7.35 | 0.01 | 8.03 | 8.04 | −0.01 | 8.12 | −0.09 |
| 1-7 | 7.09 | 7.06 | 0.03 | 7.13 | −0.04 | 8.72 | 8.83 | −0.11 | 8.86 | −0.14 |
| 1-8 | 5.43 | 5.47 | −0.04 | 5.38 | 0.05 | 8.85 | 8.77 | 0.08 | 8.89 | −0.04 |
| 1-9 | 7.74 | 7.66 | 0.08 | 7.73 | 0.01 | 9.51 | 9.53 | −0.02 | 9.32 | 0.19 |
| 1-10 | 7.82 | 7.85 | −0.03 | 7.82 | 0 | 8.74 | 8.78 | −0.04 | 8.75 | −0.01 |
| 1-11 | 8.00 | 8.14 | −0.14 | 7.92 | 0.08 | 9.09 | 9.12 | −0.03 | 9.08 | 0.01 |
| 1-12 | 7.85 | 7.80 | 0.05 | 7.82 | 0.03 | 8.82 | 8.87 | −0.05 | 8.83 | −0.01 |
| 2-1 | 7.31 | 7.39 | −0.08 | 7.32 | −0.01 | 8.74 | 8.66 | 0.08 | 8.75 | −0.01 |
| 2-2 | 7.39 | 7.29 | 0.1 | 7.30 | 0.09 | 8.09 | 7.99 | 0.1 | 7.98 | 0.11 |
| 2-3 | 7.77 | 7.89 | −0.12 | 7.81 | −0.04 | 8.51 | 8.55 | −0.04 | 8.50 | 0.01 |
| 2-4 | 6.70 | 6.65 | 0.05 | 6.74 | −0.04 | 8.62 | 8.49 | 0.13 | 8.65 | −0.03 |
| 3-1 | 8.52 | 8.42 | 0.1 | 8.45 | 0.07 | 8.66 | 8.42 | 0.24 | 8.48 | 0.18 |
| 3-2 | 8.05 | 8.03 | 0.02 | 8.00 | 0.05 | 8.40 | 8.47 | −0.07 | 8.39 | 0.01 |
| 3-4 | 7.37 | 7.38 | −0.01 | 7.39 | −0.02 | 8.12 | 8.06 | 0.06 | 8.24 | −0.12 |
| 3-5 | 8.20 | 8.29 | −0.09 | 8.23 | −0.03 | 8.47 | 8.52 | −0.05 | 8.48 | −0.01 |
| 3-6 | 7.64 | 7.70 | −0.06 | 7.66 | −0.02 | 8.00 | 7.98 | 0.02 | 7.95 | 0.05 |
| 3-7 | 7.35 | 7.36 | −0.01 | 7.35 | 0 | 7.85 | 7.81 | 0.04 | 7.83 | 0.02 |
| 4-1 | 7.29 | 7.27 | 0.02 | 7.25 | 0.04 | 6.39 | 6.47 | −0.08 | 6.44 | −0.05 |
| 4-2 | 7.00 | 6.94 | 0.06 | 7.04 | −0.04 | 6.52 | 6.55 | −0.03 | 6.54 | −0.02 |
| 4-3 | 7.14 | 7.11 | 0.03 | 7.16 | −0.02 | 6.29 | 6.31 | −0.02 | 6.31 | −0.02 |
| 5-1 | 7.60 | 7.63 | −0.03 | 7.60 | 0 | 7.15 | 7.28 | −0.13 | 7.10 | 0.05 |
| 5-2 | 7.89 | 7.88 | 0.01 | 7.93 | −0.04 | 7.12 | 7.19 | −0.07 | 7.27 | −0.15 |
| 5-4 | 7.62 | 7.61 | 0.01 | 7.65 | −0.03 | 8.13 | 8.12 | 0.01 | 8.29 | −0.16 |
| 6-3 | 7.31 | 7.43 | −0.12 | 7.38 | −0.07 | 6.14 | 6.30 | −0.16 | 6.13 | 0.01 |
| 6-4 | 7.59 | 7.58 | 0.01 | 7.58 | 0.01 | 6.18 | 6.04 | 0.14 | 6.08 | 0.1 |
| 6-5 | 7.85 | 7.85 | 0 | 7.85 | 0 | 7.00 | 7.03 | −0.03 | 6.97 | 0.03 |
| 6-6 | 8.89 | 8.93 | −0.04 | 9.00 | −0.11 | 6.82 | 6.79 | 0.03 | 6.88 | −0.06 |
| 6-7 | 8.02 | 7.98 | 0.04 | 7.98 | 0.04 | 6.72 | 6.65 | 0.07 | 6.67 | 0.05 |
| 6-8 | 8.62 | 8.46 | 0.16 | 8.47 | 0.15 | 6.80 | 6.75 | 0.05 | 6.75 | 0.05 |
| Test set | ||||||||||
| 1-1 | 7.37 | 7.46 | −0.09 | 7.30 | 0.07 | 8.51 | 8.15 | 0.36 | 8.29 | 0.22 |
| 2-5 | 7.60 | 7.40 | 0.2 | 7.32 | 0.28 | 7.85 | 8.14 | −0.29 | 7.83 | 0.02 |
| 3-3 | 8.15 | 8.03 | 0.12 | 7.85 | 0.3 | 8.66 | 8.41 | 0.25 | 8.29 | 0.37 |
| 3-8 | 7.42 | 7.18 | 0.24 | 7.31 | 0.11 | 8.12 | 7.92 | 0.2 | 7.83 | 0.29 |
| Training set | ||||||||||
| 5-3 | 7.92 | 7.72 | 0.2 | 7.35 | 0.57 | 7.48 | 7.20 | 0.28 | 8.06 | −0.58 |
| 6-1 | 7.72 | 7.47 | 0.25 | 7.64 | 0.08 | 6.92 | 7.06 | −0.14 | 6.67 | 0.25 |
| 6-2 | 7.74 | 7.80 | −0.06 | 7.71 | 0.03 | 6.48 | 6.33 | 0.15 | 6.14 | 0.34 |
2.2.2. 3D-QSAR Results for KDR Kinase
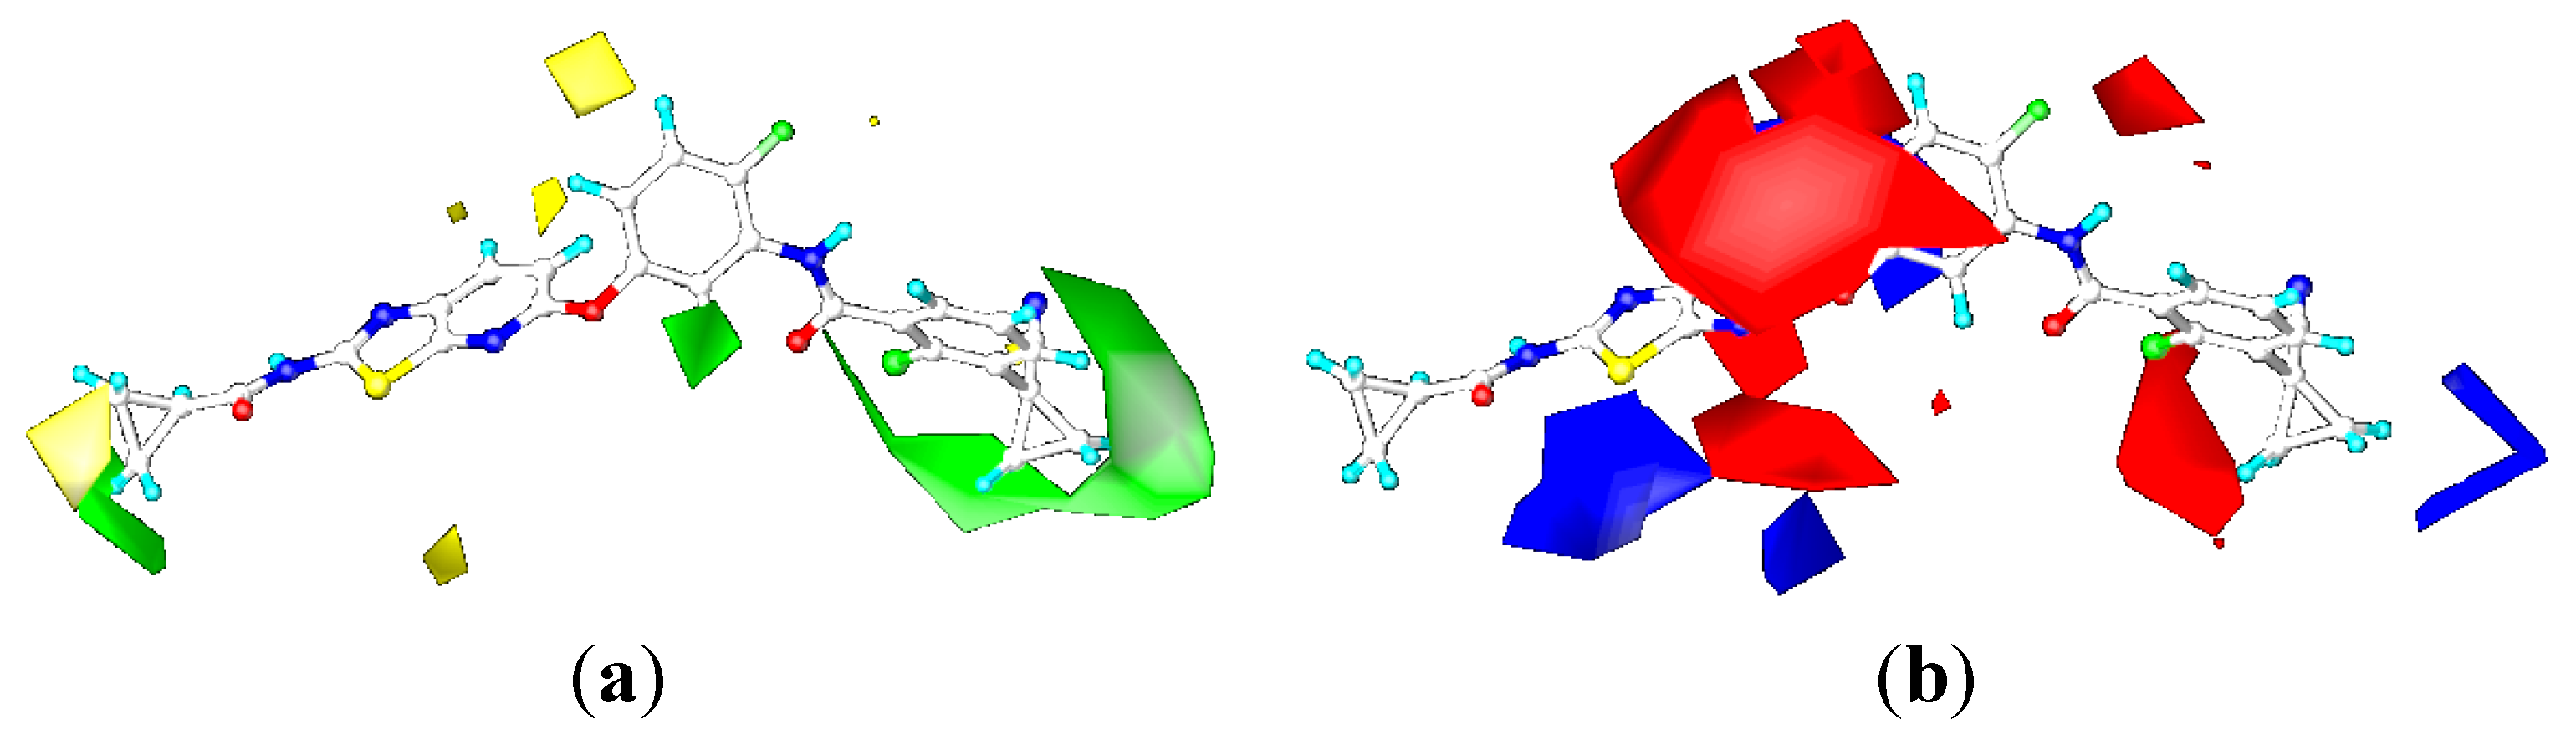
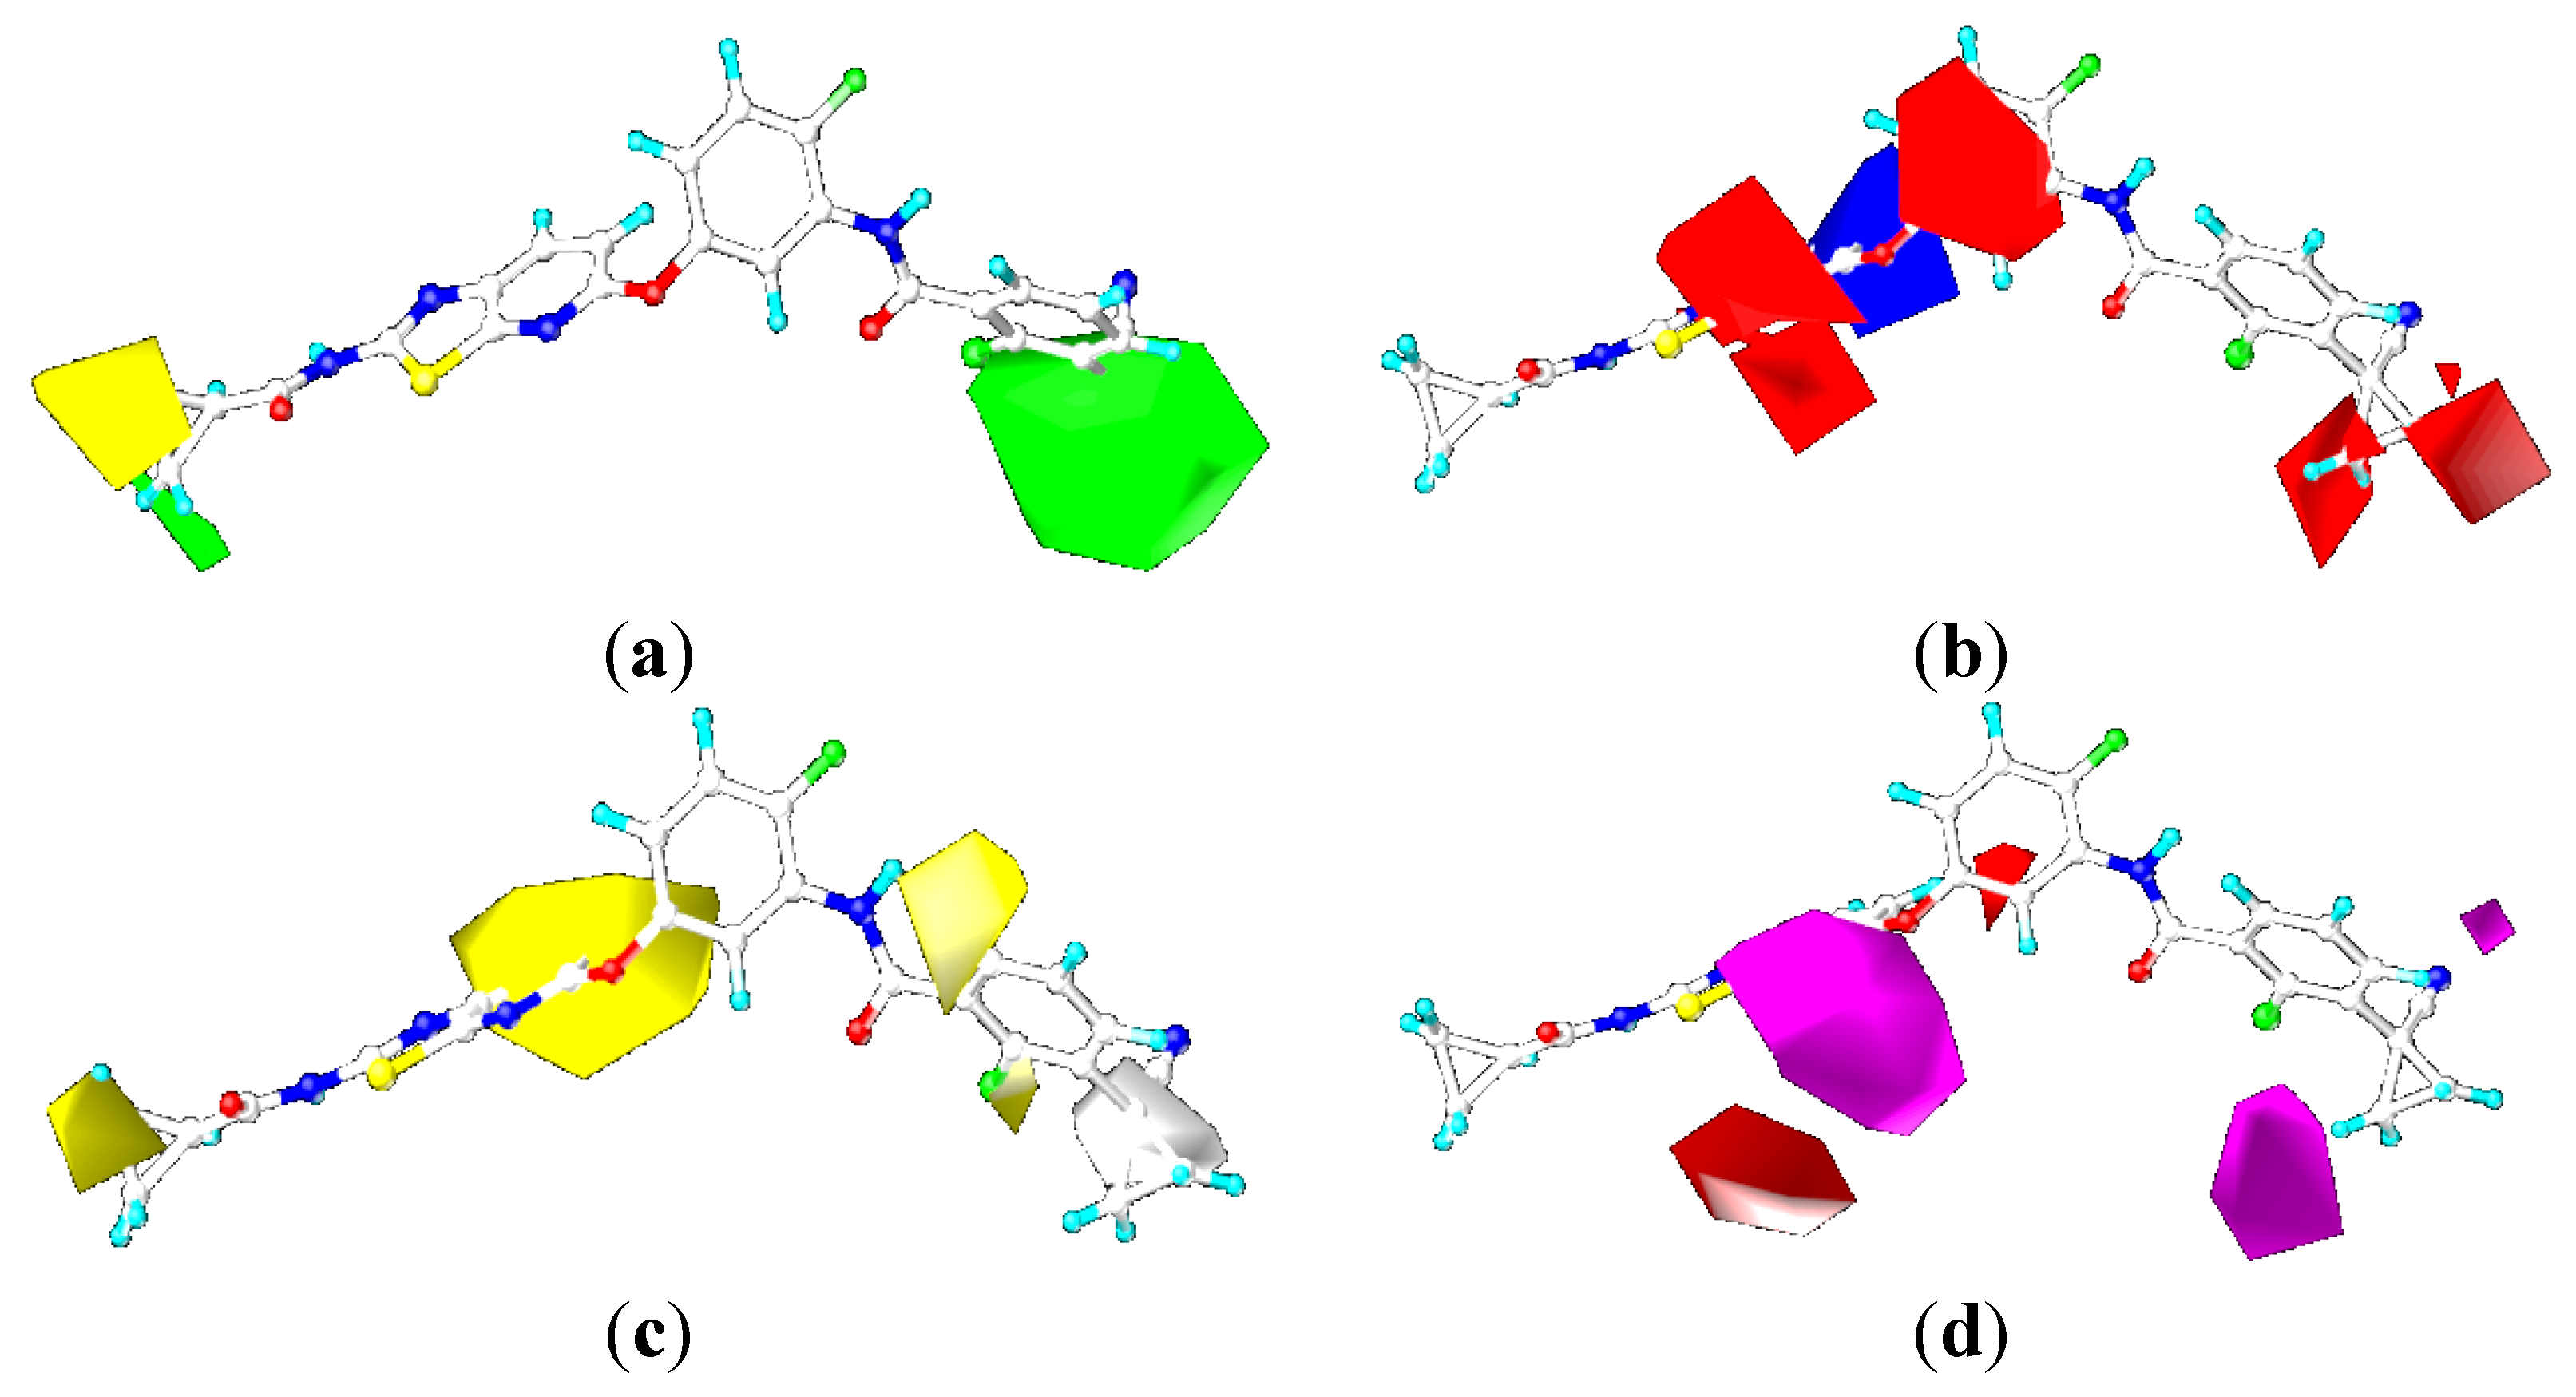
2.3. Contour Maps
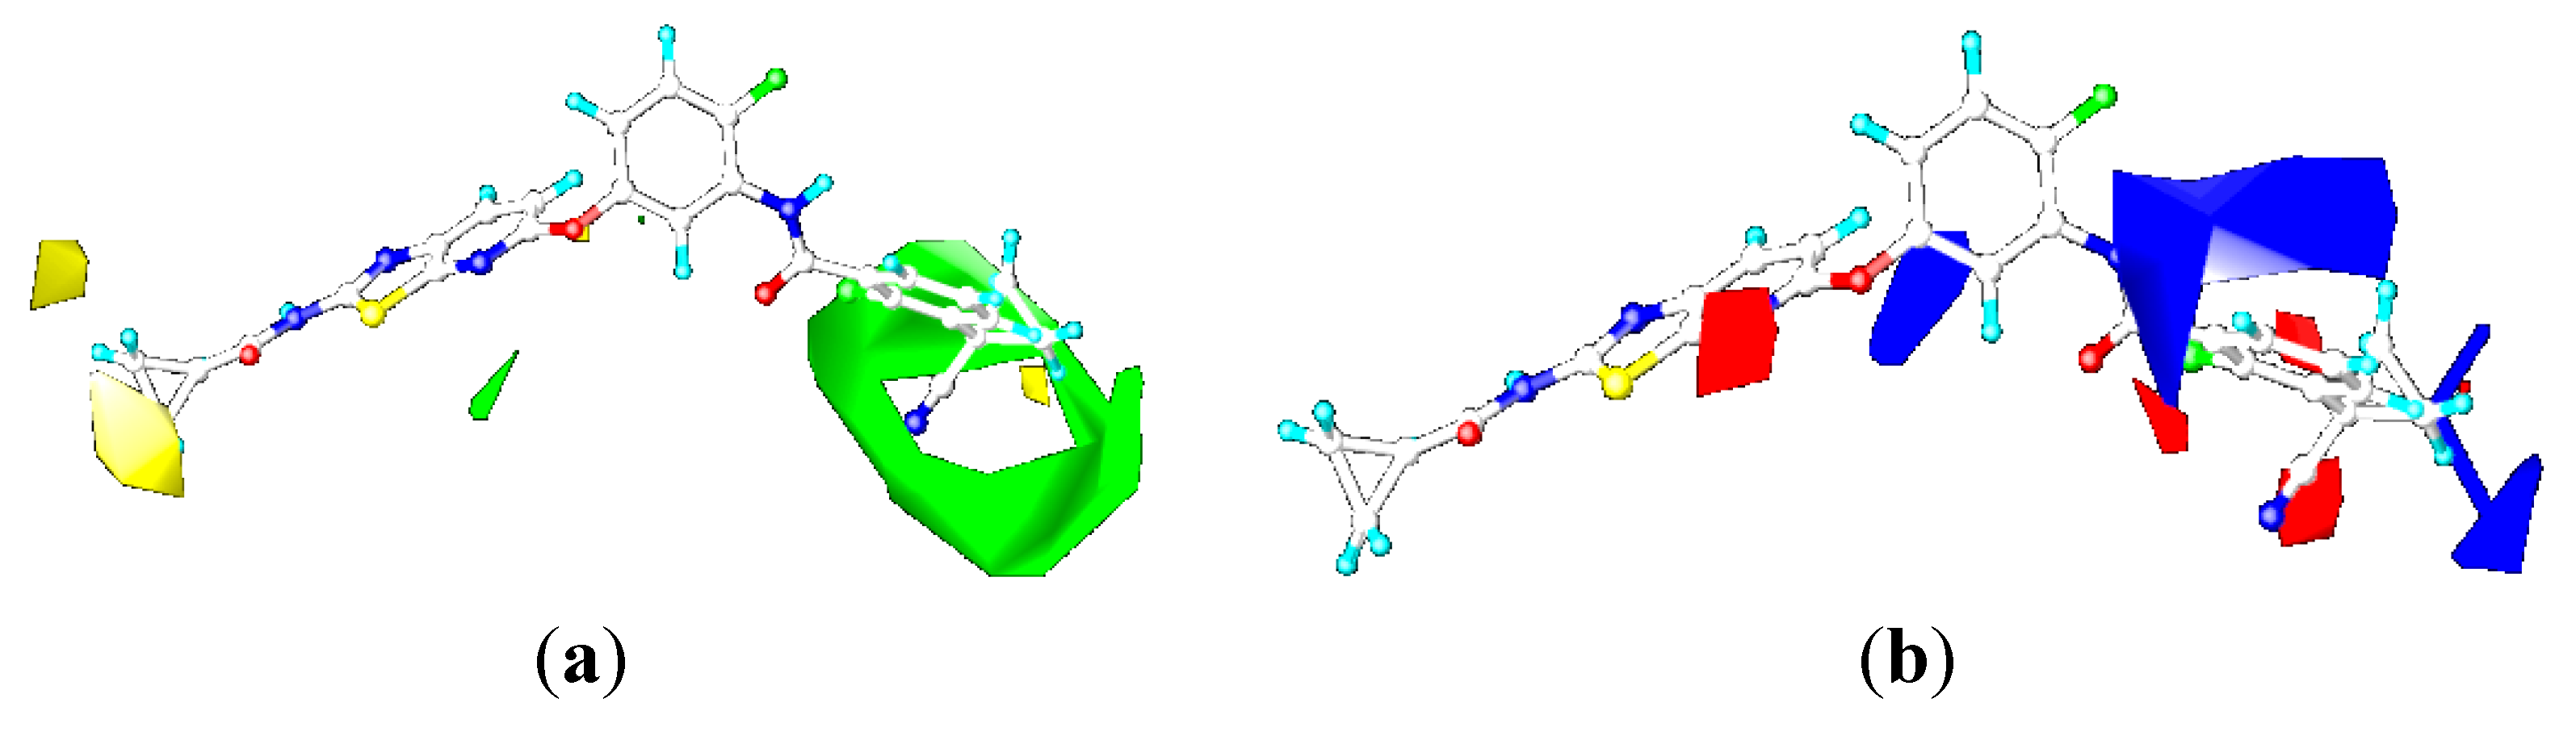
2.3.1. Contour Maps for B-Raf
CoMFA Contour Maps

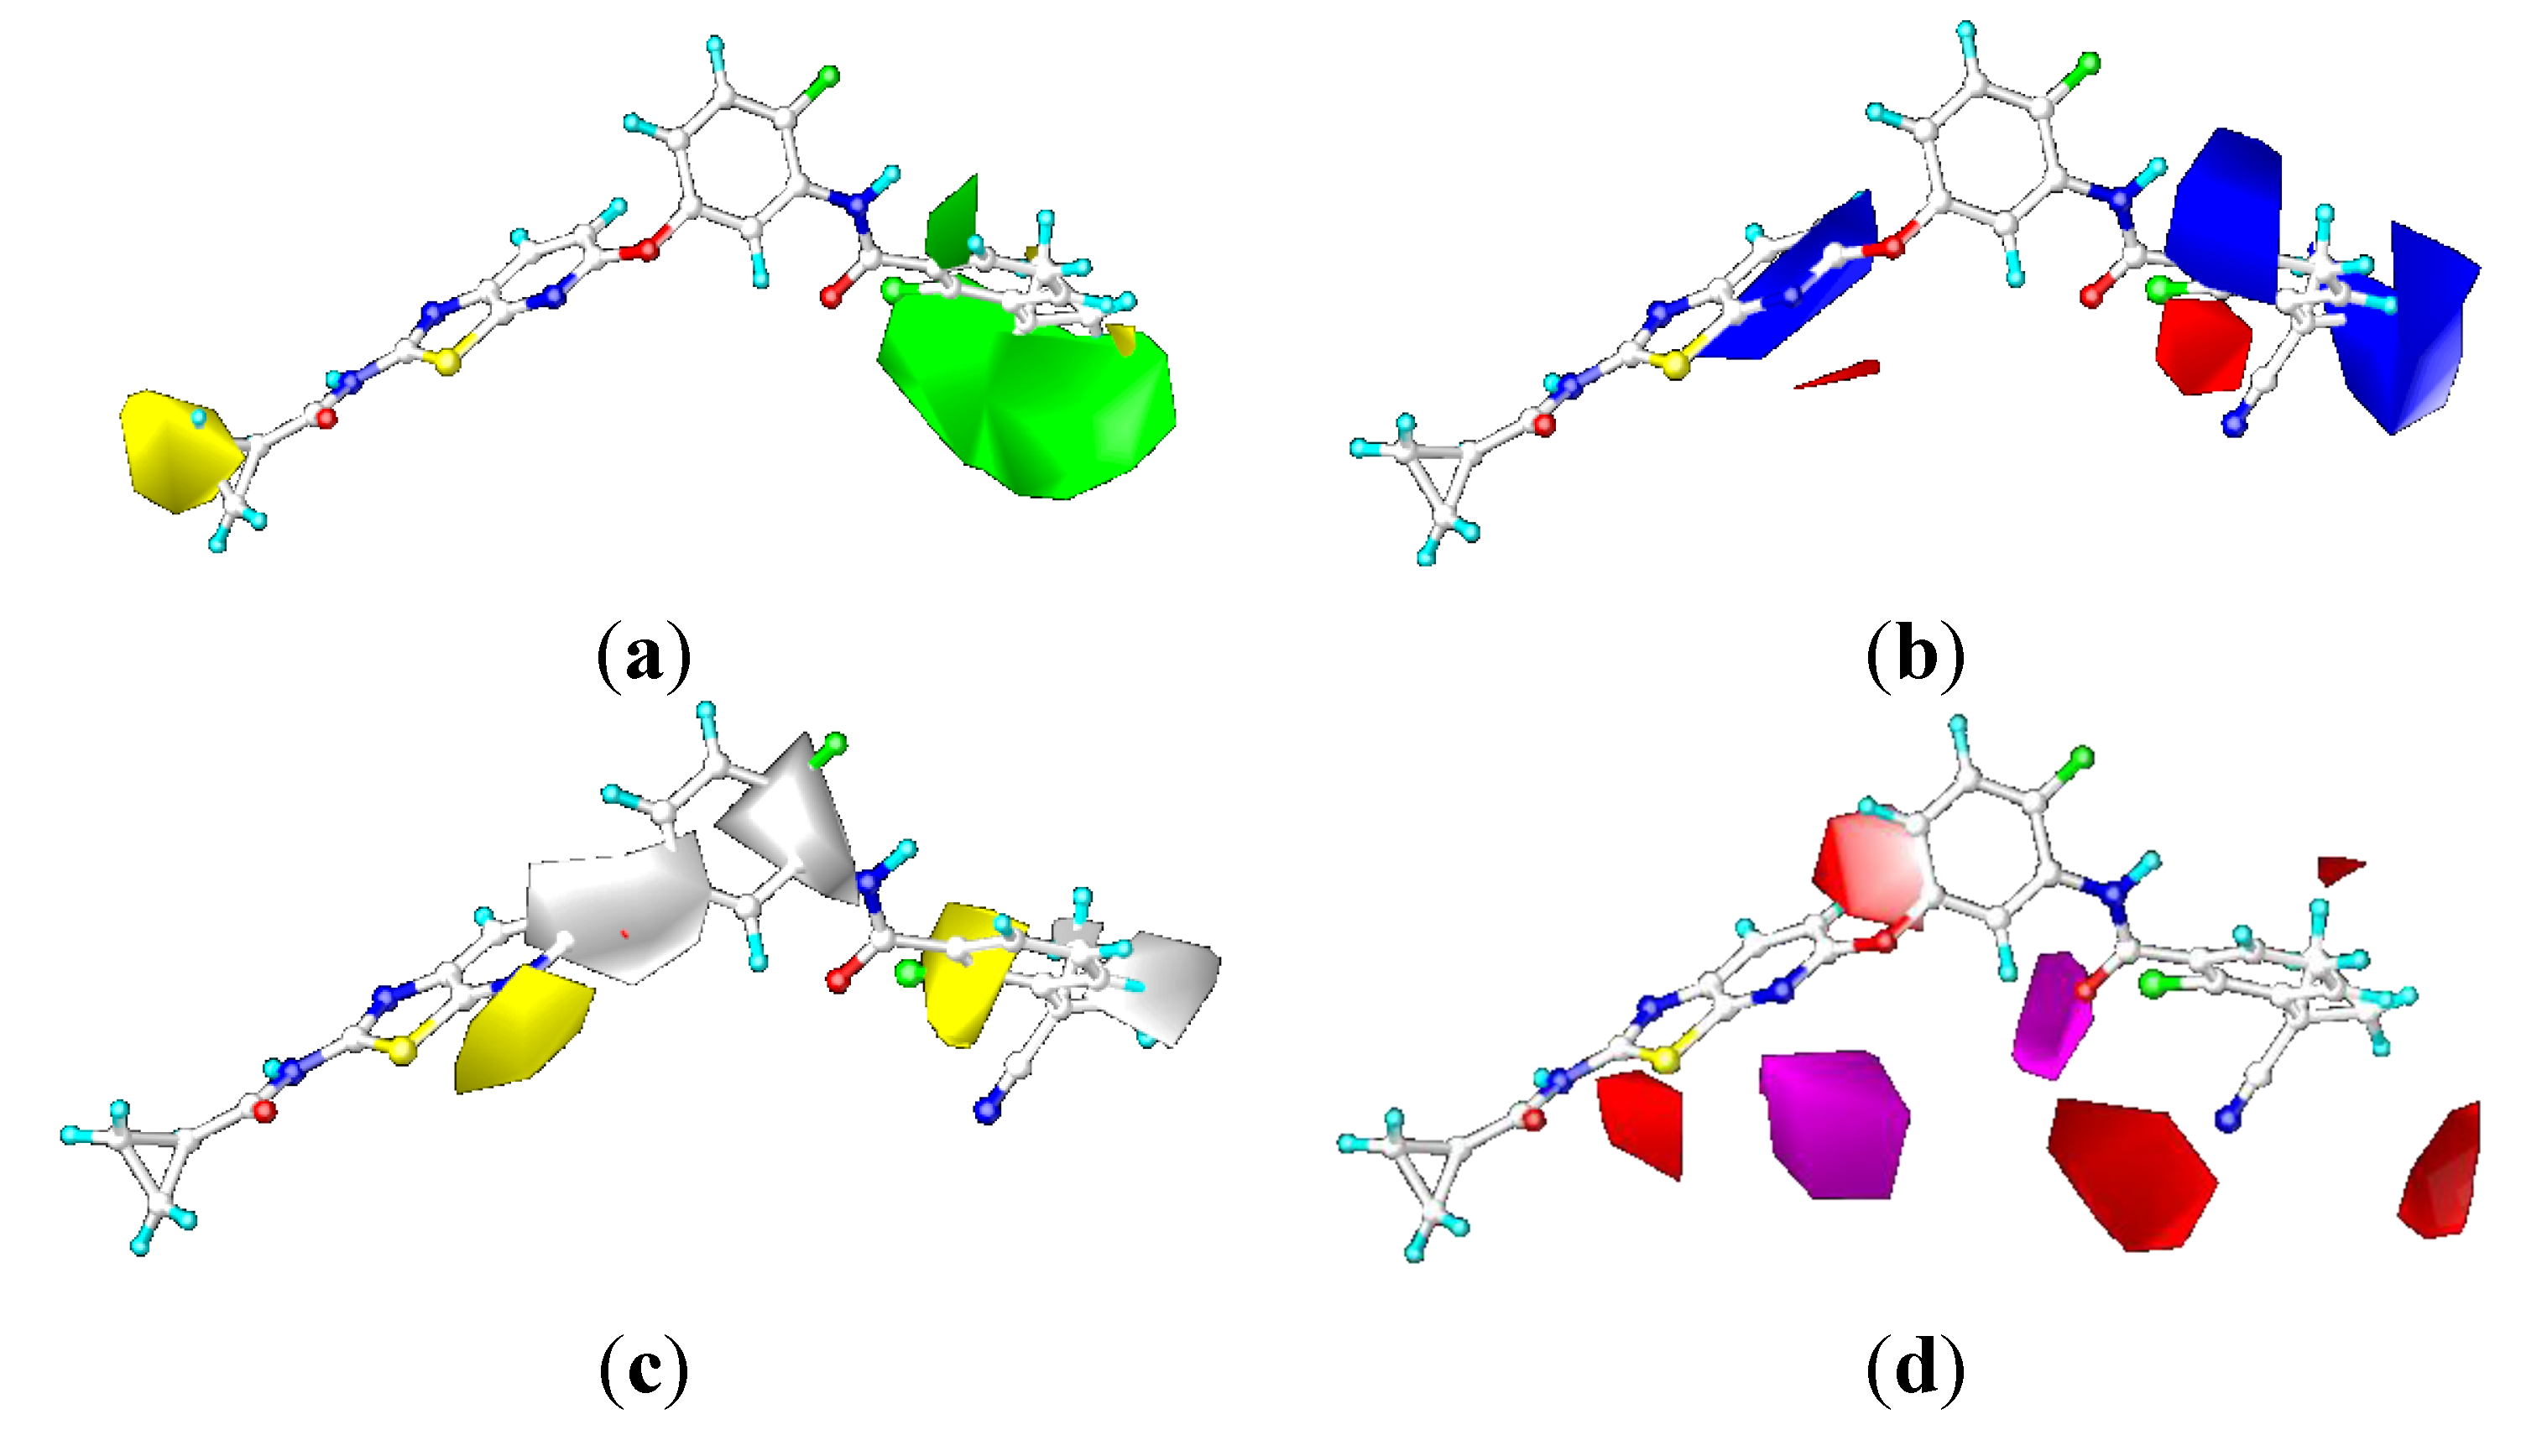
CoMSIA Contour Maps

2.3.2. Contour Maps for KDR
CoMFA Contour Maps

CoMSIA Contour Maps
2.4. Comparison for B-Raf and KDR Kinases
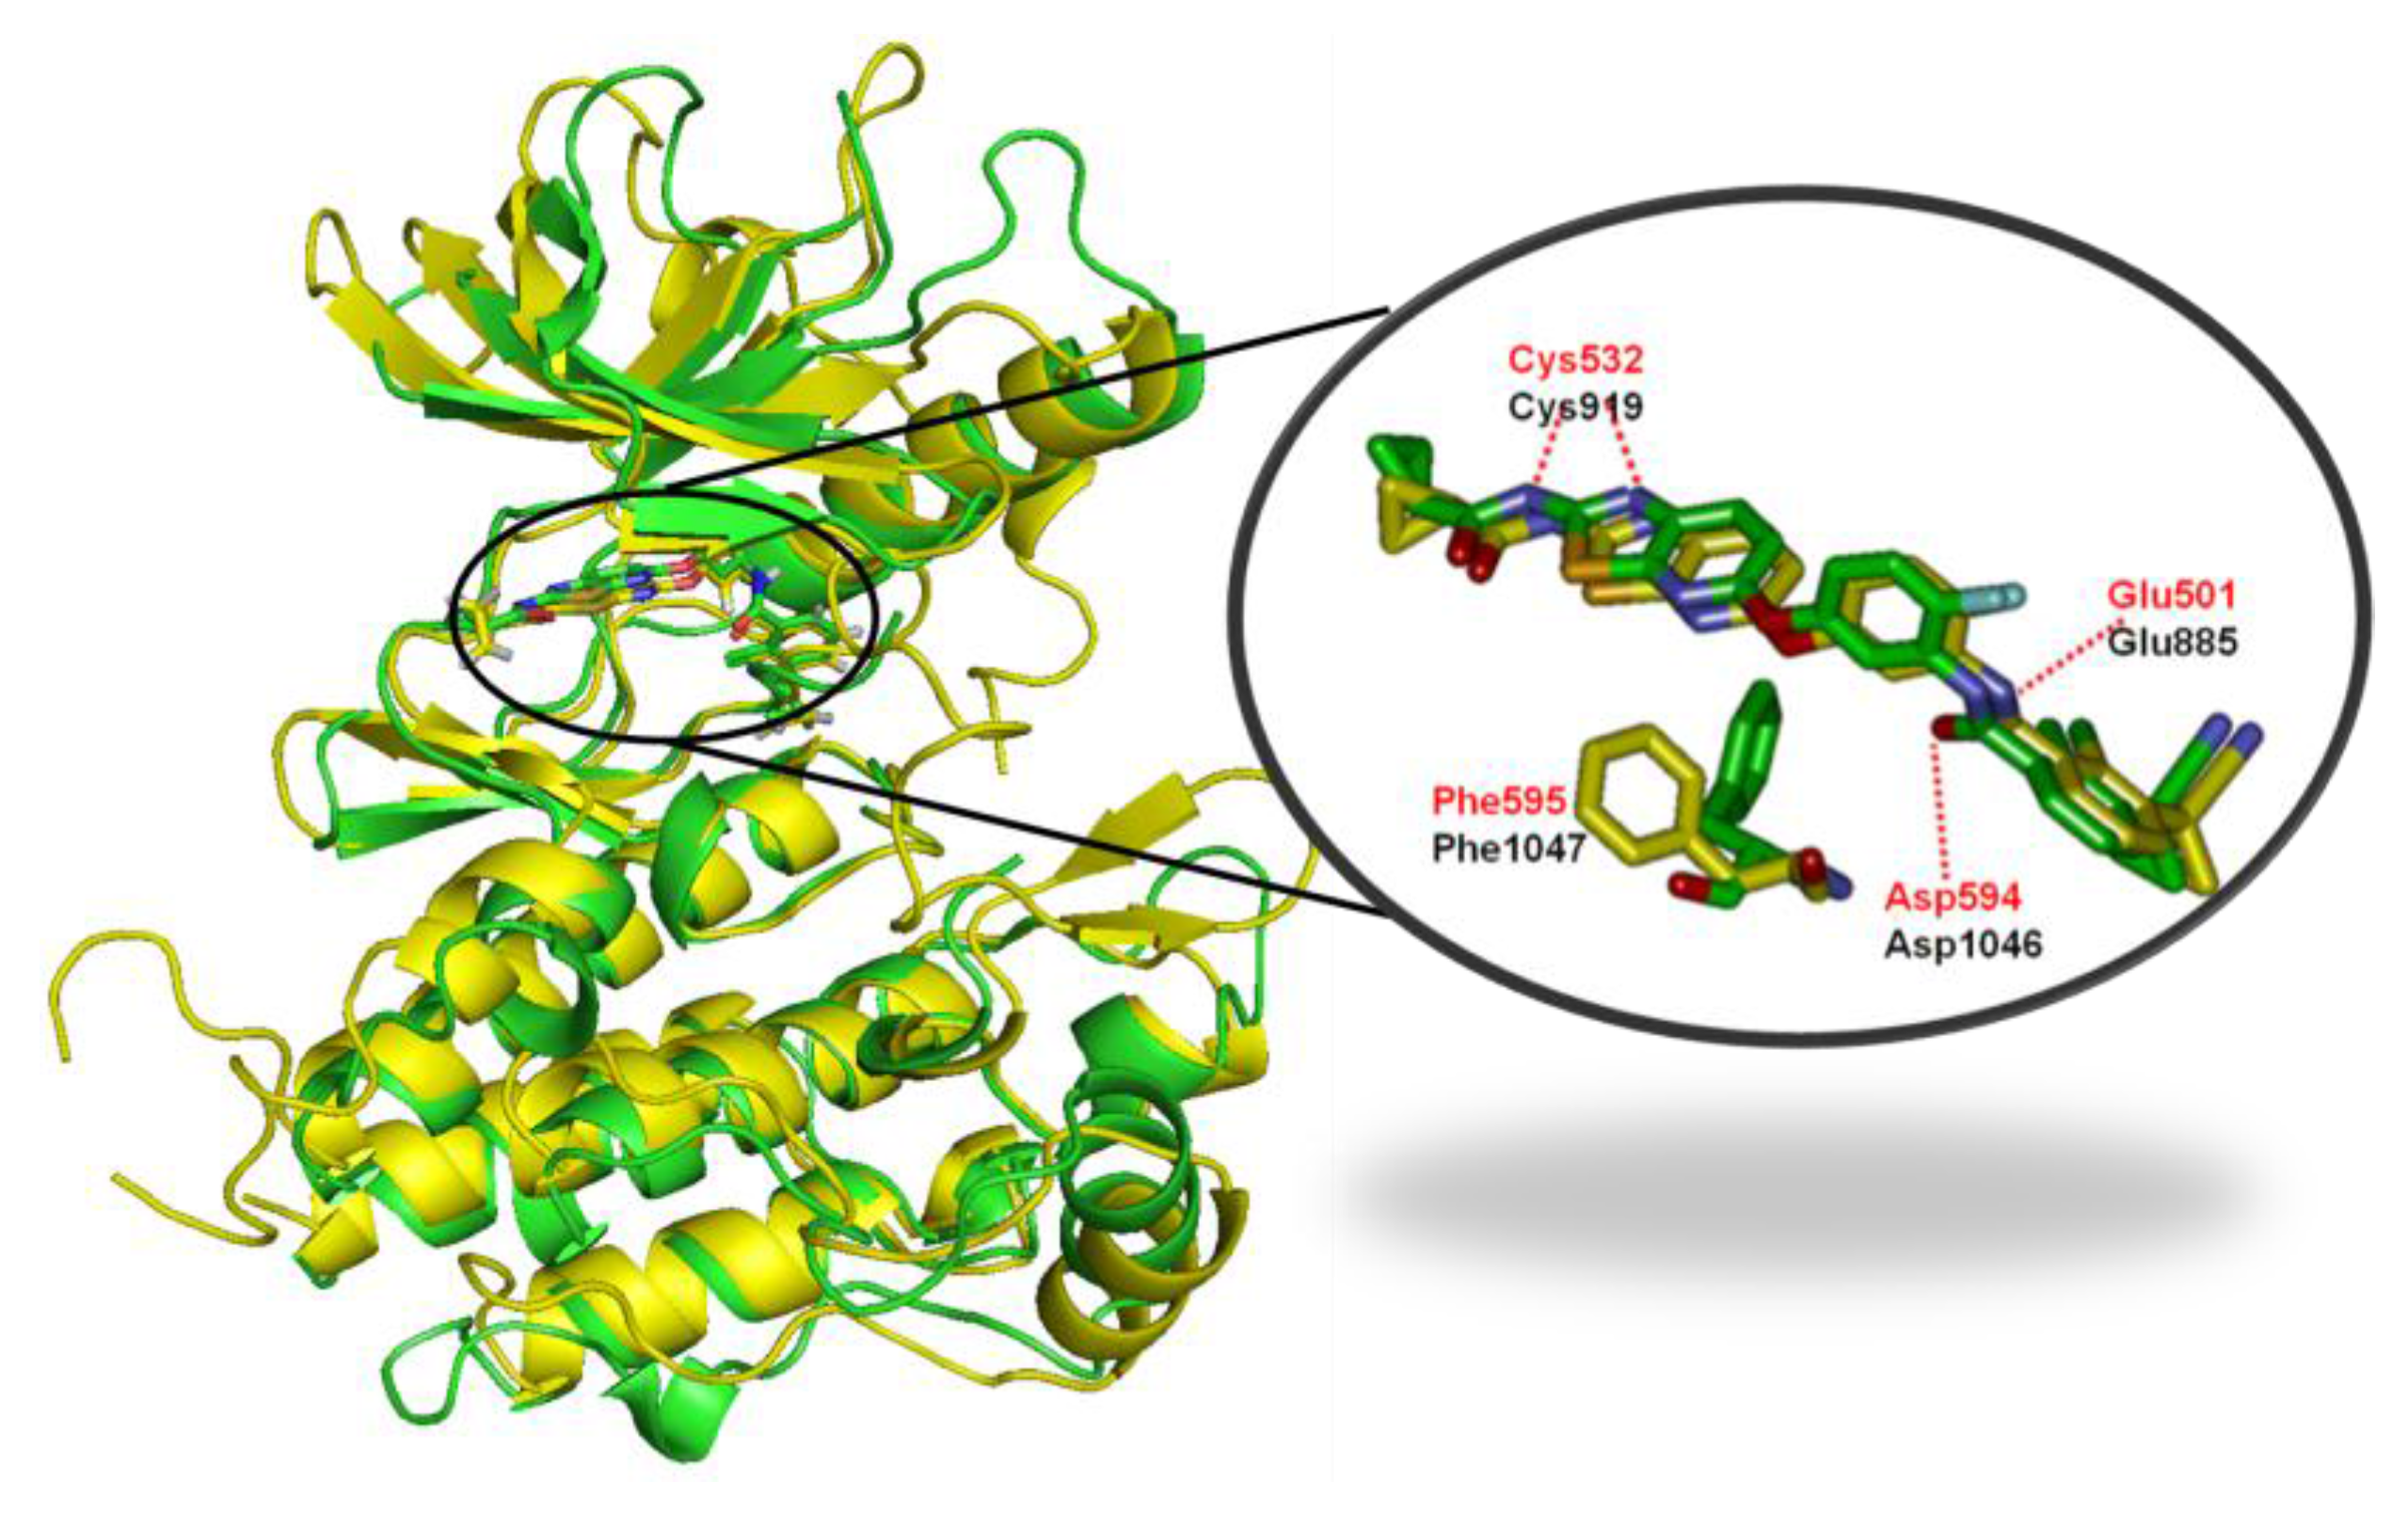
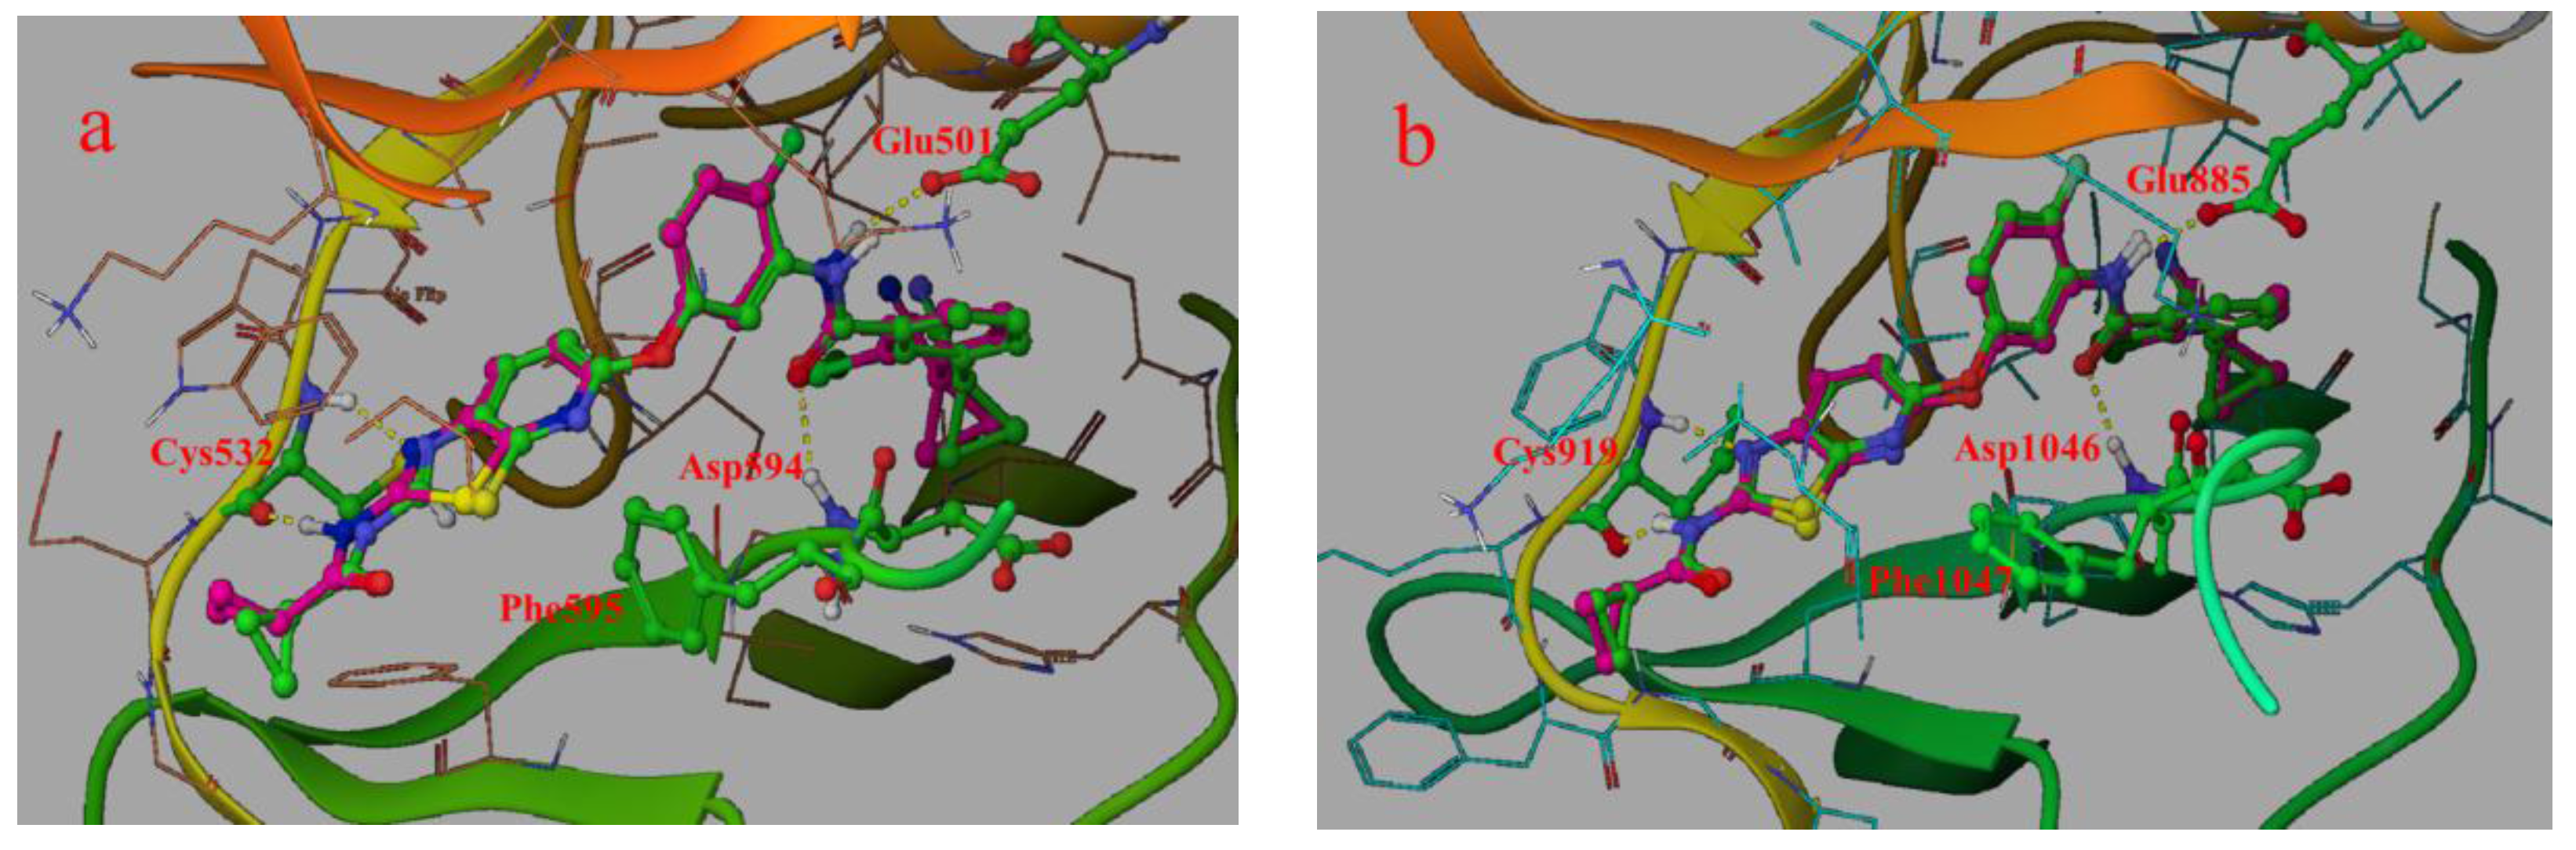
2.4.1. Comparison of the Protein Structures
2.4.2. Comparison of the 3D-QSAR Results
2.4.3. Comparison of the 3D-QSAR Contour Maps
2.5. Designing Potent Derivatives for Further Verification
 | |||||||||||
|---|---|---|---|---|---|---|---|---|---|---|---|
| No. | L | R1 | R2 | CoMFA | CoMSIA | IC50 (μM) | Actual pIC50 | ||||
| B-Raf | KDR | B-Raf | KDR | B-RafV600E | KDR | B-Raf | KDR | ||||
| D1 | CONH | 4-CH3 | CH3 | 6.69 | 6.69 | 7.47 | 7.47 | 0.28 | 0.99 | 6.55 | 6.00 |
| D2 | CONH | 3-Cl | CH3 | 7.14 | 7.14 | 7.83 | 7.83 | 0.42 | 0.21 | 6.38 | 6.68 |
| D3 | CONH | 4-Cl | CH3 | 6.96 | 6.96 | 7.55 | 7.55 | >5 | 0.95 | 6.02 | |
| D4 | CONH | 3-F | CH3 | 6.80 | 6.80 | 7.63 | 7.63 | > 5 | 0.89 | 6.05 | |
| D5 | CONH | 3,4-diCl | CH3 | 7.23 | 7.23 | 7.7 | 7.7 | 0.15 | >5 | 6.82 | |
| D6 | CONH | 3-CF3 | CH2CH3 | 7.49 | 7.49 | 7.94 | 7.94 | >5 | 0.39 | 6.41 | |
| D7 | NHCONH | 3-CF3 | CH(CH3)2 | 7.44 | 7.44 | 8.13 | 8.13 | >5 | 1.52 | 5.82 | |
| D8 | NHCONH | 3-CF3 |  | 6.68 | 6.68 | 7.51 | 7.51 | >5 | 1.32 | 5.88 | |
| Sorafenib | 0.033 | 0.32 | |||||||||
3. Experimental Section
3.1. Data Set
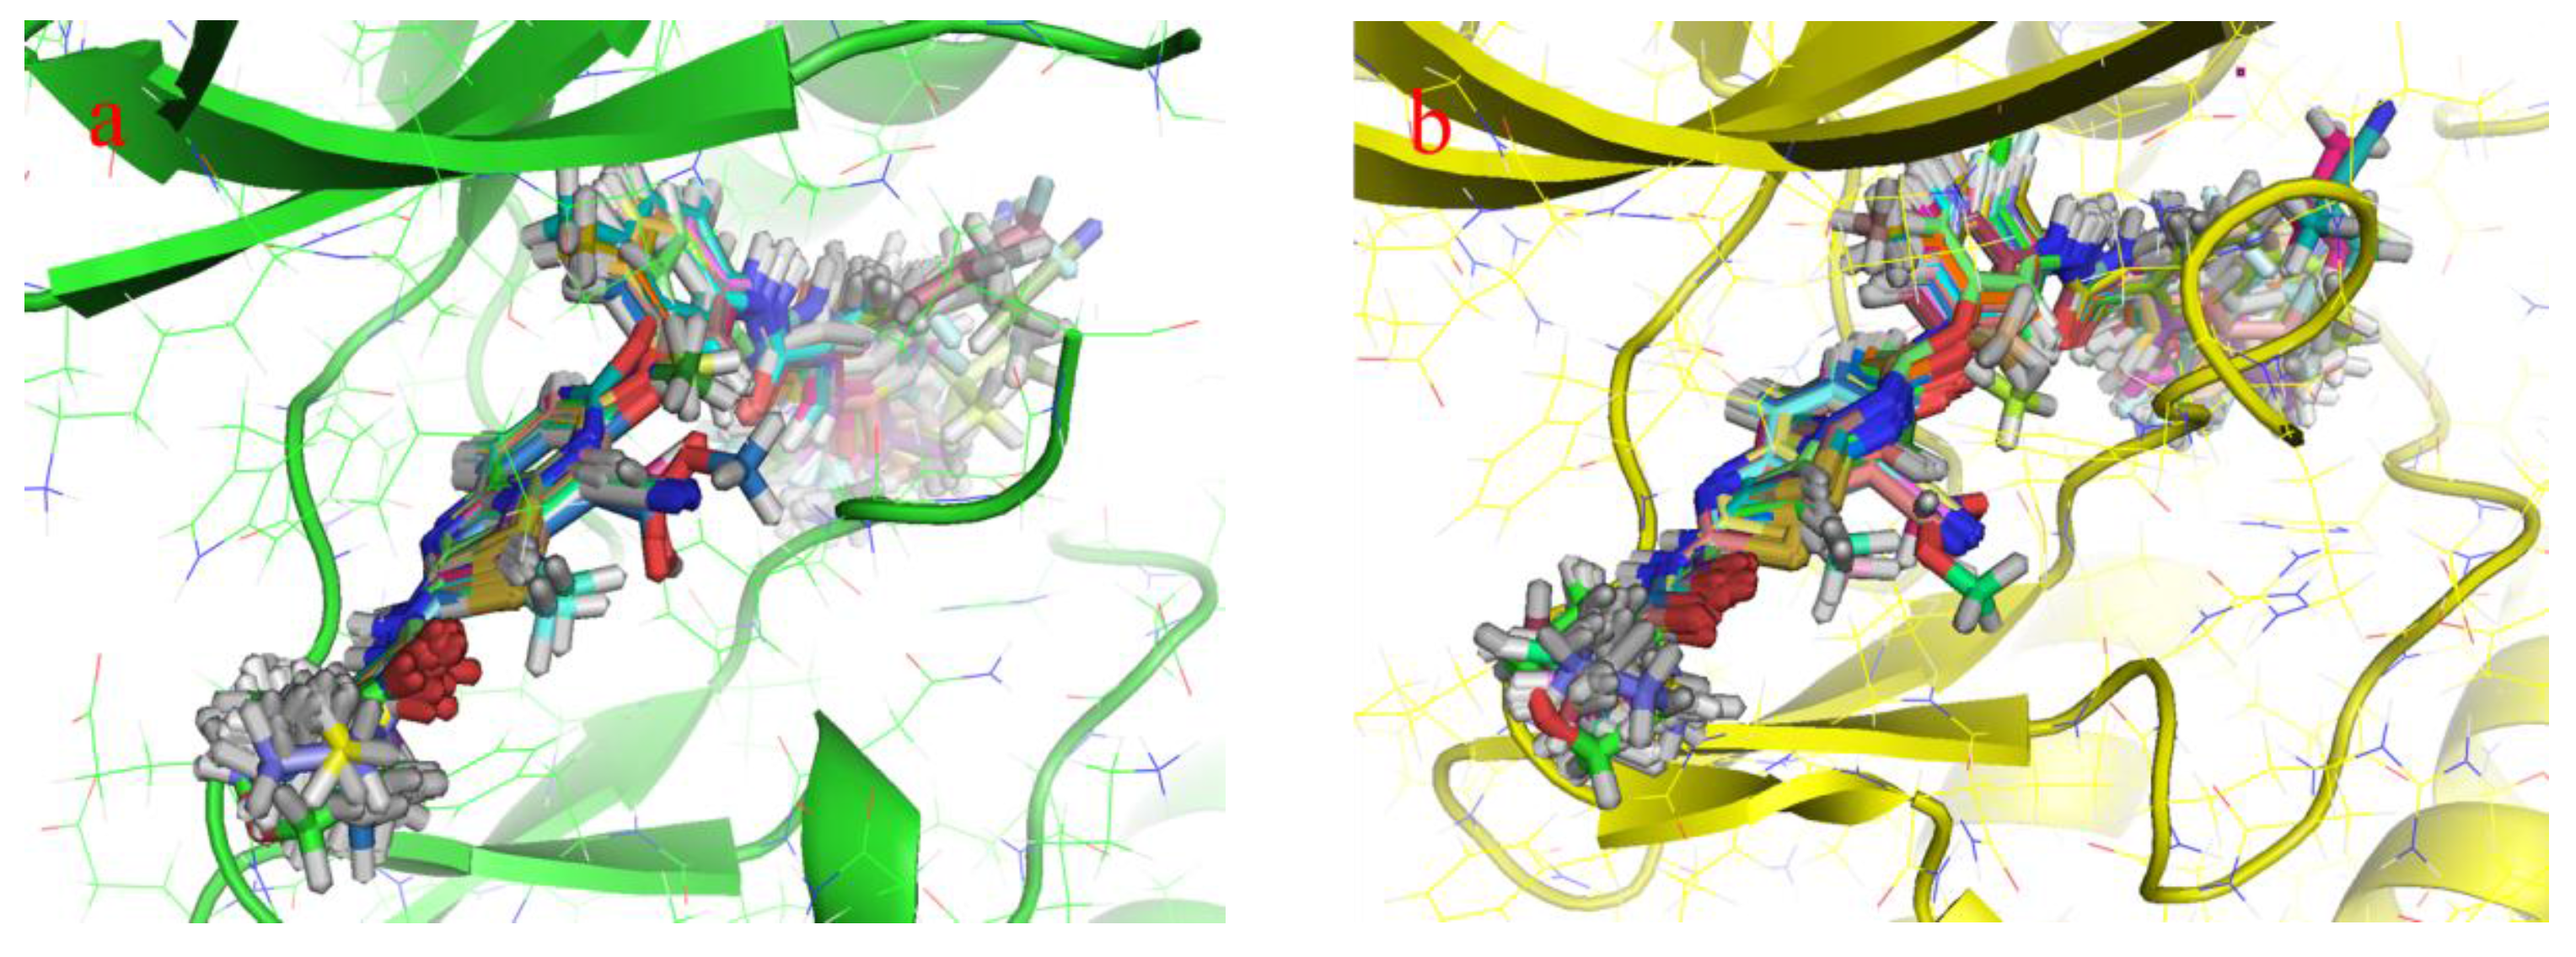
3.2. Conformational Alignment
3.3. 3D-QSAR Models
3.3.1. Generation of 3D-QSAR Model
3.3.2. Partial Least Squares (PLS) Analysis and Validation
4. Conclusions
Acknowledgments
Author Contributions
Conflicts of Interest
References
- Drews, J. Drug discovery: A historical perspective. Science 2000, 287, 1960–1964. [Google Scholar] [CrossRef] [PubMed]
- Gossage, L.; Eisen, T. Targeting multiple kinase pathways: A change in paradigm. Clin. Cancer Res. 2010, 16, 1973–1978. [Google Scholar] [CrossRef] [PubMed]
- Medina-Franco, J.L.; Giulianotti, M.A.; Welmaker, G.S.; Houghten, R.A. Shifting from the single to the multitarget paradigm in drug discovery. Drug Discov. Today 2013, 18, 495–501. [Google Scholar] [CrossRef] [PubMed]
- Fernández, A.; Crespo, A.; Tiwari, A. Is there a case for selectively promiscuous anticancer drugs? Drug Discov. Today 2009, 14, 1–5. [Google Scholar] [CrossRef] [PubMed]
- Petrelli, A.; Giordano, S. From single- to multi-target drugs in cancer therapy: When aspecificity becomes an advantage. Curr. Med. Chem. 2008, 15, 422–432. [Google Scholar] [PubMed]
- Smyth, L.A.; Collins, I. Measuring and interpreting the selectivity of protein kinase inhibitors. J. Chem. Biol. 2009, 2, 131–151. [Google Scholar] [CrossRef] [PubMed]
- Morphy, R. Selectively nonselective kinase inhibition: Striking the right balance. J. Med. Chem. 2010, 53, 1413–1437. [Google Scholar] [CrossRef] [PubMed]
- Keith, C.T.; Borisy, A.A.; Stockwell, B.R. Multicomponent therapeutics for networked systems. Nat. Rev. Drug Discov. 2005, 4, 71–78. [Google Scholar] [CrossRef] [PubMed]
- Zimmermann, G.R.; Lehár, J.; Keith, C.T. Multi-target therapeutics: When the whole is greater than the sum of the parts. Drug Discov. Today 2007, 12, 34–42. [Google Scholar] [CrossRef] [PubMed]
- Csermely, P.; Agoston, V.; Pongor, S. The efficiency of multitarget drugs: The network approach might help drug design. Trends Pharmacol. Sci. 2005, 26, 178–182. [Google Scholar] [CrossRef] [PubMed]
- Morphy, R.; Kay, C.; Rankovic, Z. From magic bullets to designed multiple ligands. Drug Discov. Today 2004, 9, 641–651. [Google Scholar] [CrossRef]
- Thangapandian, S.; John, S.; Sakkiah, S.; Lee, K.W. Molecular docking and pharmacophore filtering in the discovery of dual-inhibitors for human leukotriene A4 hydrolase and leukotriene C4 synthase. J. Chem. Inf. Model. 2011, 51, 33–44. [Google Scholar] [CrossRef] [PubMed]
- Robinson, M.J.; Cobb, M.H. Mitogen-activated protein kinase pathways. Curr. Opin. Cell Biol. 1997, 9, 180–186. [Google Scholar] [CrossRef]
- Roberts, P.J.; Der, C.J. Targeting the Raf-MEK-ERK mitogen-activated protein kinase cascade for the treatment of cancer. Oncogene 2007, 26, 3291–3310. [Google Scholar] [CrossRef] [PubMed]
- Holmes, K.; Roberts, O.L.; Thomas, A.M.; Cross, M.J. Vascular endothelial growth factor receptor-2: Structure, function, intracellular signalling and therapeutic inhibition. Cell Signal. 2007, 19, 2003–2012. [Google Scholar] [CrossRef] [PubMed]
- Lang, S.A.; Schachtschneider, P.; Moser, C.; Mori, A.; Hackl, C.; Gaumann, A.; Batt, D.; Schlitt, H.J.; Geissler, E.K.; Stoeltzing, O. Dual targeting of Raf and VEGF receptor 2 reduces growth and metastasis of pancreatic cancer through direct effects on tumor cells, endothelial cells, and pericytes. Mol. Cancer Ther. 2008, 7, 3509–3518. [Google Scholar] [CrossRef] [PubMed]
- Scapin, G. Structural biology in drug design: Selective protein kinase inhibitors. Drug Discov. Today 2002, 7, 601–611. [Google Scholar] [CrossRef]
- Kinnings, S.; Jackson, R.M. Binding site similarity analysis for the functional classification of the protein kinase family. J. Chem. Inf. Model. 2009, 49, 318–329. [Google Scholar] [CrossRef] [PubMed]
- Wilhelm, S.; Carter, C.; Lynch, M.; Lowinger, T.; Dumas, J.; Smith, R.A.; Schwartz, B.; Simantov, R.; Kelley, S. Discovery and development of sorafenib: A multikinase inhibitor for treating cancer. Nat. Rev. Drug Discov. 2006, 5, 835–844. [Google Scholar] [CrossRef] [PubMed]
- Liao, J.J.L. Molecular recognition of protein kinase binding pockets for design of potent and selective kinase inhibitors. J. Med. Chem. 2007, 50, 409–424. [Google Scholar] [CrossRef] [PubMed]
- Liu, Y.; Gray, N.S. Rational design of inhibitors that bind to inactive kinase conformations. Nat. Chem. Biol. 2006, 2, 358–364. [Google Scholar] [CrossRef] [PubMed]
- McTigue, M.; Murray, B.W.; Chen, J.H.; Deng, Y.L.; Solowiej, J.; Kania, R.S. Molecular conformations, interactions, and properties associated with drug efficiency and clinical performance among VEGFR TK inhibitors. Proc. Natl. Acad. Sci. USA 2012, 109, 18281–18289. [Google Scholar] [CrossRef] [PubMed]
- Lovering, F.; McDonald, J.; Whitlock, G.A.; Glossop, P.A.; Phillips, C.; Bent, A.; Sabnis, Y.; Ryan, M.; Fitz, L.; Lee, J.; et al. Identification of type-II inhibitors using kinase structures. Chem. Biol. Drug Des. 2012, 80, 657–664. [Google Scholar] [CrossRef] [PubMed]
- Hansch, C.; Klein, T.E. Molecular graphics and QSAR in the study of enzyme-ligand interactions. On the definition of bioreceptors. Acc. Chem. Res. 1986, 19, 392–400. [Google Scholar] [CrossRef]
- Thaimattam, R.; Daga, P.R.; Banerjee, R.; Iqbal, J. 3D-QSAR studies on c-Src kinase inhibitors and docking analyses of a potent dual kinase inhibitor of c-Src and c-Abl kinases. Bioorg. Med. Chem. 2005, 13, 4704–4712. [Google Scholar] [CrossRef] [PubMed]
- Silakari, O.; Chand, S.; Bahia, M.S. Receptor guided 3D-QSAR analysis of thieno[2, 3-b]pyridine-5-carbonitrile derivatives as PKC-θ inhibitors. Mol. Inf. 2012, 31, 659–668. [Google Scholar] [CrossRef]
- Cramer, R.D.; Patterson, D.E.; Bunce, J.D. Comparative molecular field analysis (CoMFA). 1. Effect of shape on binding of steroids to carrier proteins. J. Am. Chem. Soc. 1988, 110, 5959–5967. [Google Scholar] [CrossRef] [PubMed]
- Klebe, G.; Abraham, U.; Mietzner, T. Molecular similarity indices in a comparative analysis (CoMSIA) of drug molecules to correlate and predict their biological activity. J. Med. Chem. 1994, 37, 4130–4146. [Google Scholar] [CrossRef] [PubMed]
- Cichero, E.; Espinoza, S.; Franchini, S.; Guariento, S.; Brasili, L.; Gainetdinov, R.R.; Fossa, P. Further insights into the pharmacology of the human trace amine-associated receptors: Discovery of novel ligands for TAAR1 by a virtual screening approach. Chem. Biol. Drug Des. 2014, 84, 712–720. [Google Scholar] [CrossRef] [PubMed]
- Dong, M.; Ren, Y.; Gao, X. Identification of triazolo[4,5-b]pyrazine derivatives as hepatocyte growth factor receptor inhibitors through structure-activity relationships and molecular docking simulations. Bioorg. Med. Chem. Lett. 2015, 25, 4118–4126. [Google Scholar] [CrossRef] [PubMed]
- Cichero, E.; Ligresti, A.; Allarà, M.; di Marzo, V.; Lazzati, Z.; D’Ursi, P.; Marabotti, A.; Milanesi, L.; Spallarossa, A.; Ranise, A.; et al. Homology modeling in tandem with 3D-QSAR analyses: A computational approach to depict the agonist binding site of the human CB2 receptor. Eur. J. Med. Chem. 2011, 46, 4489–4505. [Google Scholar] [CrossRef] [PubMed]
- Cichero, E.; Fossa, P. Docking-based 3D-QSAR analyses of pyrazole derivatives as HIV-1 non-nucleoside reverse transcriptase inhibitors. J. Mol. Model. 2012, 18, 1573–1582. [Google Scholar] [CrossRef] [PubMed]
- Borisa, A.; Bhatt, H. 3D-QSAR (CoMFA, CoMFA-RG, CoMSIA) and molecular docking study of thienopyrimidine and thienopyridine derivatives to explore structural requirements for aurora-B kinase inhibition. Eur. J. Pharm. Sci. 2015, 79, 1–12. [Google Scholar] [CrossRef] [PubMed]
- Okaniwa, M.; Hirose, M.; Imada, T.; Ohashi, T.; Hayashi, Y.; Miyazaki, T.; Arita, T.; Yabuki, M.; Kakoi, K.; Kato, J.; et al. Design and synthesis of novel DFG-out RAF/vascular endothelial growth factor receptor 2 (VEGFR2) inhibitors. 1. Exploration of [5,6]-fused bicyclic scaffolds. J. Med. Chem. 2012, 55, 3452–3478. [Google Scholar] [CrossRef] [PubMed]
- Okaniwa, M.; Imada, T.; Ohashi, T.; Miyazaki, T.; Arita, T.; Yabuki, M.; Sumita, A.; Tsutsumi, S.; Higashikawa, K.; Takagi, T.; et al. Design and synthesis of novel DFG-out RAF/vascular endothelial growth factor receptor 2 (VEGFR2) inhibitors: 2. Synthesis and characterization of a novel imide-type prodrug for improving oral absorption. Bioorg. Med. Chem. 2012, 20, 4680–4692. [Google Scholar] [CrossRef] [PubMed]
- Hirose, M.; Okaniwa, M.; Miyazaki, T.; Imada, T.; Ohashi, T.; Tanaka, Y.; Arita, T.; Yabuki, M.; Kawamoto, T.; Tsutsumi, S.; et al. Design and synthesis of novel DFG-out RAF/vascular endothelial growth factor receptor 2 (VEGFR2) inhibitors: 3. Evaluation of 5-amino-linked thiazolo[5,4-d]pyrimidine and thiazolo[5,4-b]pyridine derivatives. Bioorg. Med. Chem. 2012, 20, 5600–5615. [Google Scholar] [CrossRef] [PubMed]
- Okaniwa, M.; Hirose, M.; Arita, T.; Yabuki, M.; Nakamura, A.; Takagi, T.; Kawamoto, T.; Uchiyama, N.; Sumita, A.; Tsutsumi, S.; et al. Discovery of a selective kinase inhibitor (TAK-632) targeting pan-RAF inhibition: Design, synthesis, and biological evaluation of C-7-substituted 1,3-benzothiazole derivatives. J. Med. Chem. 2013, 56, 6478–6494. [Google Scholar] [CrossRef] [PubMed]
- Yang, W.M.; Chen, Y.D.; Zhang, Y.M.; Tang, S.Z.; Chen, H.L.; Tang, W.F.; Lu, T. Design, Synthesis and AntitumorActivities of Bis-arylureas and Bisarylamides Based on 1H-benzo[d]imidazole Moiety as Novel B-RafV600E/VEGFR2 Dual Inhibitors. Lett. Drug Des. Discov. 2014, 11, 1079–1089. [Google Scholar] [CrossRef]
- SYBYL, version 6.9; Tripos, Inc.: St. Louis, MO, USA, 2002.
- Hassan, M.; Bielawski, J.P.; Hempel, J.C.; Waldman, M. Optimization and visualization of molecular diversity of combinatorial libraries. Mol. Divers. 1996, 2, 64–74. [Google Scholar] [CrossRef] [PubMed]
- Matter, H.; Potter, T. Comparing 3D pharmacophore triplets and 2D fingerprints for selecting diverse compound subsets. J. Chem. Inf. Comput. Sci. 1999, 39, 1211–225. [Google Scholar] [CrossRef]
- Cho, S.J.; Tropsha, A. Cross-validated R2-guided region selection for comparative molecular field analysis: A simple method to achieve consistent results. J. Med. Chem. 1995, 38, 1060–1066. [Google Scholar] [CrossRef] [PubMed]
- Kontoyianni, M.; McClellan, L.M.; Sokol, G.S. Evaluation of docking performance: Comparative data on docking algorithms. J. Med. Chem. 2004, 47, 558–565. [Google Scholar] [CrossRef] [PubMed]
- GLIDE, version 4.5; Schrödinger, LLC: New York, NY, USA, 2007.
- Geladi, P. Notes on the history and nature of partial least squares (PLS) modelling. J. Chemom. 1998, 2, 231–246. [Google Scholar] [CrossRef]
- Geladi, P.; Kowalski, B.R. Partial least-squares regression: A tutorial. Anal. Chim. Acta 1986, 185, 1–17. [Google Scholar] [CrossRef]
© 2015 by the authors; licensee MDPI, Basel, Switzerland. This article is an open access article distributed under the terms and conditions of the Creative Commons Attribution license (http://creativecommons.org/licenses/by/4.0/).
Share and Cite
Liu, H.-C.; Tang, S.-Z.; Lu, S.; Ran, T.; Wang, J.; Zhang, Y.-M.; Xu, A.-Y.; Lu, T.; Chen, Y.-D. Studies on [5,6]-Fused Bicyclic Scaffolds Derivatives as Potent Dual B-RafV600E/KDR Inhibitors Using Docking and 3D-QSAR Approaches. Int. J. Mol. Sci. 2015, 16, 24451-24474. https://doi.org/10.3390/ijms161024451
Liu H-C, Tang S-Z, Lu S, Ran T, Wang J, Zhang Y-M, Xu A-Y, Lu T, Chen Y-D. Studies on [5,6]-Fused Bicyclic Scaffolds Derivatives as Potent Dual B-RafV600E/KDR Inhibitors Using Docking and 3D-QSAR Approaches. International Journal of Molecular Sciences. 2015; 16(10):24451-24474. https://doi.org/10.3390/ijms161024451
Chicago/Turabian StyleLiu, Hai-Chun, San-Zhi Tang, Shuai Lu, Ting Ran, Jian Wang, Yan-Min Zhang, An-Yang Xu, Tao Lu, and Ya-Dong Chen. 2015. "Studies on [5,6]-Fused Bicyclic Scaffolds Derivatives as Potent Dual B-RafV600E/KDR Inhibitors Using Docking and 3D-QSAR Approaches" International Journal of Molecular Sciences 16, no. 10: 24451-24474. https://doi.org/10.3390/ijms161024451