Article

Genes Responsive to Low-Intensity Pulsed Ultrasound in MC3T3-E1 Preosteoblast Cells

1
Division of Molecular Genetics Research, Life Science Research Center, University of Toyama, 2630 Sugitani, Toyama 930-0194, Japan
2
Department of Oral Morphology, Graduate School of Medicine, Dentistry and Pharmaceutical Sciences, Okayama University, 2-5-1 Shikata-cho, Kita-ku, Okayama 700-8525, Japan
3
Noto Marine Laboratory, Institute of Nature and Environmental Technology, Kanazawa University, Ogi, Noto-cho, Ishikawa 927-0553, Japan
4
Institute of Health Sciences, College of Medical, Pharmaceutical and Health Sciences, Kanazawa University, 5-11-80, Kodatsuno, Kanazawa 920-0942, Japan
5
Department of Radiological Sciences, Graduate School of Medicine and Pharmaceutical Sciences, University of Toyama, 2630 Sugitani, Toyama 930-0194, Japan
*
Author to whom correspondence should be addressed.
Int. J. Mol. Sci. 2013, 14(11), 22721-22740; https://doi.org/10.3390/ijms141122721
Submission received: 16 April 2013 / Revised: 4 July 2013 / Accepted: 6 August 2013 / Published: 18 November 2013
(This article belongs to the Section Biochemistry)

Abstract

:
Although low-intensity pulsed ultrasound (LIPUS) has been shown to enhance bone fracture healing, the underlying mechanism of LIPUS remains to be fully elucidated. Here, to better understand the molecular mechanism underlying cellular responses to LIPUS, we investigated gene expression profiles in mouse MC3T3-E1 preosteoblast cells exposed to LIPUS using high-density oligonucleotide microarrays and computational gene expression analysis tools. Although treatment of the cells with a single 20-min LIPUS (1.5 MHz, 30 mW/cm2) did not affect the cell growth or alkaline phosphatase activity, the treatment significantly increased the mRNA level of Bglap. Microarray analysis demonstrated that 38 genes were upregulated and 37 genes were downregulated by 1.5-fold or more in the cells at 24-h post-treatment. Ingenuity pathway analysis demonstrated that the gene network U (up) contained many upregulated genes that were mainly associated with bone morphology in the category of biological functions of skeletal and muscular system development and function. Moreover, the biological function of the gene network D (down), which contained downregulated genes, was associated with gene expression, the cell cycle and connective tissue development and function. These results should help to further clarify the molecular basis of the mechanisms of the LIPUS response in osteoblast cells.

1. Introduction

In many medical fields, ultrasound (US) has proven to be an effective diagnostic or therapeutic tool [1,2]. With respect to the therapeutic applications, low-intensity pulsed US (LIPUS) has been used extensively as an adjuvant to fracture healing [36]. It has been well-established that fracture healing involves four events: inflammation, soft callus formation, hard callus formation and bone remodeling. Pre-clinical work has shown LIPUS to be effective in bone fracture models of small [718] and large animals [1921]. Duatre [7] previously demonstrated that LIPUS accelerated bone fracture union in a rabbit femoral fracture model. Azuma and coworkers [9] also clearly demonstrated that LIPUS acted effectively at each phase of the healing process in a rat femoral fracture model. The results of a study using a sheep osteotomy model similarly demonstrated that LIPUS can significantly accelerate the fracture-healing process, increase the cortical bone mineral density and improve the lateral bending strength of the healing fracture [19]. These therapeutic effects of LIPUS have since been confirmed in randomized clinical trials [22,23].
The use of in vitro cell culture systems has been of central importance for research at the cellular and molecular levels. A number of investigations have indicated that LIPUS is effective for the treatment of different cell types that play important roles in the processes of fracture healing. Most in vitro studies have examined the US-associated bone formative response by use of osteoblastic cells from mammals [2430]. We recently demonstrated that the osteoblast activity in goldfish scales responds sensitively to LIPUS and may be important in promoting bone formation [31]. LIPUS has been proven effective in bone marrow stromal cells, which are thought to be one of the cell types involved in fracture healing [32,33]. In addition, LIPUS is reported to stimulate the growth and synthesis of matrix proteins in chondrocytes [34,35]. LIPUS was demonstrated to exert its effects through integrin receptors; that is, LIPUS promotes cell proliferation via the activation of integrin receptors in human skin fibroblasts [36]; and LIPUS activates α5β1 integrin and promotes cell differentiation in mouse mandibular osteoblasts [30]. Moreover, LIPUS induces RANKL and chemokines via the angiotensin II type 1 receptor in MC3T3-E1 cells [25]. LIPUS has been shown to stimulate cell proliferation, proteoglycan synthesis and expression of growth factor-related genes in human nucleus pulposus HNPSV-1 cells [37]. LIPUS is reported to regulate the proliferation and differentiation of osteoblasts through osteocytes [38]. As described above, the effects of LIPUS are evident; however, the detailed mechanisms by which LIPUS promotes bone fracture healing at the cellular or molecular level are largely unclear.
With the help of novel transcript profiling technology, a view of the genome-wide expression profiles can be assayed simultaneously, allowing scanning differential expression of a large number of genes. This technology has been used to analyze the expression of genes in response to LIPUS in human osteoblastic osteosarcoma MG-63 [28] and SaOS-2 cells [29]. While it is important to identify individual genes that are differentially expressed, there is also a need to move beyond this level of analysis. Recently, we have used pathway analysis technologies to map gene expression data into relevant gene networks on the basis of their functional annotation and known molecular interactions [3941]. Using these technologies, unique gene networks that are associated with cellular development and cell death were identified in human lymphoma U937 cells treated with LIPUS [39].
In the present study, we investigated the changes in gene expression in MC3T3-E1 preosteoblast cells treated with LIPUS by using a GeneChip® microarray analysis system in order to better understand the molecular mechanisms underlying cellular responses to this stress.

2. Results

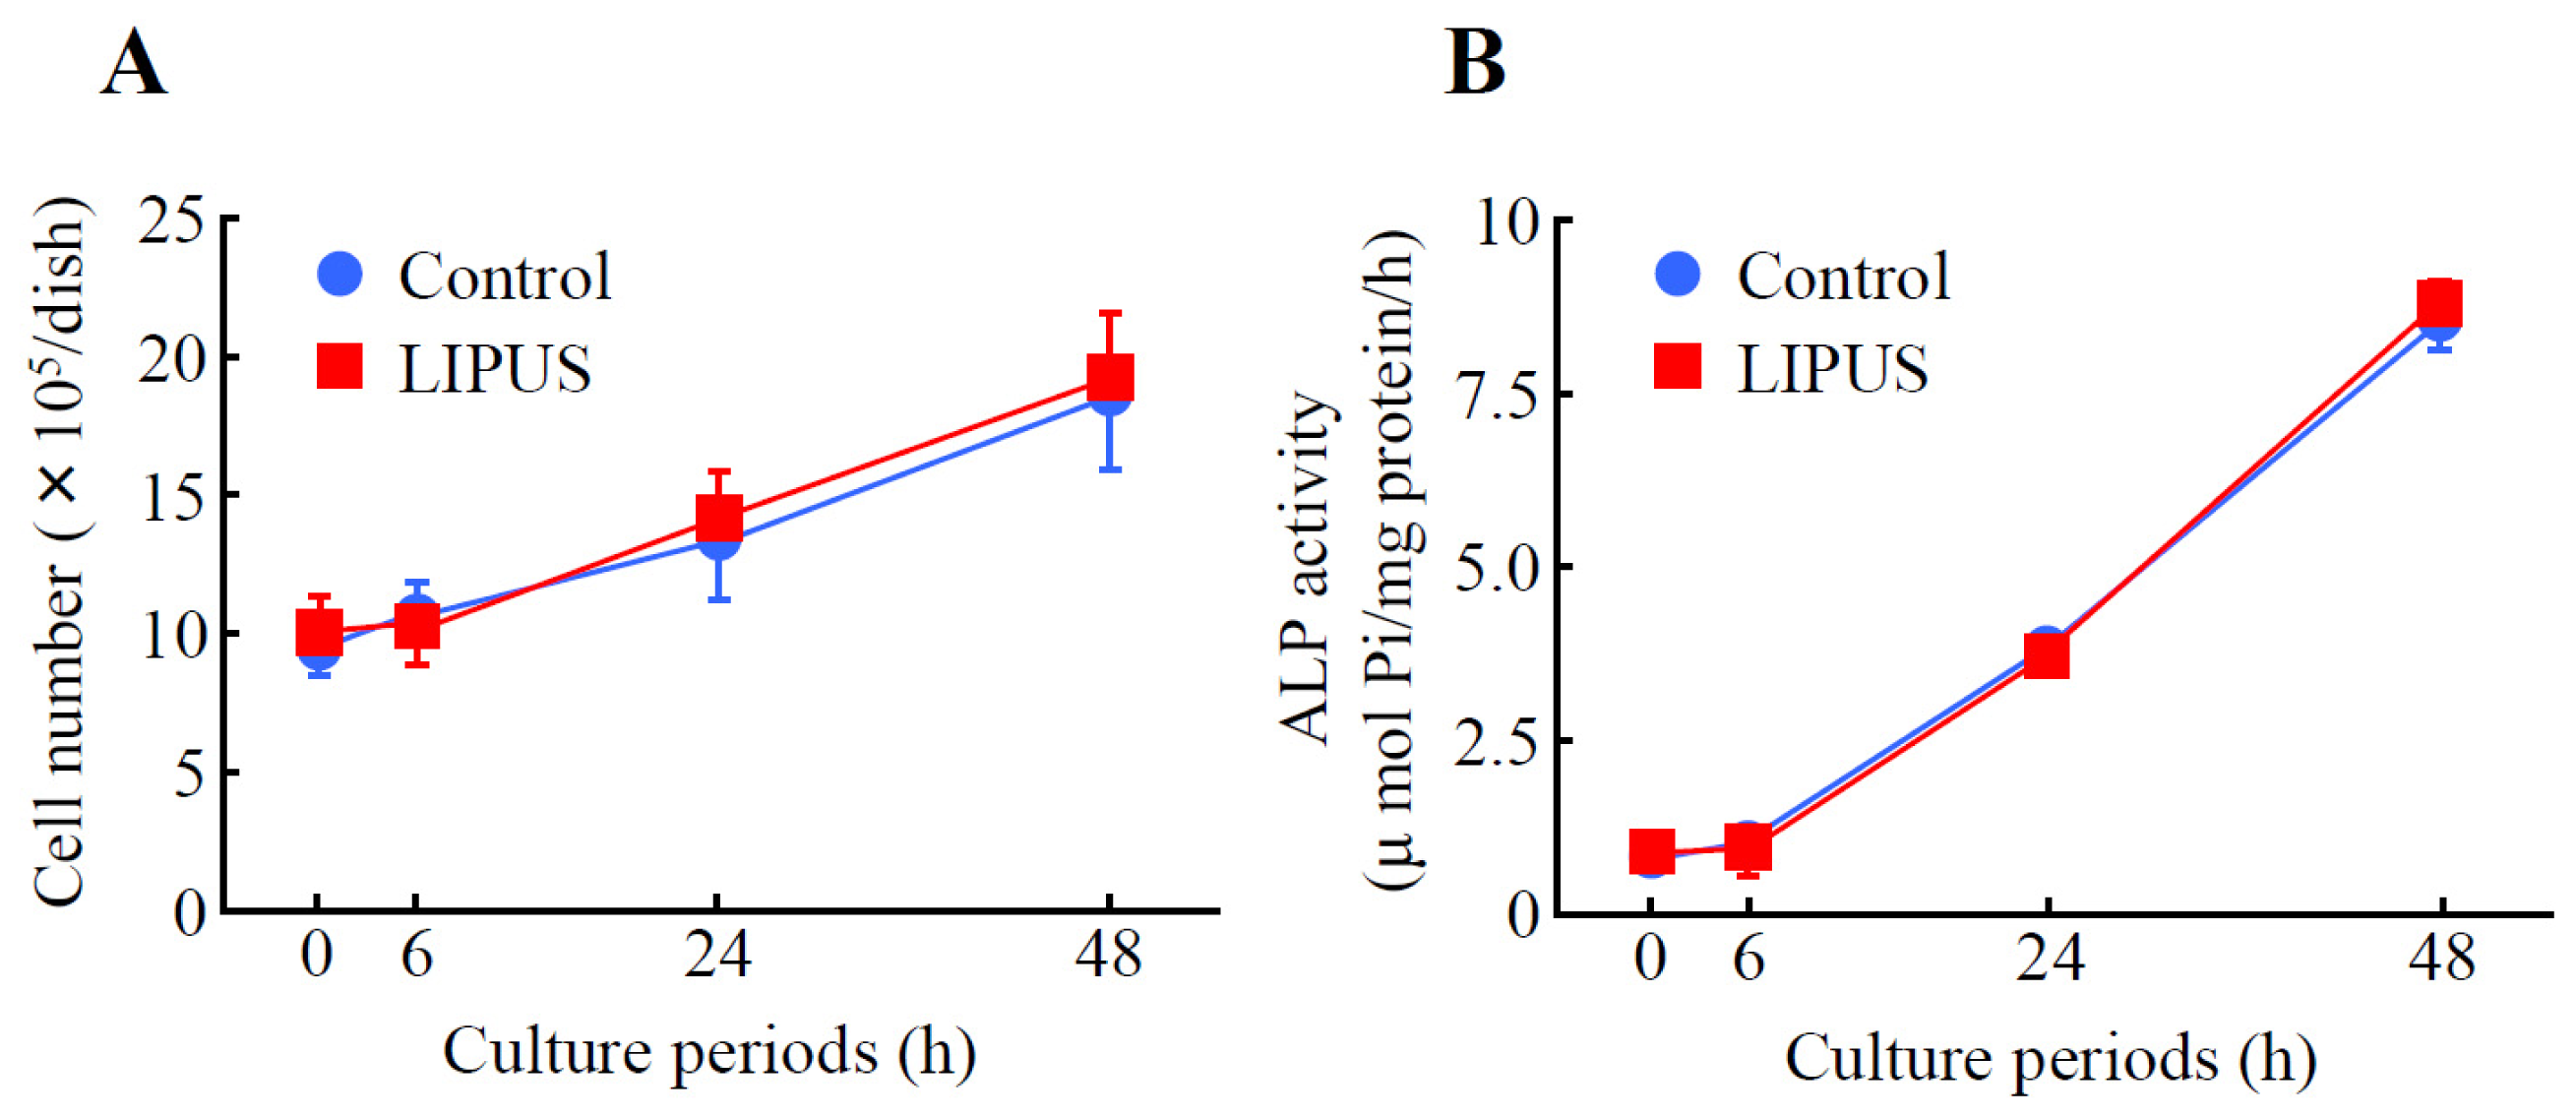
2.1. Effects of LIPUS on the Cell Growth and Alkaline Phosphatase (ALP) Activity in MC3T3-E1 Cells

Mouse preosteoblast MC3T3-E1 cells were analyzed to determine cell growth and Alkaline Phosphatase (ALP) activity. When MC3T3-E1 cells were exposed to LIPUS (30 mW/cm2, for 20 min), followed by culturing at 37 °C for 0 to 48 h, the cell number was gradually increased in a time-dependent fashion. However, the growth rate was comparable to that of the mock-treated control cells (Figure 1A). Furthermore, we examined the effects of LIPUS on ALP activity, an in vitro osteoblastic differentiation marker. As shown in Figure 1B, the values of control ALP activity at 0, 6, 24 and 48 h of culture were 0.80 ± 0.10, 1.1 ± 0.07, 3.8 ± 0.15 and 8.8 ± 0.33 μmol Pi/mg protein/h (mean ± SD), respectively. On the other hand, treatment of cells with LIPUS did not affect the ALP activity.

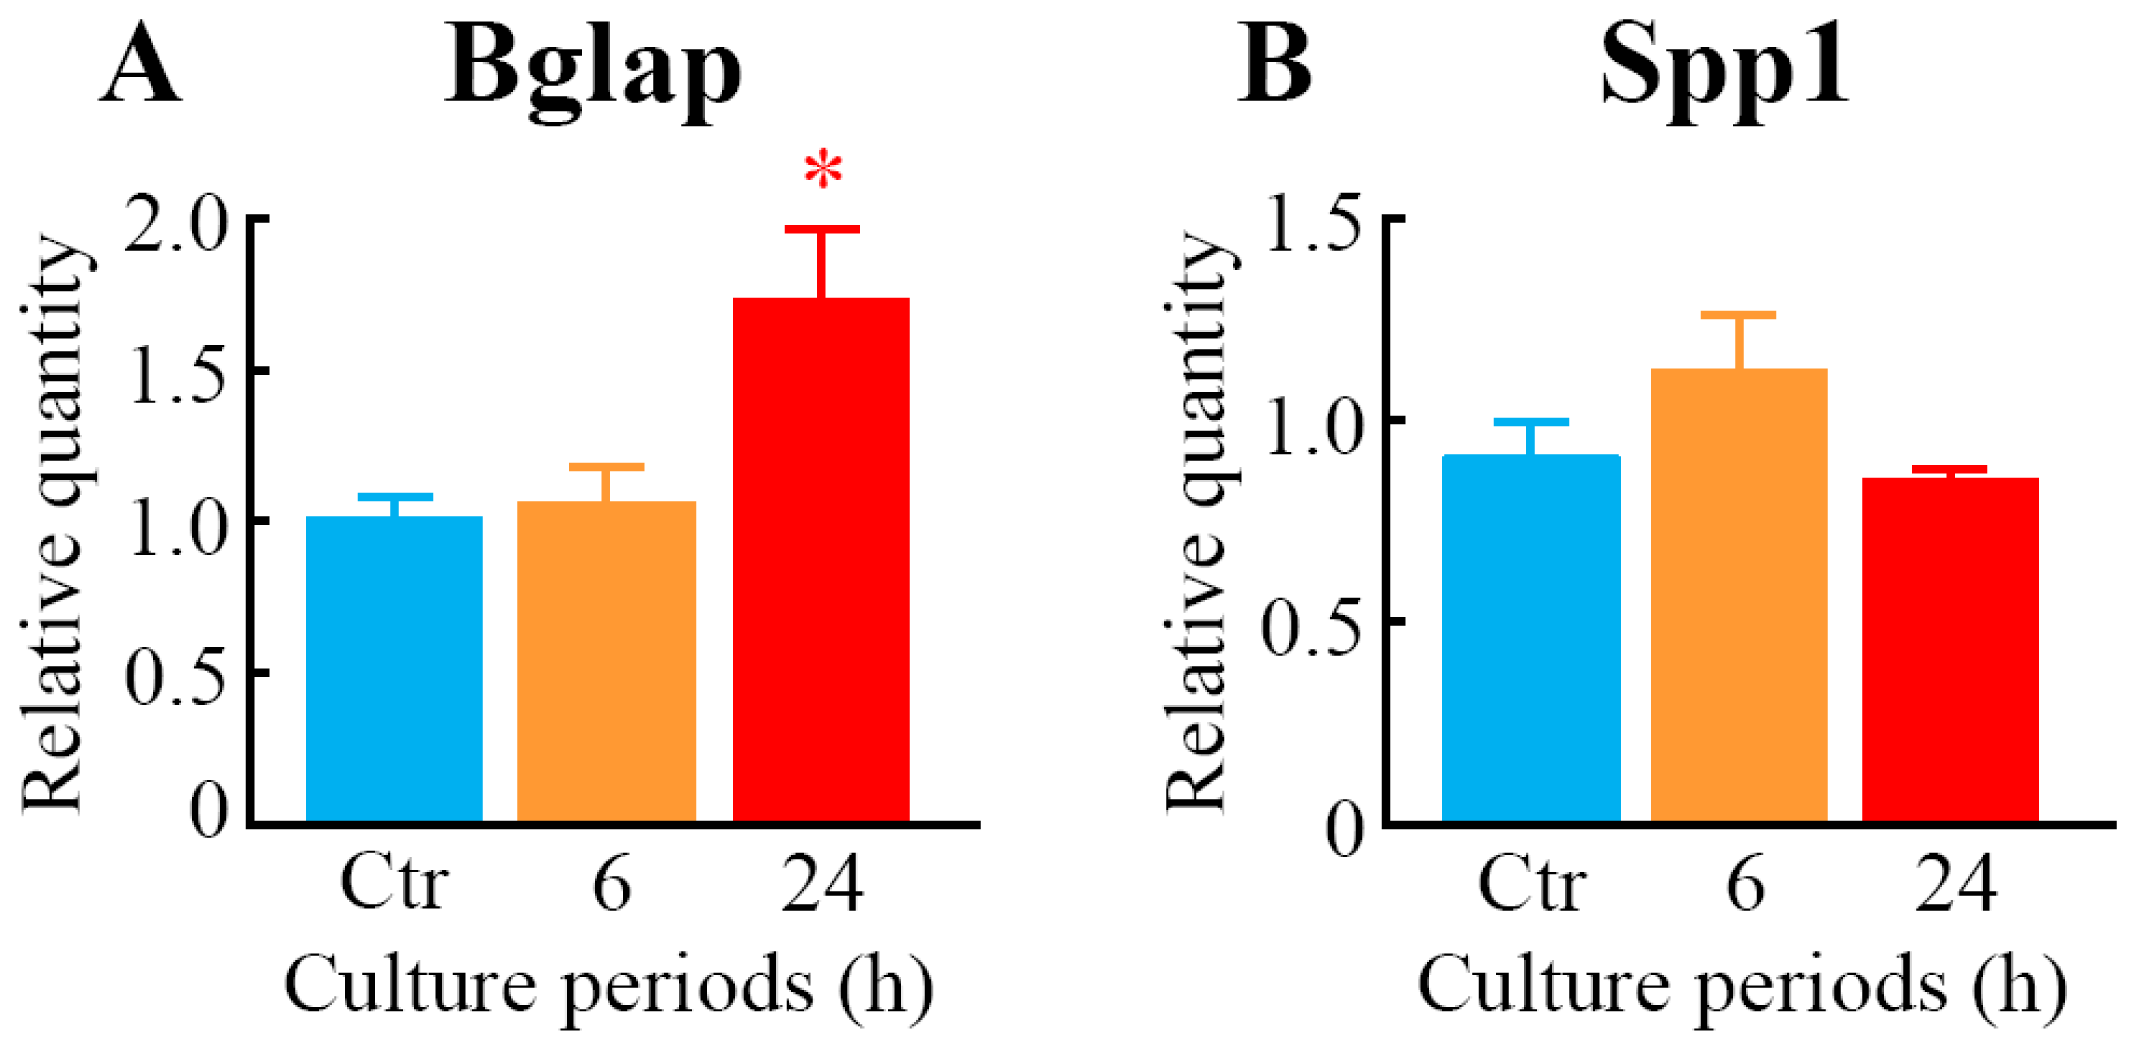
2.2. Effects of LIPUS on the Expression Level of mRNAs for Osteoblast Differentiation Marker Proteins

We measured the expression level of mRNAs for osteoblast differentiation marker proteins, bone gamma carboxyglutamate protein (Bglap; osteocalcin) and secreted phosphoprotein 1 (Spp1; osteopontin) in MC3T3-E1 cells. After 24 h of LIPUS treatment, the mRNA level of Bglap was significantly elevated compared to the control (Figure 2A). However, the expression of Spp1 was not changed by the LIPUS exposure (Figure 2B).

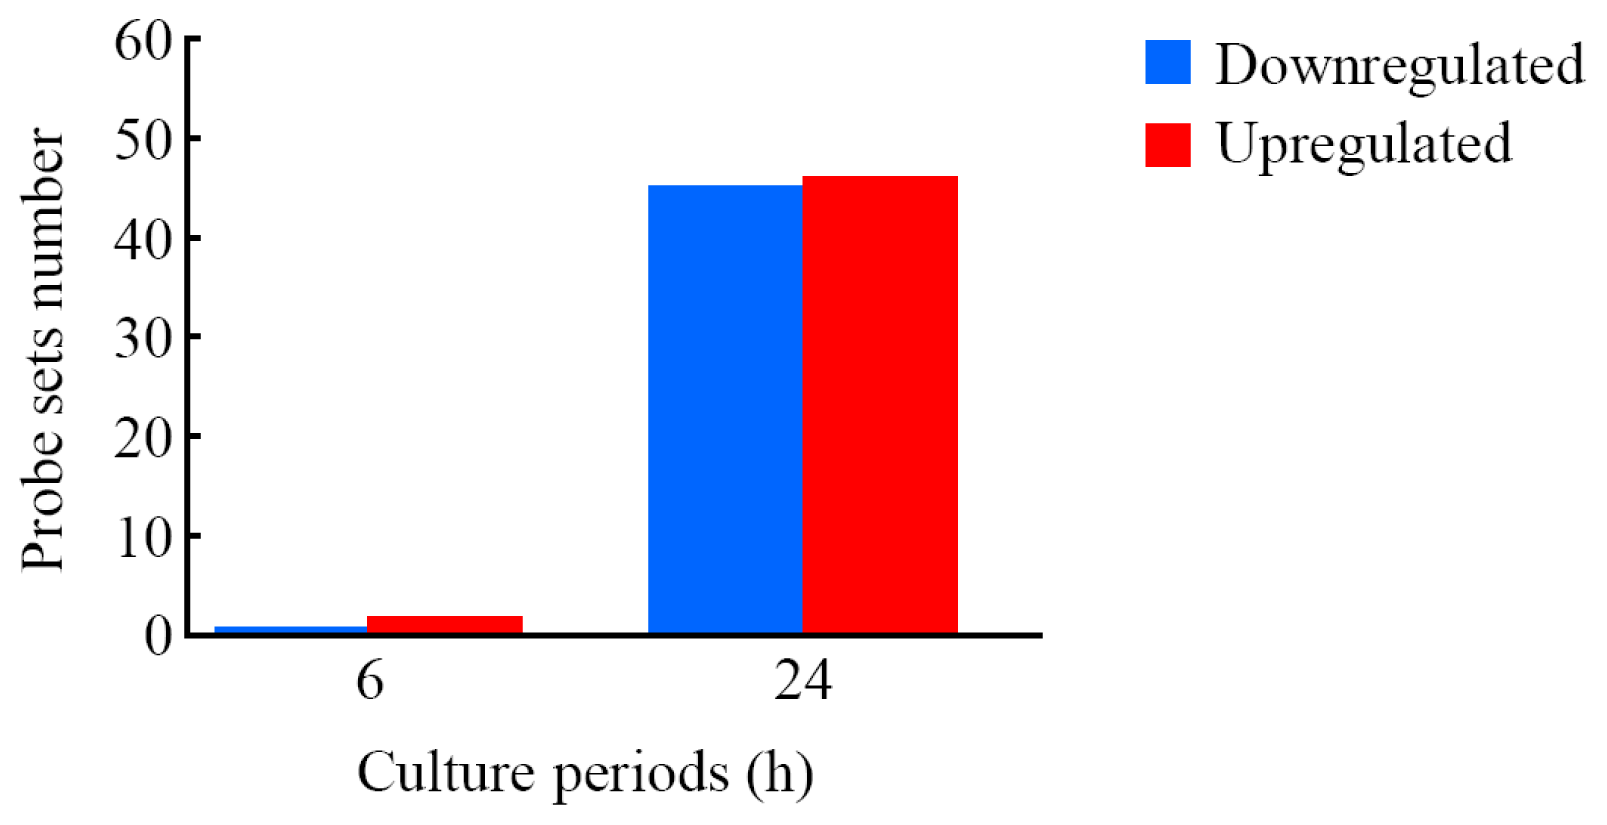
2.3. Genes Responsive to LIPUS

We carried out a global-scale oligonucleotide microarray analysis of the cells exposed to LIPUS followed by 6- and 24-h culture at 37 °C by means of a GeneChip® system with a Mouse Genome 430 2.0 array, which was spotted with 45,101 probe sets. We detected 17,945, 17,970 and 17,836 (mean, N = 3) probe sets that were expressed in the cells treated with mock (control), LIPUS plus 6-h culture and LIPUS plus 24-h culture, respectively. These results indicated that there was essentially no difference in the numbers of expressed probe sets among the three samples. The complete lists of probe sets from MC3T3-E1 cell samples are available on Gene Expression Omnibus (GEO), a public database (accession numbers: GSE45487).
The expression analysis in LIPUS-treated cells using GeneSpring® software demonstrated many probe sets that were differentially expressed by a factor of 1.5 or greater. The Venn diagrams in Figure S1 summarize the numbers of probe sets that were upregulated (Figure S1A,C) and downregulated (Figure S1B,D) in response to LIPUS treatment (6- and 24-h culture) in all three experiments. After 6-h LIPUS treatment, only one (ciliary rootlet coiled-coil, rootletin (Crocc)) and two probe sets (gelsolin (Gsn) and IQ motif and Sec7 domain 2 (Iqsec2)) were found to be upregulated and downregulated, respectively. On the other hand, 45 and 46 probe sets were found to be upregulated and downregulated, respectively, in the cells treated with LIPUS followed by 24-h culture. Lists of the probe sets that were upregulated and downregulated are shown in Tables 1 and 2, respectively. From these data, we found that one and 38 genes were upregulated or two and 37 genes downregulated after 6- and 24-h LIPUS exposure, respectively (Figure 3).

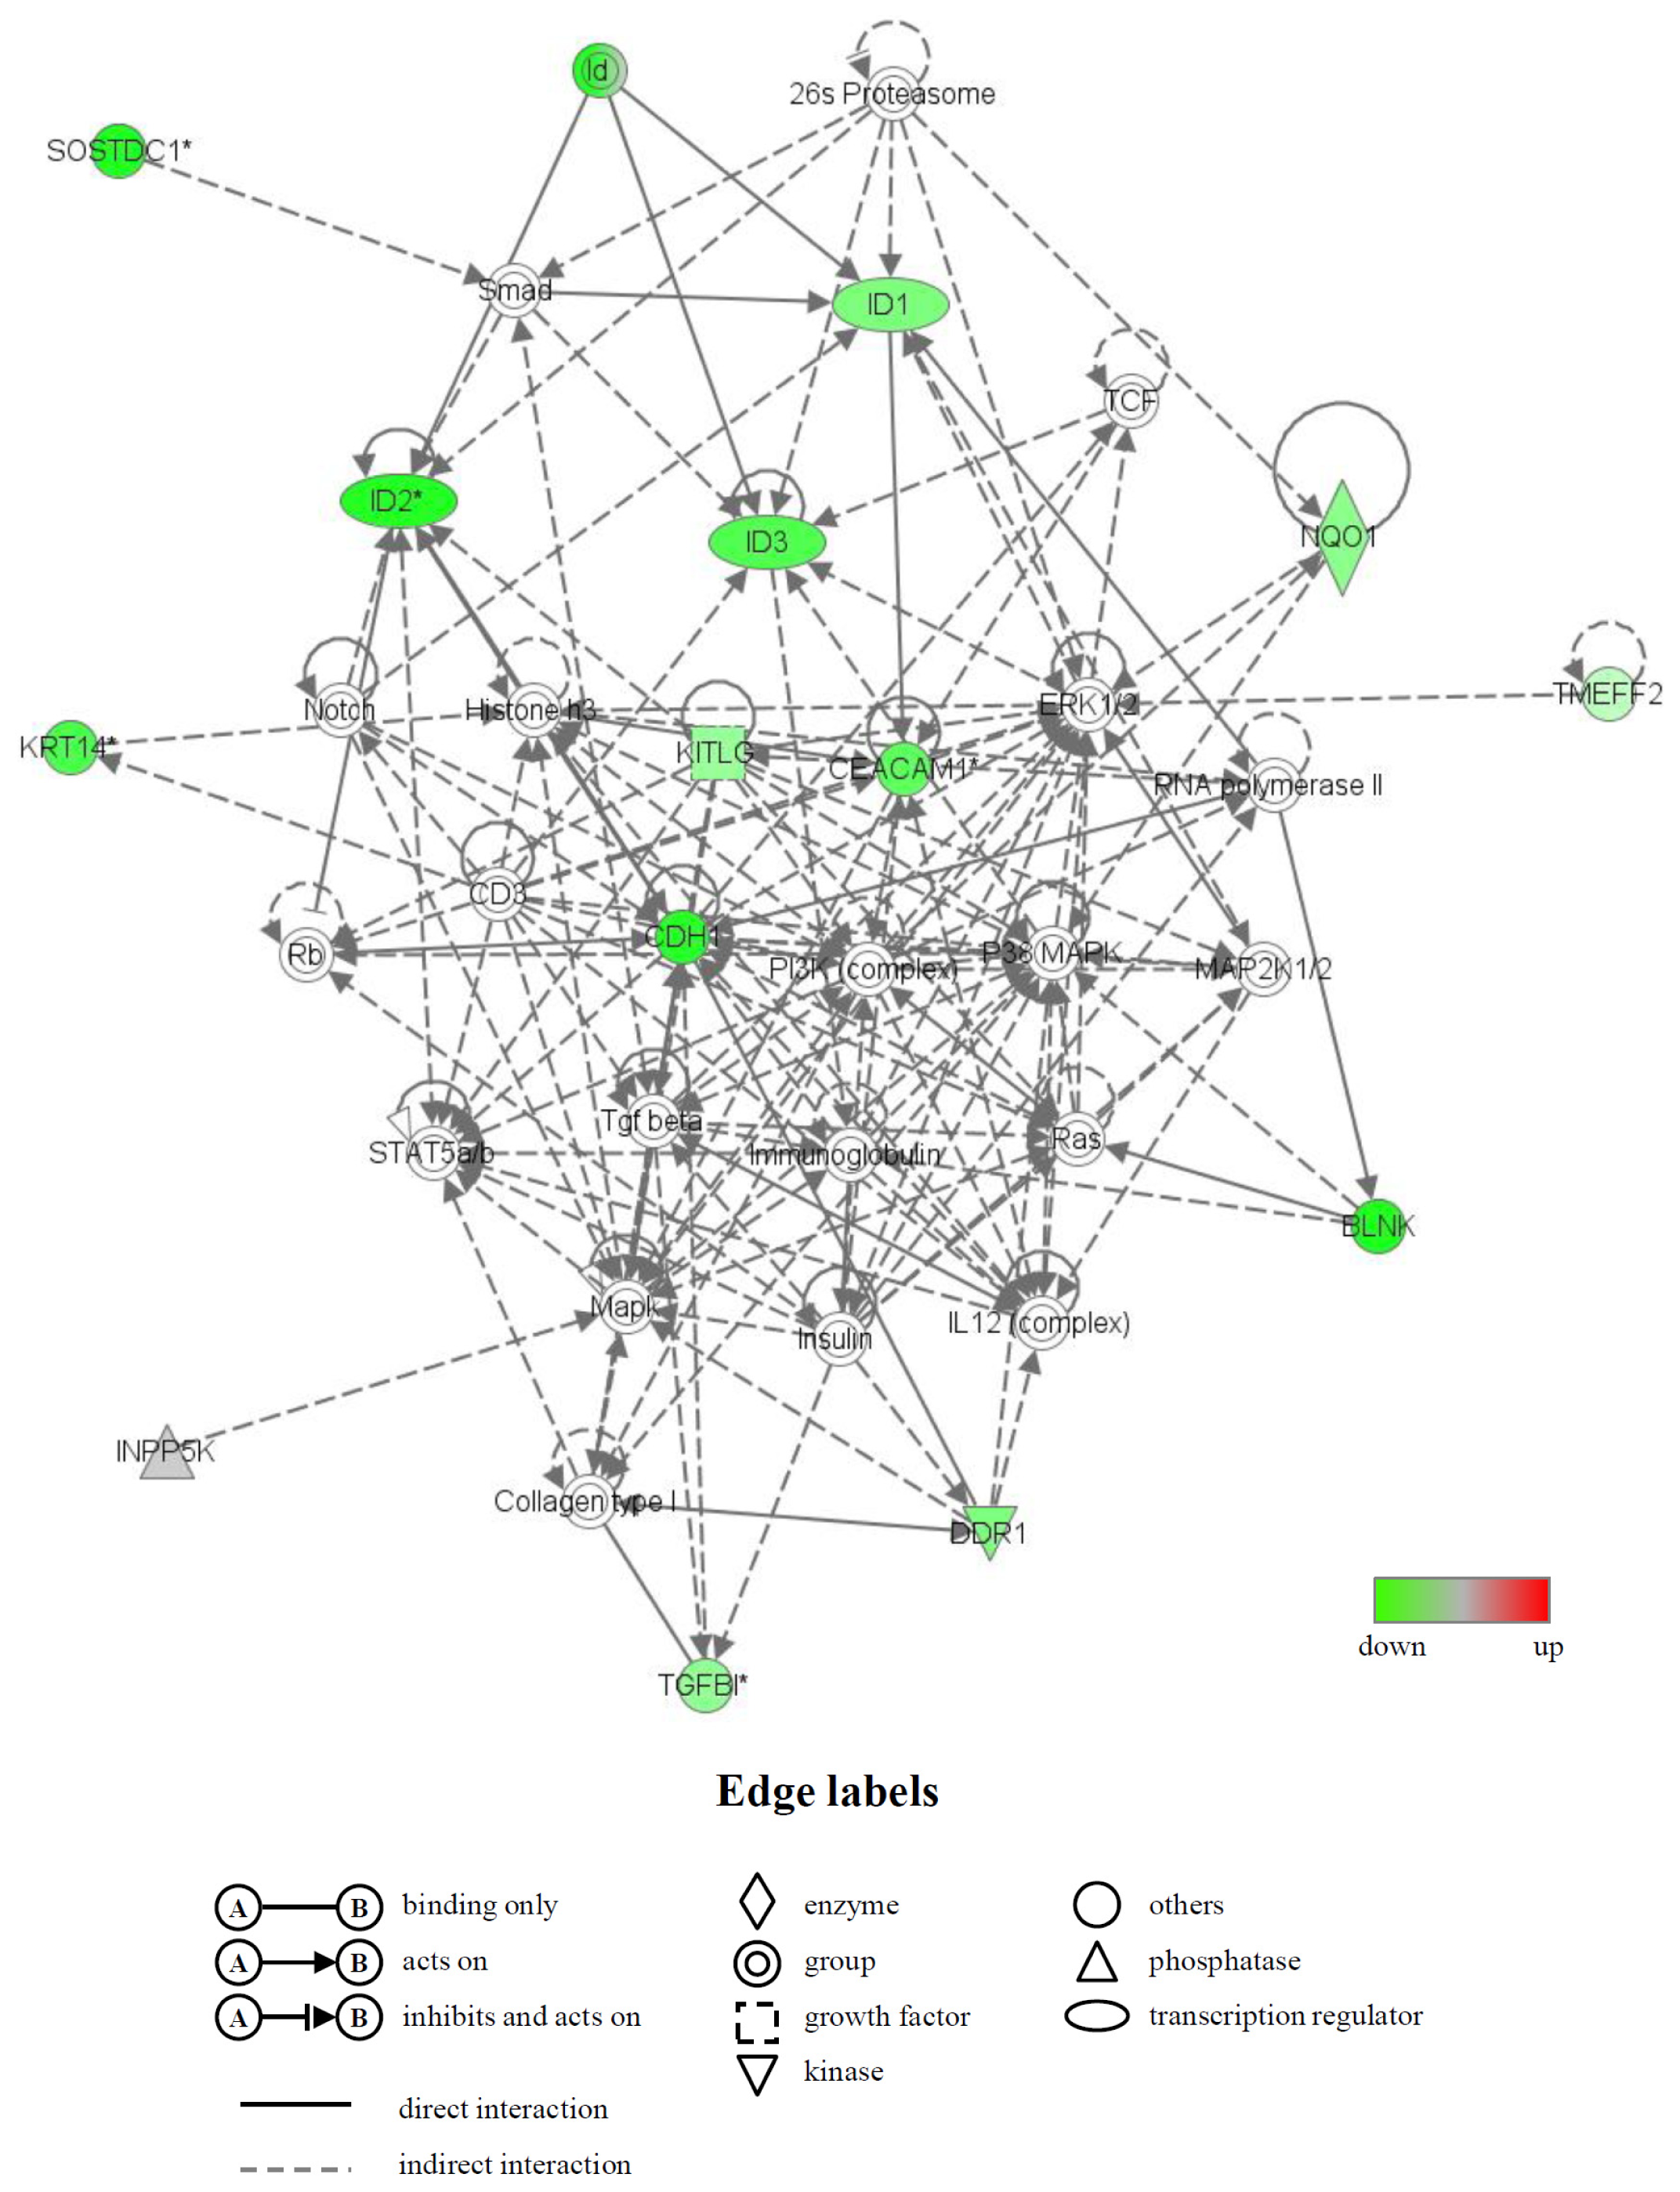
2.4. Identification of Biological Functions and Gene Networks

Functional category analysis of upregulated and downregulated genes in response to LIPUS followed by 24-h culture at 37 ° was conducted by using the Ingenuity® Pathways Knowledge Base. The numbers of functionally annotated genes among the 38 upregulated and 37 downregulated genes were 29 and 27, respectively (Tables S1 and S2). Five biological functions, i.e., skeletal and muscular system development and function (number of genes: 16), cellular movement (17), connective tissue development and function (12), embryonic development (14) and organ development (13) were observed in the functionally annotated upregulated genes (Table S1). In the functionally annotated downregulated genes, the biological functions were determined to be gene expression (number of genes: four), cell cycle (10), connective tissue development and function (7), cellular development (16) and cellular growth and proliferation (18) (Table S2).
Moreover, the biologically relevant networks of the differentially expressed genes identified from the GeneChip® analysis were depicted using the Ingenuity® Pathways Knowledge Base. Two significant gene networks, U (up) and D (down), were obtained from the functionally annotated upregulated and downregulated genes, respectively (Figures 4 and 5). The gene network U contained CD200 antigen (Cd200), dentin matrix protein 1 (Dmp1), fibrillin 1 (Fbn1), insulin-like growth factor 2 (Igf2), lumican (Lum), matrix metallopeptidase 13 (Mmp13), osteomodulin (Omd) and thrombospondin 1 (Thbs1) and was associated with biological functions, such as cardiovascular disease, skeletal and muscular system development and function and organ morphology. In this network, six genes (Dmp1, Fbn1, Igf2, Lum, Mmp13 and Thbs1), whose names are highlighted in blue, were mainly associated with bone morphology (functions annotation) in the category of biological functions (skeletal and muscular system development and function) (Figure 4). The gene network D contained inhibitor of DNA binding (Id) genes, Id1, Id2 and Id3, and keratin 14 (Krt14) and was associated with biological functions, such as gene expression, cell cycle and connective tissue development and function (Figure 5).

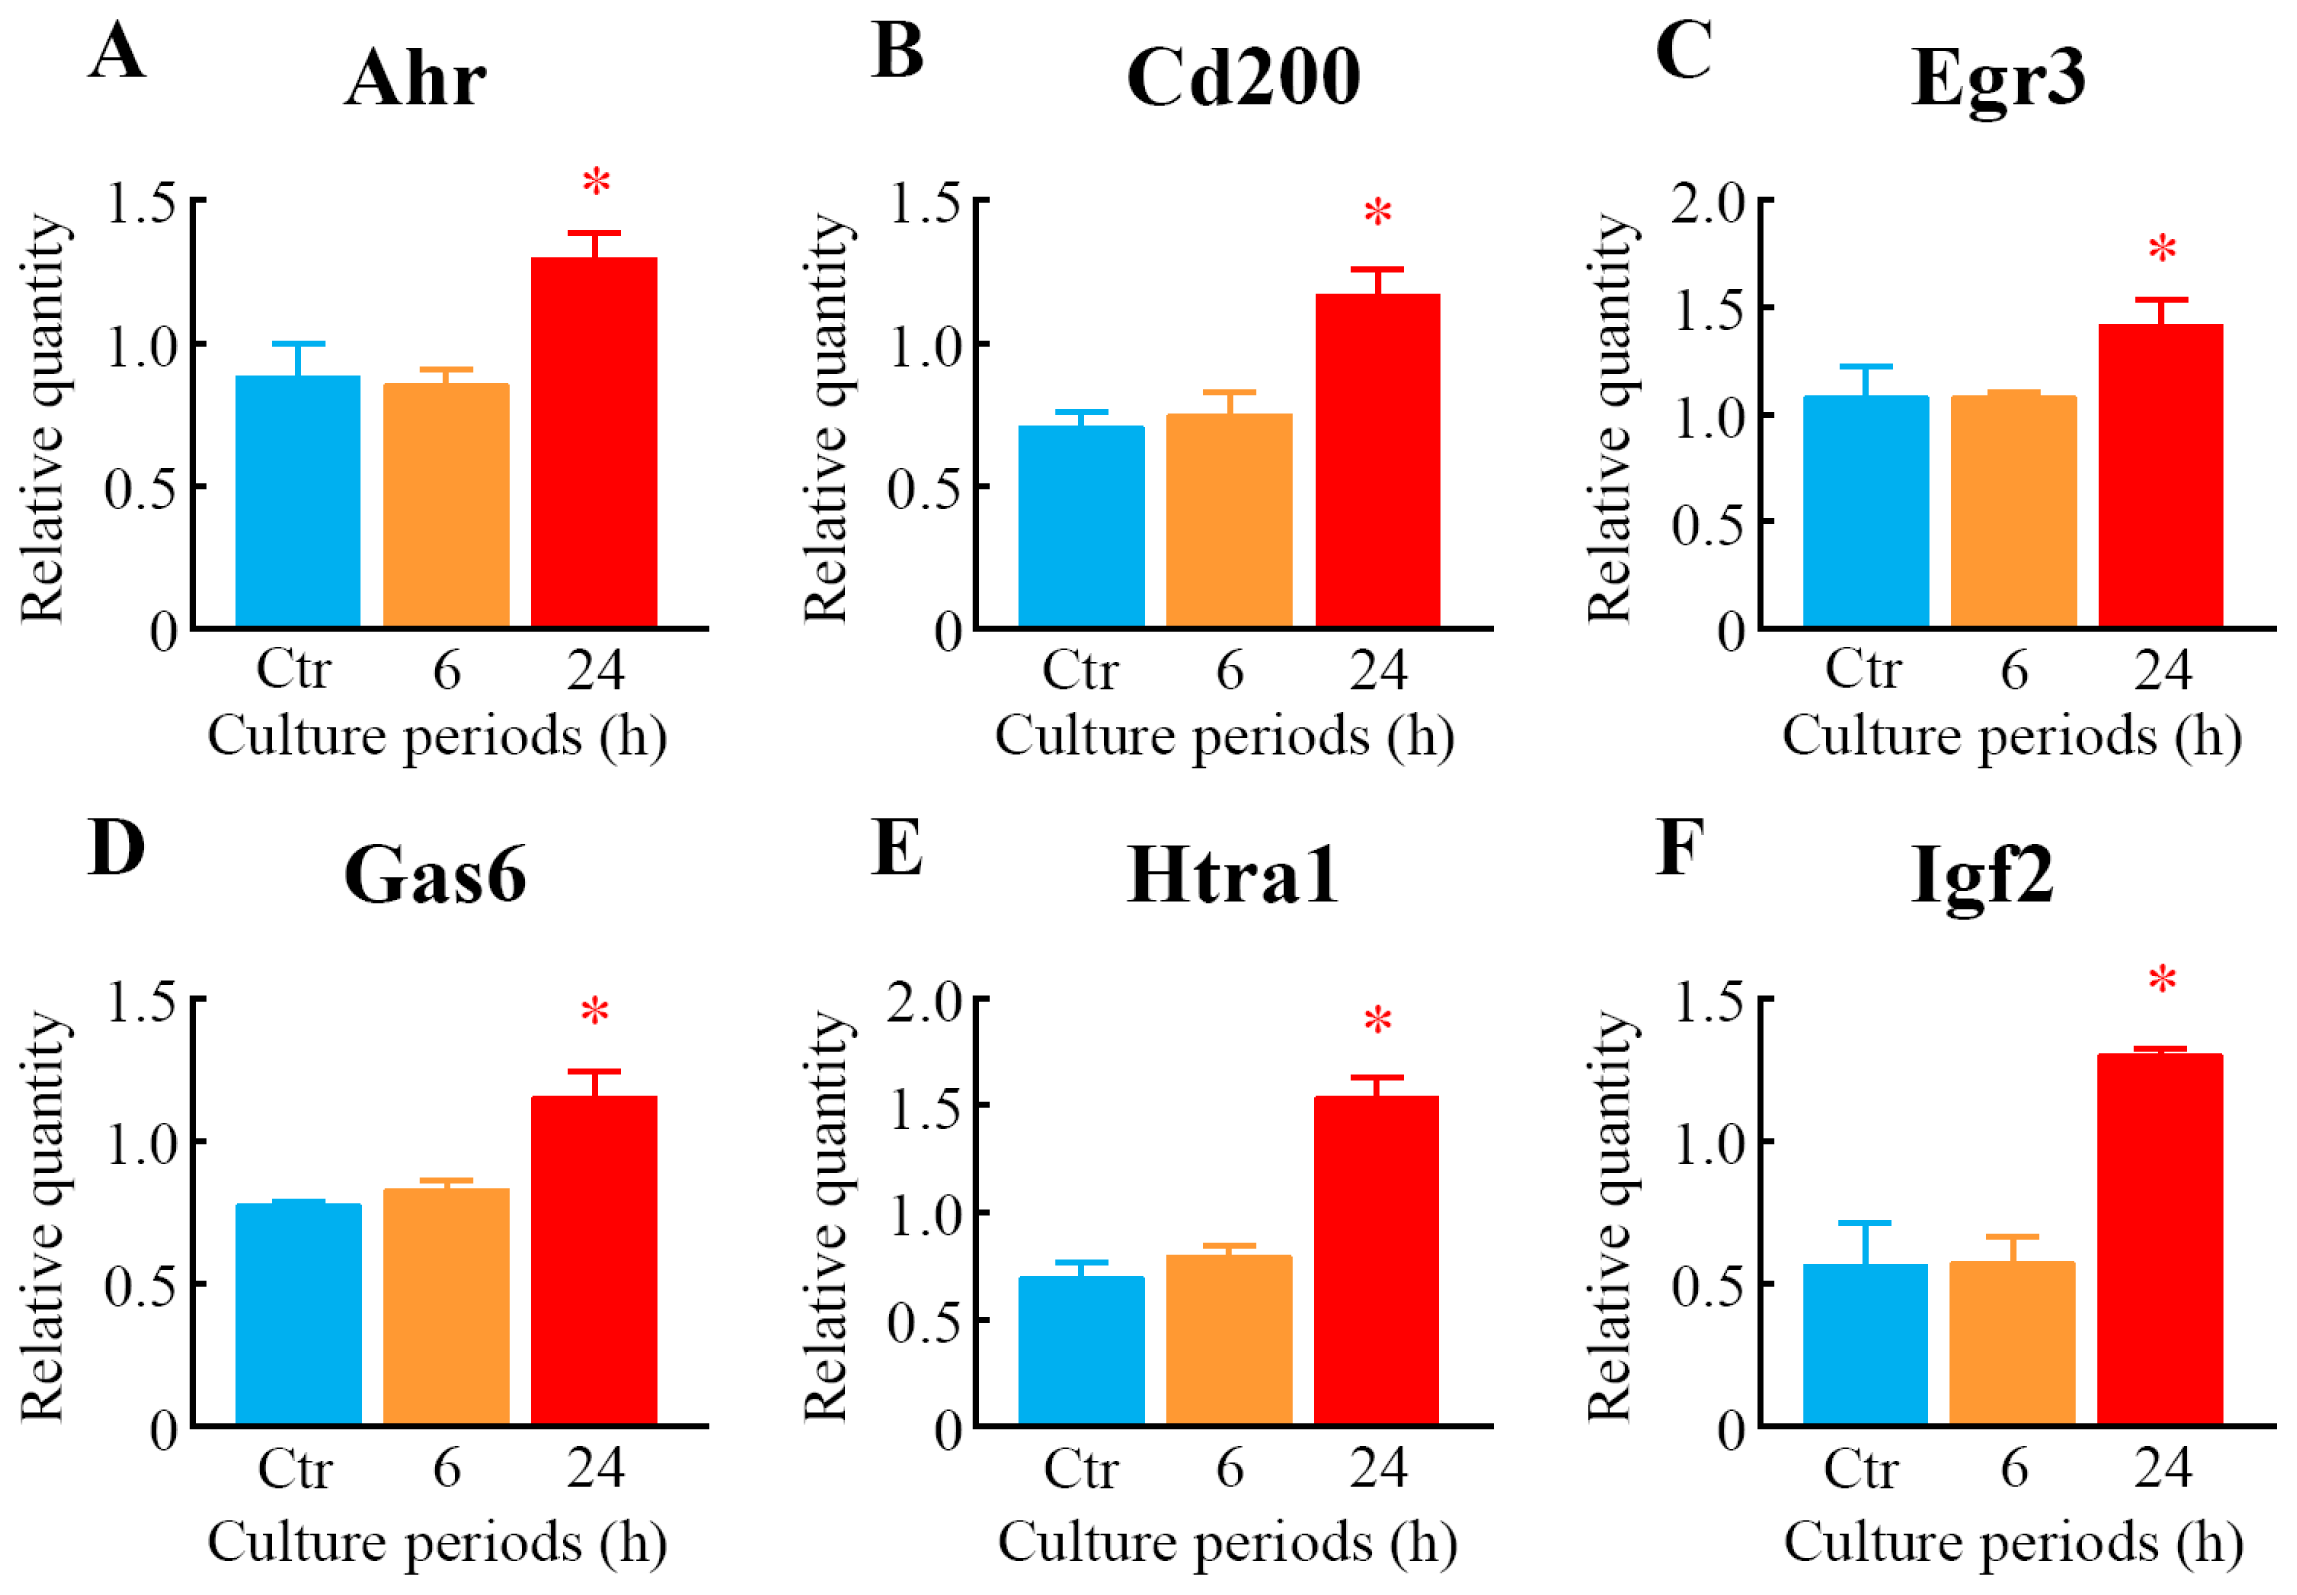
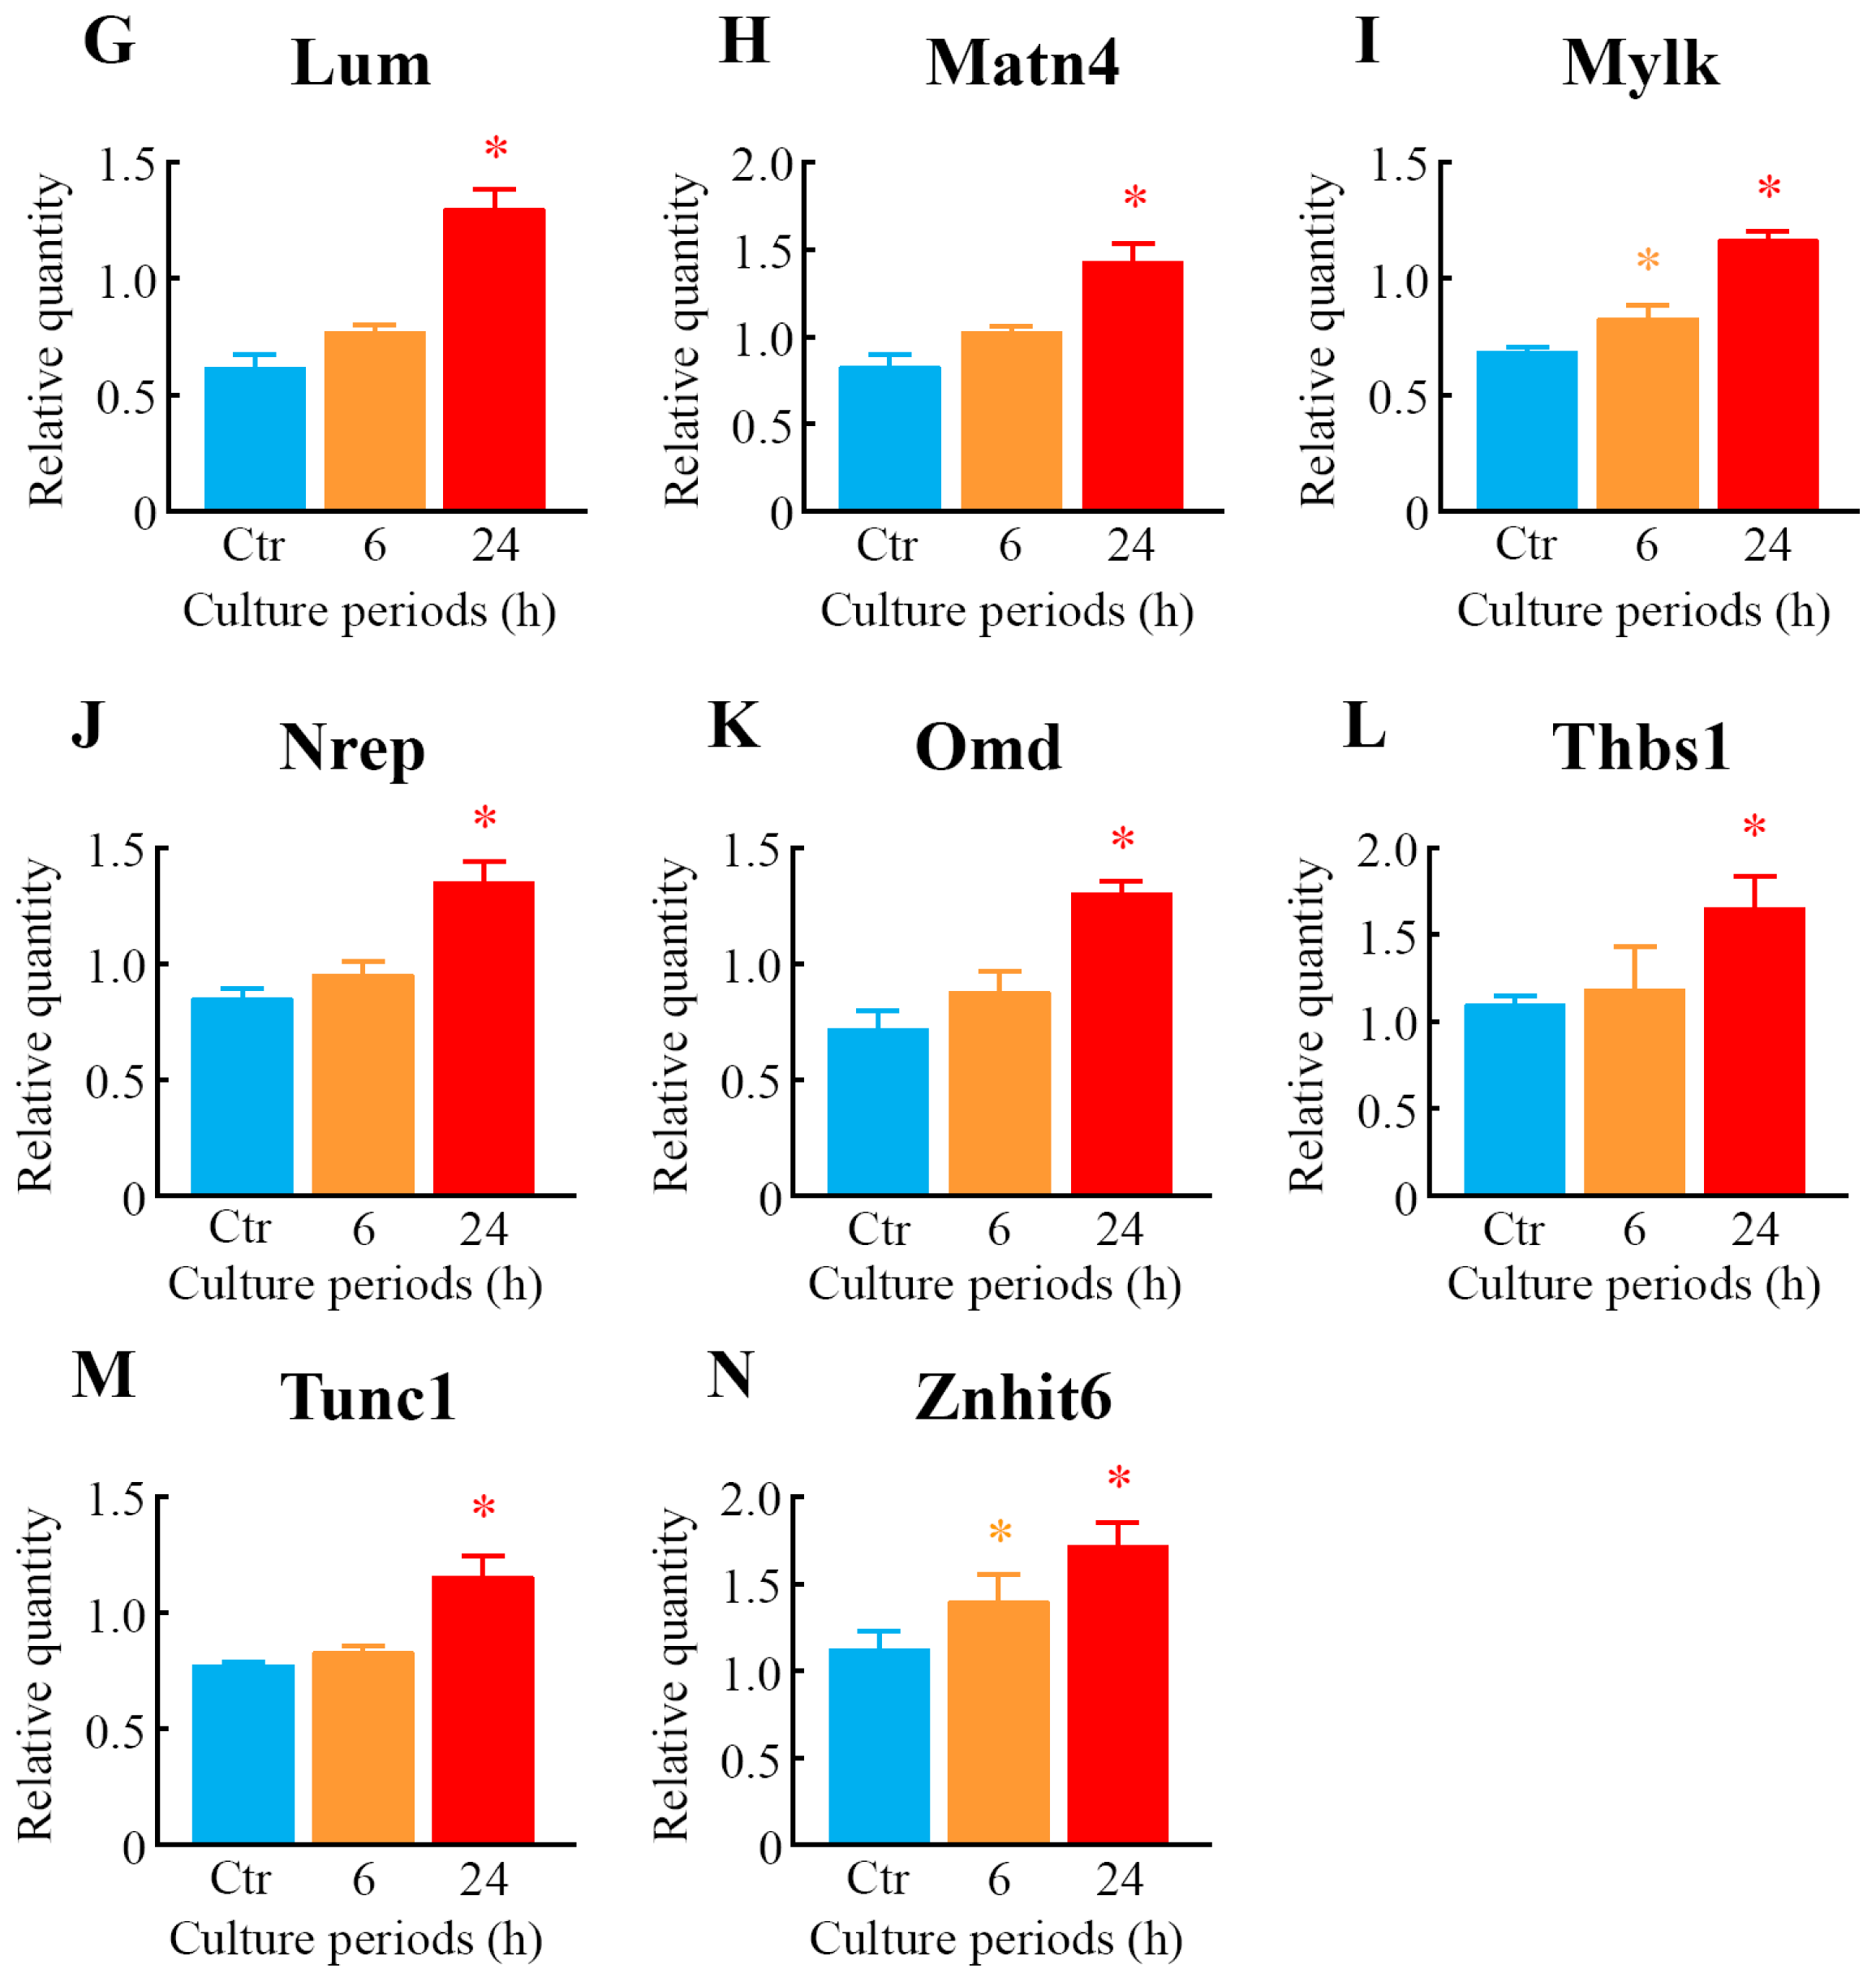
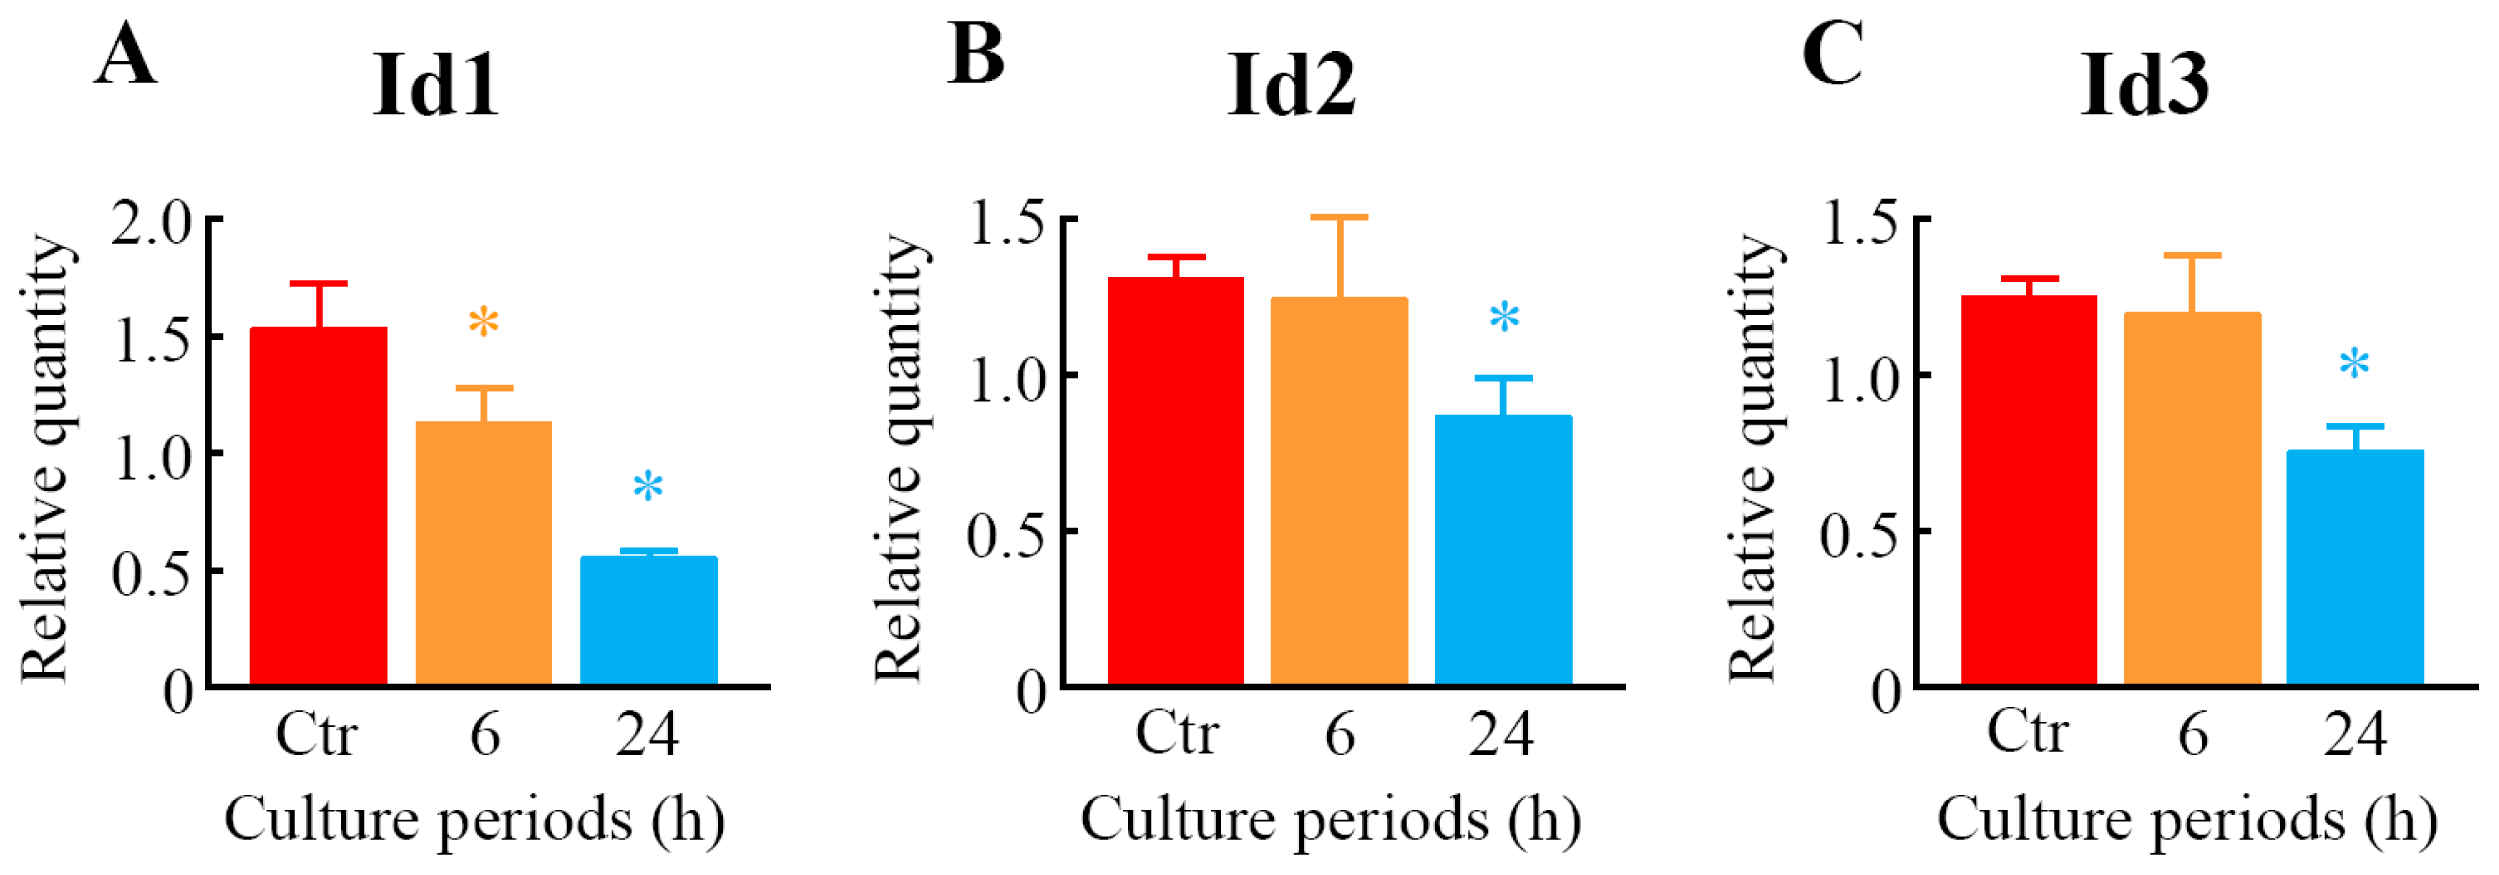
2.5. Quantitative Analysis of Differentially Expressed Genes

To further explore the results of GeneChip® analysis, a real-time quantitative polymerase chain reaction (PCR) assay was carried out. Seventeen genes were selected from among the genes that were upregulated or downregulated in response to LIPUS treatment. The expression levels of 14 genes, i.e., aryl-hydrocarbon receptor (Ahr), Cd200, early growth response 3 (Egr3), growth arrest specific 6 (Gas6), HtrA serine peptidase 1 (Htra1), Ifg2, Lum, matrilin 4 (Matn4), myosin, light polypeptide kinase (Mylk), neuronal regeneration related protein (Nrep), Omd, Thbs1, troponin C, cardiac/slow skeletal (Tnnc1) and zinc finger, HIT type 6 (Znhit6), were significantly upregulated (Figure 6), whereas three genes, such as Id1, Id2, and Id3, were significantly downregulated in the cells treated with LIPUS (Figure 7). After 6-h LIPUS treatment, significant upregulations of Mylk and Znhit6 and downregulation of Id1 were detected (Figures 6 and 7). These data were similar to the results of microarray analysis.

3. Discussion

Within the fields of orthopedics, LIPUS has been used to promote bone fracture healing [36]. Although numerous studies have been conducted on this issue [738], the molecular mechanisms by which LIPUS affects bone cells have not been well understood. The use of in vitro cell culture systems has been of central importance for research at the cellular and molecular levels. The present study employed high-density oligonucleotide microarray analysis combined with computational gene expression analysis tools to demonstrate, for the first time, that many genes were responsive to LIPUS in MC3T3-E1 preosteoblast cells.
A number of previous reports [2439] clearly indicated that LIPUS had positive effects on differentiation, gene expression, mineralization and proliferation under in vitro cell culture conditions, although the degree of these effects differed among studies. It is assumed that differences in the experimental conditions, such as the intensity of LIPUS, exposure period, cell type and culture conditions, contributed to discrepancies in the biological effects of LIPUS reported. Unsworth et al. [27] demonstrated that the ALP activity was significantly increased at days 6 to 10, but not at days 2 and 4 in MC3T3-E1 cells treated with once daily LIPUS (30 mW/cm2 for 20 min). Using rat osteoblastic ROS 17/2.8 cells, Takayama et al. [26] found that ALP activity was increased at day 7 of culture after transient LIPUS (30 mW/cm2 for 20 min) stimulation without affecting the cell proliferation. A single LIPUS (30 mW/cm2 for 20 min) treatment induces RANKL and chemokines via the angiotensin II type 1 receptor, while this stimulation does not affect the expressions of ALP and Bglap in MC3T3-E1 cells [25]. In mouse bone-marrow-derived stromal ST2 cells, once LIPUS (30 mW/cm2 for 20 min) exposure induced significant increases in the expressions of Bglap, as well as FBJ osteosarcoma oncogene (Fos), an immediate-early gene [32]. In this study, although neither cell growth nor ALP activity was influenced by a single exposure of MC3T3-E1 cells to LIPUS (30 mW/cm2 for 20 min), significant elevation of the mRNA level of Bglap was observed in the LIPUS-treated cells.
In the present study, many of the 38 and 37 genes that were upregulated or downregulated by 1.5-fold or more, respectively, were identified in the cells after LIPUS treatment. Seventeen genes were validated by real-time quantitative PCR assay, which was consistent with the microarray data. Of these 75 genes, Mmp13 and Dmp1 are indicated to be related to LIPUS [27,37,42,43]. The expression level of Mmp13 was reported to be affected by LIPUS; LIPUS (30 mW/cm2 for 20 min per day) significantly increased the expression of Mmp13 mRNA in MC3T3-E1 cell culture at day 10 [27] and in nucleus pulposus HNPSV-1 cell culture at day 3 [37], whereas LIPUS (7.5, 30 and 120 mW/cm2) significantly and dose-dependently inhibited Mmp13 expression in isolated rat chondrocytes [42]. Recent findings demonstrated no statistically significant difference between the control and LIPUS (30 mW/cm2)-treated groups in the expression of Dmp1 on a human tooth slice organ culture [43]. To the best of our knowledge, 73 genes out of 75 genes were not previously reported as related to the LIPUS response.
In addition, to study the molecular functions and gene networks, the microarray data were analyzed using Ingenuity® Pathway Analysis tools. Of particular interest in this study was the identification of gene network U, which contained many upregulated genes that were principally associated with bone morphology. Six of the genes in this network, Dmp1 [44], Fbn1 [45], Igf2 [46], Lum [47], Mmp13 [48] and Thbs1 [49], have previously been shown to be involved in bone morphology. In addition, a number of genes in the gene network U, including Cd200, Dmp1, Igf2 and Nr4a1, have been shown to be expressed in osteoblasts [50] and to participate in the development and/or differentiation of osteoblasts. For example, the Cd200-Cd200 receptor axis was shown to be a possible regulator of bone mass, via the formation of osteoclasts in this study using Cd200-knockout mice [51]. A significant increase in the expression of Dmp1, an intermediate and late marker of bone cell differentiation, was detected in fully differentiated osteoblasts [50], and the addition of Dmp1 protein to osteoblast cells markedly induced cell differentiation [52]. We also identified gene network D, which included many downregulated genes. Interestingly, this network contained the Id genes (other designation: inhibitor of differentiation), Id1, Id2 and Id3, all of which belong to the helix-loop-helix (HLH) transcription factors and can form heterodimers among the basic HLH transcription factors [53]. All Id family members are reported to decrease the differentiation of bone cells, including osteoblasts [53,54]. The genes that were differentially expressed and/or belonged to gene networks are likely to be involved in the acceleration of fracture healing by LIPUS. However, further experiments will be needed to confirm this.
There are two research papers investigating the effects of LIPUS on gene expression in osteoblastic cells using global-scale microarray analysis. Leskinen et al. [28] indicated that 377 genes were regulated two-fold by a single LIPUS (1.035 MHz; mean acoustic peak pressure, 128–510 kPa; for 30 min) in human osteoblastic osteosarcoma MG-63 cells. They also suggested that LIPUS affects the genes involved with the cellular membrane and regulation of transcription, but not with osteoblast differentiation [28]. Lu et al. [29] identified 165 genes whose expressions were changed more than two-fold in human osteoblastic osteosarcoma SaOS-2 cells treated with a single LIPUS (30 mW/cm2 for 20 min). These genes belonged to more than ten protein families, including integrins and cytoskeleton genes, the transforming growth factor-beta family and the insulin-like growth factor family [29]. Moreover, Kobayashi et al. [37] previously showed using cDNA microarrays that LIPUS (30 mW/cm2 for 20 min) once daily for three days significantly induced 114 genes that were differentially expressed, and these genes included growth factor-related proteins, proteoglycans, collagens and matrix metallopeptidases. We identified 193 genes that were downregulated more than 1.5-fold and 201 genes that were upregulated more than 1.5-fold using a GeneChip microarray system in human lymphoma U937 cells treated with a single LIPUS (300 mW/cm2 for 1 min) [39]. Here, a total of 75 genes were differentially expressed in preosteoblast MC3T3-E1 cells at 24 h after LIPUS (30 mW/cm2 for 20 min) exposure. However, almost all of the genes that were differentially expressed and identified here were not reported in these four microarray studies [28,29,37,39]. As in the case of the biological effects of LIPUS, this discrepancy may have been due to the different experimental conditions, particularly with respect to the cell origin. Elucidation of the detailed mechanisms underlying the changes in gene expression responsive to LIPUS remains for further investigations.

4. Experimental Section

4.1. Cell Culture

The mouse preosteoblast cell line, MC3T3-E1, was provided by the: RIKEN BioResource Center (RIKEN BRC) through the National Bio-Resource Project of the Ministry of Education, Culture, Sports, Science and Technology of Japan (MEXT; Tsukuba, Japan). The cells were routinely cultured in minimum essential medium with alpha modification (MEMα; Wako Pure Chemical Industries, Ltd., Osaka, Japan) supplemented with 10% fetal bovine serum (FBS; Equitech-Bio, Inc., Kerrville, TX, USA) at 37 °C in humidified air with 5% CO2.

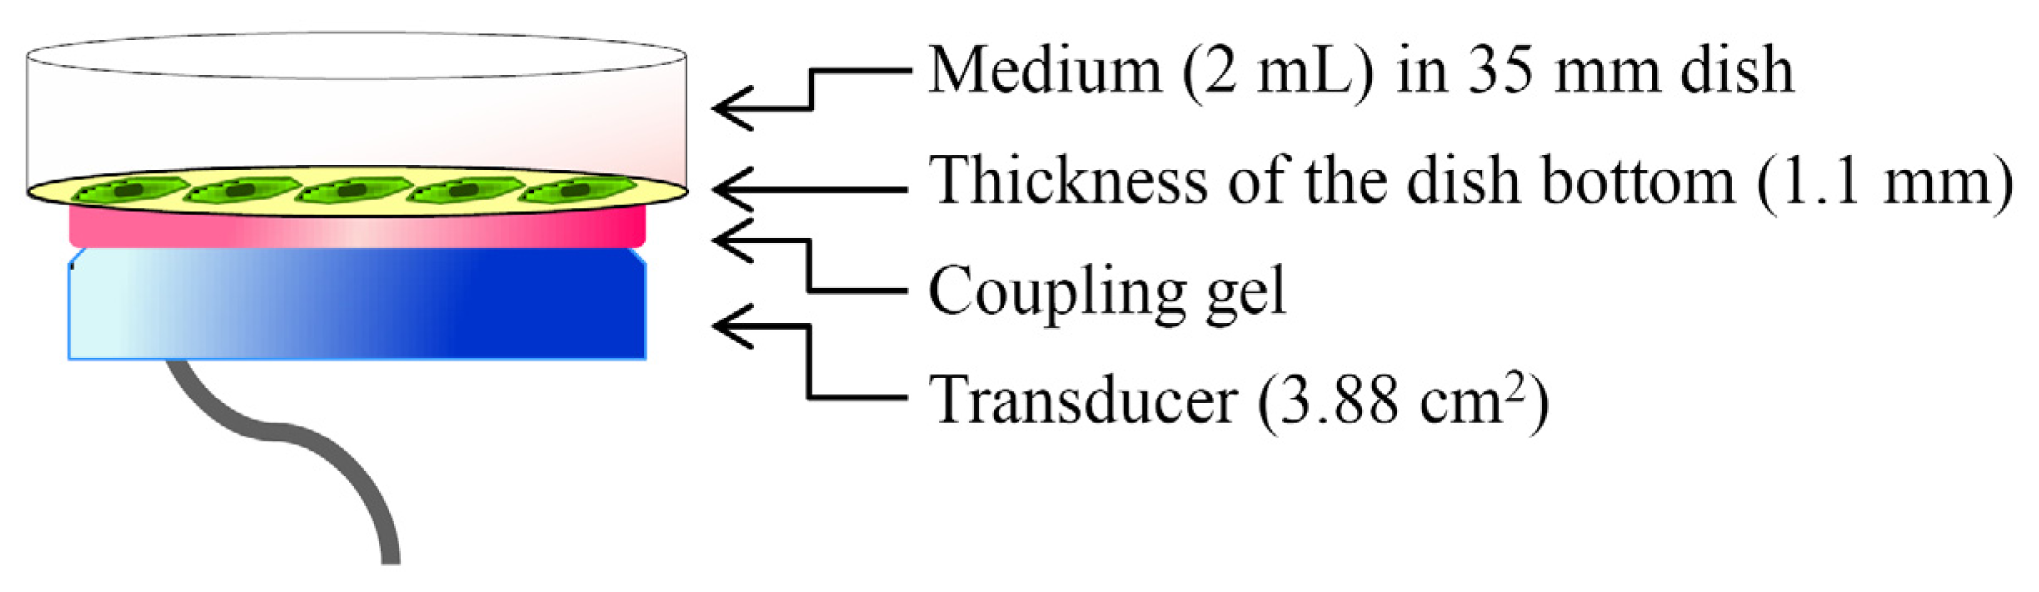
4.2. LIPUS Treatment

LIPUS treatment was applied by a sonic accelerated fracture-healing system (SAFHS) apparatus (SAFHS 4000J; Teijin Pharma, Ltd., Tokyo, Japan). This apparatus is the same as Exogen’s SAFHS apparatus (Exogen Inc., Piscataway, NJ, USA). The signal had a spatial average-temporal average (SATA) intensity of 30 mW/cm2, with a frequency of 1.5 MHz in a pulsed-wave mode (0.2-s burst sine waves repeated at 1.0 kHz).
The cells were cultivated in MEMα supplemented with 10% FBS, 0.3 mM L-ascorbic acid (Wako Pure Chemical Industries, Ltd., Osaka, Japan) and 10 mM β-glycerophosphate (Calbiochem, La Jolla, CA, USA) at 37 °C for 14 days. After trypsinization with 0.25% trypsin-0.91 mM EDTA solution, the cells (5 × 10⁵ cells) were seeded on a 35-mm plastic culture dish (ASAHI GLASS Co., Ltd., Tokyo, Japan) with 2 mL of culture medium and cultured at 37 °C for 24 h. It has been demonstrated that LIPUS is applied to cells from the upper [26,38] or lower side [25,2729,31,33,3537,39] of the culture dish. As demonstrated in Figure 8, LIPUS was transmitted through the bottom of the culture dish with standard US coupling gel (Teijin Pharma, Ltd., Tokyo, Japan). Attached cells in the dish were sonicated for 20 min at 37 °C in a CO2 incubator. After sonication, the cells were incubated at 37 °C in a CO2 incubator for the indicated period before the experiments.

4.3. Measurement of Cell Number

The cells were exposed to LIPUS followed by 0, 6, 24 and 48 h culture at 37 °C, were washed once with Ca2+/Mg2+-free phosphate buffered saline (PBS) and, then, treated with 0.25% trypsin-0.91 mM EDTA solution. The number of detached cells was counted using a Burker Turk hemocytometer.

4.4. Measurement of ALP Activity

The cells were exposed to LIPUS followed by 0, 6, 24 and 48 h culture at 37 °C, were washed once with Ca2+/Mg2+-free PBS and scraped using a plastic policeman. Cellular material was placed into 50 mM Tris-HCl buffer (pH 7.2) containing 0.01% Triton X-100 and homogenated by an ultrasonic disruptor (UD-200, TOMY SEIKO Co., Tokyo, Japan). The protein concentration was measured using a BCA Protein Assay Kit (Pierce; Rockford, IL, USA). ALP activity of the cell homogenate was measured by using a protocol supplied by Sigma (Sigma-Aldrich, Co., St. Louis, MO, USA).

4.5. RNA Isolation

The cells were exposed to LIPUS followed by 6 and 24 h culture at 37 °C. Total RNA was extracted from cells using an RNeasy Total RNA Extraction Kit (Qiagen K.K., Tokyo, Japan) along with on-column DNase I treatment (RNase-free DNase kit, Qiagen K.K., Tokyo, Japan). RNA quality was analyzed using a Bioanalyzer 2100 (Agilent Technologies, Inc., Santa Clara, CA, USA). RNA samples that had RNA integrity number (RIN) values above 9.5 were considered acceptable.

4.6. High-Density Oligonucleotide Microarray and Computational Gene Expression Analyses

Gene expression was analyzed using a GeneChip® system with a Mouse Genome 430 2.0 array (Affymetrix, Inc., Santa Clara, CA, USA) spotted with 45,101 probe sets. Samples for array hybridization were prepared as described in the Affymetrix GeneChip® Expression Technical Manual. In short, 500 ng of total RNA were used to synthesize cRNA with a GeneChip® 3′ IVT Express Kit (Affymetrix, Inc., Santa Clara, CA, USA). After fragmentation, biotin-labeled cRNA was hybridized to the array at 45 °C for 16 h. The arrays were washed, stained with streptavidin-phycoerythrin and scanned using a probe array scanner. The obtained hybridization intensity data were further analyzed using GeneSpring® GX (Agilent Technologies, Inc., Santa Clara, CA, USA) to extract the significant genes. To examine gene ontology, including biological processes, cellular components, molecular functions and gene networks, the obtained data were analyzed using Ingenuity® Pathway Analysis tools (Ingenuity Systems, Inc., Mountain View, CA, USA), a web-delivered application that enables the identification, visualization and exploration of molecular interaction networks in gene expression data [3941].

4.7. Real-Time Quantitative PCR Assay

Complementary DNA was produced from total RNA using an ExScript RT Reagent Kit (Takara Bio Inc., Shiga, Japan) with a random 6 mers and an oligo dT primer. Real-time quantitative PCR was performed on an Mx3005P real-time PCR system (Agilent Technologies, Inc., Santa Clara, CA, USA) using SYBR® PreMix ExTaq (Takara Bio Inc., Shiga, Japan). The specific primer and probe sequences are listed in Table S3. The temperature cycling conditions for each primer consisted of 10 s at 95 °C followed by 40 cycles of 15 s at 95 °C and 40 s at 60 °C. The dissociation analysis was carried out over a range from 55 °C to 95 °C by monitoring SYBR green fluorescence, and PCR-specific products were determined as a single peak in the melting curves at more than 80 °C. In addition, the specificity of primers was confirmed as a single band with the correctly amplified fragment size through an agarose gel electrophoresis of the PCR products. Glyceraldehyde-3-phosphate dehydrogenase (Gapdh) was used as an internal control.

4.8. Statistical Analysis

Results were expressed as the means ± standard deviation (SD). Differences in the means were analyzed using the Student’s t-test, and p values < 0.05 were regarded as statistically significant.

5. Conclusions

In conclusion, we discovered a number of differentially expressed genes in MC3T3-E1 preosteoblast cells treated with LIPUS. These results should help to further clarify the molecular basis of the mechanisms of the LIPUS response in osteoblast cells.

Supplementary Information

ijms-14-22721-s001.pdf
Figure 1. The effects of low-intensity pulsed ultrasound (LIPUS) on cell growth and Alkaline Phosphatase (ALP) activity in preosteoblast MC3T3-E1 cells. Cells were exposed to LIPUS at 30 mW/cm2 for 20 min followed by 0, 6, 24, and 48 h culture at 37 °C. The cell number (A) and ALP activity (B) were measured. Mock-treated cells served as a control. Data indicate the means ± SD for four different experiments.
Ijms 14 22721f1
Figure 2. The effects of LIPUS on expression levels of mRNAs for osteoblast differentiation marker proteins. Cells were exposed to LIPUS at 30 mW/cm2 for 20 min followed by 6- and 24-h culture at 37 °C. Real-time quantitative PCR was carried out with specific primers for Bglap (A) and Spp1 (B). Mock-treated cells served as a control (Ctr). Data indicate the means ± SD for four different experiments. * p < 0.05 vs. Ctr by the Student’s t-test.
Ijms 14 22721f2
Figure 3. Number of probe sets that were differentially expressed in cells treated with LIPUS. Cells were exposed to LIPUS (30 mW/cm2, for 20 min), followed by culturing at 37 °C for six- and 24-h. Gene expression analysis of the probe sets that were upregulated and downregulated by a factor of 1.5 or greater was conducted using GeneSpring® software. The number of commonly expressed probe sets affected by LIPUS from three different experiments is shown.
Ijms 14 22721f3
Figure 4. A network of genes that were upregulated in the LIPUS-treated cells. Upregulated genes were analyzed by Ingenuity® Pathways Analysis tools. The gene network UP is shown. In the graphical representation of the networks, nodes refer to genes and edges refer to the biological relationships between nodes. The node color demonstrates the expression level of genes. Nodes and edges are displayed in various shapes and labels reflecting the functional class of each gene and the nature of the relationships involved, respectively. Genes that were mainly associated with bone morphology are highlighted in blue.
Ijms 14 22721f4
Figure 5. A gene network of genes that were downregulated in the LIPUS-treated cells. Downregulated genes were analyzed by Ingenuity® Pathways Analysis tools. The gene network DOWN is shown. For an explanation of the symbols and letters, see Figure 4.
Ijms 14 22721f5
Figure 6. Verification of upregulated genes as judged by microarray analysis using real-time quantitative PCR. After treatment of the cells with LIPUS at 30 mW/cm2 for 20 min, the cells were cultured for 6- and 24-h at 37 °C. Real-time quantitative PCR was carried out with specific primers for Ahr (A); Cd200 (B); Egr3 (C); Gas6 (D); Htra1 (E); Igf2 (F); Lum (G); Matn4 (H); Mylk (I); Nrep (J); Omd (K); Thbs1 (L); Tunc1 (M) and Znhit6 (N). Mock-treated cells served as a control (Ctr). Data indicate the means ± SD for four different experiments. * p < 0.05 vs. Ctr by Student’s t-test.
Ijms 14 22721f6aIjms 14 22721f6b
Figure 7. Verification of downregulated genes as judged by microarray analysis using real-time quantitative PCR. After treatment of the cells with LIPUS at 30 mW/cm2 for 20 min, the cells were cultured for 6- and 24-h at 37 °C. Real-time quantitative PCR was carried out with specific primers for Id1 (A); Id2 (B) and Id3 (C). Mock-treated cells served as a control (Ctr). Data indicate the means ± SD for four different experiments. * p < 0.05 vs. Ctr by Student’s t-test.
Ijms 14 22721f7
Figure 8. Illustration of the LIPUS apparatus.
Ijms 14 22721f8
Table 1. List of upregulated probe sets.
Probe set IDGene symbol6 h24 hGene title

MeanSDMeanSD
1417399_atGas61.040.131.530.05 *growth arrest specific 6
1454214_a_atZnhit61.110.02 *1.550.10 *zinc finger, HIT type 6
1423854_a_atRasl11b1.160.121.580.10 *RAS-like, family 11, member B
1425505_atMylk0.950.04 *1.580.05 *myosin, light polypeptide kinase
1455040_s_atNhsl20.900.211.590.13 *NHS-like 2
1456295_atB230114P17Rik1.240.101.630.06 *RIKEN cDNA B230114P17 gene
1417937_atDact11.010.081.670.11 *dapper homolog 1, antagonist of beta-catenin (Xenopus)
1421811_atThbs11.110.121.680.26 *thrombospondin 1
1426208_x_atPlagl11.740.061.710.02 *pleomorphic adenoma gene-like 1
1448171_atSiah21.010.761.710.18 *seven in absentia 2
1448788_atCd2001.240.081.720.11 *CD200 antigen
1433454_atAbtb21.290.121.730.12 *ankyrin repeat and BTB (POZ) domain containing 2
1441368_at-1.070.051.740.10 *-
1442157_at-1.140.06 *1.740.16 *-
1416225_atAdh11.200.201.750.25 *alcohol dehydrogenase 1 (class I)
1416505_atNr4a11.120.071.760.03 *nuclear receptor subfamily 4, group A, member 1
1418464_atMatn41.080.051.760.19 *matrilin 4
1422631_atAhr0.980.041.760.09 *aryl-hydrocarbon receptor
1423261_at1500015O10Rik1.000.151.780.27 *RIKEN cDNA 1500015O10 gene
1423607_atLum0.970.031.790.22 *lumican
1450839_atD0H4S1141.070.061.800.17 *DNA segment, human D4S114
1436329_atEgr31.020.121.810.23 *early growth response 3
1438870_atFbn11.110.111.820.30 *fibrillin 1
1447927_atGbp101.120.381.820.13 *guanylate-binding protein 10
1418252_atPadi21.080.151.860.23 *peptidyl arginine deiminase, type II
1418745_atOmd1.050.051.870.18 *osteomodulin
1438251_x_atHtra10.890.042.020.16 *HtrA serine peptidase 1
1448152_atIgf20.950.082.040.69insulin-like growth factor 2
1416749_atHtra11.000.142.060.06 *HtrA serine peptidase 1
1420448_atRhox2a1.200.412.080.66reproductive homeobox 2A
1427149_atPlekha60.870.332.100.77pleckstrin homology domain containing, family A member 6
1460049_s_at1500015O10Rik1.050.102.120.17 *RIKEN cDNA 1500015O10 gene
1427053_atAbi3bp1.160.232.190.84ABI gene family, member 3 (NESH) binding protein
1416371_atApod1.000.042.260.31 *apolipoprotein D
1443746_x_atDmp11.100.162.290.19 *dentin matrix protein 1
1426081_a_atDio21.030.172.380.55 *deiodinase, iodothyronine, type II
1427054_s_atAbi3bp1.010.112.380.32 *ABI gene family, member 3 (NESH) binding protein
1436996_x_atLyz10.860.512.410.76lysozyme 1
1448929_atF13a11.560.182.420.16 *coagulation factor XIII, A1 subunit
1443745_s_atDmp11.110.082.440.35 *dentin matrix protein 1
1426139_a_atCcrl11.090.042.470.94 *chemokine (C-C motif) receptor-like 1
1417256_atMmp130.830.132.650.46 *matrix metallopeptidase 13
1448326_a_atCrabp11.180.082.680.50 *cellular retinoic acid binding protein I
1418370_atTnnc10.920.092.820.08 *troponin C, cardiac/slow skeletal
1418937_atDio20.970.043.050.36 *deiodinase, iodothyronine, type II
1427338_atCrocc2.481.532.261.41ciliary rootlet coiled-coil, rootletin
The data are expressed as the means ± standard deviation (SD) (N = 3).
*p < 0.05 (Student’s t-test).
Table 2. List of downregulated probe sets.
Probe set IDGene symbol6 h24 hGene title

MeanSDMeanSD
1451780_atBlnk0.960.220.370.08 *B-cell linker
1422537_a_atId21.050.290.400.04 *inhibitor of DNA binding 2
1423935_x_atKrt140.960.060.430.01 *keratin 14
1425538_x_atCeacam11.050.390.450.07 *carcinoembryonic antigen-related cell adhesion molecule 1
1425789_s_atAnxa80.890.01 *0.460.04 *annexin A8
1448261_atCdh10.860.080.460.05 *cadherin 1
1460347_atKrt140.970.070.460.06 *keratin 14
1435176_a_atId20.910.170.470.11 *inhibitor of DNA binding 2
1460684_atTm7sf21.000.090.470.08 *transmembrane 7 superfamily member 2
1416630_atId30.940.040.480.07 *inhibitor of DNA binding 3
1418595_atPlin41.120.510.500.16 *perilipin 4
1460250_atSostdc11.020.050.500.08 *sclerostin domain containing 1
1425895_a_atId10.980.130.510.16 *inhibitor of DNA binding 1
1439382_x_atDdr10.960.200.510.21discoidin domain receptor family, member 1
1428738_a_atD14Ertd449e1.000.280.520.09 *DNA segment, Chr 14, ERATO Doi 449, expressed
1436520_atAhnak21.050.200.520.08 *AHNAK nucleoprotein 2
1452656_atZdhhc20.980.240.530.12 *zinc finger, DHHC domain containing 2
1424162_atTrim290.800.340.540.16 *tripartite motif-containing 29
1434046_atAA4671970.920.01 *0.540.05 *expressed sequence AA467197
1417732_atAnxa80.900.080.550.06 *annexin A8
1438152_at-1.350.570.550.13 *-
1449060_atKif2c0.820.080.550.10 *kinesin family member 2C
1454702_at4930503L19Rik0.870.05 *0.550.03 *RIKEN cDNA 4930503L19 gene
1426152_a_atKitl1.010.020.560.09 *kit ligand
1458236_at-1.060.050.560.05 *-
1415871_atTgfbi0.900.060.570.04 *transforming growth factor, beta induced
1427357_atCda0.940.130.570.05 *cytidine deaminase
1449340_atSostdc10.970.070.570.08 *sclerostin domain containing 1
1419489_atFam19a50.960.060.580.03 *family with sequence similarity 19, member A5
1422123_s_atCeacam10.870.260.580.06 *carcinoembryonic antigen-related cell adhesion molecule 1
1456412_a_atInpp5k0.710.210.580.04 *inositol polyphosphate 5-phosphatase K
1432202_a_atPoc1a0.780.140.580.08 *POC1 centriolar protein homolog A (Chlamydomonas)
1458385_atHspa4l0.950.060.580.04 *heat shock protein 4 like
1419073_atTmeff20.980.170.590.07 *transmembrane protein with EGF-like and two follistatin-like domains 2
1440924_atKif20b0.990.060.610.02 *kinesin family member 20B
1417751_atStk100.950.160.620.03 *serine/threonine kinase 10
1423627_atNqo11.020.020.620.05 *NAD(P)H dehydrogenase, quinone 1
1452654_atZdhhc20.980.120.620.06 *zinc finger, DHHC domain containing 2
1430193_atCasc50.850.100.620.03 *cancer susceptibility candidate 5
1430617_atOip50.920.120.620.04 *Opa interacting protein 5
1417823_atGcat0.860.140.630.03 *glycine C-acetyltransferase (2-amino-3-ketobutyrate-coenzyme A ligase)
1423569_atGatm1.080.040.640.02 *glycine amidinotransferase (l-arginine: glycine amidinotransferase)
1456250_x_atTgfbi0.940.030.640.02 *transforming growth factor, beta induced
1435554_atTmcc30.930.080.640.02 *transmembrane and coiled coil domains 3
1452968_atCthrc10.990.020.640.02 *collagen triple helix repeat containing 1
1436654_atGen11.000.130.650.01 *Gen homolog 1, endonuclease (Drosophila)
1456569_x_atGsn0.580.08*5.628.87gelsolin
1436622_atIqsec20.620.01*0.980.21IQ motif and Sec7 domain 2
The data are expressed as the means ± standard deviation (SD) (N = 3).
*p < 0.05 (Student’s t-test).

Acknowledgments

This study was supported in part by a Grant-in-Aid for Challenging Exploratory Research (23650303) from Japan Society for the Promotion of Science and by research grants from the University of Toyama.

Conflicts of Interest

The authors declare no conflict of interest.

References

  1. Riesz, P.; Kondo, T. Free radical formation induced by ultrasound and its biological implications. Free Radic. Biol. Med 1992, 13, 247–270. [Google Scholar]
  2. Feril, L.B., Jr.; Kondo, T. Biological effects of low intensity ultrasound: The mechanism involved, and its implications on therapy and on biosafety of ultrasound. J. Radiat. Res 2004, 45, 479–489. [Google Scholar]
  3. Pounder, N.M.; Harrison, A.J. Low intensity pulsed ultrasound for fracture healing: A review of the clinical evidence and the associated biological mechanism of action. Ultrasonics 2008, 48, 330–338. [Google Scholar]
  4. Martinez de Albornoz, P.; Khanna, A.; Longo, U.G.; Forriol, F.; Maffulli, N. The evidence of low-intensity pulsed ultrasound for in vitro, animal and human fracture healing. Br. Med. Bull 2011, 100, 39–57. [Google Scholar]
  5. Riboh, J.C.; Leversedge, F.J. The use of low-intensity pulsed ultrasound bone stimulators for fractures of the hand and upper extremity. J. Hand. Surg. Am 2012, 37, 1456–1461. [Google Scholar]
  6. Bashardoust Tajali, S.; Houghton, P.; MacDermid, J.C.; Grewal, R. Effects of low-intensity pulsed ultrasound therapy on fracture healing: A systematic review and meta-analysis. Am. J. Phys. Med. Rehabil 2012, 91, 349–367. [Google Scholar]
  7. Duarte, L.R. The stimulation of bone growth by ultrasound. Arch. Orthop. Trauma Surg 1983, 101, 153–159. [Google Scholar]
  8. Shimazaki, A.; Inui, K.; Azuma, Y.; Nishimura, N.; Yamano, Y. Low-intensity pulsed ultrasound accelerates bone maturation in distraction osteogenesis in rabbits. J. Bone Joint Surg. Br 2000, 82, 1077–1082. [Google Scholar]
  9. Azuma, Y.; Ito, M.; Harada, Y.; Takagi, H.; Ohta, T.; Jingushi, S. Low-intensity pulsed ultrasound accelerates rat femoral fracture healing by acting on the various cellular reactions in the fracture callus. J. Bone Miner. Res 2001, 16, 671–680. [Google Scholar]
  10. Machen, M.S.; Tis, J.E.; Inoue, N.; Meffert, R.H.; Chao, E.Y.; McHale, K.A. The effect of low intensity pulsed ultrasound on regenerate bone in a less-than-rigid biomechanical environment. Biomed. Mater. Eng 2002, 12, 239–247. [Google Scholar]
  11. Uglow, M.G.; Peat, R.A.; Hile, M.S.; Bilston, L.E.; Smith, E.J.; Little, D.G. Low-intensity ultrasound stimulation in distraction osteogenesis in rabbits. Clin. Orthop. Relat. Res 2003, 303–312. [Google Scholar]
  12. Qin, L.; Fok, P.; Lu, H.; Shi, S.; Leng, Y.; Leung, K. Low intensity pulsed ultrasound increases the matrix hardness of the healing tissues at bone-tendon insertion-a partial patellectomy model in rabbits. Clin. Biomech 2006, 21, 387–394. [Google Scholar]
  13. Lu, H.; Qin, L.; Fok, P.; Cheung, W.; Lee, K.; Guo, X.; Wong, W.; Leung, K. Low-intensity pulsed ultrasound accelerates bone-tendon junction healing: A partial patellectomy model in rabbits. Am. J. Sports Med 2006, 34, 1287–1296. [Google Scholar]
  14. Iwai, T.; Harada, Y.; Imura, K.; Iwabuchi, S.; Murai, J.; Hiramatsu, K.; Myoui, A.; Yoshikawa, H.; Tsumaki, N. Low-intensity pulsed ultrasound increases bone ingrowth into porous hydroxyapatite ceramic. J. Bone Miner. Metab 2007, 25, 392–399. [Google Scholar]
  15. Walsh, W.R.; Langdown, A.J.; Auld, J.W.; Stephens, P.; Yu, Y.; Vizesi, F.; Bruce, W.J.; Pounder, N. Effect of low intensity pulsed ultrasound on healing of an ulna defect filled with a bone graft substitute. J. Biomed. Mater. Res. B 2008, 86, 74–81. [Google Scholar]
  16. Lu, C.C.; Liu, Y.C.; Cheng, Y.M.; Chih, T.T.; Tien, Y.C. Augmentation of tendon-bone interface healing with low-intensity pulsed ultrasound. Orthopedics 2009, 32, 173. [Google Scholar]
  17. Shakouri, K.; Eftekharsadat, B.; Oskuie, M.R.; Soleimanpour, J.; Tarzamni, M.K.; Salekzamani, Y.; Hoshyar, Y.; Nezami, N. Effect of low-intensity pulsed ultrasound on fracture callus mineral density and flexural strength in rabbit tibial fresh fracture. J. Orthop. Sci 2010, 15, 240–244. [Google Scholar]
  18. Xie, L.K.; Wangrangsimakul, K.; Suttapreyasri, S.; Cheung, L.K.; Nuntanaranont, T. A preliminary study of the effect of low intensity pulsed ultrasound on new bone formation during mandibular distraction osteogenesis in rabbits. Int. J. Oral Maxillofac. Surg 2011, 40, 730–736. [Google Scholar]
  19. Hantes, M.E.; Mavrodontidis, A.N.; Zalavras, C.G.; Karantanas, A.H.; Karachalios, T.; Malizos, K.N. Low-intensity transosseous ultrasound accelerates osteotomy healing in a sheep fracture model. J. Bone Joint Surg. Am 2004, 86-A, 2275–2282. [Google Scholar]
  20. Walsh, W.R.; Stephens, P.; Vizesi, F.; Bruce, W.; Huckle, J.; Yu, Y. Effects of low-intensity pulsed ultrasound on tendon-bone healing in an intra-articular sheep knee model. Arthroscopy 2007, 23, 197–204. [Google Scholar]
  21. Lovric, V.; Ledger, M.; Goldberg, J.; Harper, W.; Bertollo, N.; Pelletier, M.H.; Oliver, R.A.; Yu, Y.; Walsh, W.R. The effects of low-intensity pulsed ultrasound on tendon-bone healing in a transosseous-equivalent sheep rotator cuff model. Knee Surg. Sports Traumatol. Arthrosc 2013, 21, 466–475. [Google Scholar]
  22. Heckman, J.D.; Ryaby, J.P.; McCabe, J.; Frey, J.J.; Kilcoyne, R.F. Acceleration of tibial fracture-healing by non-invasive, low-intensity pulsed ultrasound. J. Bone Joint Surg. Am 1994, 76, 26–34. [Google Scholar]
  23. Kristiansen, T.K.; Ryaby, J.P.; McCabe, J.; Frey, J.J.; Roe, L.R. Accelerated healing of distal radial fractures with the use of specific, low-intensity ultrasound. A multicenter, prospective, randomized, double-blind, placebo-controlled study. J. Bone Joint Surg. Am 1997, 79, 961–973. [Google Scholar]
  24. Naruse, K.; Miyauchi, A.; Itoman, M.; Mikuni-Takagaki, Y. Distinct anabolic response of osteoblast to low-intensity pulsed ultrasound. J. Bone Miner. Res 2003, 18, 360–369. [Google Scholar]
  25. Bandow, K.; Nishikawa, Y.; Ohnishi, T.; Kakimoto, K.; Soejima, K.; Iwabuchi, S.; Kuroe, K.; Matsuguchi, T. Low-intensity pulsed ultrasound (LIPUS) induces RANKL, MCP-1, and MIP-1beta expression in osteoblasts through the angiotensin II type 1 receptor. J. Cell. Physiol 2007, 211, 392–398. [Google Scholar]
  26. Takayama, T.; Suzuki, N.; Ikeda, K.; Shimada, T.; Suzuki, A.; Maeno, M.; Otsuka, K.; Ito, K. Low-intensity pulsed ultrasound stimulates osteogenic differentiation in ROS 17/2.8 cells. Life Sci 2007, 80, 965–971. [Google Scholar]
  27. Unsworth, J.; Kaneez, S.; Harris, S.; Ridgway, J.; Fenwick, S.; Chenery, D.; Harrison, A. Pulsed low intensity ultrasound enhances mineralisation in preosteoblast cells. Ultrasound Med. Biol 2007, 33, 1468–1474. [Google Scholar]
  28. Leskinen, J.J.; Karjalainen, H.M.; Olkku, A.; Hynynen, K.; Mahonen, A.; Lammi, M.J. Genome-wide microarray analysis of MG-63 osteoblastic cells exposed to ultrasound. Biorheology 2008, 45, 345–354. [Google Scholar]
  29. Lu, H.; Qin, L.; Lee, K.; Cheung, W.; Chan, K.; Leung, K. Identification of genes responsive to low-intensity pulsed ultrasound stimulations. Biochem. Biophys. Res. Commun 2009, 378, 569–573. [Google Scholar]
  30. Watabe, H.; Furuhama, T.; Tani-Ishii, N.; Mikuni-Takagaki, Y. Mechanotransduction activates α5β1 integrin and PI3K/Akt signaling pathways in mandibular osteoblasts. Exp. Cell Res 2011, 317, 2642–2649. [Google Scholar]
  31. Kitamura, K.; Suzuki, N.; Sato, Y.; Nemoto, T.; Ikegame, M.; Shimizu, N.; Kondo, T.; Furusawa, Y.; Wada, S.; Hattori, A. Osteoblast activity in the goldfish scale responds sensitively to mechanical stress. Comp. Biochem. Physiol. A 2010, 156, 357–363. [Google Scholar]
  32. Naruse, K.; Mikuni-Takagaki, Y.; Azuma, Y.; Ito, M.; Oota, T.; Kameyama, K.; Itoman, M. Anabolic response of mouse bone-marrow-derived stromal cell clone ST2 cells to low-intensity pulsed ultrasound. Biochem. Biophys. Res. Commun 2000, 268, 216–220. [Google Scholar]
  33. Sena, K.; Angle, S.R.; Kanaji, A.; Aher, C.; Karwo, D.G.; Sumner, D.R.; Virdi, A.S. Low-intensity pulsed ultrasound (LIPUS) and cell-to-cell communication in bone marrow stromal cells. Ultrasonics 2011, 51, 639–644. [Google Scholar]
  34. Mukai, S.; Ito, H.; Nakagawa, Y.; Akiyama, H.; Miyamoto, M.; Nakamura, T. Transforming growth factor-beta1 mediates the effects of low-intensity pulsed ultrasound in chondrocytes. Ultrasound Med. Biol 2005, 31, 1713–1721. [Google Scholar]
  35. Takeuchi, R.; Ryo, A.; Komitsu, N.; Mikuni-Takagaki, Y.; Fukui, A.; Takagi, Y.; Shiraishi, T.; Morishita, S.; Yamazaki, Y.; Kumagai, K.; et al. Low-intensity pulsed ultrasound activates the phosphatidylinositol 3 kinase/Akt pathway and stimulates the growth of chondrocytes in three-dimensional cultures: a basic science study. Arthritis Res. Ther 2008, 10, R77. [Google Scholar]
  36. Zhou, S.; Schmelz, A.; Seufferlein, T.; Li, Y.; Zhao, J.; Bachem, M.G. Molecular mechanisms of low intensity pulsed ultrasound in human skin fibroblasts. J. Biol. Chem 2004, 279, 54463–54469. [Google Scholar]
  37. Kobayashi, Y.; Sakai, D.; Iwashina, T.; Iwabuchi, S.; Mochida, J. Low-intensity pulsed ultrasound stimulates cell proliferation, proteoglycan synthesis and expression of growth factor-related genes in human nucleus pulposus cell line. Eur. Cell Mater 2009, 17, 15–22. [Google Scholar]
  38. Li, L.; Yang, Z.; Zhang, H.; Chen, W.; Chen, M.; Zhu, Z. Low-intensity pulsed ultrasound regulates proliferation and differentiation of osteoblasts through osteocytes. Biochem. Biophys. Res. Commun 2012, 418, 296–300. [Google Scholar]
  39. Tabuchi, Y.; Takasaki, I.; Zhao, Q.L.; Wada, S.; Hori, T.; Feril, L.B., Jr.; Tachibana, K.; Nomura, T.; Kondo, T. Genetic networks responsive to low-intensity pulsed ultrasound in human lymphoma U937 cells. Cancer Lett 2008, 270, 286–294. [Google Scholar]
  40. Ahmed, K.; Furusawa, Y.; Tabuchi, Y.; Emam, H.F.; Piao, J.L.; Hassan, M.A.; Yamamoto, T.; Kondo, T.; Kadowaki, M. Chemical inducers of heat shock proteins derived from medicinal plants and cytoprotective genes response. Int. J. Hyperthermia 2012, 28, 1–8. [Google Scholar]
  41. Tabuchi, Y.; Wada, S.; Furusawa, Y.; Ohtsuka, K.; Kondo, T. Gene networks related to the cell death elicited by hyperthermia in human oral squamous cell carcinoma HSC-3 cells. Int. J. Mol. Med 2012, 29, 380–386. [Google Scholar]
  42. Ito, A.; Aoyama, T.; Yamaguchi, S.; Zhang, X.; Akiyama, H.; Kuroki, H. Low-intensity pulsed ultrasound inhibits messenger RNA expression of matrix metalloproteinase-13 induced by interleukin-1β in chondrocytes in an intensity-dependent manner. Ultrasound Med. Biol 2012, 38, 1726–1733. [Google Scholar]
  43. Al-Daghreer, S.; Doschak, M.; Sloan, A.J.; Major, P.W.; Heo, G.; Scurtescu, C.; Tsui, Y.Y.; El-Bialy, T. Long term effect of low intensity pulsed ultrasound on a human tooth slice organ culture. Arch. Oral Biol 2012, 57, 760–768. [Google Scholar]
  44. Feng, J.Q.; Scott, G.; Guo, D.; Jiang, B.; Harris, M.; Ward, T.; Ray, M.; Bonewald, L.F.; Harris, S.E.; Mishina, Y. Generation of a conditional null allele for Dmp1 in mouse. Genesis 2008, 46, 87–91. [Google Scholar]
  45. Carta, L.; Pereira, L.; Arteaga-Solis, E.; Lee-Arteaga, S.Y.; Lenart, B.; Starcher, B.; Merkel, C.A.; Sukoyan, M.; Kerkis, A.; Hazeki, N.; et al. Fibrillins 1 and 2 perform partially overlapping functions during aortic development. J. Biol. Chem 2006, 281, 8016–8023. [Google Scholar]
  46. Eggenschwiler, J.; Ludwig, T.; Fisher, P.; Leighton, P.A.; Tilghman, S.M.; Efstratiadis, A. Mouse mutant embryos overexpressing IGF-II exhibit phenotypic features of the Beckwith-Wiedemann and Simpson-Golabi-Behmel syndromes. Genes Dev 1997, 11, 3128–3142. [Google Scholar]
  47. Jepsen, K.J.; Wu, F.; Peragallo, J.H.; Paul, J.; Roberts, L.; Ezura, Y.; Oldberg, A.; Birk, D.E.; Chakravarti, S. A syndrome of joint laxity and impaired tendon integrity in lumican- and fibromodulin-deficient mice. J. Biol. Chem 2002, 277, 35532–35540. [Google Scholar]
  48. Stickens, D.; Behonick, D.J.; Ortega, N.; Heyer, B.; Hartenstein, B.; Yu, Y.; Fosang, A.J.; Schorpp-Kistner, M.; Angel, P.; Werb, Z. Altered endochondral bone development in matrix metalloproteinase 13-deficient mice. Development 2004, 131, 5883–5895. [Google Scholar]
  49. Crawford, S.E.; Stellmach, V.; Murphy-Ullrich, J.E.; Ribeiro, S.M.; Lawler, J.; Hynes, R.O.; Boivin, G.P.; Bouck, N. Thrombospondin-1 is a major activator of TGF-beta1 in vivo. Cell 1998, 93, 1159–1170. [Google Scholar]
  50. Kalajzic, I.; Staal, A.; Yang, W.P.; Wu, Y.; Johnson, S.E.; Feyen, J.H.; Krueger, W.; Maye, P.; Yu, F.; Zhao, Y.; et al. Expression profile of osteoblast lineage at defined stages of differentiation. J. Biol. Chem 2005, 280, 24618–24626. [Google Scholar]
  51. Cui, W.; Cuartas, E.; Ke, J.; Zhang, Q.; Einarsson, H.B.; Sedgwick, J.D.; Li, J.; Vignery, A. CD200 and its receptor, CD200R, modulate bone mass via the differentiation of osteoclasts. Proc. Natl. Acad. Sci. USA 2007, 104, 14436–14441. [Google Scholar]
  52. Eapen, A.; Ramachandran, A.; Pratap, J.; George, A. Activation of the ERK1/2 mitogen-activated protein kinase cascade by dentin matrix protein 1 promotes osteoblast differentiation. Cells Tissues Organs 2011, 194, 255–260. [Google Scholar]
  53. Miyazono, K.; Miyazawa, K. Id: A target of BMP signaling. Sci. STKE 2002, 2002, pe40. [Google Scholar]
  54. Peng, Y.; Kang, Q.; Luo, Q.; Jiang, W.; Si, W.; Liu, B.A.; Luu, H.H.; Park, J.K.; Li, X.; Luo, J.; et al. Inhibitor of DNA binding/differentiation helix-loop-helix proteins mediate bone morphogenetic protein-induced osteoblast differentiation of mesenchymal stem cells. J. Biol. Chem 2004, 279, 32941–32949. [Google Scholar]

